Attached files
| file | filename |
|---|---|
| 8-K - FORM 8-K - DITECH HOLDING Corp | d434845d8k.htm |
| EX-99.1 - EX-99.1 - DITECH HOLDING Corp | d434845dex991.htm |
Exhibit 99.2

| Third Quarter 2012 Earnings Presentation November 8, 2012 |

| Legal Disclaimers Disclaimer and Cautionary Note Regarding Forward-Looking Statements This press release contains forward-looking statements, including forward-looking statements within the meaning of the Private Securities Litigation Reform Act of 1995. Such forward-looking statements include, but are not limited to, statements concerning Walter Investment's plans, beliefs, objectives, expectations and intentions and other statements that are not historical or current facts. Forward-looking statements are based on Walter Investment's current expectations and involve risks and uncertainties that could cause actual results to differ materially from those expressed or implied in such forward-looking statements. Factors that could cause Walter Investment's results to differ materially from current expectations include, but are not limited to: Walter Investment's ability to implement its strategic initiatives, particularly as they relate to our ability to develop new business, including the implementation of delinquency flow programs and the receipt of new business, which are both subject to customer demand and approval, and the availability of MSRs at acceptable prices, along with the availability of capital to purchase MSRs; the Company's ability to earn anticipated levels of performance and incentive fees on serviced business; continued performance of the loans and residuals segment; economic, political and market conditions and fluctuations, government and industry regulation, including any new regulation, increased costs, and/or decrease in revenues that may result from increased scrutiny by government regulators and customers on lender-placed insurance; interest rate risk and U.S. competition; and other factors detailed in Walter Investment's 2011 Annual Report on Form 10-K and other periodic reports filed with the U.S. Securities and Exchange Commission. In addition, these statements are based on a number of assumptions that are subject to change. Accordingly, actual results may be materially higher or lower than those projected. The inclusion of such projections herein should not be regarded as a representation by Walter Investment that the projections will prove to be correct. This press release speaks only as of this date. Walter Investment disclaims any duty to update the information herein. Non-GAAP Financial Measures To supplement Walter Investment's consolidated financial statements prepared in accordance with GAAP and to better reflect period-over-period comparisons, Walter Investment uses non-GAAP financial measures of performance, financial position, or cash flows that either exclude or include amounts that are not normally excluded or included in the most directly comparable measure, calculated and presented in accordance with GAAP. Non-GAAP financial measures do not replace and are not superior to the presentation of GAAP financial results, but are provided to (i) measure the Company's financial performance excluding depreciation and amortization costs, corporate and MSR facility interest expense, transaction and merger integration-related costs, certain other non-cash adjustments, the net impact of the consolidated Non-Residual Trust VIEs and certain other items as defined by our first and second lien credit agreements, including, but not limited to pro-forma synergies, (ii) provide investors a means of evaluating our core operating performance and (iii) improve overall understanding of Walter Investment's current financial performance and its prospects for the future. Specifically, Walter Investment believes the non-GAAP financial results provide useful information to both management and investors regarding certain additional financial and business trends relating to financial condition and operating results. In addition, management uses these measures for reviewing financial results and evaluating financial performance. The non-GAAP adjustments for all periods presented are based upon information and assumptions available as of the date of this presentation. 1 |
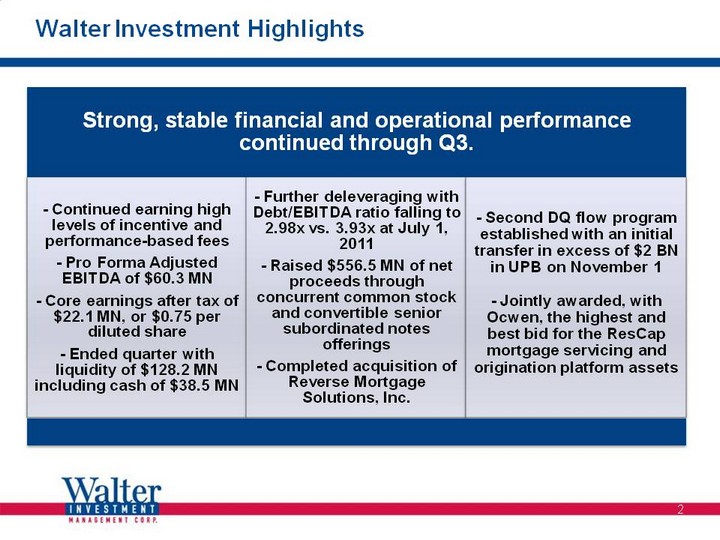
| Walter Investment Highlights Walter Investment Highlights 2 |

| 3 Q3 2012 Financial Results Pro Forma Adjusted EBITDA of $60.3 MN for Q3 YTD Pro Forma Adjusted EBITDA of $177.6 MN (annualized = $236.8 MN) Core earnings after tax of $22.1 MN, or $0.75 per diluted share GAAP net income of $6.4 MN, or $0.21 per diluted share Total revenues of $160.8 MN, $8.9 MN higher than Q3 2011 Strong level of incentive and performance fees of $25.3 MN, $1.2 MN higher than Q3 2011 Solid financial performance through third quarter in-line with expectations. |

| Q3 2012 Segment Highlights 4 Loans and Residuals Segment Highlights Pre-tax core earnings of $4.4 MN Generated interest income of $38.0 MN Levels of REO inventory declined compared to prior year period Servicing Segment Highlights Pre-tax core earnings of $36.7 MN Strong portfolio performance generated solid incentive and performance fees Second DQ flow program came on line Asset Receivable Management (ARM) Segment Highlights Pre-tax core earnings of $4.2 MN compared to $2.7 MN in Q3 2011 reflects improved rate of collections and higher margins Increase of $2.6 MN in revenue from Q3 2011 due to $9.0 MN higher gross collections on serviced portfolio and higher recovery fee Insurance Segment Highlights Pre-tax core earnings of $9.9 MN Revenue declined $1.9 MN compared to Q3 2011as a result of runoff in the legacy Walter reinsurance business and fewer set-ups of lender placed policies on the MH portfolio, offset by additional lender placed policies written on the 1st lien RRE portfolio |

| Capitalization Summary as of September 30, 2012 5 Corporate debt ratings were affirmed by Moody's and S&P during Q3 2012 (1) Unpaid principal balance of total corporate debt. |

| Pro Forma Capitalization 6 Capitalization pro forma for recently completed common stock and convertible notes offerings, RMS acquisition and First Lien Term Loan refinancing * 9//30/2012 RMS amounts are unaudited estimates presented for illustrative purposes only |

| Pipeline(1) Opportunity is Accelerating 7 Walter Investment's pipeline has grown by 67% since June 30, 2012 Active pipeline of over $500 BN is a mix of MSR and Sub-Servicing opportunities from Banks, Financial Institutions and GSEs Expected to transact in next 12-18 months Current Active Pipeline Market opportunities are increasing and accelerating in a dynamic environment $500 billion Over $110 billion of active pipeline is in exclusive negotiation (1) "Pipeline" refers to opportunities or potential opportunities in the market for products within our strategic profile that we have identified as targets to add to our servicing portfolio through either the acquisition of MSR or sub-servicing contracts. In each case we have contacted the seller or its representative to register our interest, or are currently engaged in discussions or negotiations directly with the seller or its representative. The status of "pipeline opportunities" varies from early stage contact through exclusive negotiations. There can be no guarantee that any of the opportunities in our pipeline will result in purchases or contracts added by the Company. ResCap $50+ BN Sub-Servicing $40+ BN Other ~$20 BN Exclusive Negotiations |

| ResCap Transaction On October 24, 2012 jointly awarded highest and best bid, with Ocwen, for the mortgage servicing and origination and capital markets platform assets(1). WAC portion is a $540.0(2) MN bid for FNMA MSR portfolio, related servicing advances and Origination and Capital Markets platforms Transaction is expected to close in Q1 2013 The acquisition, which is subject to U.S. Bankruptcy Court approval and the satisfaction of customary conditions to close, is expected to close in the first quarter of 2013. Final purchase price is subject to downward adjustment to reflect an expected decline in the amount of MSR's and related advances to be acquired between the bid date and the closing date. 8 |

| 2012 Pro Forma Adjusted EBITDA 9 $211 MN $225-$240 MN Strong results through Q3 plus business development opportunities drive confidence in ability to achieve mid-point or higher in range. |

| Summary 10 Strong balance sheet positioned for accelerating opportunities Strong margins across business lines Strong YTD 2012 results Solid Financial Fundamentals Secular shift drives sustainability in the business Wave of transfers to specialty servicers occurring from $10+ trillion market (1) Regulatory, capital, operational, and compliance issues are a catalyst for servicing transfers Cyclical and Secular Industry Shift Robust pipeline growth from $300 billion in Q2 to $500 billion in Q3 Transactions / opportunities accelerating from first half of 2012 Exclusivity on over $110 billion of pipeline opportunities Second delinquency flow program established with loan transfer on Nov. 1, 2012 Strong Pipeline Platform positioned to deliver value-added benefits to credit owners Ancillary businesses (ARM, Insurance) deliver additional value and drive increased revenue High level of compliance drives preferred partner status Differentiated Servicing Model (1) Source: Inside Mortgage Finance. WAC is highly focused on delivering significant returns to shareholders |

| Appendix |

| 12 Use of Non-GAAP Measures Generally Accepted Accounting Principles ("GAAP") is the term used to refer to the standard framework of guidelines for financial accounting. GAAP includes the standards, conventions, and rules accountants follow in recording and summarizing transactions and in the preparation of financial statements. In addition to reporting financial results in accordance with GAAP, the Company has provided non-GAAP financial measures, which it believes are useful to help investors better understand its financial performance, competitive position and prospects for the future. Core earnings (pre-tax and after-tax) ,core earnings per share and Pro Forma Adjusted EBITDA are financial measures that are not in accordance with GAAP. See the Non-GAAP Reconciliations above for a reconciliation of these measures to the most directly comparable GAAP financial measures. Core earnings (pre-tax and after-tax) and core earnings per share measure the Company's financial performance excluding depreciation and amortization costs related to business combination transactions, transaction and merger integration-related costs, certain other non-cash adjustments, and the net impact of the consolidated Non-Residual Trust VIEs. Pro Forma adjusted EBITDA measures the Company's financial performance excluding depreciation and amortization costs, corporate and MSR facility interest expense, transaction and merger integration-related costs, certain other non-cash adjustments, the net impact of the consolidated Non-Residual Trust VIEs and certain other items as defined by our first and second lien credit agreements, including, but not limited to pro-forma synergies. Core earnings (pre-tax and after-tax) and core earnings per share may also include other adjustments, as applicable based upon facts and circumstances, consistent with the intent of providing investors a means of evaluating our core operating performance. The Company believes that these Non-GAAP Financial Measures can be useful to investors because they provide a means by which investors can evaluate the Company's underlying key drivers and operating performance of the business, exclusive of certain adjustments and activities that investors may consider to be unrelated to the underlying economic performance of the business for a given period. Use of Core Earnings and Pro Forma Adjusted EBITDA by Management The Company manages the business based upon the achievement of core earnings, Pro Forma Adjusted EBITDA and similar targets and has designed certain management incentives based upon the achievement of Pro Forma Adjusted EBITDA in order to assess the underlying operational performance of the continuing operations of the business for the year and to have a basis to compare underlying operating results to prior and future periods. Limitations on the Use of Core Earnings and Pro Forma Adjusted EBITDA Since core earnings (pre-tax and after-tax) and core earnings per share measure the Company's financial performance excluding depreciation and amortization costs related to acquisitions, transaction and merger integration-related costs, certain other non-cash adjustments, and the net impact of the consolidated Non-Residual Trust VIEs, they may not reflect all amounts associated with our results as determined in accordance with GAAP. Pro Forma Adjusted EBITDA measures the Company's financial performance excluding depreciation and amortization costs, corporate and MSR facility interest expense, transaction and merger integration-related costs, certain other non-cash adjustments, the net impact of the consolidated Non-Residual Trust VIEs and certain other items as defined by our first and second lien credit agreements, including, but not limited to pro-forma synergies, they may not reflect all amounts associated with our results as determined in accordance with GAAP Core earnings (pre-tax and after-tax), core earnings per share and Pro Forma Adjusted EBITDA involve differences from segment profit (loss), income (loss) before income taxes, net income (loss), basic earnings (loss) per share and diluted earnings (loss) per share computed in accordance with GAAP. Core earnings (pre-tax and after-tax) ,core earnings per share and Pro Forma Adjusted EBITDA should be considered as supplementary to, and not as a substitute for, segment profit (loss), income (loss) before income taxes, net income (loss), basic earnings (loss) per share and diluted earnings (loss) per share computed in accordance with GAAP as a measure of the Company's financial performance. Any non-GAAP measures should be considered in context with the GAAP financial presentation and should not be considered in isolation or as a substitute for GAAP earnings. Further, the non-GAAP measures presented by Walter Investment may be defined or calculated differently from similarly titled measures of other companies. . . |

| 13 Q3 2012 Segment Financial Performance ($ in millions) Servicing Asset Receivables Management Insurance Loans and Residuals Other Eliminations Total Consolidated Total revenues $96.9 $9.8 $17.4 $38.0 $3.9 $(5.2) $160.8 Total expenses $78.5 $7.8 $9.4 $34.0 $28.9 $(5.2) $153.3 Other gains (losses) $(0.3) $ - $ - $0.5 $2.9 $ - $3.1 Income (loss) before income taxes $18.1 $2.0 $8.1 $4.5 $(22.1) $ - $10.6 Core earnings before income taxes $36.7 $4.2 $9.9 $4.4 $(19.6) $ - $35.6 Pro Forma Adjusted EBITDA $41.3 $4.2 $9.8 $4.6 $0.4 $ - $60.3 Note: Columns may not total due to rounding. |

| Core Earnings and Pro Forma Adjusted EBITDA 14 Pro Forma Adjusted EBITDA is presented in accordance with its definition in the Company's credit agreements and represents income before income taxes, depreciation and amortization, interest expense on corporate debt, transaction and integration related costs, the net effect of the non-residual VIEs and certain other non-cash income and expense items. Pro Forma Adjusted EBITDA also includes an adjustment to reflect pro-forma synergies and, for periods prior to the acquisition, adjustments to reflect Green Tree as having been acquired at the beginning of the year. ($ in millions, except per share amounts) |

| Pro Forma Adjusted EBITDA 15 Pro Forma Adjusted EBITDA is presented in accordance with its definition in the Company's credit agreements and represents income before income taxes, depreciation and amortization, interest expense on corporate debt, transaction and integration related costs, the net effect of the non-residual VIEs and certain other non-cash income and expense items. Pro Forma Adjusted EBITDA also includes an adjustment to reflect pro-forma synergies and, for periods prior to the acquisition, adjustments to reflect Green Tree as having been acquired at the beginning of the year. Includes adjustment to reflect Green Tree results on a pro forma basis for the full year. |