Attached files
| file | filename |
|---|---|
| 8-K - FORM 8-K - HD SUPPLY, INC. | d435641d8k.htm |
 A
Portfolio of Best-in-Class A Portfolio of Best-in-Class
Industrial Distributors
Industrial Distributors
6
November,
2012
Exhibit 99.1
th |
 2
Disclaimer
This presentation includes forward-looking information. Forward-looking
statements are subject to known and unknown risks and uncertainties, many of
which may be beyond our control. We caution you that the forward-looking information presented
in this presentation is not a guarantee of future performance and that our actual
results of operations, financial condition and liquidity, and the development
of the industries in which we operate may differ materially from those made in or suggested by
the forward-looking information contained in this presentation. A number
of important factors could cause actual results to
differ materially from those contained in or implied by the forward-looking
statements, including those factors discussed in our annual report on Form
10K filed March 23, 2012 and subsequent filings with the SEC. Any forward-looking information
presented herein is made only as of the date of this presentation, and we do not
undertake any obligation to update or revise any forward-looking
information to reflect changes in assumptions, the occurrence of unanticipated events, changes in future
operating results over time or otherwise. Comparisons of results
for current and any prior periods are not intended to express
any future trends or indications of future performance, unless expressed as such,
and should only be viewed as historical data.
In addition to disclosing financial results that are determined in accordance with
U.S. generally accepted accounting principles (“GAAP”), the Company
also disclosed in this presentation certain non-GAAP financial information including Adjusted
EBITDA. These financial measures are not recognized measures under GAAP, and
are not intended to be and should not be considered in isolation or as a
substitute for, or superior to, the financial information prepared and presented in accordance
with GAAP. |
 3
Agenda
2.
Market Opportunity
3.
Differentiated Growth
4.
Financial Performance
5.
Key Messages
1.
1.
HD
HD
Supply
Supply
Overview
Overview |
 4
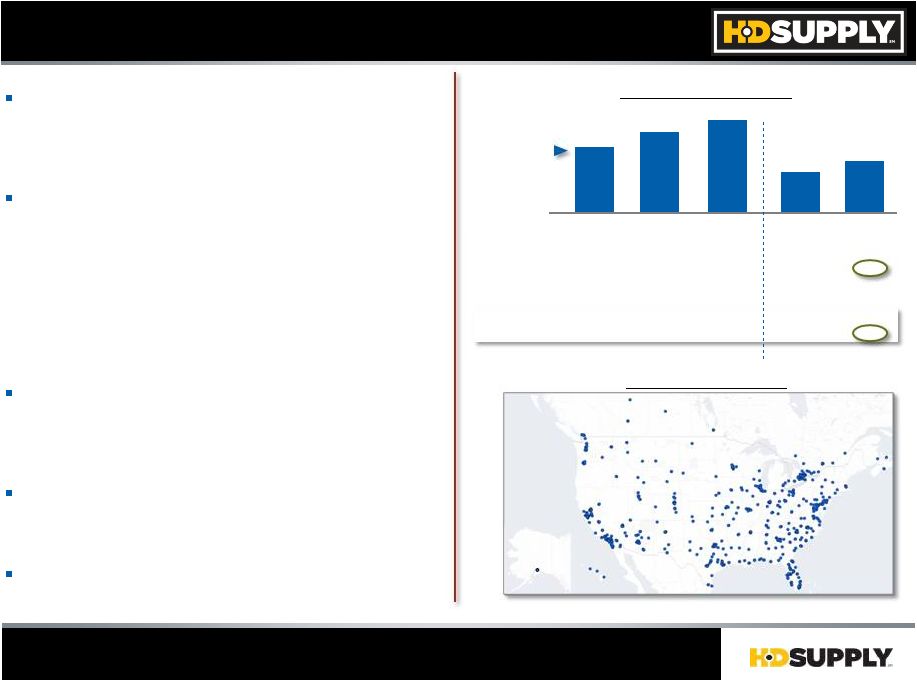
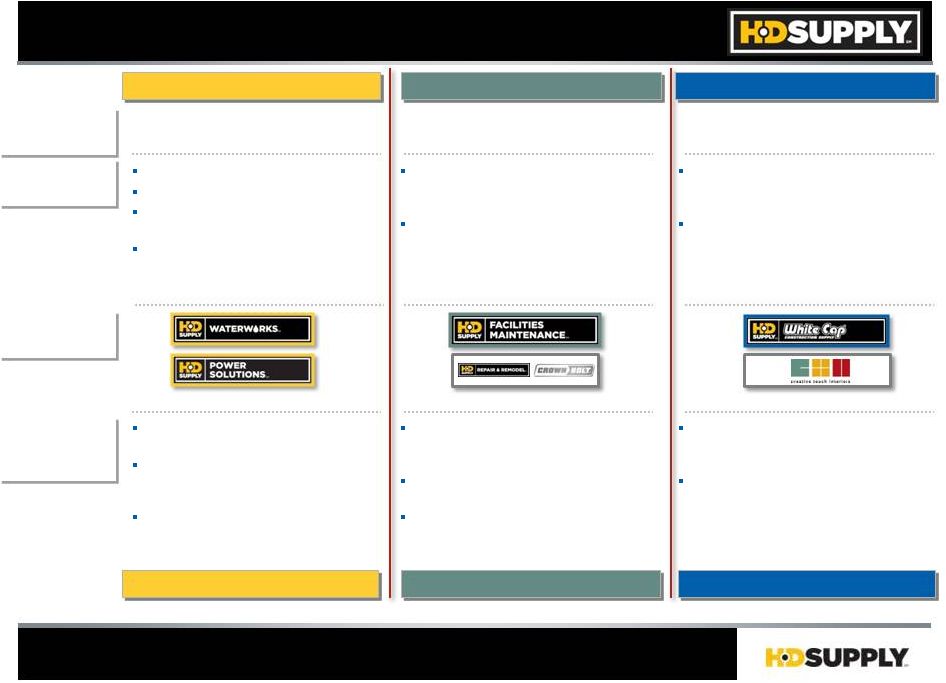
Portfolio of Best-in-Class Industrial Distributors
At a Glance
A Portfolio of Best-in-Class
Industrial Distributors
Serving the Large and Highly
Fragmented
U.S.
and
Canadian
Infrastructure,
MRO
and
Construction
Sectors
Diverse
Portfolio
of Distribution Businesses that
Provide
Approximately
1
Million
SKUs
to
440,000
Professional
Customers,
Including
Contractors,
Government Entities, Maintenance
Professionals,
Home
Builders
and
Industrial
Businesses
–
Operate Approximately 630 Locations Across 46 U.S.
States and 9 Canadian Provinces
Broad Diversity in Product Portfolio, Customer
Base and Vendor Relationships Reduces the
Company’s
Exposure
to
Any
Single
Segment,
Product or Customer
Size, Scale
and National Presence Drive
Competitive Advantage in Large, Fragmented
Markets
Talent with Deep, Relevant Experience;
Pervasive Training
Financial Summary
Financial Summary
Gross Profit
GM %
Adj. EBITDA %
Cash Flow
Sales % VPY
’10A
’11A
$411M
$508M
$1.8B
$2.0B
$0.7B
$0.1B
28.5%
28.7%
2%
9%
6.4%
7.2%
Adj. EBITDA
YTD
Q2’11
YTD
Q2’12
Q2’12
LTM
$582M
$2.1B
$0.2B
28.7%
12%
7.8%
$251M
$325M
$1.0B
($0.1B)
28.5%
7.2%
$1.1B
($0.0B)
28.7%
8.3%
6%
Adj. EBITDA Growth
20%
24%
27%
24%
Sales
$6.4B
$7.0B
$7.4B
$3.5B
$3.9B
National Footprint
National Footprint
Note: HD Supply Operates a Sourcing Office in China
1
See pg. 89 of 10-K Filed March 23, 2012 and pg. 21 of 10-Q Filed
September 4, 2012 for a Discussion of Adj. EBITDA and Reconciliation to Income (Loss) From Continuing Operations
29%
12%
1 |
 5
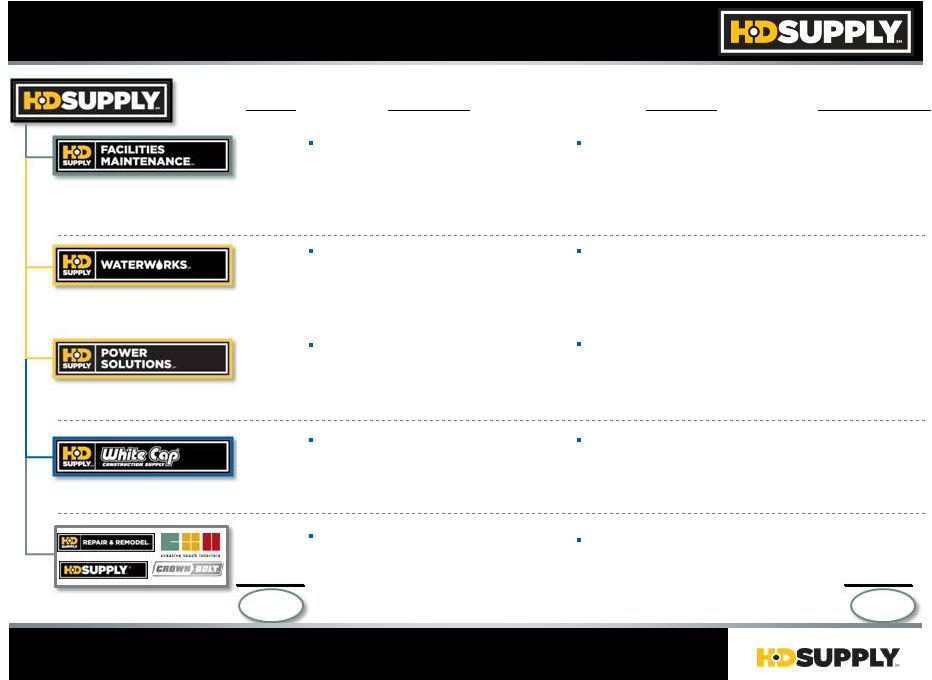
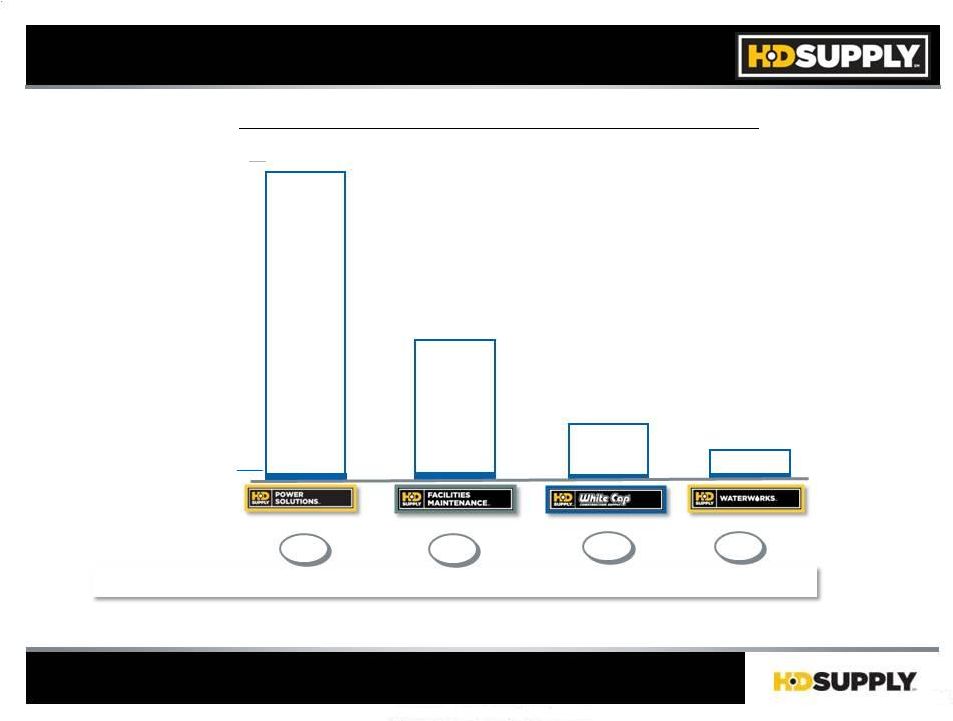
At a Glance
Sales
Products
(’11A)
$1.9B
$1.8B
$1.6B
$0.8B
$1.0B
Market Size
($ in Billions)
$48B
$10B
$110B
$19B
~$190B
Markets
Apartments, Hotels
and Motels,
Assisted
and Independent
Living,
Skilled
Nursing
Facilities,
Government
Housing and Education
Maintenance, Repair and
Improvement
Municipal, Residential, and Non-
Residential Construction
$5B+
Non-Residential Construction,
Electrical Consumption, and
Residential Construction
Non-Residential and Residential
Construction
Repair and Remodel, Residential
Construction, and Non-Residential
Construction
“Maintenance, Repair and
Improvement”
“Infrastructure”
“Specialty Construction”
1
Per Leading Global Consultant
2
Management Estimates
HVAC,
Appliances,
Janitorial
and
Cleaning
Supplies,
Faucets
and
Showerheads,
Kitchen
and
Bath,
Hardware,
Lamps
and
Ballasts,
Electrical, Lighting Fixtures,
Hospitality Supplies, Tools, Textiles,
Paint
and
Sundries
Pipe
(PVC,
Ductile
Iron,
HDPE);
Fittings,
Valves, Fire Protection, Metering
Systems, Storm Drain, Hydrants;
Fusion
Machine Rental, Valve Testing
and Repair
Concrete Related Products, Forming
and Shoring Braces, Chemicals, Power
Tools and Accessories, Wood
Connectors; Equipment Rental, Rebar
and Rebar Fabrication
Building Materials; Fasteners,
Flooring, Countertops, Cabinets
Wire, Hardware, Meters, Transformers,
Connectors, Tools, Protective
Equipment, Molded Rubber, Lighting,
Conduit; Smart Grid Solutions, Project
Services
1
$7.0B
2
Portfolio of Best-in-Class Industrial Distributors |
 6
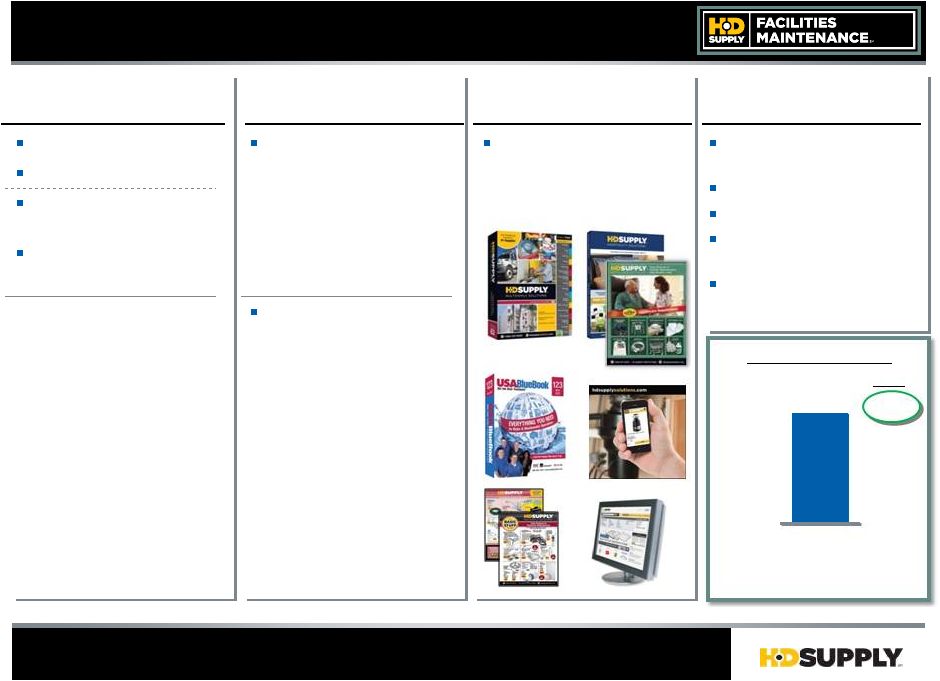
Facilities Maintenance…
At A Glance
#1 Distributor to Multi-Family Properties
Products and
Value-Added Services
Customers and
End Markets
“Go to Market”
Execution
Operating
Model
150,000+ SKUs
Proprietary
Brands
Fabrication
and
Installation
Services
Renovations
Project
Management
95%
of
U.S.
Served
With
Next-Day
Delivery
8 Call Centers
41
istribution
enters
600+
Dedicated
Delivery Trucks
950+ Sales Associates
With Average of
6
Years of Service
Industry Specific
Catalogs, Tabloids,
Product
Guides
and
e-Business Portal
–
HVAC
–
Appliances
–
Janitorial and Cleaning
Supplies
–
Faucets and
Showerheads
–
Kitchen and Bath
Hardware
–
Lamps and Ballasts
Electrical
–
Lighting Fixtures
–
Hospitality Supplies
–
Tools
–
Textiles
–
Paint and Sundries
244,000+ Property
Management
–
Multi-Family
–
Hospitality
–
Healthcare
–
Institutional
$48B Market Size
$1,994M
EBITDA (Adj.
)
VPY
17.3%
Revenue
Adj. EBITDA
Margin %
+13%
+25BPs
$345M
LTM Q2’12
+15%
1
Per Leading Global Consultant
2
See pg. 89 of 10-K Filed March 23, 2012 and pg. 21 of 10-Q Filed
September 4, 2012 for a Discussion of Adj. EBITDA and Reconciliation to Income (Loss) From Continuing Operations
36% of Sales
1
2
D
C |
 7
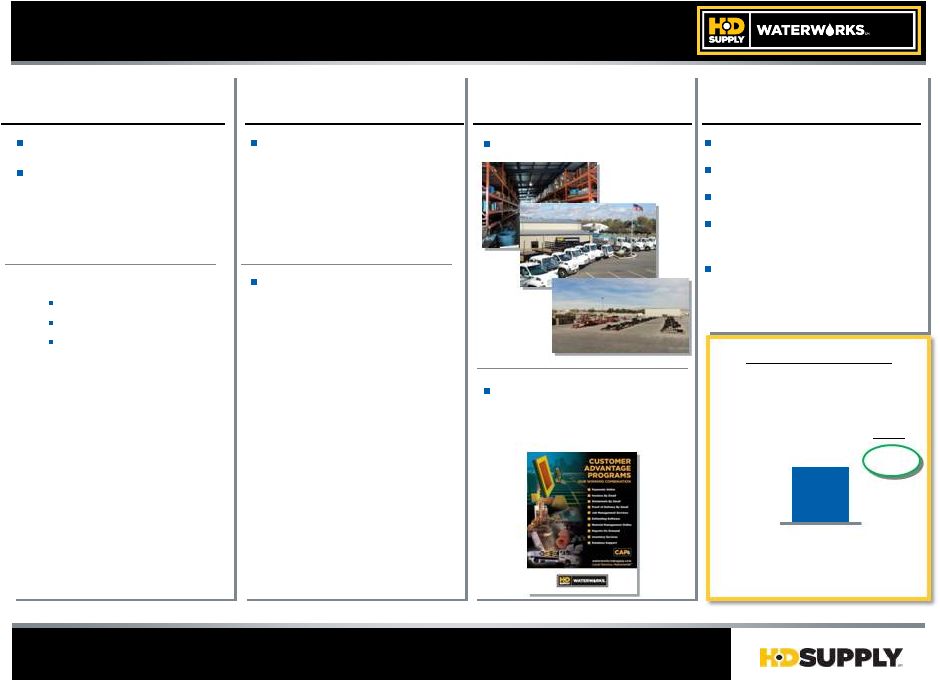
Waterworks…
At A Glance
#1 National Industry Position
Products and
Value-Added Services
Customers and
Customers and
End Markets
End Markets
“Go to Market”
Execution
Operating
Operating
Model
Model
300,000+
SKUs
Nation’s Largest
Distributor of Water,
Sewer, Storm and Fire
Protection Products
96% Fill Rate
235 Locations
44 States
620+
Dedicated
Delivery Trucks
860+ Sales Associates;
With Average of
12
Years of Service
–
Pipe
PVC
Ductile Iron
HDPE
–
Fittings
–
Valves
–
Fire Protection
–
Metering Systems
–
Storm Drain
–
Hydrants
–
Fusion Machine Rental
–
Valve Testing and Repair
45,000 Professional
Contract Customers
–
Municipal
–
Residential
–
Non-Residential
$10B Market Size
Revenue
Adj. EBITDA
Margin %
$1,877M
6.7%
+11%
+78BPs
VPY
$125M
+26%
LTM Q2’12
EBITDA
(Adj.
)
1
Per Leading Global Consultant
2
See pg. 89 of 10-K Filed March 23, 2012 and pg. 21 of 10-Q Filed
September 4, 2012 for a Discussion of Adj. EBITDA and Reconciliation to Income (Loss) From Continuing Operations
Branch Based
Customer Advantage
Programs;
Powerscope…
Since
’93
2
1 |
 8
Products and
Value-Added Services
Customers and
End Markets
“Go to Market”
Execution
Operating
Model
200,000+ SKUs
North America’s
Largest Utilities
Distributor
and
Full
Line Electrical
Distributor of
Construction,
Industrial
and
Communications
Products
101 Locations
25 States; 4 Canadian
Provinces
240 Dedicated Delivery
Trucks
550+ Sales Associates
With Average of
11
Years of Service
–
Wire
–
Hardware
–
Meters
–
Transformers
–
Connectors
–
Tools
–
Protective Equipment
–
Molded Rubber
–
Lighting
–
Conduit
–
Smart Grid Solutions
–
Project Services
8,500+ Professional
Contractor Customers
–
Non-Residential
–
Utilities
–
Residential
–
Industrial
$110B Market Size
EBITDA (Adj.
)
VPY
Revenue
Adj. EBITDA
Margin %
LTM Q2’12
1
Per Leading Global Consultant
2
See pg. 89 of 10-K Filed March 23, 2012 and pg. 21 of 10-Q Filed
September 4, 2012 for a Discussion of Adj. EBITDA and Reconciliation to Income (Loss) From Continuing Operations
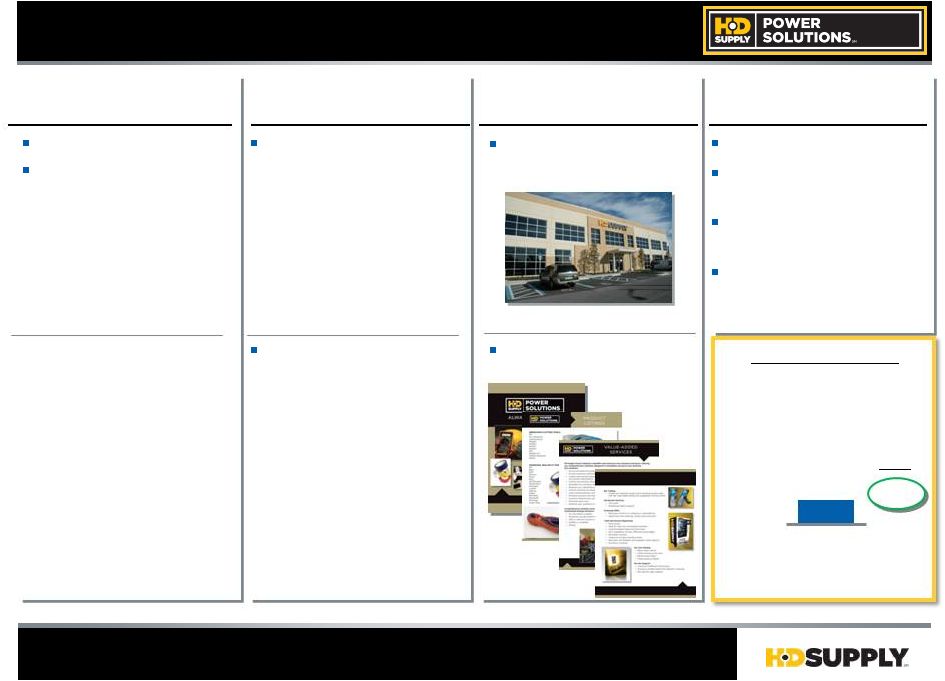
Power Solutions…
At A Glance
$58M
+12%
$1,670M
3.5%
+7%
+14BPs
MRO
and Safety
Offering
Branch
Based
and
Customer Site
2
1
#1 Leadership Position in U.S. and Canada for Utilities |
 9
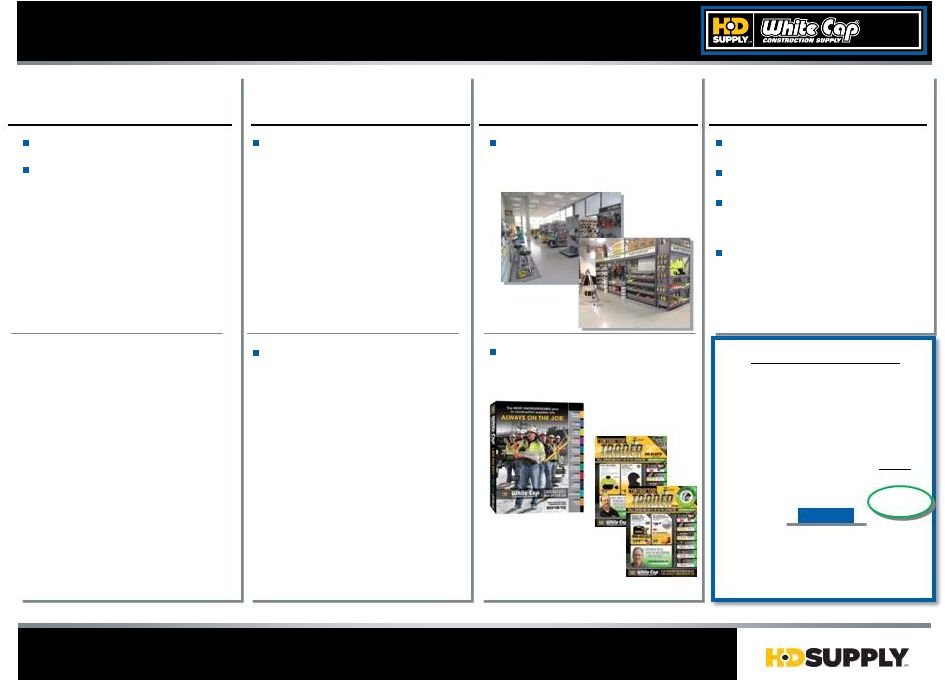
#1 National Industry Position
Products and
Value-Added Services
Customers and
End Markets
“Go to Market”
Execution
Operating
Model
200,000+ SKUs
Nation’s Leading
Distributor of
Specialty Hardware,
Tools and Materials
134 Locations
31 States
620+ Dedicated
Delivery Trucks
920+ Sales Associates
With
Average
of
9
Years
of Service
53,000 Professional
Contractor Customers
–
Residential
–
Non-Residential
–
Industrial
$19B Market Size
EBITDA (Adj.
)
VPY
Revenue
Adj. EBITDA
Margin %
LTM Q2’12
1
Per Leading Global Consultant
2
See pg. 89 of 10-K Filed March 23, 2012 and pg. 21 of 10-Q Filed
September 4, 2012 for a Discussion of Adj. EBITDA and Reconciliation to Income (Loss) From Continuing Operations
Branch Based;
Open Warehouse
Format
White Cap…
At A Glance
+39x
$39M
$1,083M
3.6%
+22%
+349BPs
Catalog
and
Regional Traders
–
Concrete Related
Products
–
Forming and Shoring
Braces
–
Chemicals
–
Power Tools and
Accessories
–
Building Materials and
Fasteners
–
Erosion and
Waterproofing
–
Safety Products
–
Equipment Rental and
Tool Repair
–
Rebar Fabrication
1
2 |
 10
Agenda
1.
HD Supply Overview
2.
2.
Market Opportunity
Market Opportunity
3.
Differentiated Growth
4.
Financial Performance
5.
Key Messages |
 ~$190B Market Opportunity, Solid Growth Drivers
1
Per Leading Global Consultant; Management Estimates
Infrastructure
Maintenance & Repair
Maintenance & Repair
Specialty Construction
“Endless, Critical Demand”
“Continual Demand”
“Continual Demand”
“Niche Expertise”
11
End Market Overview
1
Market
Opportunity
$120B
$120B
$48B+
$48B+
$19B+
$19B+
Demand
Drivers
Aging Overburdened
Infrastructure
Coverage for Population Growth
Cost-Effective and Efficient
Distribution of Water
and Electricity
Infrastructure Build Out for
Growing
Resource Base of Shale Gas
Maintenance
Required for Existing
Stock
of U.S. Multifamily, Hospitality,
Healthcare
and Institutional
Structures
Repair and Remodel
Construction
Single Family, Multifamily, Commercial,
Municipal and Repair and Remodel
Construction
Infrastructure Build Out for Growing
Resource Base of Shale Gas
HD Supply
Businesses
HD Supply
Competitive
Advantages
Scale, Information
Technology
and
Pricing
Rigor
Deep Customer and Vendor
Relationships with Solution Selling
Capabilities
Industry Leading Management Talent
and Experience
Comprehensive Product
Assortment,
Superior Availability
and Delivery
Time
Differentiation
Superior National
Distribution
Capabilities
Lean
Operating Cost
Structure
Leveraging ERP Technologies
Customer Service Differentiation
(i.e.,
Delivery Times, Sales Expertise, Value-
Added Product)
Product Assortment
and Knowledge |
 12
Addressable Opportunities
1
Per Leading Global Consultants
2
Sales for the Year Ending January 29, 2012
3
.Power Solutions is the Largest Utilities Distributor; Facilities Maintenance is the
Largest Distributor to Multifamily Properties $48B
Est. Market Size
HD Supply Sales
2
Share
1
Rank
$1.8B
$10B
18%
#1
#1
~$190B Opportunity…
Leading Positions, Large Opportunities
$1.0B
$19B
5%
#1
#1
($ in billions)
$1.9B
4%
#1
#1
3
$110B
2%
#1
#1
3
$1.6B
Addressable Opportunity and HD Supply’s Position
1 |
 13
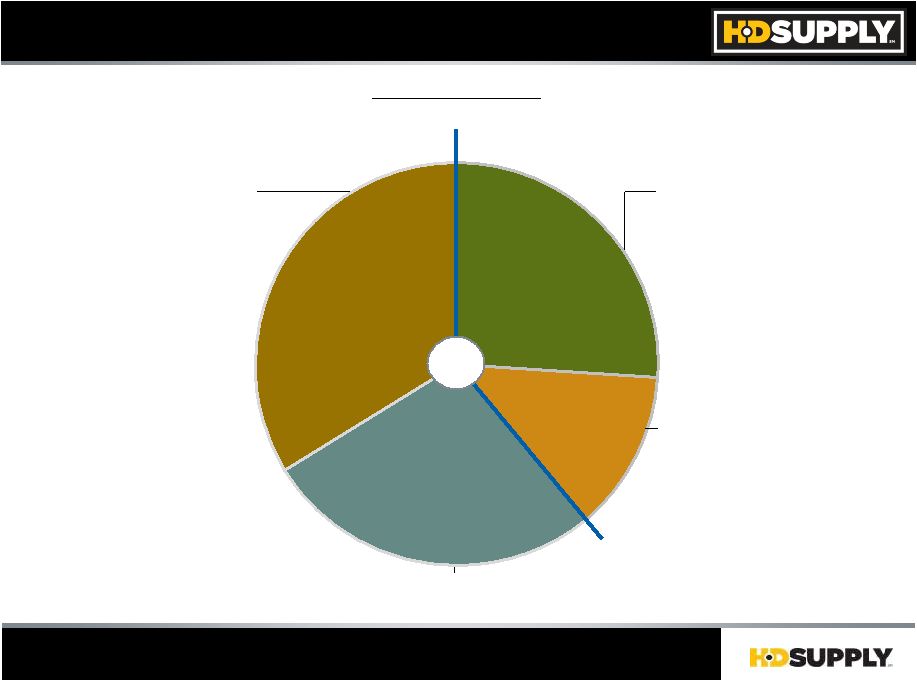
39% Construction, 27% MRO, 34% Infrastructure
End Market Diversity
HD Supply Sales
HD Supply Sales
Estimated % of FYE Jan. ’12 Sales
Construction, 39%
Infrastructure
and Other
34%
MRO
27%
Residential
13%
Non-Residential
26%
$7B |
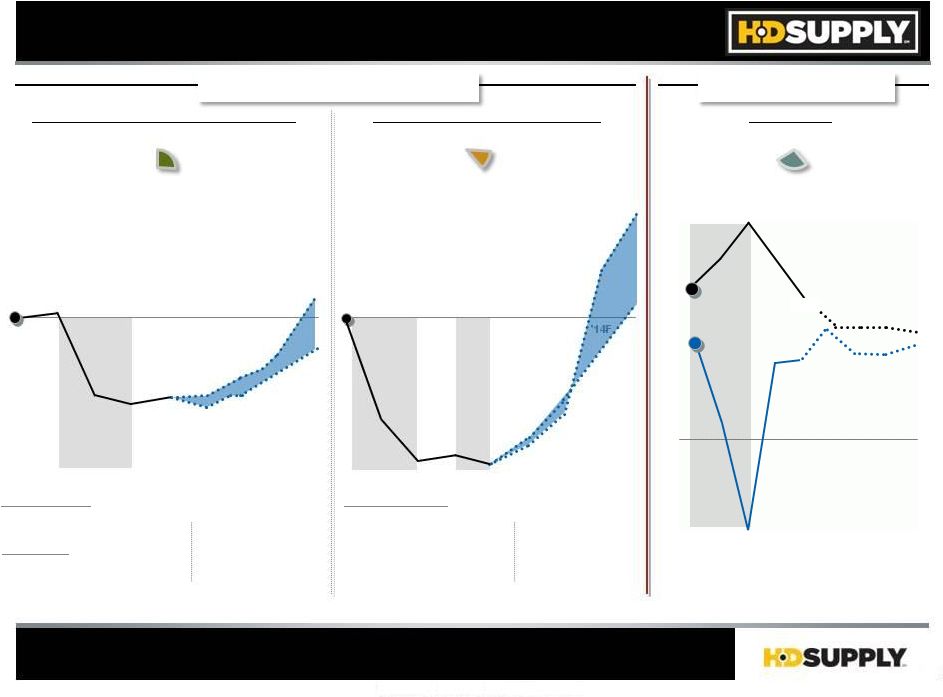 Non-Residential Construction
(26%)
(Construction Spend Change, Index = '07)
Residential Construction (13%)
(SF Housing Starts Change, Index = '07)
Multifamily
Multifamily
(U.S. Apartments
Vacancy Rate; Rev. Per Occupied Stock)
'07A
'08A
'09A
'10A
'11A
'12F
'13F
'14F
'15F
'08A
'09A
'10A
'11A
'13F
'14F
'12F
'15F
'07A
-60%
40%
20%
20%
40%
Spend ($ in billions)
High
$164
Low
$154
$165
$187
$163
$165
$243
$239
Actual
$183
$206
Forecast Range
$156
$209
$260
1,035
431
471
445
616
535
905
642
512
695
1,224
1,095
1,467
Annual SF Starts (000s)
Construction End Markets
Apartment Outlook
End Market Outlook
Growth Projected Going Forward
Sources: Management Estimates Based on Industry Data
Source: REIS (“United States Apartment 2Q 2012 MetroTrend Futures”)
14
5.7%
8.0%
4.1%
'07A
'13F
'12F
'11A
'10A
'09A
'08A
4.8%
(4.3%)
4.0%
'14F
'15F
4.9%
5.2%
Vacancy
Rate
Rev. /
Occupied
Stock |
 Agenda
1.
HD Supply Overview
2.
Market Opportunity
3.
3.
Differentiated Growth
Differentiated Growth
4.
Financial Performance
5.
Key Messages
15 |
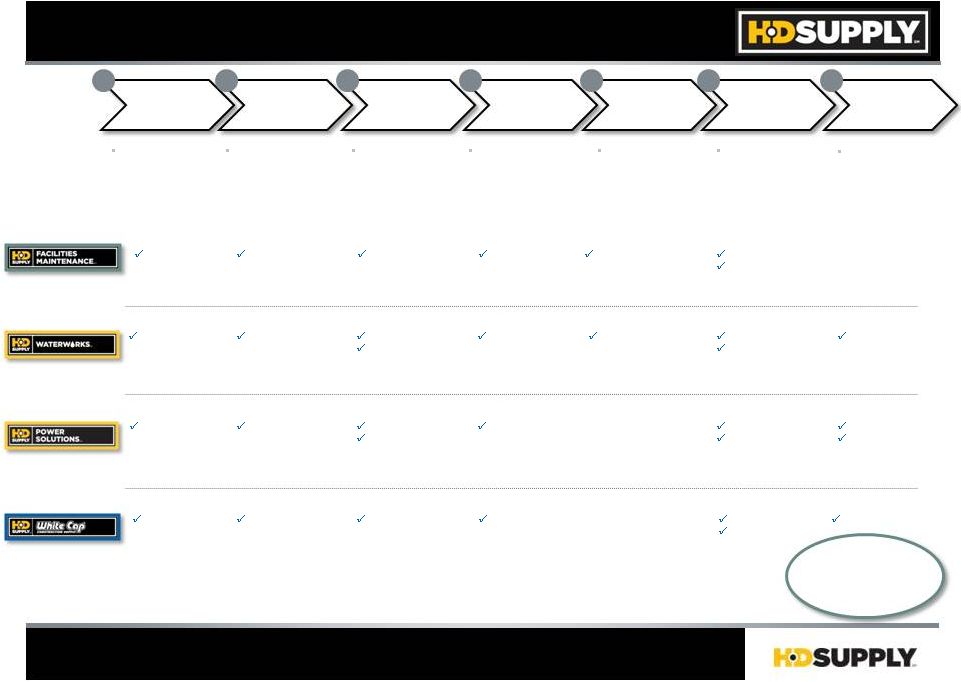 Increase Share
of Wallet
Sell
More
Products
to
New
Customers
New Product
and
Service
Introduction
Redesign
the
Business
System
by
Which
a
Product
or
Service
is
Delivered
Acquisitions
Enter New
Geographies
Enter
Entire
New
Business
Segment
Strategic Investments Through the Cycle
to Drive ROIC and Scale Differentiation
Differentiated Growth Investments
Sales Training
+10K SKUs Added
Storm Drainage
Fusion
Equipment
Rental
Acquired RAMSCO
to Enter NY State
12
Greenfields
1
Expansion
Oil & Gas
Sales Force
Effectiveness
+11K SKUs Added
e-Commerce
Acquired Peachtree
Business Products
3
Dist. Center
5
Expansions
MSA
Leadership
+3K SKUs Added
Catalog
Introduction
2
Greenfields
2
Expansions
Oil & Gas
Talent…
Product
Specialist
(HDPE) Leader
Talent…
Segment Leaders
Talent…
Executive
Leadership
(President),
Merchandising
Experts
Existing
Customers
New
Customers
New Products
and Services
New Value
Delivery
System
Improve
Industry
Structure
Geographic
Expansion
New
Competitive
Arenas
1
Includes SG&A, Capital and Net Working Capital
Project Services
Automation
Catalog
Introduction
5
Greenfields
1
Expansion
Industrial
Oil & Gas
Sales Force
Effectiveness
Talent…
MRO
Specialist
1
2
3
4
5
6
7
16
~$400M Strategic
Investment
1
Since ’10 |
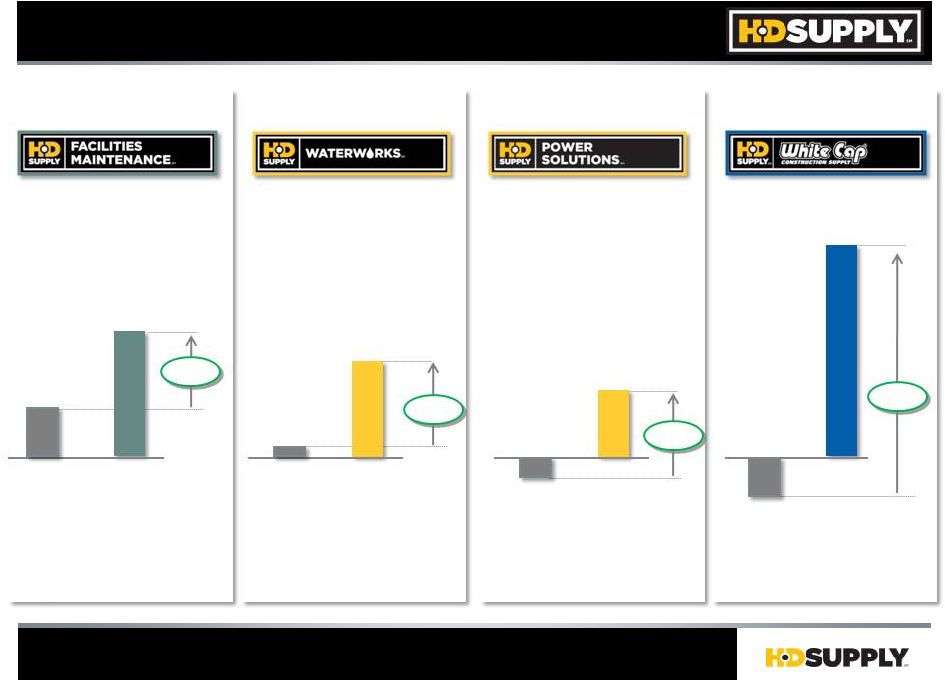 (Organic Sales Growth Versus Market)
Outpace Market Growth…
LTM Q2’12
+11%
+11%
Source: 3
Party Market Sources, Management Estimates
(4%)
(4%)
Market
+22%
+22%
FM
+13%
+13%
+5%
+5%
+8 Pts
+8 Pts
Market
+7%
+7%
(2%)
(2%)
Market
WW
+9 Pts
+9 Pts
+26 Pts
+26 Pts
WC
Market
+1%
+1%
PS
17
+10 Pts
+10 Pts
rd
Total HD Supply… +10 Pts V Estimated Market Growth |
 Agenda
1.
HD Supply Overview
2.
Market Opportunity
3.
Differentiated Growth
4.
4.
Financial Performance
Financial Performance
5.
Key Messages
18 |
 19
Financial Performance
Gross Profit
GM %
Adj. EBITDA %
Cash Flow
Net Debt
Sales Growth VPY
’10A
’11A
YTD
Q2 ’11
$1.8B
$2.0B
$1.1B
$0.7B
$0.1B
($0.0B)
$5.0B
$5.4B
$5.7B
28.5%
28.7%
28.7%
2%
9%
12%
6.4%
7.2%
8.3%
YTD
Q2 ’12
$1.0B
($0.1B)
$5.4B
28.5%
7.2%
($ in billions,
Except Adj. EBITDA)
6%
Adj. EBITDA
Nine Consecutive Quarters
of Year-Over-Year Sales Growth
LTM
Q2’12
$2.1B
$0.2B
$5.7B
28.7%
12%
7.8%
Adj. EBITDA Growth VPY
20%
24%
29%
24%
27%
$411M
$508M
$582M
$251M
$325M
Sales
$6.4B
$7.0B
$3.9B
$3.5B
$7.4B
1
See pg. 89 of 10-K Filed March 23, 2012 and pg. 21 of 10-Q Filed
September 4, 2012 for a Discussion of Adj. EBITDA and Reconciliation to Income (Loss) From Continuing Operations
1 |
 Agenda
1.
HD Supply Overview
2.
Market Opportunity
3.
Differentiated Growth
4.
Financial Performance
5.
5.
Key Messages
Key Messages
20 |
 21
Pipe, Meters
and Fire
Hydrants
Utility Cable, Transformers
and Switches
Pipe, Meters
and Fire
Hydrants
Utility Cable, Transformers
and Switches
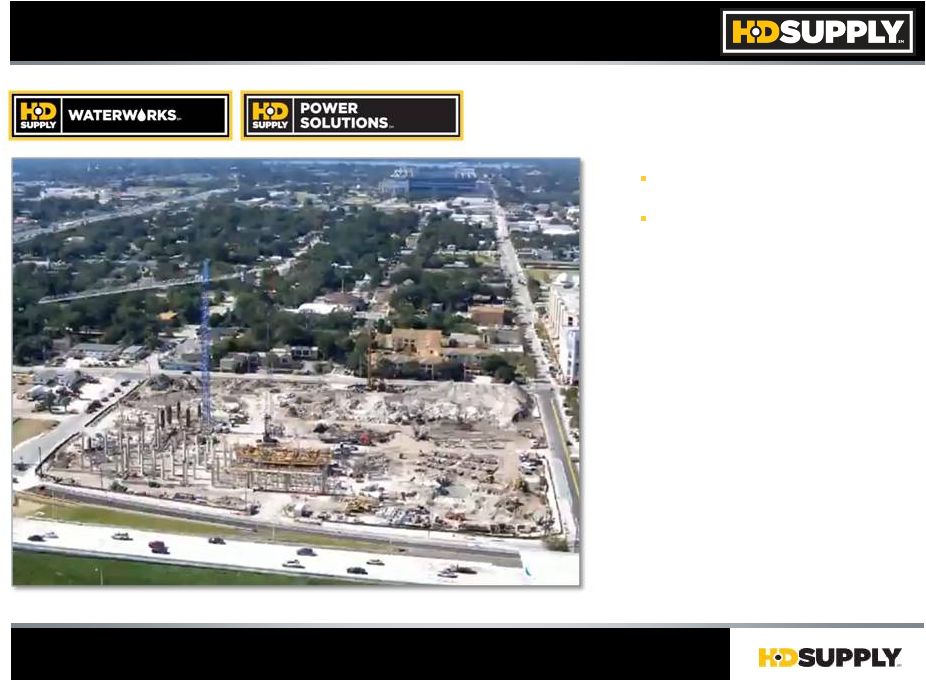
We Build Your City…
…
and Keep it Running |
 22
Concrete, Masonry
Tools
and
Accessories
Specialty Power Tools
Specialty Hardware
and Tools
Safety
Doors, Windows, Building
Materials
Flooring
Concrete, Masonry
Tools
and
Accessories
Specialty Power
Tools
Specialty Hardware
and Tools
Safety
Doors, Windows, Building
Materials
Flooring
Pipe, Meters
and Fire
Hydrants
Utility Cable, Transformers
and Switches
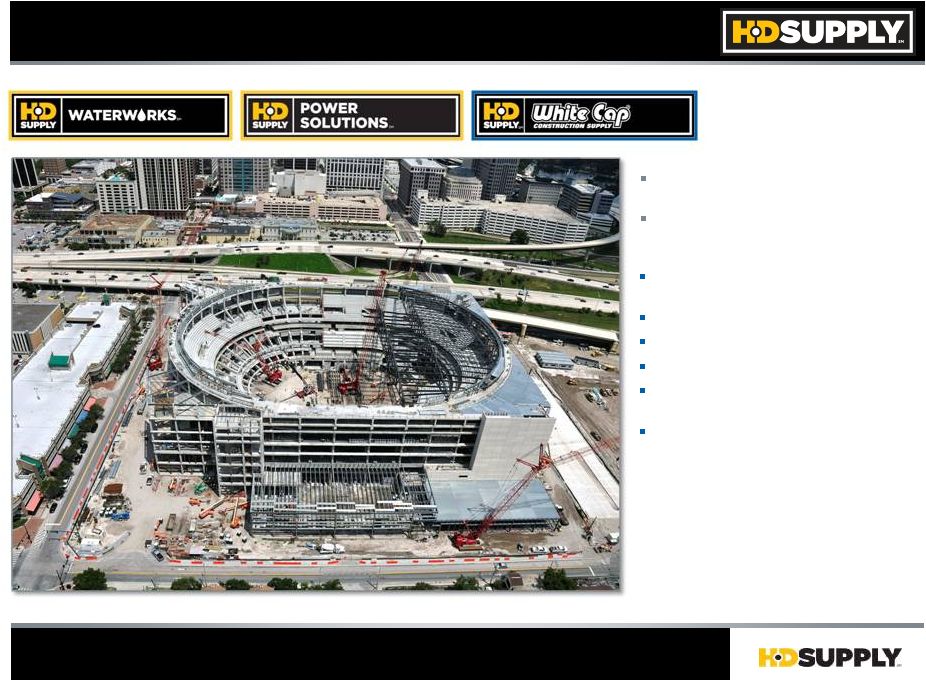
We Build Your City…
…
and Keep it Running |
 23
Concrete, Masonry
Tools
and
Accessories
Specialty Power Tools
Specialty Hardware
and Tools
Safety
Doors, Windows, Building
Materials
Flooring
Pipe, Meters
and Fire
Hydrants
Utility Cable, Transformers
and Switches
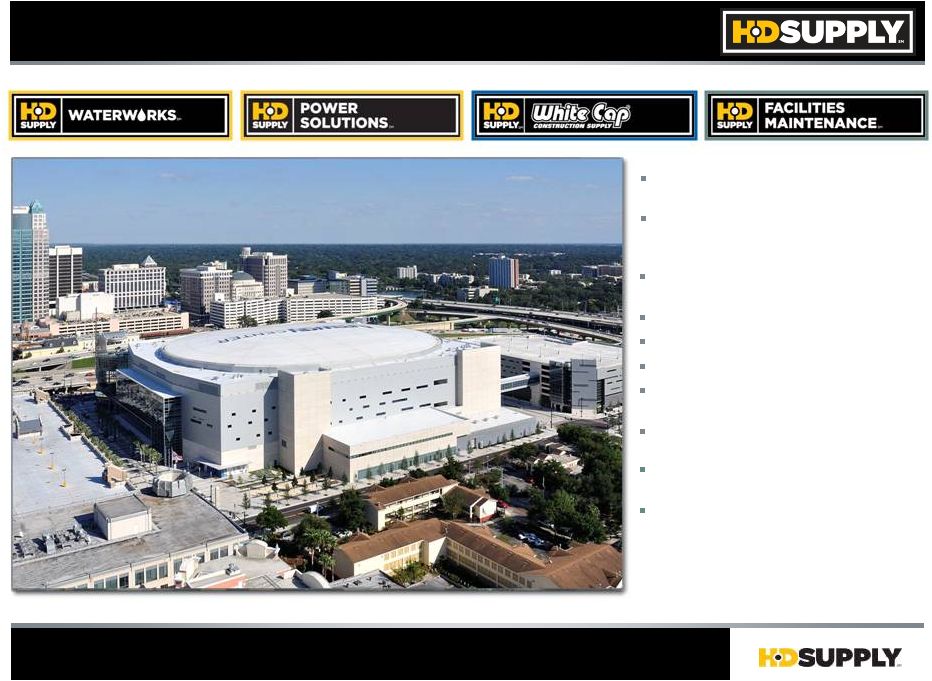
We Build Your City…
Cleaning
and Hospitality
Products
Upgrade
and Renovation
Services
…
and Keep it Running |
 24
Key Messages
1.
We
Had
a
Very
Good
Company
in
’06
in
Strong
Markets…
Great
Company
in
’12,
Obsessed with Being the Best of the Best
2.
We are in the Early Innings of Our Amazing Full Potential
3.
4.
We
Invested Heavily Throughout the Downturn to Extend Our Advantage and Barriers to
Entry… Talent / Training, Technology Platforms, Processes, Products,
Supplier Alignments, Facilities, Geographies and Fleet
5.
Our
Initiative
“Stack”
Ensures
We
Always
Grow
Faster
than
Our
Markets
and
Save
as
We
Grow
6.
Costs
are
Down
and
Capabilities
are
Up...
Q2’12
LTM
Sales
+12%
with
EBITDA
+27%
7.
Distractions
are
Behind
Us
and
We
are
Advantaged
Together
Portfolio of Best-in-Class Industrial Distributors
Our Businesses are Market Leaders in Highly Fragmented
Markets with Large Profit Pools… We Have Unique Capabilities
to Consolidate Markets to Benefit Customers and Investors |
 25
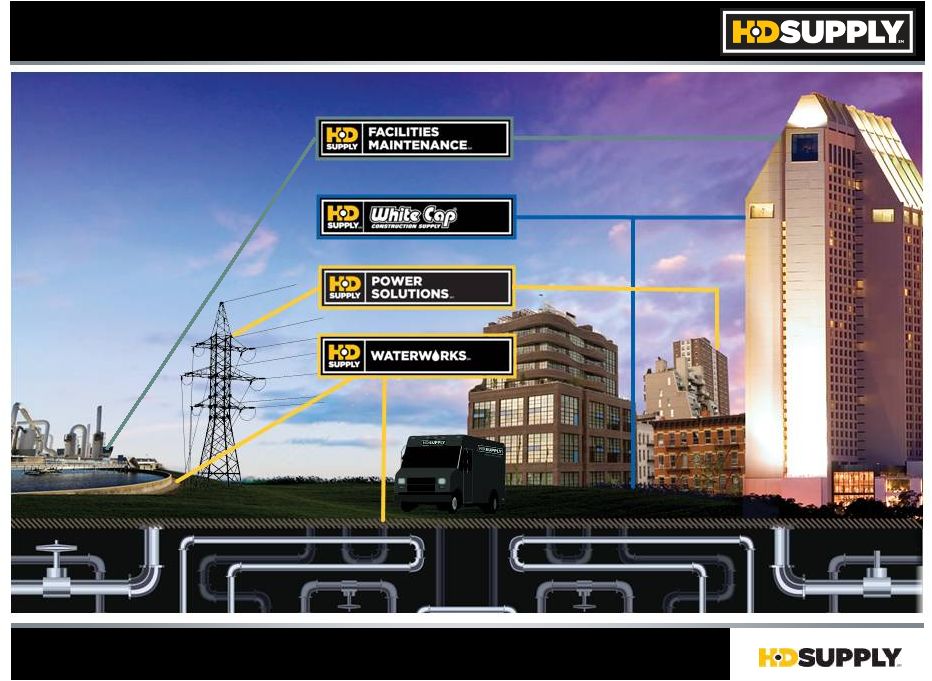
We Build Your City…
…
and Keep it Running |
 Appendix
 |
 27
GAAP Reconciliation
Fiscal
Fiscal
LTM
YTD
YTD
2010
2011
Q2’12
Q2’11
Q2’12
Adjusted Cash Flow
$658
$94
$214
($140)
($20)
Reconciling Items:
Interest Paid
(363)
(356)
(530)
(177)
(351)
Taxes (Paid) Received
216
(5)
(2)
(5)
(2)
Capital Expenditures
49
115
132
35
52
Proceeds from Sale of PPE
(4)
(4)
(2)
(4)
(2)
Management Fees & Expenses
(5)
(5)
(5)
(2)
(2)
Other
(4)
(3)
1
GAAP Operating Cash Flows
$551
($165)
($193)
($296)
($324)
($ in millions)
-
- |
 28
Adjusted EBITDA
$411
$508
$582
$251
$325
Reconciling Items:
Depreciation and Amortization
(343)
(329)
(331)
(165)
(167)
Goodwill impairment
Restructuring
(8)
Stock Compensation
(17)
(20)
(21)
(9)
(10)
Management Fee
(5)
(5)
(5)
(3)
(3)
Other
(1)
1
2
1
GAAP Operating Income (Loss)
37
155
227
74
146
Interest Expense, net
(623)
(639)
(646)
(317)
(324)
Gain (loss) on extinguishment of debt
(220)
(220)
Other Income (Expense)
1
(1)
1
GAAP Pre-Tax Income (Loss)
(585)
(484)
(640)
(242)
(398)
Tax Benefit (Expense)
(28)
(79)
(78)
(35)
(34)
GAAP Net Income (Loss) Cont Ops
($613)
($563)
($718)
($277)
($432)
-
-
-
-
-
-
-
-
-
-
-
-
-
-
-
Fiscal
Fiscal
LTM
YTD
YTD
2010
2011
Q2’12
Q2’11
Q2’12
($ in millions)
GAAP Reconciliation |
 29
$1,500M
($315M)
Drawn
$971M
$1,273M
$675M
$1,000M
$728M
Capital Structure Summary
1
Maturity
Date
Secured Debt:
Funded Debt
4/12/2017
4/15/2019
4/15/2020
10/12/2020
9/1/2015
10/12/2017
S&P
Rating
BB-
B+
CCC+
CCC+
CCC+
B+
Net Debt
Senior Sub. Notes –
Public Owned
4
Senior ABL Facility
Senior
Term
Loan
Sr. Secured 2
Lien Notes
Sr.
Secured
1
Lien
Notes
PIK for min. 5½
years
$5.9B
$5.8B
$348M
$541M
Sr. Notes
7/15/2020
CCC+
–
Sponsor Owned
4
Unsecured Notes:
Senior Notes
–
Sponsor Owned
($ in millions,
other than Funded Debt and Net Debt)
Earliest Maturing Debt... September 2015
Notes
2
3
3
st
nd
3
st
1
As of 7/29/12; Pro Forma for Aug. $300M 1st Lien Add-on and Oct. $1B Senior Note
Offering 2
Drawn
ABL
as
at
7/29/2012
was
$632M.
$315M
reflects
the
use
of
Sr.
Sec.
1
Lien
Add-on
proceeds
to
pay
down
ABL
3
Including Applicable Premiums and Net of Applicable Discounts
4
Net
of
$1B
of
proceeds
from
issuance
of
Senior
Notes
less
initial
purchasers’
commissions
and
accrued
interest
and
redemption
premium
on
Senior
Sub.
Notes |