Attached files
| file | filename |
|---|---|
| 8-K - CREXUS INVESTMENT CORP. 8-K - CreXus Investment Corp. | a50466108.htm |
| EX-99.1 - EXHIBIT 99.1 - CreXus Investment Corp. | a50466108-ex991.htm |
Exhibit 99.2
CREXUS INVESTMENT CORP. 1 WWW.CREXUSINVESTMENT.COM SUPPLEMENTAL INVESTMENT INFORMATION QUARTER ENDED SEPTEMBER 30, 2012
CREXUS INVESTMENT CORP. 2 Disclaimer This presentation and our public documents to which we refer contain or incorporate by reference certain forward-looking statements within the meaning of Section 27A of the Securities Act of 1933 and Section 21E of the Securities Exchange Act of 1934. Forward-looking statements which are based on various assumptions (some of which are beyond our control) may be identified by reference to a future period or periods or by the use of forward-looking terminology, such as “believe,” “expect,” “anticipate,” “estimate,” “plan,” “continue,” “intend,” “should,” “may,” “would,” “will” or similar expressions, or variations on those terms or the negative of those terms. Actual results could differ materially from those set forth in forward-looking statements due to a variety of factors, including, but not limited to, our business and strategy; our ability to obtain and maintain financing arrangements and the terms of such arrangements; financing and advance rates for our targeted assets; general volatility of the markets in which we acquire assets; the implementation, timing and impact of, and changes to, various government programs; our expected assets; changes in the value of our assets; market trends in our industry, interest rates, the debt securities markets or the general economy; rates of default or decreased recovery rates on our assets; our continuing or future relationships with third parties; prepayments of the mortgage and other loans underlying our mortgage-backed or other asset-backed securities; the degree to which our hedging strategies may or may not protect us from interest rate volatility; changes in governmental regulations, tax law and rates, accounting guidance, and similar matters; our ability to maintain our qualification as a REIT for federal income tax purposes; ability to maintain our exemption from registration under the Investment Company Act of 1940, as amended; the availability of opportunities in real estate-related and other securities; the availability of qualified personnel; estimates relating to our ability to make distributions to our stockholders in the future; our understanding of our competition; interest rate mismatches between our assets and our borrowings used to finance purchases of such assets; changes in interest rates and mortgage prepayment rates; the effects of interest rate caps on our adjustable-rate mortgage-backed securities; our ability to integrate acquired assets into our existing portfolio; and our ability to realize our expectations of the advantages of acquiring assets. For a discussion of the risks and uncertainties which could cause actual results to differ from those contained in the forward-looking statements, see “Risk Factors” in our most recent annual report on Form 10-K and subsequent quarterly reports on Form 10-Q. We do not undertake, and specifically disclaim all obligations, to publicly release the result of any revisions which may be made to any forward-looking statements to reflect the occurrence of anticipated or unanticipated events or circumstances after the date of such statements. This presentation may contain statistics and other data that in some cases has been obtained from or compiled from information made available by third-party service providers. LTV ratios are based on third party appraisals, some of which were obtained when the loans were originated which in certain cases are prior to our acquiring the loans.
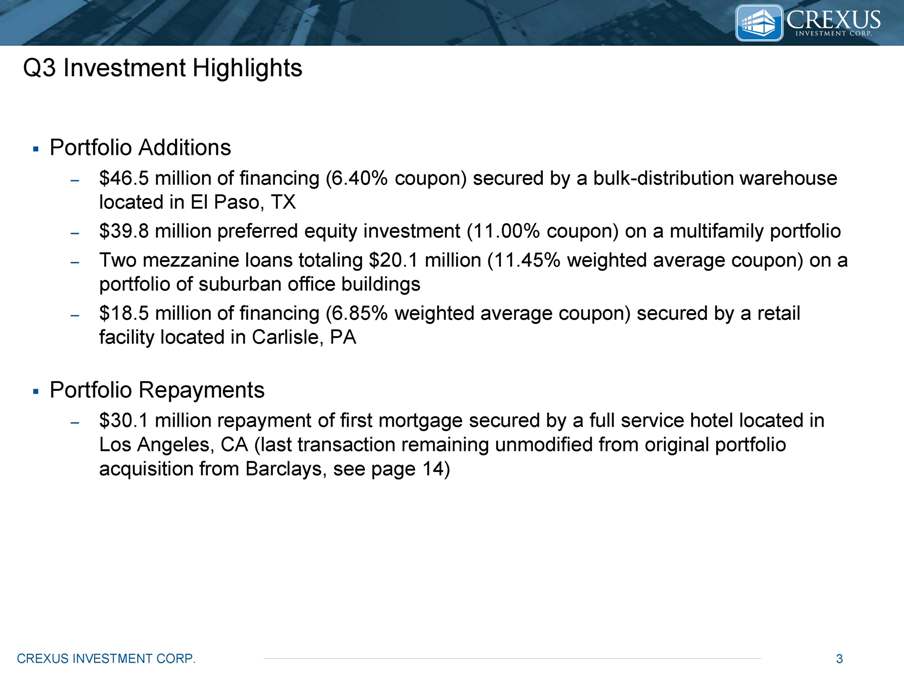
CREXUS INVESTMENT CORP. 3 Q3 Investment Highlights Portfolio Additions –$46.5 million of financing (6.40% coupon) secured by a bulk-distribution warehouse located in El Paso, TX –$39.8 million preferred equity investment (11.00% coupon) on a multifamily portfolio –Two mezzanine loans totaling $20.1 million (11.45% weighted average coupon) on a portfolio of suburban office buildings –$18.5 million of financing (6.85% weighted average coupon) secured by a retail facility located in Carlisle, PA Portfolio Repayments –$30.1 million repayment of first mortgage secured by a full service hotel located in Los Angeles, CA (last transaction remaining unmodified from original portfolio acquisition from Barclays, see page 14)
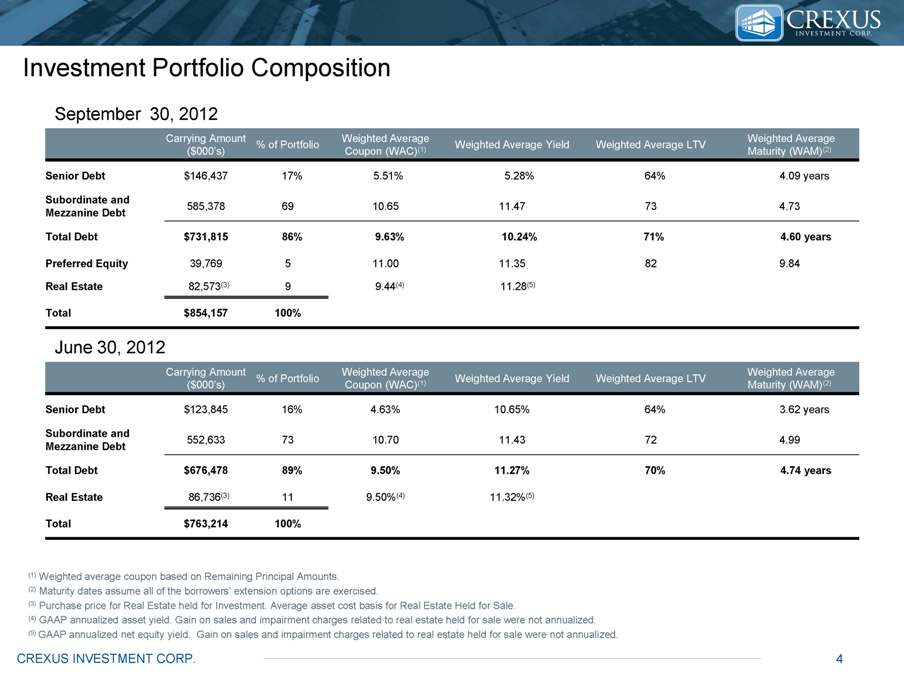
CREXUS INVESTMENT CORP. 4 Investment Portfolio Composition (1) Weighted average coupon based on Remaining Principal Amounts. (2) Maturity dates assume all of the borrowers’ extension options are exercised. (3) Purchase price for Real Estate held for Investment. Average asset cost basis for Real Estate Held for Sale. (4) GAAP annualized asset yield. Gain on sales and impairment charges related to real estate held for sale were not annualized. (5) GAAP annualized net equity yield. Gain on sales and impairment charges related to real estate held for sale were not annualized. Carrying Amount ($000’s) % of Portfolio Weighted Average Coupon (WAC)(1) Weighted Average Yield Weighted Average LTV Weighted Average Maturity (WAM)(2) Senior Debt $146,437 17% 5.51% 5.28% 64% 4.09 years Subordinate and Mezzanine Debt 585,378 69 10.65 11.47 73 4.73 Total Debt $731,815 86% 9.63% 10.24% 71% 4.60 years Preferred Equity 39,769 5 11.00 11.35 82 9.84 Real Estate 82,573(3) 9 9.44(4) 11.28(5) Total $854,157 100% September 30, 2012 June 30, 2012 Carrying Amount ($000’s) % of Portfolio Weighted Average Coupon (WAC)(1) Weighted Average Yield Weighted Average LTV Weighted Average Maturity (WAM)(2) Senior Debt $123,845 16% 4.63% 10.65% 64% 3.62 years Subordinate and Mezzanine Debt 552,633 73 10.70 11.43 72 4.99 Total Debt $676,478 89% 9.50% 11.27% 70% 4.74 years Real Estate 86,736(3) 11 9.50%(4) 11.32%(5) Total $763,214 100%
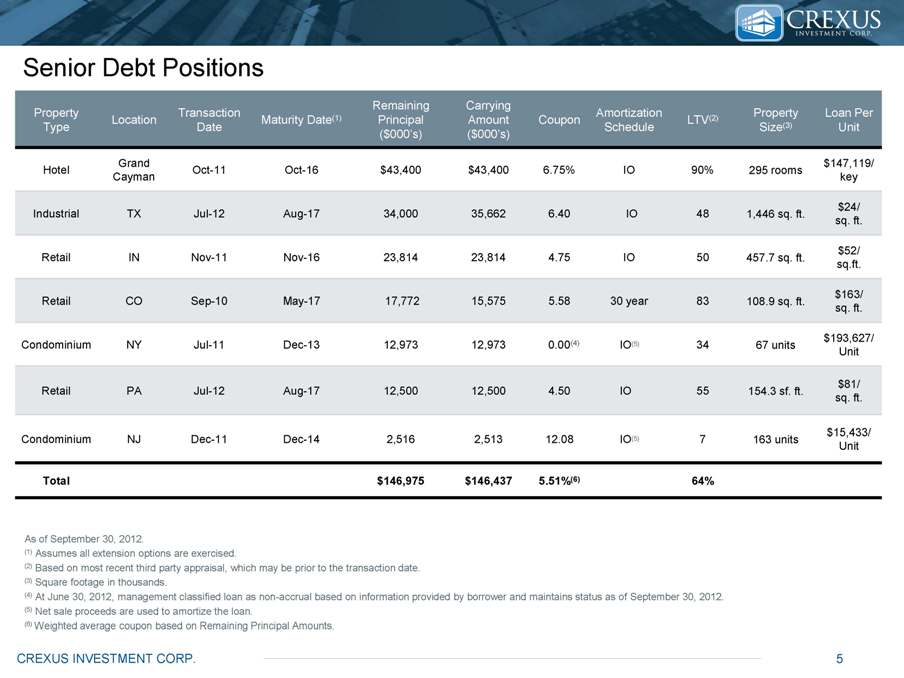
CREXUS INVESTMENT CORP. 5 Senior Debt Positions As of September 30, 2012. (1) Assumes all extension options are exercised. (2) Based on most recent third party appraisal, which may be prior to the transaction date. (3) Square footage in thousands. (4) At June 30, 2012, management classified loan as non-accrual based on information provided by borrower and maintains status as of September 30, 2012. (5) Net sale proceeds are used to amortize the loan. (6) Weighted average coupon based on Remaining Principal Amounts. Property Type Location Transaction Date Maturity Date(1) Remaining Principal ($000’s) Carrying Amount ($000’s) Coupon Amortization Schedule LTV(2) Property Size(3) Loan Per Unit Hotel Grand Cayman Oct-11 Oct-16 $43,400 $43,400 6.75% IO 90% 295 rooms $147,119/ key Industrial TX Jul-12 Aug-17 34,000 35,662 6.40 IO 48 1,446 sq. ft. $24/ sq. ft. Retail IN Nov-11 Nov-16 23,814 23,814 4.75 IO 50 457.7 sq. ft. $52/ sq.ft. Retail CO Sep-10 May-17 17,772 15,575 5.58 30 year 83 108.9 sq. ft. $163/ sq. ft. Condominium NY Jul-11 Dec-13 12,973 12,973 0.00(4) IO(5) 34 67 units $193,627/ Unit Retail PA Jul-12 Aug-17 12,500 12,500 4.50 IO 55 154.3 sf. ft. $81/ sq. ft. Condominium NJ Dec-11 Dec-14 2,516 2,513 12.08 IO(5) 7 163 units $15,433/ Unit Total $146,975 $146,437 5.51%(6) 64%
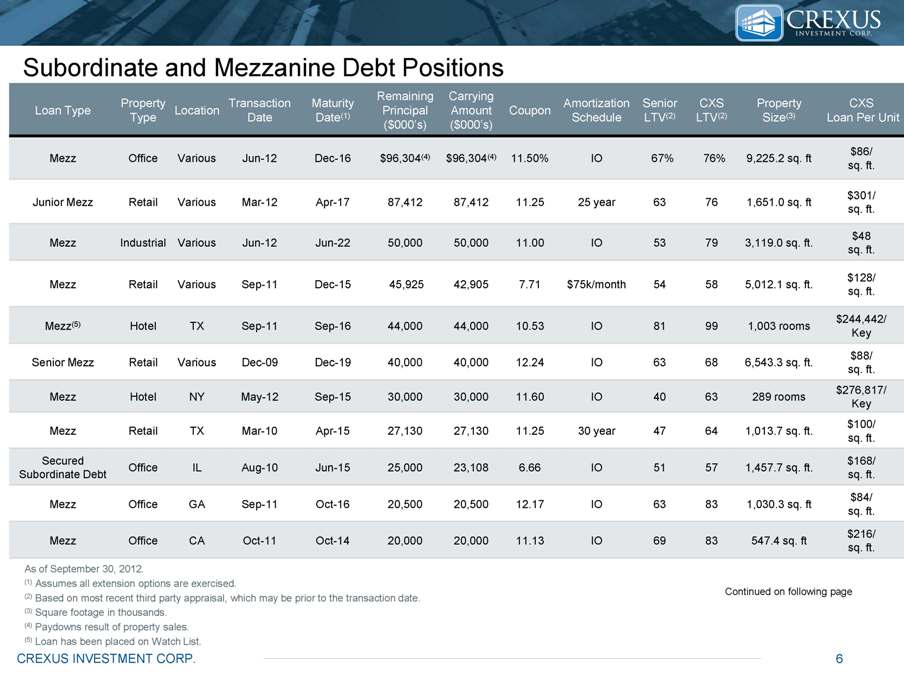
CREXUS INVESTMENT CORP. 6 Subordinate and Mezzanine Debt Positions As of September 30, 2012. (1) Assumes all extension options are exercised. (2) Based on most recent third party appraisal, which may be prior to the transaction date. (3) Square footage in thousands. (4) Paydowns result of property sales. (5) Loan has been placed on Watch List. Loan Type Property Type Location Transaction Date Maturity Date(1) Remaining Principal ($000’s) Carrying Amount ($000’s) Coupon Amortization Schedule Senior LTV(2) CXS LTV(2) Property Size(3) CXS Loan Per Unit Mezz Office Various Jun-12 Dec-16 $96,304(4) $96,304(4) 11.50% IO 67% 76% 9,225.2 sq. ft $86/ sq. ft. Junior Mezz Retail Various Mar-12 Apr-17 87,412 87,412 11.25 25 year 63 76 1,651.0 sq. ft $301/ sq. ft. Mezz Industrial Various Jun-12 Jun-22 50,000 50,000 11.00 IO 53 79 3,119.0 sq. ft. $48 sq. ft. Mezz Retail Various Sep-11 Dec-15 45,925 42,905 7.71 $75k/month 54 58 5,012.1 sq. ft. $128/ sq. ft. Mezz(5) Hotel TX Sep-11 Sep-16 44,000 44,000 10.53 IO 81 99 1,003 rooms $244,442/ Key Senior Mezz Retail Various Dec-09 Dec-19 40,000 40,000 12.24 IO 63 68 6,543.3 sq. ft. $88/ sq. ft. Mezz Hotel NY May-12 Sep-15 30,000 30,000 11.60 IO 40 63 289 rooms $276,817/ Key Mezz Retail TX Mar-10 Apr-15 27,130 27,130 11.25 30 year 47 64 1,013.7 sq. ft. $100/ sq. ft. Secured Subordinate Debt Office IL Aug-10 Jun-15 25,000 23,108 6.66 IO 51 57 1,457.7 sq. ft. $168/ sq. ft. Mezz Office GA Sep-11 Oct-16 20,500 20,500 12.17 IO 63 83 1,030.3 sq. ft $84/ sq. ft. Mezz Office CA Oct-11 Oct-14 20,000 20,000 11.13 IO 69 83 547.4 sq. ft $216/ sq. ft. Continued on following page
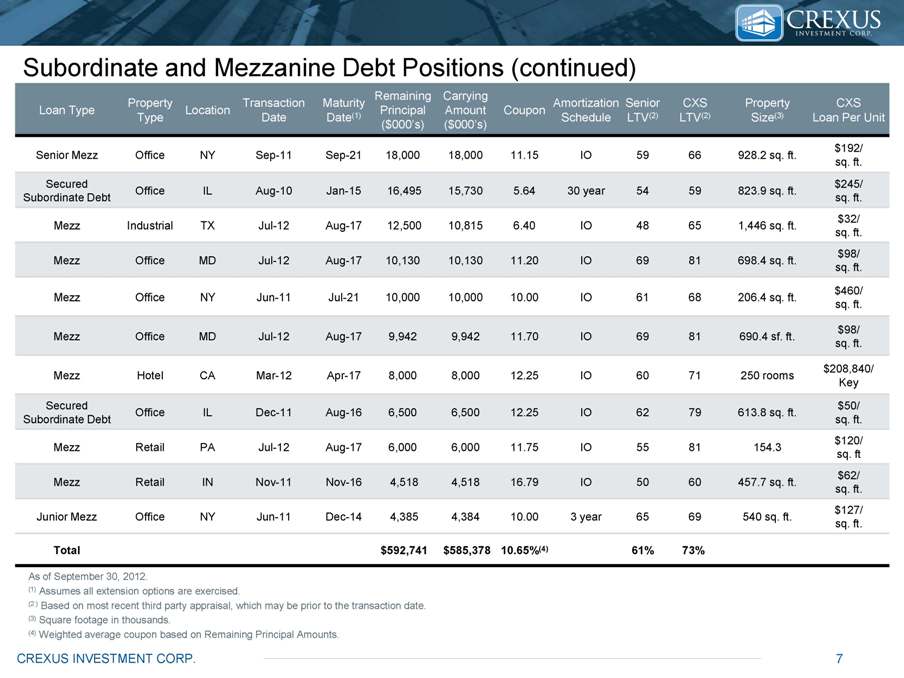
CREXUS INVESTMENT CORP. 7 Subordinate and Mezzanine Debt Positions (continued) As of September 30, 2012. (1) Assumes all extension options are exercised. (2 ) Based on most recent third party appraisal, which may be prior to the transaction date. (3) Square footage in thousands. (4) Weighted average coupon based on Remaining Principal Amounts. Loan Type Property Type Location Transaction Date Maturity Date(1) Remaining Principal ($000’s) Carrying Amount ($000’s) Coupon Amortization Schedule Senior LTV(2) CXS LTV(2) Property Size(3) CXS Loan Per Unit Senior Mezz Office NY Sep-11 Sep-21 18,000 18,000 11.15 IO 59 66 928.2 sq. ft. $192/ sq. ft. Secured Subordinate Debt Office IL Aug-10 Jan-15 16,495 15,730 5.64 30 year 54 59 823.9 sq. ft. $245/ sq. ft. Mezz Industrial TX Jul-12 Aug-17 12,500 10,815 6.40 IO 48 65 1,446 sq. ft. $32/ sq. ft. Mezz Office MD Jul-12 Aug-17 10,130 10,130 11.20 IO 69 81 698.4 sq. ft. $98/ sq. ft. Mezz Office NY Jun-11 Jul-21 10,000 10,000 10.00 IO 61 68 206.4 sq. ft. $460/ sq. ft. Mezz Office MD Jul-12 Aug-17 9,942 9,942 11.70 IO 69 81 690.4 sf. ft. $98/ sq. ft. Mezz Hotel CA Mar-12 Apr-17 8,000 8,000 12.25 IO 60 71 250 rooms $208,840/ Key Secured Subordinate Debt Office IL Dec-11 Aug-16 6,500 6,500 12.25 IO 62 79 613.8 sq. ft. $50/ sq. ft. Mezz Retail PA Jul-12 Aug-17 6,000 6,000 11.75 IO 55 81 154.3 $120/ sq. ft Mezz Retail IN Nov-11 Nov-16 4,518 4,518 16.79 IO 50 60 457.7 sq. ft. $62/ sq. ft. Junior Mezz Office NY Jun-11 Dec-14 4,385 4,384 10.00 3 year 65 69 540 sq. ft. $127/ sq. ft. Total $592,741 $585,378 10.65%(4) 61% 73%
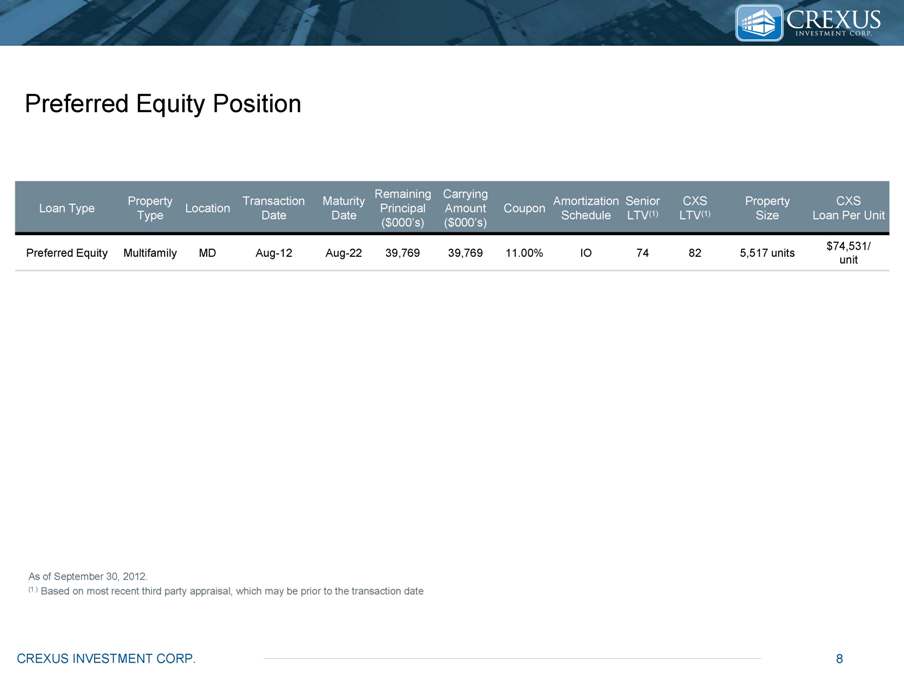
CREXUS INVESTMENT CORP. 8 As of September 30, 2012. (1 ) Based on most recent third party appraisal, which may be prior to the transaction date Loan Type Property Type Location Transaction Date Maturity Date Remaining Principal ($000’s) Carrying Amount ($000’s) Coupon Amortization Schedule Senior LTV(1) CXS LTV(1) Property Size CXS Loan Per Unit Preferred Equity Multifamily MD Aug-12 Aug-22 39,769 39,769 11.00% IO 74 82 5,517 units $74,531/ unit Preferred Equity Position
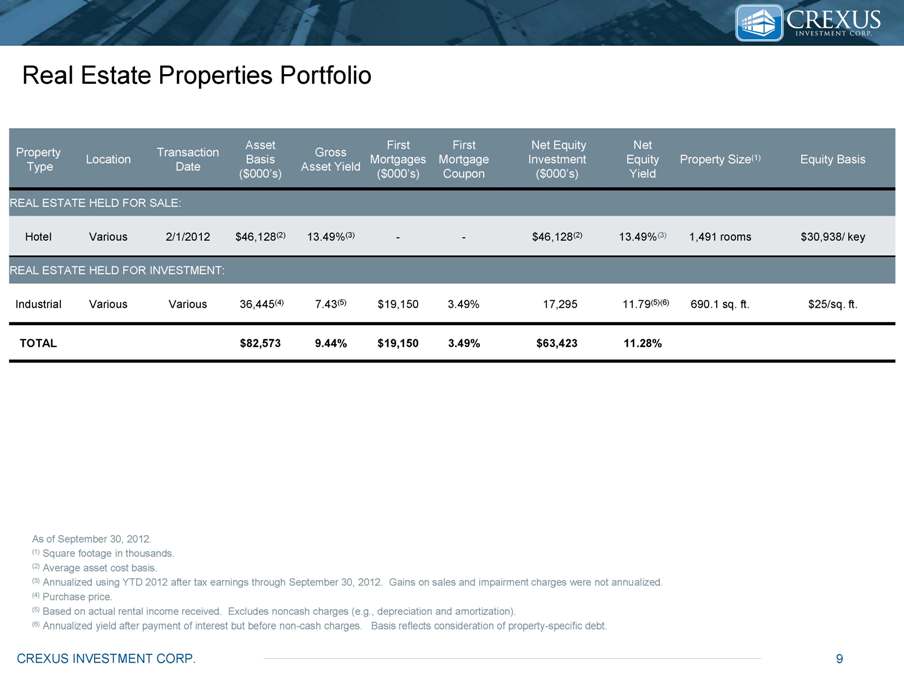
CREXUS INVESTMENT CORP. 9 Real Estate Properties Portfolio Property Type Location Transaction Date Asset Basis ($000’s) Gross Asset Yield First Mortgages ($000’s) First Mortgage Coupon Net Equity Investment ($000’s) Net Equity Yield Property Size(1) Equity Basis REAL ESTATE HELD FOR SALE: Hotel Various 2/1/2012 $46,128(2) 13.49%(3) - - $46,128(2) 13.49%(3) 1,491 rooms $30,938/ key REAL ESTATE HELD FOR INVESTMENT: Industrial Various Various 36,445(4) 7.43(5) $19,150 3.49% 17,295 11.79(5)(6) 690.1 sq. ft. $25/sq. ft. TOTAL $82,573 9.44% $19,150 3.49% $63,423 11.28% As of September 30, 2012. (1) Square footage in thousands. (2) Average asset cost basis. (3) Annualized using YTD 2012 after tax earnings through September 30, 2012. Gains on sales and impairment charges were not annualized. (4) Purchase price. (5) Based on actual rental income received. Excludes noncash charges (e.g., depreciation and amortization). (6) Annualized yield after payment of interest but before non-cash charges. Basis reflects consideration of property-specific debt.
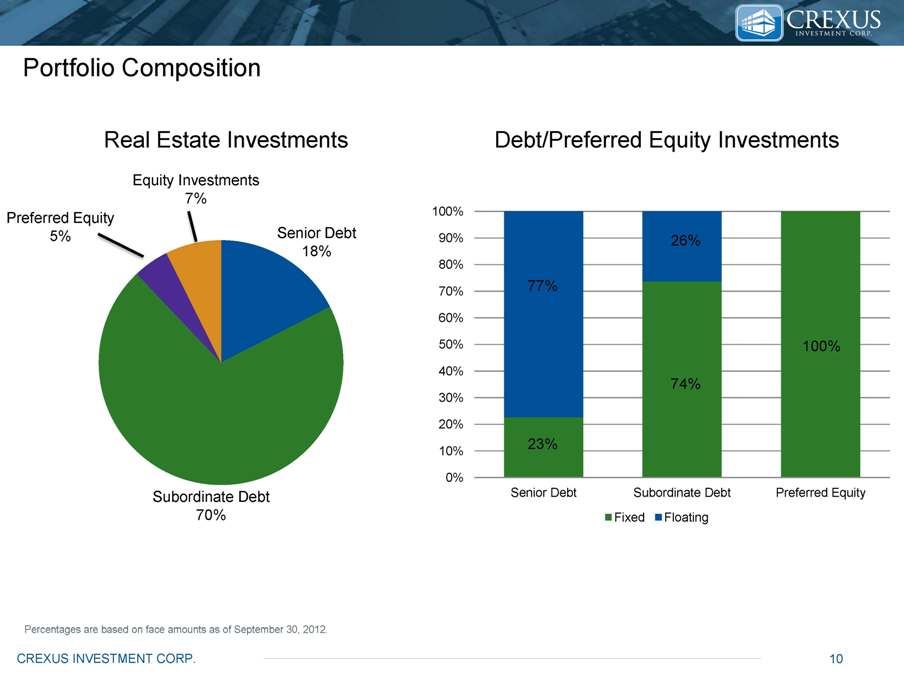
CREXUS INVESTMENT CORP. 10 Portfolio Composition Real Estate Investments Debt/Preferred Equity Investments Percentages are based on face amounts as of September 30, 2012. Senior Debt 18% Equity Investments 7% Preferred Equity 5% Subordinate Debt 70% 0% 10% 20% 30% 40% 50% 60% 70% 80% 90% 100% Senior Debt Subordinate Debt Preferred Equity Fixed Floating 77% 23% 26% 74% 100%
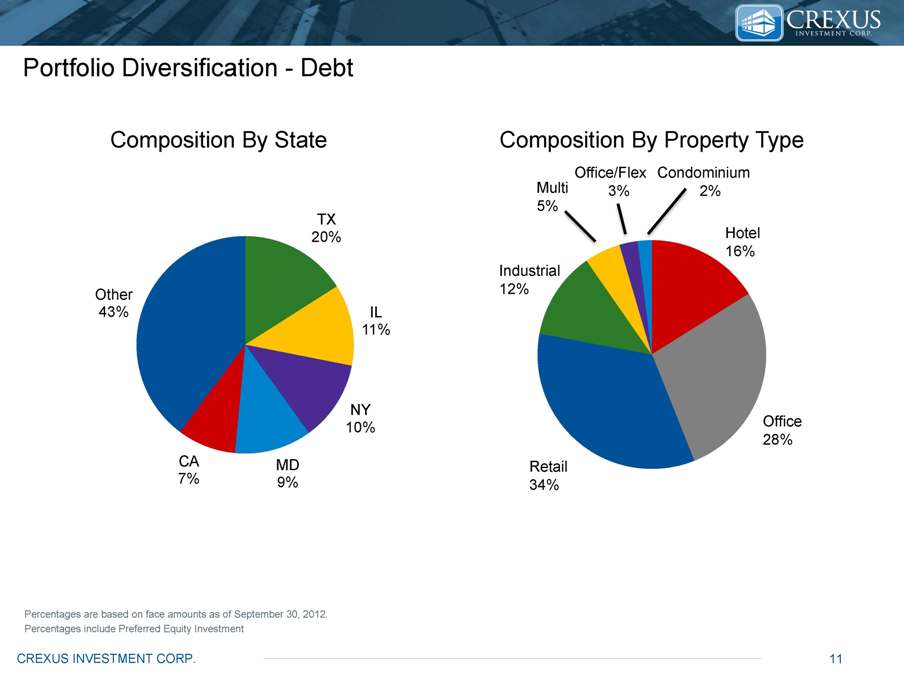
CREXUS INVESTMENT CORP. 11 Portfolio Diversification - Debt Percentages are based on face amounts as of September 30, 2012. Percentages include Preferred Equity Investment Hotel, 31% TX 20% IL 11% NY 10% MD 9% CA 7% Other 43% Composition By State Composition By Property Type Hotel 16% Retail34% Office 8% Industrial 12% Multi 5% Office/Flex 3% Condominium 2%
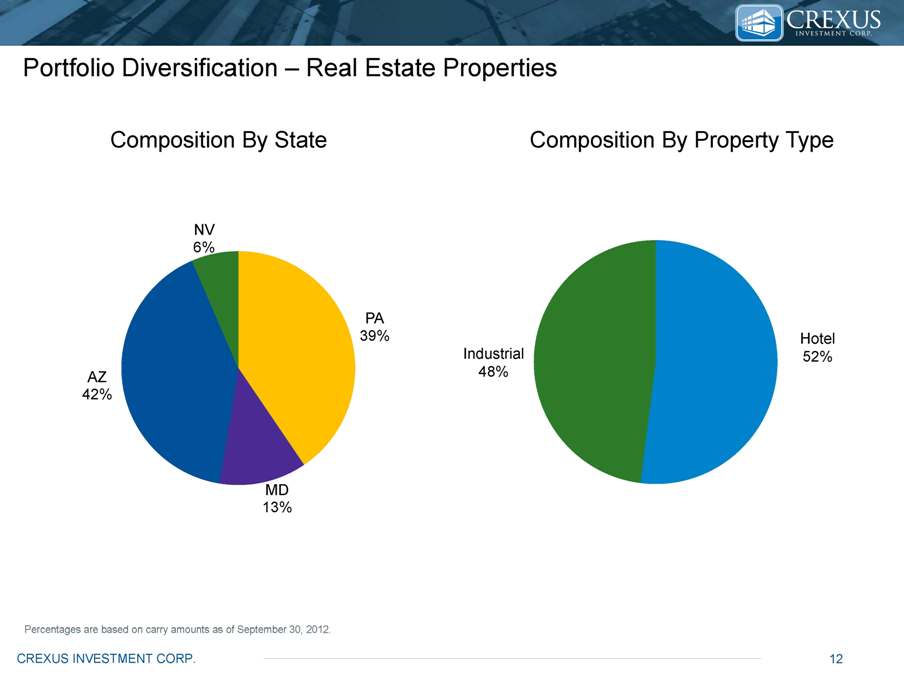
CREXUS INVESTMENT CORP. 12 Portfolio Diversification – Real Estate Properties Percentages are based on carry amounts as of September 30, 2012. PA 39% MD 13% AZ 42% NV 6% Composition By State Composition By Property Type Industrial 48% Hotel 52%
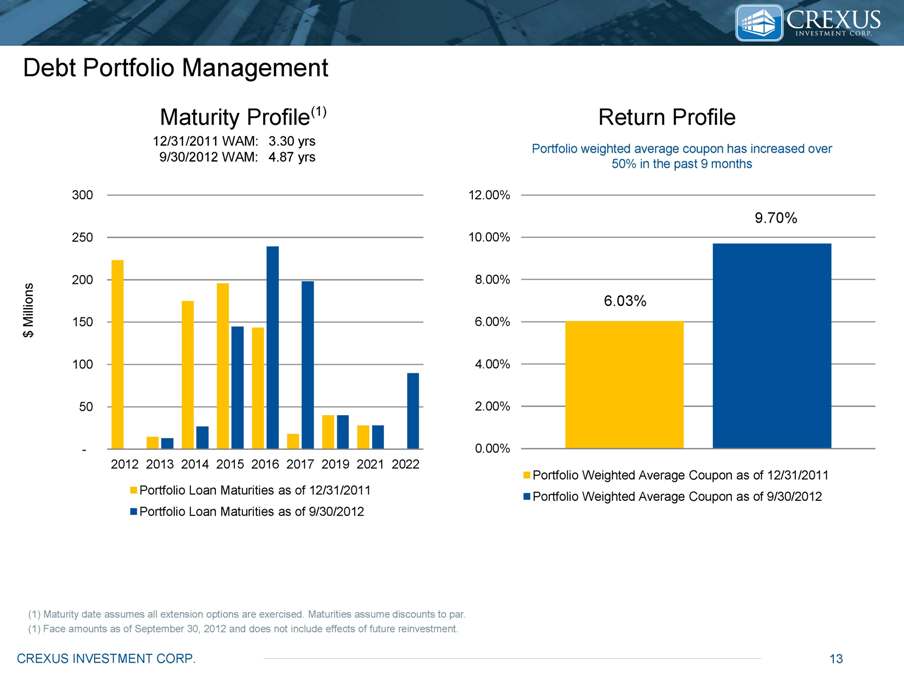
CREXUS INVESTMENT CORP. 13 Debt Portfolio Management Maturity Profile 12/31/2011 WAM: 3.30 yrs 9/30/2012 WAM: 4.87 yrs $ Millions Portfolio weighted average coupon has increased over 50% in the past 9 months Return Profile (1) Maturity date assumes all extension options are exercised. Maturities assume discounts to par. (1) Face amounts as of September 30, 2012 and does not include effects of future reinvestment. 0.00% 2.00% 4.00% 6.00% 8.00% 10.00% 12.00% Portfolio Weighted Average Coupon as of 12/31/2011 Portfolio Weighted Average Coupon as of 9/30/2012 6.03% 9.70% - 50 100 150 200 250 300 2012 2013 2014 2015 2016 2017 2019 2021 2022 Portfolio Loan Maturities as of 12/31/2011 Portfolio Loan Maturities as of 9/30/2012 (1)
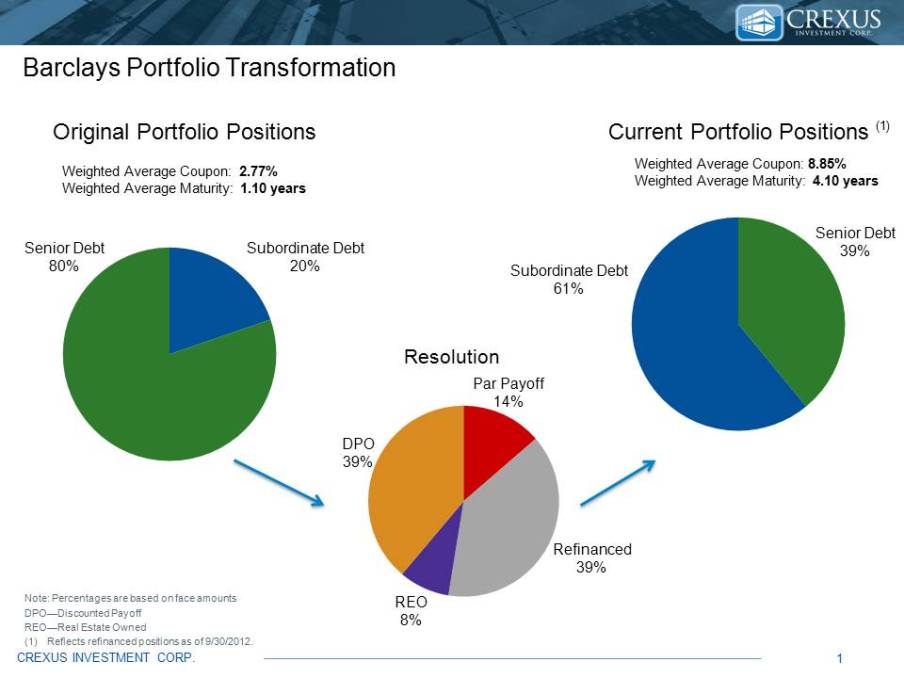
CREXUS INVESTMENT CORP. 14 Barclays Portfolio Transformation Original Portfolio Positions Subordinate Debt 20% Senior Debt 80% REO 8% Refinanced 39% Par Payoff 14% DPO 39% Senior Debt 43% Subordinate Debt 57% Resolution Current Portfolio Positions Note: Percentages are based on face amounts DPO—Discounted Payoff REO—Real Estate Owned (1)Reflects refinanced positions as of 9/30/2012. (1) Weighted Average Coupon: 10.02% Weighted Average Maturity: 4.07 years Weighted Average Coupon: 2.77% Weighted Average Maturity: 1.10 years
CREXUS INVESTMENT CORP. 15 WWW.ANNALY.COM CREXUSINVESTMENT.COM Financial Statements
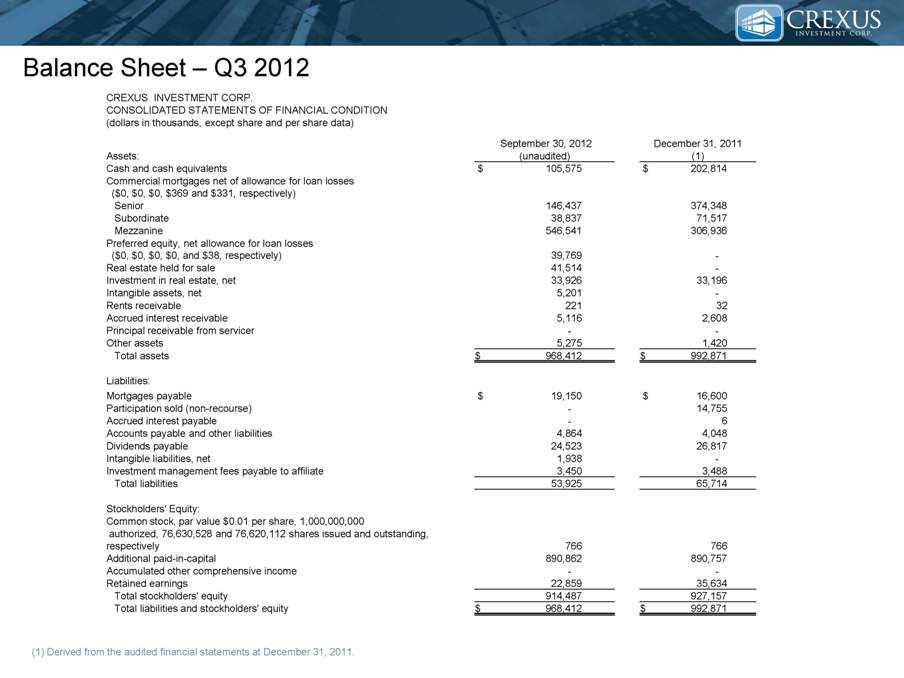
Balance Sheet – Q3 2012 (1) Derived from the audited financial statements at December 31, 2011. CREXUS INVESTMENT CORP. CONSOLIDATED STATEMENTS OF FINANCIAL CONDITION (dollars in thousands, except share and per share data) September 30, 2012 December 31, 2011 Assets: (unaudited) (1) Cash and cash equivalents $ 105,575 $ 202,814 Commercial mortgages net of allowance for loan losses ($0, $0, $0, $369 and $331, respectively) Senior 146,437 374,348 Subordinate 38,837 71,517 Mezzanine 546,541 306,936 Preferred equity, net allowance for loan losses ($0, $0, $0, $0, and $38, respectively) 39,769 - Real estate held for sale 41,514 - Investment in real estate, net 33,926 33,196 Intangible assets, net 5,201 - Rents receivable 221 32 Accrued interest receivable 5,116 2,608 Principal receivable from servicer - - Other assets 5,275 1,420 Total assets $ 968,412 $ 992,871 Liabilities: Mortgages payable $ 19,150 $ 16,600 Participation sold (non-recourse) - 14,755 Accrued interest payable - 6 Accounts payable and other liabilities 4,864 4,048 Dividends payable 24,523 26,817 Intangible liabilities, net 1,938 - Investment management fees payable to affiliate 3,450 3,488 Total liabilities 53,925 65,714 Stockholders' Equity: Common stock, par value $0.01 per share, 1,000,000,000 authorized, 76,630,528 and 76,620,112 shares issued and outstanding, respectively 766 766 Additional paid-in-capital 890,862 890,757 Accumulated other comprehensive income - - Retained earnings 22,859 35,634 Total stockholders' equity 914,487 927,157 Total liabilities and stockholders' equity $ 968,412 $ 992,871
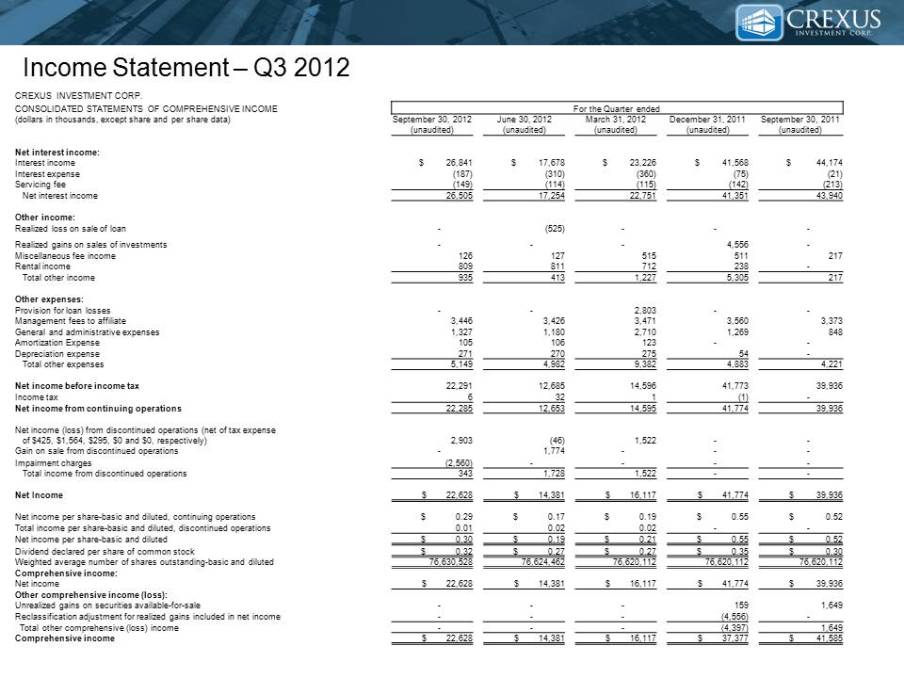
Income Statement – Q3 2012 CREXUS INVESTMENT CORP. CONSOLIDATED STATEMENTS OF COMPREHENSIVE INCOME For the Quarter ended (dollars in thousands, except share and per share data) September 30, 2012 (unaudited) June 30, 2012 (unaudited) March 31, 2012 (unaudited) December 31, 2011 (unaudited) September 30, 2011 (unaudited) Net interest income: Interest income $ 26,841 $ 17,678 $ 23,226 $ 41,568 $ 44,174 Interest expense (187) (310) (360) (75) (21) Servicing fee (149) (114) (115) (142) (213) Net interest income 26,505 17,254 22,751 41,351 43,940 Other income: Realized loss on sale of loan - (525) - - - Realized gains on sales of investments - - - 4,556 - Miscellaneous fee income 126 127 515 511 217 Rental income 809 811 712 238 - Total other income 935 413 1,227 5,305 217 Other expenses: Provision for loan losses - - 2,803 - - Management fees to affiliate 3,446 3,426 3,471 3,560 3,373 General and administrative expenses 1,327 1,180 2,710 1,269 848 Amortization Expense 105 106 123 - - Depreciation expense 271 270 275 54 - Total other expenses 5,149 4,982 9,382 4,883 4,221 Net income before income tax 22,291 12,685 14,596 41,773 39,936 Income tax 6 32 1 1 - Net income from continuing operations 22,285 12,653 14,595 41,774 39,936 Net income (loss) from discontinued operations (net of tax expense of $425, $1,564, $295, $0 and $0, respectively) 2,903 (46) 1,522 - - Gain on sale from discontinued operations - 1,774 - - - Impairment charges (2,560) - - - - Total income from discontinued operations 343 1,728 1,522 - - Net Income $ 22,628 $ 14,381 $ 16,117 $ 41,774 $ 39,936 Net income per share-basic and diluted, continuing operations $ 0.29 $ 0.17 $ 0.19 $ 0.55 $ 0.52 Total income per share-basic and diluted, discontinued operations 0.01 0.02 0.02 - - Net income per share-basic and diluted $ 0.30 $ 0.19 $ 0.21 $ 0.55 $ 0.52 Dividend declared per share of common stock $ 0.32 $ 0.27 $ 0.27 $ 0.35 $ 0.30 Weighted average number of shares outstanding-basic and diluted 76,630,528 76,624,462 76,620,112 76,620,112 76,620,112 Comprehensive income: Net income $ 22,628 $ 14,381 $ 16,117 $ 41,774 $ 39,936 Other comprehensive income (loss): Unrealized gains on securities available-for-sale - - - 159 1,649 Reclassification adjustment for realized gains included in net income - - - (4,556) - Total other comprehensive (loss) income - - - (4,397) 1,649 Comprehensive income $ 22,628 $ 14,381 $ 16,117 $ 37,377 $ 41,585