Attached files
| file | filename |
|---|---|
| 8-K - SHENANDOAH TELECOMMUNICATIONS COMPANY 8-K 11-2-2012 - SHENANDOAH TELECOMMUNICATIONS CO/VA/ | form8k.htm |

November 2, 2012
3Q 2012
Earnings Conference Call
Earnings Conference Call
Exhibit 99.1

2
Safe Harbor Statement
This presentation includes “forward-looking statements” within the meaning of Section 27A of
the Securities Act and Section 21E of the Securities Exchange Act of 1934, as amended,
regarding, among other things, our business strategy, our prospects and our financial position.
These statements can be identified by the use of forward-looking terminology such as
“believes,” “estimates,” “expects,” “intends,” “may,” “will,” “should,” “could,” or “anticipates” or
the negative or other variation of these similar words, or by discussions of strategy or risks and
uncertainties. These statements are based on current expectations of future events. If
underlying assumptions prove inaccurate or unknown risks or uncertainties materialize, actual
results could vary materially from the Company’s expectations and projections. Important
factors that could cause actual results to differ materially from such forward-looking statements
include, without limitation, risks related to the following:
q Increasing competition in the communications industry; and
q A complex and uncertain regulatory environment.
A further list and description of these risks, uncertainties and other factors can be found in the
Company’s SEC filings which are available online at www.sec.gov, www.shentel.com or on
request from the Company. The Company does not undertake to update any forward-looking
statements as a result of new information or future events or developments.
Company’s SEC filings which are available online at www.sec.gov, www.shentel.com or on
request from the Company. The Company does not undertake to update any forward-looking
statements as a result of new information or future events or developments.

3
Use of Non-GAAP Financial Measures
Included in this presentation are certain non-GAAP financial measures that are not determined
in accordance with US generally accepted accounting principles. These financial performance
measures are not indicative of cash provided or used by operating activities and exclude the
effects of certain operating, capital and financing costs and may differ from comparable
information provided by other companies, and they should not be considered in isolation, as an
alternative to, or more meaningful than measures of financial performance determined in
accordance with US generally accepted accounting principles. These financial performance
measures are commonly used in the industry and are presented because Shentel believes they
provide relevant and useful information to investors. Shentel utilizes these financial
performance measures to assess its ability to meet future capital expenditure and working
capital requirements, to incur indebtedness if necessary, return investment to shareholders and
to fund continued growth. Shentel also uses these financial performance measures to
evaluate the performance of its businesses and for budget planning purposes.

4
President and CEO

5
Recent Events
n SoftBank to Acquire 70% Stake in Sprint
§ Shentel affiliate agreement survives Sprint change in control
§ Affiliate agreement initial term to 2024
n Annual Dividend
§ Declared a cash dividend of $0.33 per share
§ Payable November 30, 2012
§ 53rd consecutive year of annual dividends
§ Total payout to shareholders will be approximately $7.9 million

6
2012 Financial Highlights
Net Income
($ millions)
Net Income from Continuing Operations
($ millions)
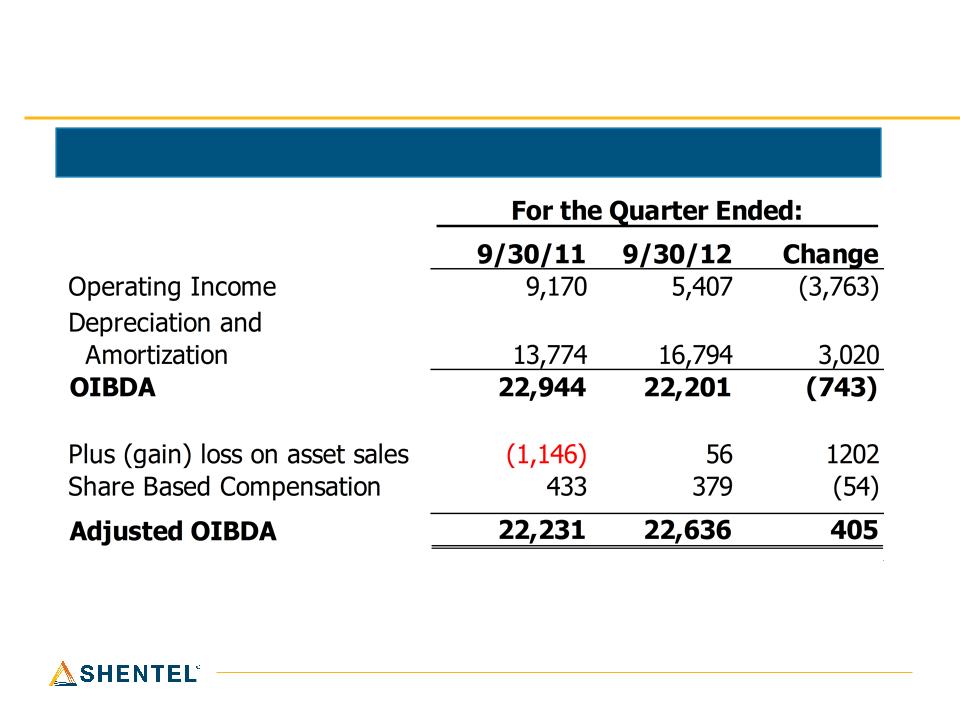
q Depreciation
Up $3.0 million from 3Q 2011
Up $3.0 million from 3Q 2011
q PCS Equipment Trade-in
3Q 2011 gain of $1.4 million
3Q 2011 gain of $1.4 million
q Unamortized Loan Costs
3Q 2012 write-off $0.8 million of costs
remaining from 2010 loan
3Q 2012 write-off $0.8 million of costs
remaining from 2010 loan
q Income Taxes
3Q 2012 effective tax rate of 59% due to
one-time adjustment of 2011 tax expense
estimates
3Q 2012 effective tax rate of 59% due to
one-time adjustment of 2011 tax expense
estimates
q Major Storm Repairs
3Q 2012 repair costs of $0.5 million
3Q 2012 repair costs of $0.5 million
q Revenue Growth - 16% increase
over 3Q 2011 to $72.9 million
over 3Q 2011 to $72.9 million

7
Wireless Highlights
PCS Customers (000s)
q Steady Postpaid growth
Postpaid customers up 6.3% in
the last year
Postpaid customers up 6.3% in
the last year
q Rapid Prepaid Growth Q3’12
net additions of 5,384; 122k
prepaid subs at 9/30
net additions of 5,384; 122k
prepaid subs at 9/30
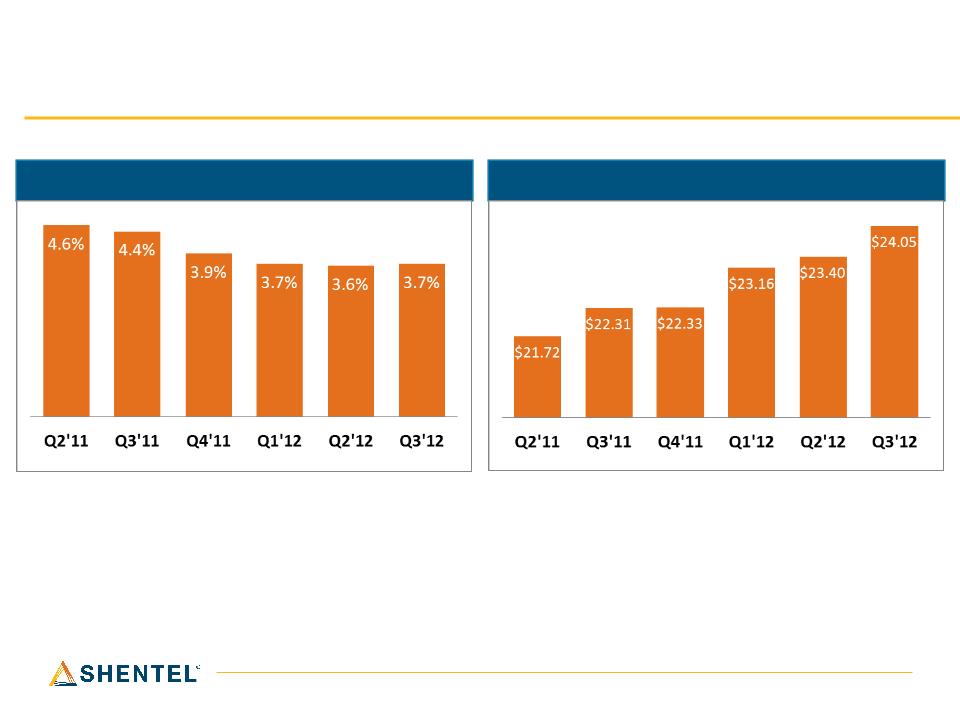
q Prepaid Churn improves
Q3’12 churn of 3.73%
compared to 4.43% for Q3’11
Q3’12 churn of 3.73%
compared to 4.43% for Q3’11

8
Cable Highlights
n RGU Growth
n Year-over-year RGU growth of 2.7% at 9/30/2012
n 139,399 RGUs at 9/30/2012
n Cable Upgrades
n Started the final planned upgrade to markets acquired in
mid-2010.
mid-2010.
n End of 2012 completion target now delayed due to weather

9
VP of Finance and CFO

10
Restructured Credit Facility
§ Term loan of $232 million fully drawn
§ Incremental proceeds of $60 million used primarily to fund 4G
§ $120.75 million unamortized due at maturity on 9/30/2019
§ The $230 million variable portion bears LIBOR + 2.75% interest
§ 75% of the variable portion hedged at 3.88%
§ Most of the remainder covered by existing swap at 4% fixed
§ $50 million undrawn revolver
§ $100 million undrawn accordion
§ Covenants revised based on 4G expectations
11
Profitability
Adjusted OIBDA ($ thousands)

12
Adjusted OIBDA by Segment ($millions)

13
Wireless Segment - Change in Adjusted OIBDA
Q3’12 vs. Q3’11 ($ millions)
Q3’12 vs. Q3’11 ($ millions)

14
Cable Segment - Change in Adjusted OIBDA
Q3’12 vs. Q3’11 ($ millions)
Q3’12 vs. Q3’11 ($ millions)

15
EVP and COO

16
Key Operational Results - Wireless
PCS Postpaid Customers (000s)

17
Key Operational Results - Wireless
Gross Additions - Postpaid
Net Additions - Postpaid
n Net adds of 3,842 in Q3 2012
versus 2,686 in Q3 2011
versus 2,686 in Q3 2011
n Q3 2012 churn of 1.89% up
from 1.85% in Q3 2011
from 1.85% in Q3 2011
n Shentel-controlled channels
produced 47% of gross adds in
Q3 2012 and 50% in Q3 2011
produced 47% of gross adds in
Q3 2012 and 50% in Q3 2011
18
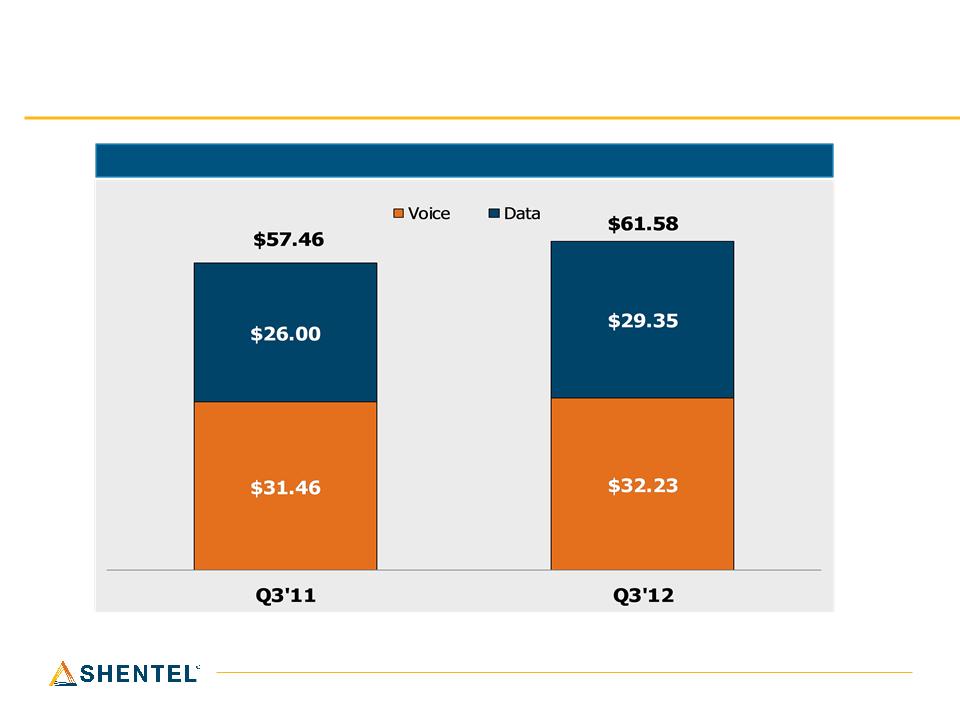
Key Operational Results - PCS
Gross Billed Revenue per Postpaid User - Data & Voice 1

19
PCS Revenues
Gross Billed Revenues - Postpaid ($ millions)


21
iPhone Statistics - Q3’12
n 21% of Q3 Gross Adds
n 41% of iPhones were sold or upgraded in Shentel-
controlled channels
controlled channels
n 13.2% of 9/30/2012 Postpaid customers had the
iPhone, up from 9.8% at 6/30/12
iPhone, up from 9.8% at 6/30/12
n 58% iPhone 4S
n 39% iPhone 4
n 3% iPhone 5

22
PCS Prepaid Statistics
Gross Additions (000s)
Cumulative Customers (000s)
23
PCS Prepaid Statistics
Churn %
Average Gross Billed Revenue

24
Cable - RGU Growth by Quarter

25
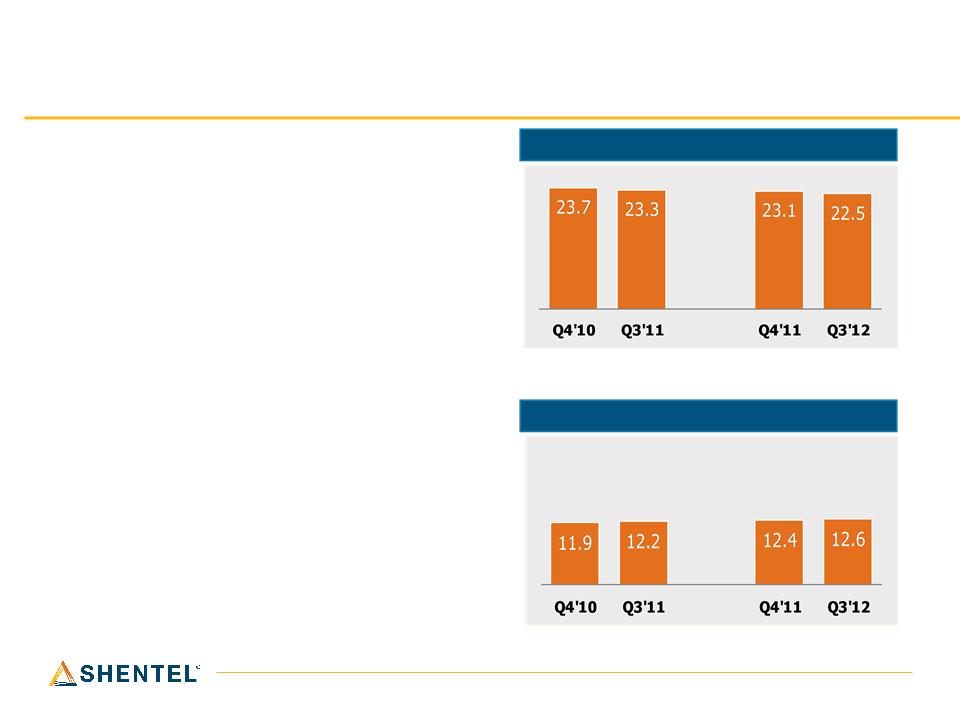
Cable Statistics
Average Monthly Revenue per RGU
Average Monthly Revenue per Customer*
*Average monthly revenue per video subscriber was $78.71 and $94.92 for Q3 2011 and Q3 2012, respectively.
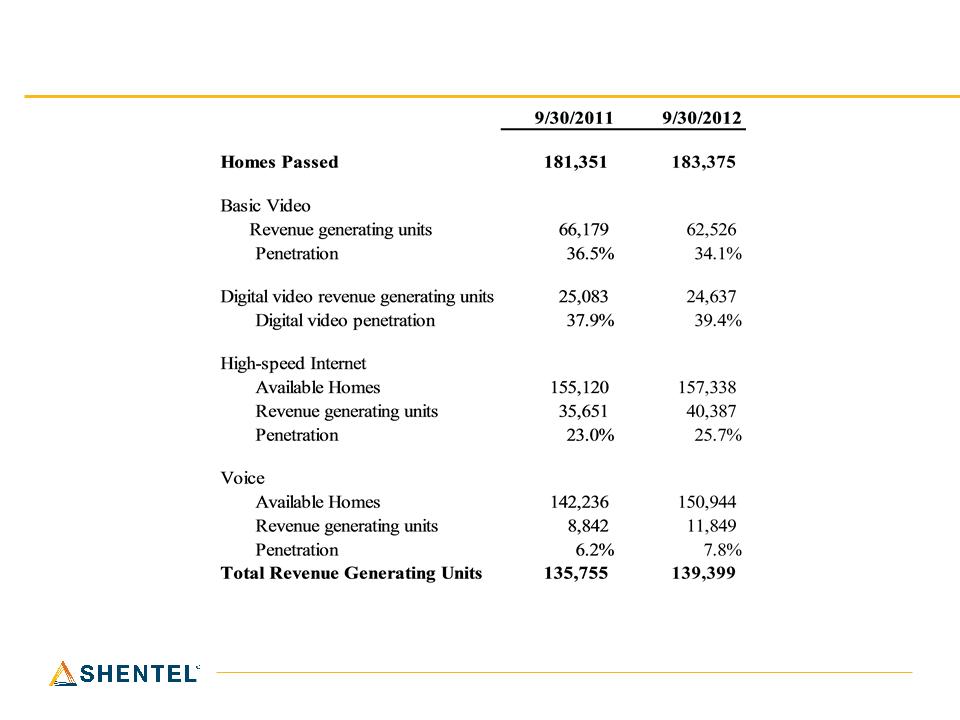
26
Key Operational Results - Cable
Note: Video homes passed includes 16K homes located in Shenandoah County, VA, where internet and voice
services are provided by the Wireline segment.
services are provided by the Wireline segment.
27
Key Operational Results - Wireline
n Access line loss of 3.4%
in past 12 months
in past 12 months
n Broadband penetration in
LEC area at 56%
LEC area at 56%
n 2.5% growth in DSL
customers since
09/30/2011. Total
connections at 9/30/12 of
35.1 thousand
customers since
09/30/2011. Total
connections at 9/30/12 of
35.1 thousand
Access lines (000s)
DSL Customers (000s)

28
Investing in the Future
n Last Cable upgrade of 10,000
homes passed is underway
and expected to be complete
in 2013.
homes passed is underway
and expected to be complete
in 2013.
n Network Vision now expected
at $55M in 2012 and $60M in
2013.
at $55M in 2012 and $60M in
2013.
Capex Spending ($ millions)

29
Q&A

30
Appendix

31
Non-GAAP Financial Measure -
Billed Revenue per Postpaid Subscriber
Billed Revenue per Postpaid Subscriber