Attached files
| file | filename |
|---|---|
| 8-K - FORM 8-K - ONCOR ELECTRIC DELIVERY CO LLC | d429404d8k.htm |
Exhibit 99.1
Oncor Electric Delivery
Third Quarter 2012
Investor Call
November 2, 2012
Oncor Electric Delivery 1
Forward Looking Statements
This presentation contains forward-looking statements, which are subject to various risks and
uncertainties. Discussion of risks and uncertainties that could cause actual results to differ materially from
management’s current projections, forecasts, estimates and expectations is contained in filings made by
Oncor Electric Delivery Company LLC (Oncor) with the Securities and Exchange Commission
(SEC). Specifically, Oncor makes reference to the section entitled “Risk Factors” in its annual and quarterly
reports. In addition to the risks and uncertainties set forth in Oncor’s SEC filings, the forward-looking
statements in this presentation could be affected by, among other things: prevailing governmental policies
and regulatory actions; legal and administrative proceedings and settlements, including the exercise of
equitable powers by courts; weather conditions and other natural phenomena; acts of sabotage, wars or
terrorist or cyber security threats or activities; economic conditions, including the impact of a recessionary
environment; unanticipated population growth or decline, or changes in market demand and demographic
patterns; changes in business strategy, development plans or vendor relationships; unanticipated changes in
interest rates or rates of inflation; unanticipated changes in operating expenses, liquidity needs and capital
expenditures; inability of various counterparties to meet their financial obligations to Oncor, including failure
of counterparties to perform under agreements; general industry trends; hazards customary to the industry
and the possibility that Oncor may not have adequate insurance to cover losses resulting from such hazards;
changes in technology used by and services offered by Oncor; significant changes in Oncor’s relationship
with its employees; changes in assumptions used to estimate costs of providing employee benefits, including
pension and other post-retirement employee benefits, and future funding requirements related thereto;
significant changes in critical accounting policies material to Oncor; commercial bank and financial market
conditions, access to capital, the cost of such capital, and the results of financing and refinancing efforts,
including availability of funds in the capital markets and the potential impact of disruptions in US credit
markets; circumstances which may contribute to future impairment of goodwill, intangible or other long-lived
assets; financial restrictions under Oncor’s revolving credit facility and indentures governing its debt
instruments; Oncor’s ability to generate sufficient cash flow to make interest payments on its debt
instruments; actions by credit rating agencies; and Oncor’s ability to effectively execute its operational
strategy. Any forward-looking statement speaks only as of the date on which it is made, and Oncor undertakes
no obligation to update any forward-looking statement to reflect events or circumstances after the date on
which it is made or to reflect the occurrence of unanticipated events.
Regulation G
This presentation includes certain non-GAAP financial measures. A reconciliation of these measures to the
most directly comparable GAAP measures is included in this presentation, which is available on Oncor’s
website, www.oncor.com, in the Investor section, and also filed with the SEC.
Oncor Electric Delivery 2
3rd Quarter 2012 Investor Call Agenda
?Financial Overview David Davis
Chief Financial Officer
?Operational Review Bob Shapard
Chairman and CEO
?Q&A
Oncor Electric Delivery 3
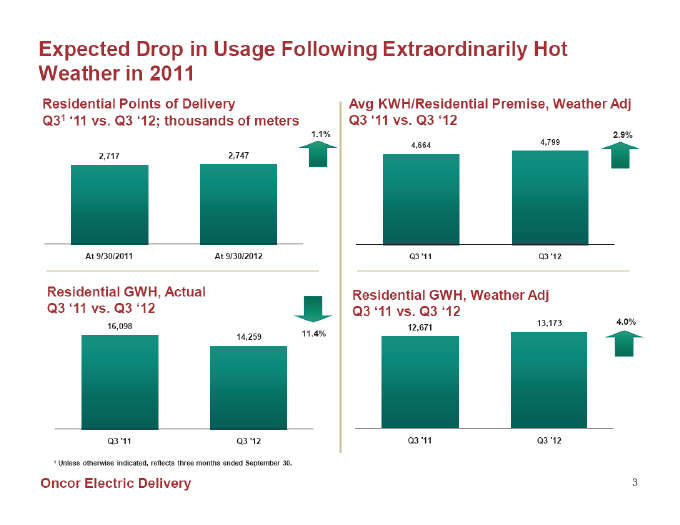
Expected Drop in Usage Following Extraordinarily Hot
Weather in 2011
Avg KWH/Residential Premise, Weather Adj
Q3 ‘11 vs. Q3 ‘12
Residential GWH, Actual
Q3 ‘11 vs. Q3 ‘12
Residential Points of Delivery
Q31 ‘11 vs. Q3 ‘12; thousands of meters
Residential GWH, Weather Adj
Q3 ‘11 vs. Q3 ‘12
16,098
14,259
Q3 ‘11 Q3 ‘12
4,664 4,799
Q3 ‘11 Q3 ‘12
12,671 13,173
Q3 ‘11 Q3 ‘12
2,717 2,747
At 9/30/2011 At 9/30/2012
11.4%
1.1%
4.0%
2.9%
1 Unless otherwise indicated, reflects three months ended September 30.
Oncor Electric Delivery 4
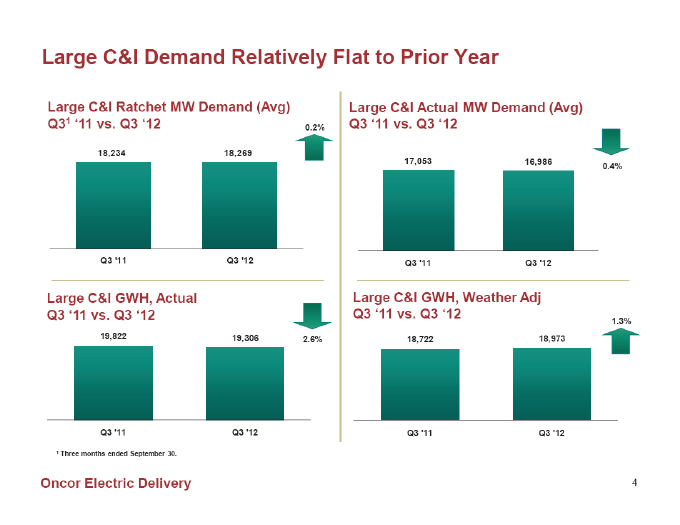
Large C&I Demand Relatively Flat to Prior Year
Large C&I GWH, Actual
Q3 ‘11 vs. Q3 ‘12
Large C&I GWH, Weather Adj
Q3 ‘11 vs. Q3 ‘12
18,722 18,973
Q3 ‘11 Q3 ‘12
0.2%
0.4%
18,234 18,269
Q3 ‘11 Q3 ‘12
Large C&I Ratchet MW Demand (Avg)
Q31 ‘11 vs. Q3 ‘12
19,822 19,306
Q3 ‘11 Q3 ‘12
17,053 16,986
Q3 ‘11 Q3 ‘12
Large C&I Actual MW Demand (Avg)
Q3 ‘11 vs. Q3 ‘12
2.6%
1.3%
1 Three months ended September 30.
Oncor Electric Delivery 5
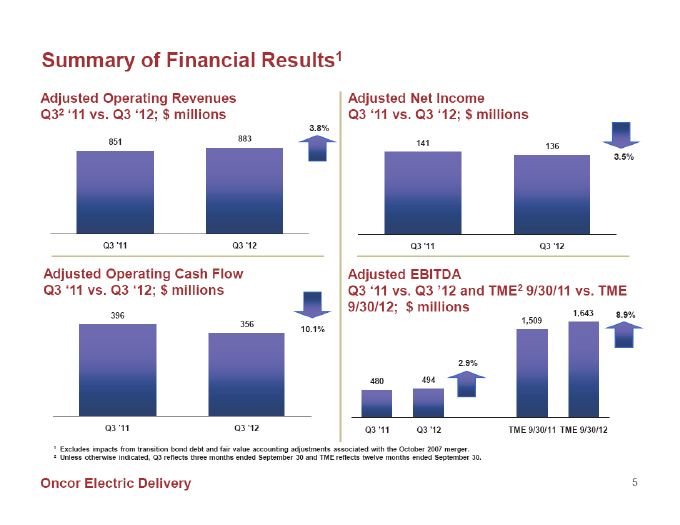
Summary of Financial Results1
Adjusted Net Income
Q3 ‘11 vs. Q3 ‘12; $ millions
141 136
Q3 ‘11 Q3 ‘12
Adjusted Operating Revenues
Q32 ‘11 vs. Q3 ‘12; $ millions
851 883
Q3 ‘11 Q3 ‘12
Adjusted Operating Cash Flow
Q3 ‘11 vs. Q3 ‘12; $ millions
396
356
Q3 ‘11 Q3 ‘12
1 Excludes impacts from transition bond debt and fair value accounting adjustments associated with the October 2007 merger.
2 Unless otherwise indicated, Q3 reflects three months ended September 30 and TME reflects twelve months ended September 30.
3.8%
8.9%
3.5%
10.1%
480 494
1,509
1,643
Q3 ‘11 Q3 ‘12 TME 9/30/11 TME 9/30/12
2.9%
Adjusted EBITDA
Q3 ‘11 vs. Q3 ‘12 and TME2 9/30/11 vs. TME
9/30/12; $ millions
Oncor Electric Delivery 6
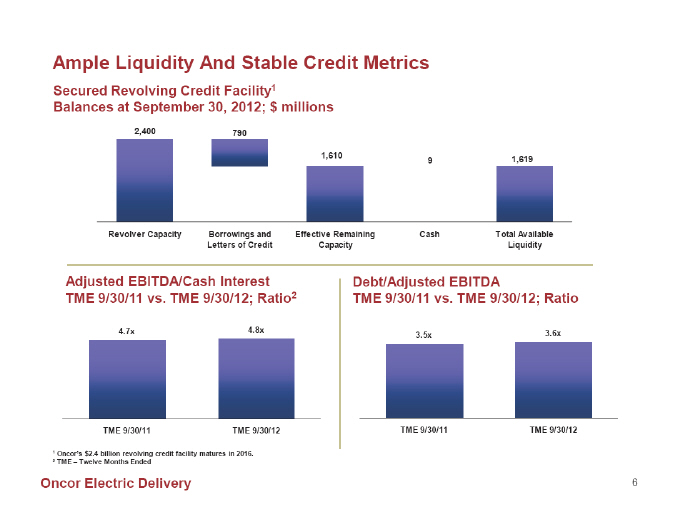
Ample Liquidity And Stable Credit Metrics
Revolver Capacity Borrowings and
Letters of Credit
Effective Remaining
Capacity
Cash Total Available
Liquidity
Secured Revolving Credit Facility1
Balances at September 30, 2012; $ millions
2,400 790
1,610 9 1,619
1 Oncor’s $2.4 billion revolving credit facility matures in 2016.
2 TME – Twelve Months Ended
4.7x 4.8x
TME 9/30/11 TME 9/30/12
Adjusted EBITDA/Cash Interest
TME 9/30/11 vs. TME 9/30/12; Ratio2
Debt/Adjusted EBITDA
TME 9/30/11 vs. TME 9/30/12; Ratio
3.5x 3.6x
TME 9/30/11 TME 9/30/12
Oncor Electric Delivery 7
3rd Quarter 2012 Investor Call Agenda
?Financial Overview David Davis
Chief Financial Officer
?Operational Review Bob Shapard
Chairman and CEO
?Q&A
Oncor Electric Delivery 8
Appendix -
Regulation G Reconciliations and Supplemental
Data
Oncor Electric Delivery 9
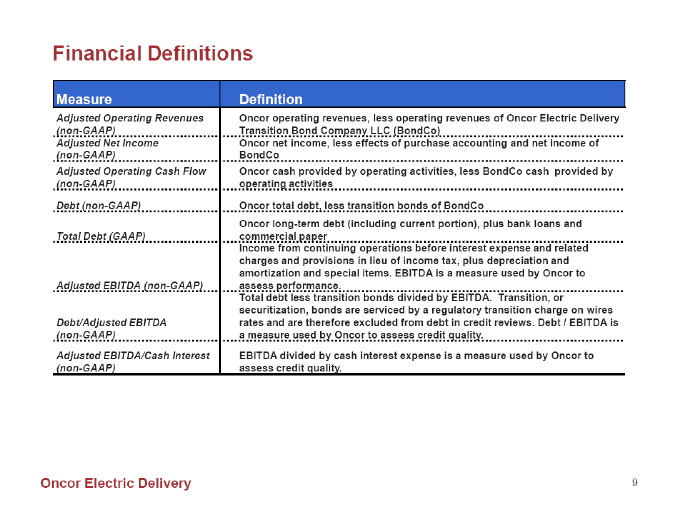
Measure Definition
Adjusted Operating Revenues
(non-GAAP)
Oncor operating revenues, less operating revenues of Oncor Electric Delivery
Transition Bond Company LLC (BondCo)
Adjusted Net Income
(non-GAAP)
Oncor net income, less effects of purchase accounting and net income of
BondCo
Adjusted Operating Cash Flow
(non-GAAP)
Oncor cash provided by operating activities, less BondCo cash provided by
operating activities
Debt (non-GAAP) Oncor total debt, less transition bonds of BondCo
Total Debt (GAAP)
Oncor long-term debt (including current portion), plus bank loans and
commercial paper
Adjusted EBITDA (non-GAAP)
Income from continuing operations before interest expense and related
charges and provisions in lieu of income tax, plus depreciation and
amortization and special items. EBITDA is a measure used by Oncor to
assess performance.
Debt/Adjusted EBITDA
(non-GAAP)
Total debt less transition bonds divided by EBITDA. Transition, or
securitization, bonds are serviced by a regulatory transition charge on wires
rates and are therefore excluded from debt in credit reviews. Debt / EBITDA is
a measure used by Oncor to assess credit quality.
Adjusted EBITDA/Cash Interest
(non-GAAP)
EBITDA divided by cash interest expense is a measure used by Oncor to
assess credit quality.
Financial Definitions
Oncor Electric Delivery 10
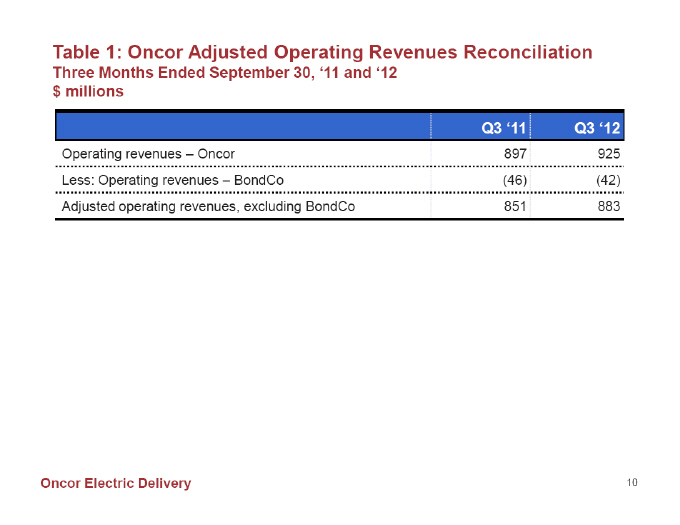
Table 1: Oncor Adjusted Operating Revenues Reconciliation
Three Months Ended September 30, ‘11 and ‘12
$ millions
Q3 ‘11 Q3 ‘12
Operating revenues – Oncor 897 925
Less: Operating revenues – BondCo (46) (42)
Adjusted operating revenues, excluding BondCo 851 883

Oncor Electric Delivery 11
Q3 ‘11 Q3 ‘12
Net income – Oncor 144 139
Less: Effects of fair value accounting (after tax) (3) (3)
Less: Bondco net income—-
Adjusted net income, excluding BondCo 141 136
Table 2: Oncor Adjusted Net Income Reconciliation
Three Months Ended September 30, ‘11 and ‘12
$ millions
Oncor Electric Delivery 12
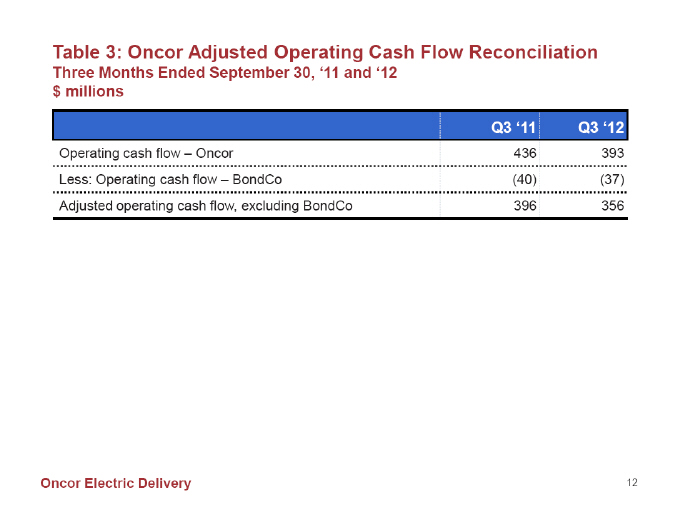
Table 3: Oncor Adjusted Operating Cash Flow Reconciliation
Three Months Ended September 30, ‘11 and ‘12
$ millions
Q3 ‘11 Q3 ‘12
Operating cash flow – Oncor 436 393
Less: Operating cash flow – BondCo (40) (37)
Adjusted operating cash flow, excluding BondCo 396 356
Oncor Electric Delivery 13
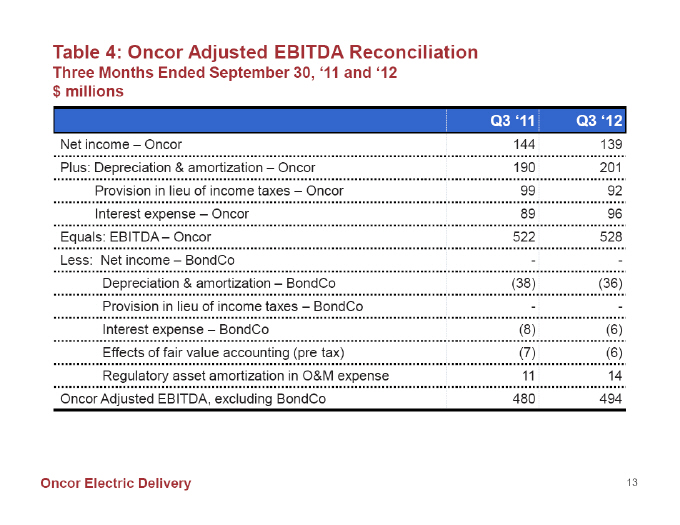
Table 4: Oncor Adjusted EBITDA Reconciliation
Three Months Ended September 30, ‘11 and ‘12
$ millions
Q3 ‘11 Q3 ‘12
Net income – Oncor 144 139
Plus: Depreciation & amortization – Oncor 190 201
Provision in lieu of income taxes – Oncor 99 92
Interest expense – Oncor 89 96
Equals: EBITDA – Oncor 522 528
Less: Net income – BondCo—-
Depreciation & amortization – BondCo (38) (36)
Provision in lieu of income taxes – BondCo—-
Interest expense – BondCo (8) (6)
Effects of fair value accounting (pre tax) (7) (6)
Regulatory asset amortization in O&M expense 11 14
Oncor Adjusted EBITDA, excluding BondCo 480 494
Oncor Electric Delivery 14
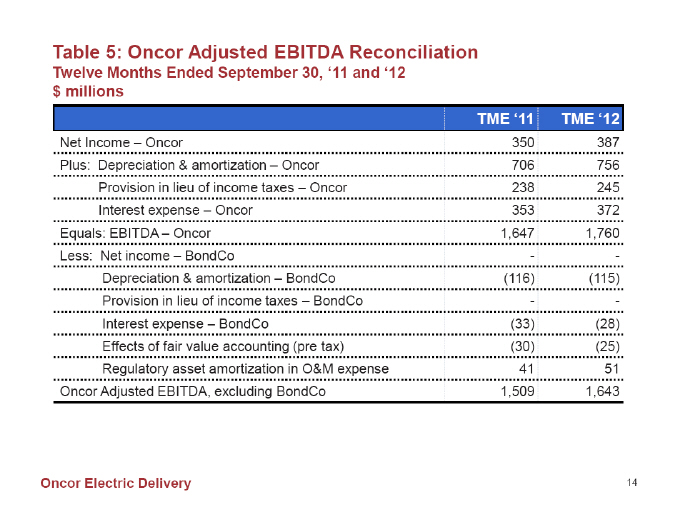
Table 5: Oncor Adjusted EBITDA Reconciliation
Twelve Months Ended September 30, ‘11 and ‘12
$ millions
TME ‘11 TME ‘12
Net Income – Oncor 350 387
Plus: Depreciation & amortization – Oncor 706 756
Provision in lieu of income taxes – Oncor 238 245
Interest expense – Oncor 353 372
Equals: EBITDA – Oncor 1,647 1,760
Less: Net income – BondCo—-
Depreciation & amortization – BondCo (116) (115)
Provision in lieu of income taxes – BondCo—-
Interest expense – BondCo (33) (28)
Effects of fair value accounting (pre tax) (30) (25)
Regulatory asset amortization in O&M expense 41 51
Oncor Adjusted EBITDA, excluding BondCo 1,509 1,643
Oncor Electric Delivery 15
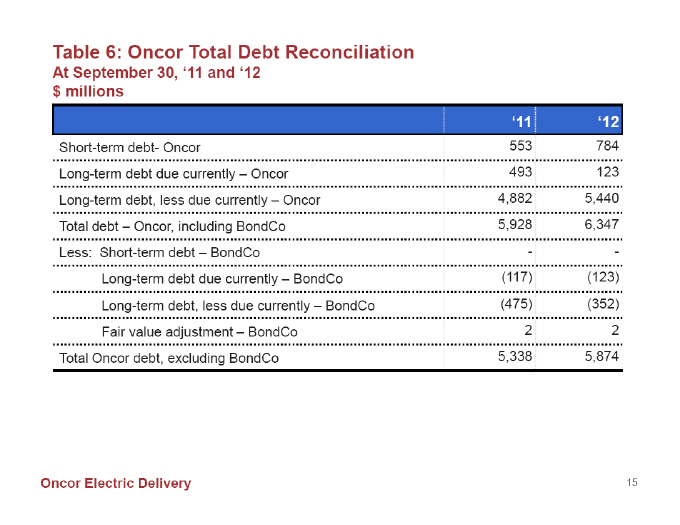
Table 6: Oncor Total Debt Reconciliation
At September 30, ‘11 and ‘12
$ millions
‘11 ‘12
Short-term debt- Oncor 553 784
Long-term debt due currently – Oncor 493 123
Long-term debt, less due currently – Oncor 4,882 5,440
Total debt – Oncor, including BondCo 5,928 6,347
Less: Short-term debt – BondCo—-
Long-term debt due currently – BondCo (117) (123)
Long-term debt, less due currently – BondCo (475) (352)
Fair value adjustment – BondCo 2 2
Total Oncor debt, excluding BondCo 5,338 5,874
Oncor Electric Delivery 16
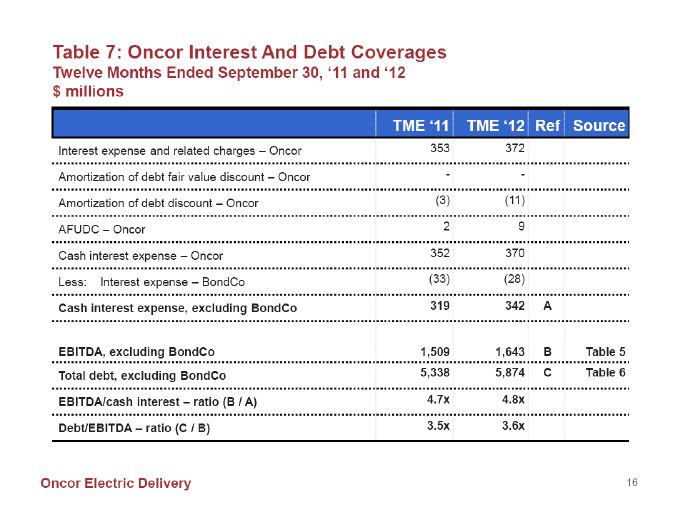
Table 7: Oncor Interest And Debt Coverages
Twelve Months Ended September 30, ‘11 and ‘12
$ millions
TME ‘11 TME ‘12 Ref Source
Interest expense and related charges – Oncor 353 372
Amortization of debt fair value discount – Oncor—-
Amortization of debt discount – Oncor (3) (11)
AFUDC – Oncor 2 9
Cash interest expense – Oncor 352 370
Less: Interest expense – BondCo (33) (28)
Cash interest expense, excluding BondCo 319 342 A
EBITDA, excluding BondCo 1,509 1,643 B Table 5
Total debt, excluding BondCo 5,338 5,874 C Table 6
EBITDA/cash interest – ratio (B / A) 4.7x 4.8x
Debt/EBITDA – ratio (C / B) 3.5x 3.6x