Attached files
| file | filename |
|---|---|
| 8-K - 8-K - HARLAND CLARKE HOLDINGS CORP | hchc-20129308k.htm |
| EX-99.1 - EARNINGS RELEASE Q3 2010 - HARLAND CLARKE HOLDINGS CORP | a991q3-2012hchc.htm |

Harland Clarke Holdings Corp. Q3 2012 Supplemental Financial Information November 2, 2012

Harland Clarke Holdings Corp. Adjusted Revenue and EBITDA Summary 1 Unaudited ($ in millions) Q2 2012 Q3 2012 Q3 2011 Q3 YTD 2012 Q3 YTD 2011 Adjusted Revenues Harland Clarke segment 273.4$ 280.1$ 285.3$ 843.0$ 852.7$ Harland Financial Solutions segment 69.5 72.5 72.6 211.7 220.6 Scantron segment 29.7 30.2 33.7 94.5 99.8 Faneuil segment 39.4 42.1 18.0 120.1 52.3 Eliminations (0.6) (0.6) (0.2) (1.7) (0.4) Total 411.4$ 424.3$ 409.4$ 1,267.6$ 1,225.0$ Adjusted EBITDA Harland Clarke segment 78.8$ 93.0$ 89.3$ 256.5$ 258.2$ Harland Financial Solutions segment 23.0 23.2 20.2 65.2 66.3 Scantron segment 2.6 7.1 7.2 8.7 12.6 Faneuil segment 7.4 8.3 5.2 21.3 15.4 Corporate (3.9) (3.6) (3.5) (11.9) (11.8) Total 107.9$ 128.0$ 118.4$ 339.8$ 340.7$ Note: • Reconciliations to Adjusted Revenues and Adjusted EBITDA are included in the appendix • Although the acquisition of Faneuil Inc. (“Faneuil”) by Harland Clarke Holdings Corp. (the “Company”) closed on March 19, 2012, the Company has included Faneuil’s operations in its consolidated results for the entire nine months of 2012 as required by GAAP since Faneuil and the Company were under common control during the pre-acquisition period. Faneuil’s operations are not included in the Company’s results for the third quarter 2011 or year-to-date 2011.

2 Appendix

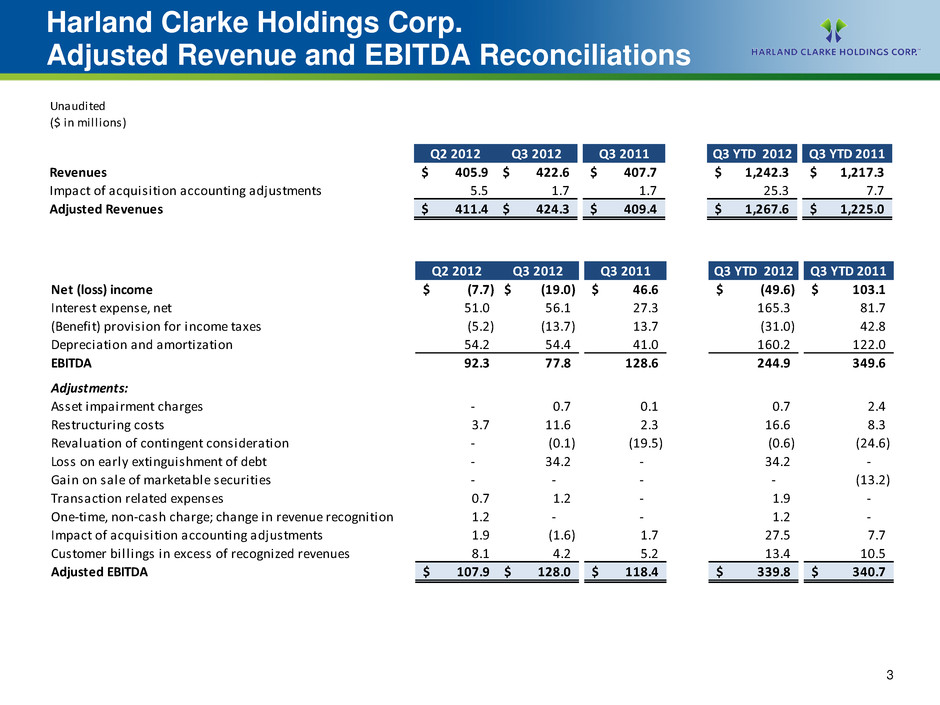
Harland Clarke Holdings Corp. Adjusted Revenue and EBITDA Reconciliations 3 Unaudited ($ in millions) Q2 2012 Q3 2012 Q3 2011 Q3 YTD 2012 Q3 YTD 2011 Revenues 405.9$ 422.6$ 407.7$ 1,242.3$ 1,217.3$ Impact of acquisition accounting adjustments .5 1.7 1. 25. .7 Adjusted Revenues 411.4$ 424.3$ 409.4$ 1,267.6$ 1,225.0$ Q2 2012 Q3 2012 Q3 2011 Q3 YTD 2012 Q3 YTD 2011 Net (loss) income (7.7)$ (19.0)$ 46.6$ (49.6)$ 103.1$ Interest expense, net 51.0 56.1 27.3 165.3 81.7 (Benefit) provision for income taxes (5.2) (13.7) 13.7 (31.0) 42.8 Depreciation and amortization 54.2 54.4 41.0 160.2 122.0 EBITDA 92.3 77.8 128.6 244.9 349.6 Adjustments: Ass t impairment charges - 0.7 0.1 0.7 2.4 Restructuring costs 3.7 11.6 2.3 16.6 8.3 Revaluation of contingent consideration - (0.1) (19.5) (0.6) (24.6) Loss on early ext nguishment of debt - 3 2 - 34 2 - Gain on sale of marketable securities - - - - (13.2) Transaction related expenses 0.7 1.2 - 1.9 - One-time, non-cash charge; change in revenue recognition 1.2 - - 1.2 - Impact of acquisition accounting adjustments 1.9 (1.6) 1.7 27.5 7.7 Customer bill ings in excess of recognized revenues 8.1 4.2 5.2 13.4 10.5 Adjusted EBITDA 107.9$ 128.0$ 118.4$ 339.8$ 340.7$

Harland Clarke Segment Adjusted Revenue and EBITDA Reconciliations 4 Unaudited ($ in millions) Q2 2012 Q3 2012 Q3 2011 Q3 YTD 2012 Q3 YTD 2011 Revenues 282.2$ 286.7$ 285.3$ 866.4$ 852.7$ Impact of acquisition accounting adjustments (8.8) ( .6) - (23. ) - Adjusted Revenues 273.4$ 280.1$ 285.3$ 84 .0$ 852.7$ Q2 2012 Q3 2012 Q3 2011 Q3 YTD 2012 Q3 YTD 2011 Operating income 49.8$ 56.6$ 65.8$ 151.8$ 185.8$ Depreciation and amortization 37.2 37.2 23.0 110.5 69.0 EBITDA 7 0 93 8 8 8 2 2 3 2 4 8 j stments: Asset impairment charges - 0.2 0.1 0.2 0.5 Restructuring costs 2.0 6.4 0.4 9.1 3.7 Revaluation of contingent consideration - - - - (0.8) Impact of acquisition accounting adjustments (10.2) (7.4) - (15.1) - Adjusted EBITDA 78.8$ 93.0$ 89.3$ 256.5$ 258.2$

Harland Financial Solutions Segment Adjusted Revenue and EBITDA Reconciliations 5 Unaudited ($ in millions) Q2 2012 Q3 2012 Q3 2011 Q3 YTD 2012 Q3 YTD 2011 Revenues 58.2$ 64.7$ 72.4$ 173.2$ 219.7$ Impact of acquisition accounting adjustments 11.3 7.8 0.2 38.5 0.9 Adjusted Revenues 69.5$ 72.5$ 72.6$ 211.7$ 22 .6$ Q2 2012 Q3 2012 Q3 2011 Q3 YTD 2012 Q3 YTD 2011 Op rating income 1.0$ 7.9$ 13.2$ 1.1$ 45.4$ Depreciation and amortization 9.5 10.0 6.8 28.6 19.9 EBITDA 10.5 17.9 20.0 29.7 65.3 Adjustments: Restructuring cost 0.4 - - 0.4 0.3 Revaluation of contingent consideration - (0.1) (0.3) (0.6) (1.0) One-time, non-cash charge 1.2 - - 1.2 - Impact of acquisition accounting adjustments 9.1 5.3 0.2 31.4 0.9 Customer bill ings in excess of recognized revenues 1.8 0.1 0.3 3.1 0.8 Adjusted EBITDA 23.0$ 23.2$ 20.2$ 65.2$ 66.3$

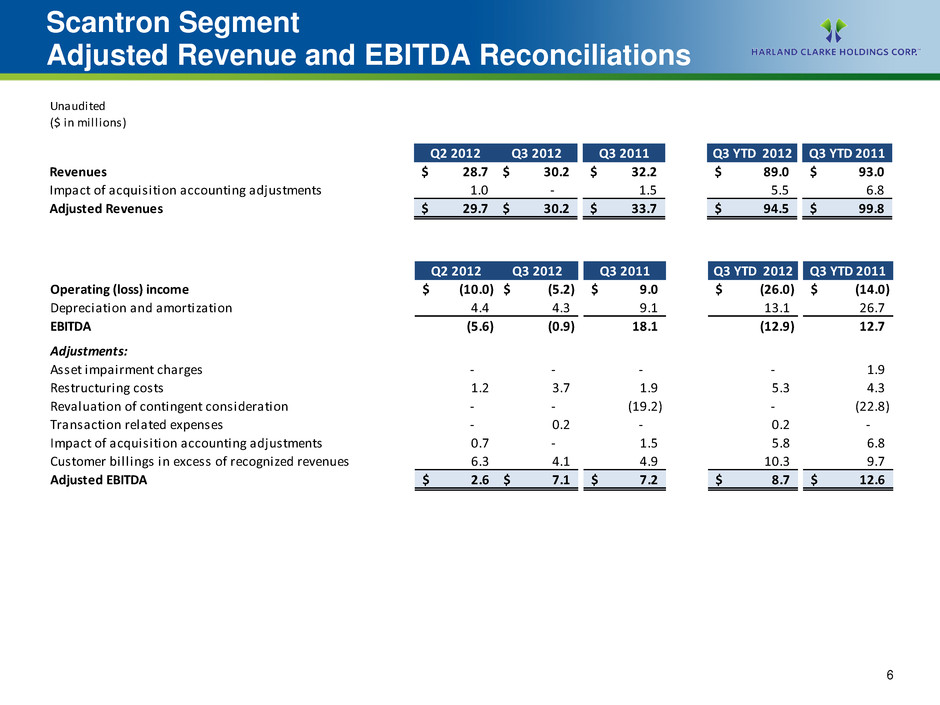
Scantron Segment Adjusted Revenue and EBITDA Reconciliations 6 Unaudited ($ in millions) Q2 2012 Q3 2012 Q3 2011 Q3 YTD 2012 Q3 YTD 2011 Revenues 28.7$ 30.2$ 32.2$ 89.0$ 93.0$ Impact of acquisition accounting adjustments 1.0 - 1.5 5.5 6.8 Adjusted Revenues 29.7$ 30.2$ 33.7$ 94.$ 99.$ Q2 2012 Q3 2012 Q3 2011 Q3 YTD 2012 Q3 YTD 2011 Operating (loss) income (10.0)$ (5.2)$ 9.0$ (26.0)$ (14.0)$ Depreciation and amortization 4.4 4.3 9.1 13.1 26.7 EBITDA (5.6) (0.9) 18.1 (12.9) 12.7 Adjustments: sset impairment charges - - - - 1 9 Restructuring costs 1.2 3.7 1.9 5.3 4.3 Revaluation of contingent consideration - - (19.2) - (22.8) Transaction related expenses - 0.2 - 0.2 - Impact of acquisition accounting adjustments 0.7 - 1.5 5.8 6.8 Customer bill ings in excess of recognized revenues 6.3 4.1 4.9 10.3 9.7 Adjusted EBITDA 2.6$ 7.1$ 7.2$ 8.7$ 12.6$

Faneuil Segment Adjusted Revenue and EBITDA Reconciliations 7 Unaudited ($ in millions) Q2 2012 Q3 2012 Q3 2011 Q3 YTD 2012 Q3 YTD 2011 Revenues 37.4$ 41.6$ 18.0$ 115.4$ 52.3$ Impact of acquisition accounting adjustments 2.0 0.5 - 4.7 - Adjusted Revenues 39.4$ 42.1$ 18.0$ 120.1$ 52.3$ Q2 2012 Q3 2012 Q3 2011 Q3 YTD 2012 Q3 YTD 2011 Operating income 1.9$ 2.9$ 3.1$ 5.6$ 9.0$ D reciation and amortization 3 1 2 9 2 1 8 0 6 4 EBITDA 5 0 5 8 5 2 13 6 15 4 Adjustments: Asset impairment charges - 0.5 - 0.5 - Restructuring costs 0.1 1.5 - 1.8 - Impact of acquisition accounting adjustments 2.3 0.5 - 5.4 - Adjusted EBITDA 7.4$ 8.3$ 5.2$ 21.3$ 15.4$ Note: • Although the acquisition of Faneuil by the Company closed on March 19, 2012, the Company has included Faneuil’s operations in its consolidated results for the entire nine months of 2012 as required by GAAP since Faneuil and the Company were under common control during the pre-acquisition period. Faneuil’s operations are not included in the Company’s results for the third quarter 2011 or year-to-date 2011. The third quarter 2011 and year-to-date 2011 figures only include results from the Harland Technology Services and Medical Device Tracking business.

Corporate Adjusted EBITDA Reconciliation 8 Unaudited ($ in millions) Q2 2012 Q3 2012 Q3 2011 Q3 YTD 2012 Q3 YTD 2011 Operating loss (4.6)$ (4.6)$ (3.5)$ (13.4)$ (11.8)$ D preciation and amortization - - - - - Other expense - - - (0.2) - EBITDA (4.6) (4.6) (3.5) (13.6) (11.8) Adjustments: Transaction related expenses 0.7 1.0 - 1.7 - Adjusted EBITDA (3.9)$ (3.6)$ (3.5)$ (11.9)$ (11.8)$

9
