Attached files
| file | filename |
|---|---|
| 8-K - FORM 8-K - Lumos Networks Corp. | d431651d8k.htm |
| EX-99.1 - EXHIBIT 99.1 - Lumos Networks Corp. | d431651dex991.htm |
 Company Presentation
November 2012
Exhibit 99.2 |
 1
Use of Non-GAAP Financial Measures
Special Note Regarding Forward-Looking Statements
Included in this presentation are certain non-GAAP financial measures that are not
determined in accordance with US generally accepted accounting principles. These
financial performance measures are not indicative of cash provided or used by operating activities and exclude the
effects of certain operating, capital and financing costs and may differ from comparable
information provided by other companies, and they should not be considered in
isolation, as an alternative to, or more meaningful than measures of financial performance determined in
accordance with US generally accepted accounting principles. These financial performance
measures are commonly used in the industry and are presented because Lumos Networks
Corp. believes they provide relevant and useful information to investors. The Company utilizes these
financial performance measures to assess its ability to meet future capital expenditure and
working capital requirements, to incur indebtedness if necessary, and to fund continued
growth. Lumos Networks Corp. uses these financial performance measures to evaluate the performance of
its business, for budget planning purposes and as factors in its employee compensation
programs. Any statements contained in this presentation that are not statements
of historical fact, including statements about our beliefs and expectations, are
forward-looking statements and should be evaluated as such. The words “anticipates,” “believes,” “expects,” “intends,” “plans,” “estimates,”
“targets,” “projects,” “should,” “may,”
“will” and similar words and expressions are intended to identify forward-looking statements. Such
forward-looking statements reflect, among other things, our current expectations, plans
and strategies, and anticipated financial results, all of which are subject to known
and unknown risks, uncertainties and factors that may cause our actual results to differ materially from those
expressed or implied by these forward-looking statements. Many of these risks are beyond
our ability to control or predict. Because of these risks, uncertainties and
assumptions, you should not place undue reliance on these forward-looking statements. Furthermore, forward-looking
statements speak only as of the date they are made. We do not undertake any obligation to
update or review any forward-looking information, whether as a result of new
information, future events or otherwise. Important factors with respect to any such forward-looking statements,
including certain risks and uncertainties that could cause actual results to differ from those
contained in the forward-looking statements, include, but are not limited to: rapid
development and intense competition in the telecommunications industry; our ability to achieve benefits from our
separation from NTELOS Holdings Corp; our ability to offset expected revenue declines in our
Competitive business from legacy voice products and in our RLEC business related to the
recent regulatory developments and carriers grooming their networks; adverse economic conditions; operating
and financial restrictions imposed by our senior credit facility; our cash and capital
requirements; declining prices for our services; the potential to experience a high
rate of customer turnover; federal and state regulatory fees, requirements and developments; our reliance on certain suppliers
and vendors; and other unforeseen difficulties that may occur. These risks and uncertainties
are not intended to represent a complete list of all risks and uncertainties inherent
in our business, and should be read in conjunction with the more detailed cautionary statements and risk factors
included in our SEC filings, including our Annual Reports filed on Forms 10-K. |
 2
Value creation for our customers enhances value for
our shareholders.
Lumos Networks provides next-
generation communication solutions
and personalized service to customers
over an advanced fiber network. |
 3
Diversified revenue stream served over a dense fiber network
3
Key Events
•
Oct.
31,
2011
–
Spin
from
NTELOS
•
2012 New leadership
•
Q3-12
•
Yr/Yr revenue growth
•
Strategic Data > 50% of revenue
•
Margin Expansion
Customers and Markets
•
21,000 business customers
•
Relationships with all major carriers
in the region
Products
•
Enterprise
Data
–
Metro
E,
Internet
•
Carrier Data -
up to 10Gig+
•
IP Services –
Fiber BXL, Video, VoIP
Network
•
5,800 long haul Fiber Network miles
•
~ 300 cell site fiber connections by
12/31/12
•
Interconnection to all major data
centers in region
People
•
Diversified and experienced
leadership team
•
400 sales and support personnel
deployed across the region
•
Deep technical expertise |
 4
Highlights
Strong Management
Team
Experienced leadership team
Diverse operational background
Attractive Revenue
Growth Opportunity
Significant growth available in existing markets
Edge out potential with unique network footprint
Margin Expansion
Increasing mix of high margin Strategic Data products
Leverage existing infrastructure
Efficient Capital
Management
Investments focused on Strategic Data initiatives
Disciplined success based capital approach
Delight Customers
Top Tier SLA standards
In Market support teams |
 5
Executive Management with Deep Industry Experience
Tim Biltz
Chief Executive Officer
Joined in April 2012
Over 20 years of operating experience as Chairman of iPCS, COO of
Spectrasite and EVP, COO of Vanguard Cellular Systems
Harold Covert
Chief Financial Officer
Joined in October 2011
Over
27
years
of
experience
with
technology
and
telecommunications
companies as CFO of six publicly traded companies
Joseph McCourt
Jr.
Chief Revenue Officer
Joined in May 2012
Over
25
years
of
experience
in
wholesale
and
enterprise
sales
in
Time
Warner Telecom, Level 3 Communications, Dukenet Communications,
Zayo Networks, and 1901 Group |
 70% of
internet access will come from mobile devices
Increase in networked devices 2011-
2016
Enabling rapid growth in rich media
Access to cloud services
6
Exponential Growth in Data and Devices…
Applications and devices generating
constant streams of data
Enterprises capturing and processing
data :
Customers
Products
Transactions
Operations
Digitization of records
Increasing use of:
Cloud and data center storage
Back-up file protection and
security
Source: Cisco VNI June 2012
Big Data
Proliferation of Networked Devices
mm
“90% of the world’s data has been
created in the last 2 years”
Source: Mark Hurd, Oracle Open World 2012. |
 7
…Driving Demand for Connectivity and Speed
Source: Cisco VNI June 2012
U.S. Business IP Traffic
More Cloud, More Mobility
Business IP traffic to grow 2.5-fold from
2011 to 2016 or CAGR of 20%
Mix of Business Data from mobile devices
increases from 4% to 19%
Enterprise Cloud Spending grows 12.5X from 2011
to 2016 with 35-45% telecom
Source:
Oppenheimer & Co Estimates
Source: Cisco VNI June 2012
20,000
15,000
10,000
5,000
0
2011
2012
2013
2014
2015
100%
80%
60%
40%
20%
0%
2011
2012
2013
2014
2015
2016
Business and IP Traffic
Mobile% Business Traffic |
 8
Next-generation network solutions
Enterprise Data
•
Ethernet connectivity among multiple locations
•
Dedicated Internet connections
•
Speeds of 1.5M to 10 Gbps
IP Services
•
IP-enabled product offerings that combines voice and
data services
•
Enables advanced features and dynamic bandwidth
•
Broadband XL high speed Internet over fiber over for
100M+
Carrier Data
•
IP-based Ethernet transport
•
Fiber connectivity to cell sites to support 4G growth
•
High-bandwidth transport (OC-X and wavelengths) |
 9
Enterprise Data enables networking and addresses
future growth needs
Attractive Available Markets
Current Share ~ 10%
Ethernet represents a disproportionate
share of the overall telecom growth with
overall growth 3-4% and TDM flat to
declining
Enterprise Data Demand growth 45%+
annually
Ethernet market has 50% at speeds of
100Mbps or below
Fastest growth segment of Ethernet is
100Mbps+
with
24%
looking
for
speeds
at
1Gig +
Source: Heavy Reading Study 2012, Oracle Openworld
2012
Future
Edge Out
Markets
Current
Markets |
 10
Customer Demand Drives Growth
Education Customer
Started with several data
circuits
-
$11K
monthly
recurring charge (“MRC”)
Expanded into IP based
services
–
Bandwidth
to
data centers + IP voice
MRC now $29K for $100K
capital investment
Regional Healthcare
Provider
Several small locations
with leased voice access -
$2K MRC
Today 37 locations, most
are on-net
Buying voice and Metro E
MRC of $29K with a
$1.0M capital investment |
 Transport
opportunity greatly enhanced with edge out opportunities like Atlanta
interconnection 11
Carrier Today
Provide transport across region
Responded to RFP for cell sites
across region
Sites coming on line now
New RFP for next wave of sites…..
1/3 as second tenant
New Opportunity with Atlanta
interconnection
Diversity to I-95 national carrier
routes
High speed connections –
10Gig +
Expands overall market for carriers
Attractive Available Markets
2012
Future
Edge Out
Opportunity
Current
Markets |
 Fiber to the
cell site: End-to-End Transport opportunity Approximately 5,000 sites within 10
miles of existing network Goal to double sites annually with the expansion of 4G roll
out Long-term growth in bandwidth creates opportunity for significant
ROI Illustrative Wireless Cell Site Economics
Average
Capital
Investment
$75K-$100K
per site
Two Carrier Equivalent
Annual EBITDA:
$30K to $36K
Payback:
2 to 3 years
12
Three to Five
Carrier Equivalent
Annual EBITDA:
$45K to $90K
Payback:
1 to 2 years
Contracts of 5 to 10 years and multiple carriers per site drive
long-term profitable revenue streams |
 Legacy TDM
Voice Revenue RLEC voice continuing moderate decline with strong cash generation
Legacy
Competitive
voice
focus
on
mix
shift
to
larger
and
higher
margin
customers, churn low margin base
13
($000)
($000) |
 Access
Revenue RLEC access reform underway: Lower rates, long term transition
funding continues strong cash generation
Competitive Access: Continuing moderate declines with good cash
generation
14
($000)
($000)
0
500
1,000
1,500
2,000
2,500
3,000
3,500
Q3-11
Q4-11
Q1-12
Q2-12
Q3-12
Competitive Access
0
1,000
2,000
3,000
4,000
5,000
6,000
7,000
8,000
9,000
Q3-11
Q4-11
Q1-12
Q2-12
Q3-12
RLEC Access |
 Well
positioned for the competitive environment 15
Network Capability
•
Dense fiber with available or expandable capacity
•
Most complete fiber network in our markets
•
High quality ring based network
Customer
Relationship
•
Strategic partnership
•
Care and sales support in region
•
Technical support expertise and responsiveness
Products
•
First to bring products to addressed markets
•
Top Tier SLAs
•
Competitive pricing |
 16
Key Success Factors
Revenue
Growth
•
Strong portfolio of Strategic Data products
•
Significant opportunity to grow in current markets
•
Meaningful edge-out opportunities
Leverage
Infrastructure
Solid
Execution
•
Sales force expansion and productivity
•
Installation streamlining and productivity
•
Automated customer interfaces
Financial
Performance
•
High margin product mix
•
Capital expenditure efficiency
•
Cash flow from operations
•
Current return to shareholders
•
Maximizing network efficiency
•
On-net or near-net customers
•
Focused capital deployment |
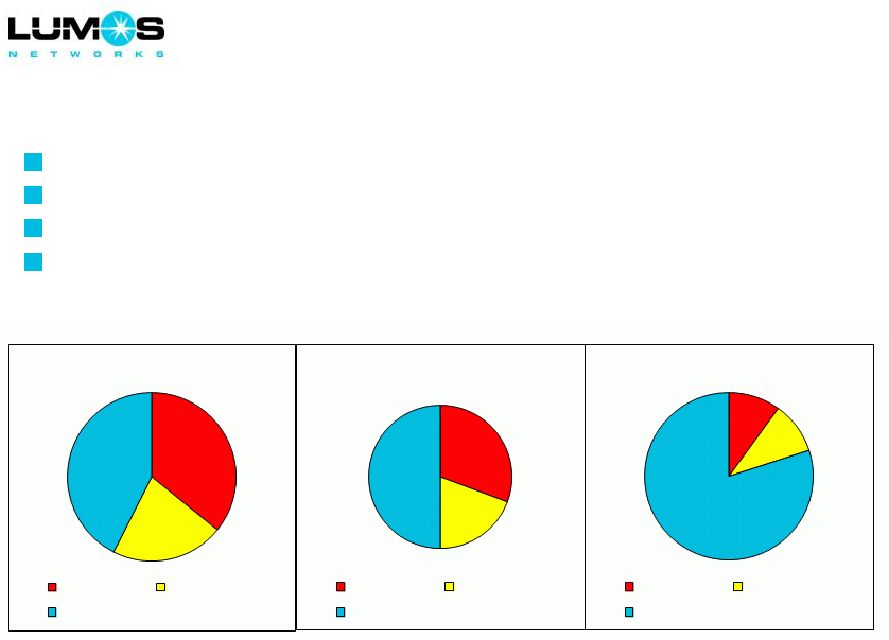 17
Business Transformation
Shift to Strategic Data products
Enhanced sales organization
Improve mix to more on-net or near-net customers
Effective expense management
> 75%
19%
31%
50%
22%
36%
42%
Legacy Voice
Access
Strategic Data
Legacy Voice
Access
Strategic Data
Legacy Voice
Access
Strategic Data
2011
2012
Long Term Target |
 Income
Statement Overview 18
Quarterly Revenue
EBITDA
$M
Q3-12 results highlight the transformation
Strategic Data now > 50% of total revenue
% Margin
Data -
% Rev
$M
30%
35%
40%
45%
50%
55%
60%
0
5
10
15
20
25
30
35
Q3-11
Q4-11
Q1-12
Q2-12
Q3-12
Strategic Data
Legacy Voice and Access
% Data Revenue
48%
45%
43%
42%
43%
30%
35%
40%
45%
50%
15.0
17.0
19.0
21.0
23.0
25.0
27.0
29.0
Q3-11
Q4-11
Q1-12
Q2-12
Q3-12
EBITDA
% Margin |
 19
Disciplined approach to capital investment
Guiding principles include:
Achievement of capital efficiency goals
Focus on success based projects
Compliance with liquidity goals
Maintain current shareholder dividend
Metric
Target
Near
–
Term
Revenue
Opportunity
Capital
~75%
Capex to Revenue Ratio
~2.0x -
3.0x
EBITDA Payback
~36 –
48 Months
Return on Investment (EBITDA After Tax)
~15% -
20%
Capex as a % of Revenue
~30-35% |
 ($mm)
Cash
-.0
$ -
Restricted cash
6.8
Total Assets
504.4
Revolver ($60M)
4.7
Long-term debt
314.4
Liquidity Overview
20
9/30/12 |
 Cash Flow
Overview 21
FY 2012 Guidance
$M
88
55
Cash Resources
$143M
EBITDA
Line of Credit
12
16
Cash Uses
$88M
Capital Investment
Dividend
Interest, Debt Payment, Cash Tax
60 |
 Financial
Model 22
% of revenue
% of revenue
% of revenue
2011
Q3-12
Q4-12
FY 2012
(Dollars in millions)
Actual
Actual
Guidance
Guidance
Annual Long Term Goals
Revenue
Strategic Data Revenue
88.2
26.1
27.0 -
27.5
102.5-103.0
+ 15-20%
42.5%
50.2%
53.0%
50%
Legacy Voice Revenue
74.3
16.1
15.0 -
15.5
63.5 -
64.0
-10-15%
35.8%
31.0%
31.0%
31%
Access Revenue
44.9
9.7
9.0 -
9.0
39.0 -
39.0
-10-15%
21.6%
18.7%
16.0%
19%
Total
207.4
52.0
52.0
206.0
+ 5%
EBITDA
$
96.9
22.3
22.0
88.0
NA
%
46.7%
42.9%
42.3%
42.7%
47%+
Capital Expenditures
% Success Based
45%
75%
75%
75%
75%
Total
61.5
14.9
16.0
60.0
~30-35% of revenue |
 23
2012 Financial Guidance
1
These estimates are based on management’s current expectations. These estimates are
forward-looking and actual results may differ materially. Please see “Special
Note from the Company Regarding Forward-Looking Statements" in the Lumos Networks
Corp. third quarter 2012 earnings release dated November 1, 2012.
Business Outlook
1
(as of November 1, 2012)
(In millions)
Operating Revenues
52
$
206
$
Adjusted EBITDA
22
$
88
$
Capital Expenditures
60
Reconciliation of Operating Income to Adjusted EBITDA
Operating Income
10
$
44
$
Depreciation and amortization
9
38
Equity based compensation charges
3
4
Amortization of actuarial losses
-
2
Adjusted EBITDA
22
$
88
$
Fourth Quarter 2012
2012 Annual
2012 Guidance
1
$
Approximately
Approximately
Approximately
Approximately
Approximately
Approximately
Approximately
Approximately
Approximately |
 24
Key Success Factors
Revenue
Growth
•
Strong portfolio of Strategic Data products
•
Significant opportunity to grow in current markets
•
Meaningful edge-out opportunities
Leverage
Infrastructure
Solid
Execution
•
Sales force expansion and productivity
•
Installation streamlining and productivity
•
Automated customer interfaces
Financial
Performance
•
High margin product mix
•
Capital expenditure efficiency
•
Cash flow from operations
•
Current return to shareholders
•
Maximizing network efficiency
•
On-net or near-net customers
•
Focused capital deployment |
 25
Reconciliation of Net Income Attributable to Lumos
Networks Corp. to Operating Income
($ in millions)
2007
2008
2009
2010
2011
Net income attributable to Lumos
Networks Corp.
$21
$23
$23
$21
($44)
Net income attributable to
noncontrolling interests
-
-
-
-
-
Net income
21
23
23
21
(44)
Interest expense
2
1
1
6
12
Loss on interest rate derivatives
-
-
-
-
-
Income tax expense (benefit)
14
15
16
14
(4)
Other income, net
(1)
-
1
-
-
Operating Income (Loss)
$36
$39
$41
$41
($36)
Year Ended
12/31/2010
3/31/2011
6/30/2011
9/30/2011
12/31/2011
3/31/2012
6/30/2012
9/30/2012
Net income attributable to Lumos
Networks Corp.
$4
$5
$7
$6
($62)
$5
$3
$6
Net income attributable to
noncontrolling interests
-
-
-
-
-
-
-
-
Net income
4
5
7
6
(62)
5
3
6
Interest expense
2
3
3
3
3
3
3
3
Loss on interest rate derivatives
-
-
-
-
-
-
-
-
Income tax expense (benefit)
3
4
4
4
(17)
3
3
4
Other income, net
-
-
-
-
-
-
-
-
Operating Income (Loss)
$9
$12
$13
$13
($75)
$12
$9
$13
Three Months Ended |
 26
Adjusted EBITDA Reconciliation
($ in millions)
2007
2008
2009
2010
2011
Operating Income (Loss)
$36
$39
$41
$41
($36)
Depreciation and Amortization
27
27
29
31
43
Equity Based Compensation
1
1
-
2
2
Asset Impairment Charge
-
-
-
-
86
Business Separation Charges
-
-
-
-
2
Acquisition Related Charges
-
-
-
3
-
Voluntary Retirement and Workforce Reduction Plans
-
1
-
-
-
Adjusted EBITDA
$64
$68
$71
$77
$97
Year Ended
12/31/2010
3/31/2011
6/30/2011
9/30/2011
12/31/2011
3/31/2012
6/30/2012
9/30/2012
Operating Income (Loss)
$9
$12
$13
$13
($75)
$12
$9
$13
Depreciation and Amortization
9
11
11
11
10
9
9
10
Equity Based Compensation
1
1
1
1
-
1
1
1
Asset Impairment Charge
-
-
-
-
86
-
-
-
Business Separation Charges
-
-
-
-
2
-
-
-
Acquisition Related Charges
2
-
-
-
-
-
-
-
Employee Separation Charges
-
-
-
-
-
-
2
-
Gain on Settlements, net
-
-
-
-
-
-
-
(2)
Adjusted EBITDA
$21
$24
$25
$25
$23
$22
$21
$22
Three Months Ended |
 27
Thank You |