Attached files
| file | filename |
|---|---|
| 8-K - FORM 8-K - GAIN Capital Holdings, Inc. | d428389d8k.htm |
| EX-99.1 - PRESS RELEASE - GAIN Capital Holdings, Inc. | d428389dex991.htm |
 3 Quarter 2012
Financial and Operating Results
November 1, 2012
Exhibit 99.2
rd |
 Special Note Regarding Forward-Looking Information
In addition to historical information, this presentation contains
"forward-looking" statements that reflect management's
expectations for the future. A variety of important factors could cause
results
to
differ
materially
from
such
statements.
These
factors
are
noted
throughout
GAIN
Capital's annual report on Form 10-K, as filed with the Securities and Exchange
Commission on March 15, 2012, and include, but are not limited to, the
actions of both current and potential new competitors, fluctuations in
market trading volumes, financial market volatility, evolving industry
regulations, including changes in regulation of the futures companies, errors or
malfunctions in our systems or technology, rapid changes in technology, effects of
inflation, customer trading patterns, the success of our products and
service offerings, our ability to continue to innovate and meet the demands
of our customers for new or enhanced products, our ability to successfully
integrate assets and companies we have acquired, including the successful
integration of Open E Cry, our ability to effectively compete in the futures
industry, changes in tax policy or accounting rules, fluctuations in foreign
exchange rates and commodity prices, adverse changes or volatility in
interest rates, as well as general economic, business, credit and financial
market conditions, internationally or nationally, and our ability to
continue paying a quarterly dividend in light of future financial performance and
financing needs.
The
forward-looking
statements
included
herein
represent
GAIN
Capital's
views
as
of
the date of this presentation. GAIN Capital undertakes no obligation to revise or
update publicly any forward-looking statement for any reason unless
required by law. 2 |
 Overview
Glenn Stevens, CEO |
 3
rd
Quarter Summary
•
Solid profitability and margins despite challenging trading
conditions
•
Managed expenses in core retail FX business while launching
new products and services to diversify revenue
•
Introduced TRADE, a new retail platform featuring an
expanded portfolio of FX and CFD products
•
Expanded GTX specialty execution desk through addition of
new team
•
Entered online futures market with closing of OEC acquisition
4 |
 3
rd
Quarter 2012 Results Overview
5
•
Financial Results
•
Net Revenue: $40.0 million
•
Net Income: $3.2 million
•
Adjusted Net Income
(2)
: $3.6 million
•
Adjusted EBITDA
(1)
: $6.2 million
•
EPS (Diluted): $0.08
•
Adjusted EPS (Diluted)
(3)
: $0.09
•
Strong Balance Sheet
•
$93.6mm of free cash available as of
September 30, 2012
(4)
•
$143.6mm of liquidity including revolver
•
Operating Metrics
(5)
•
Retail volume: $278.7 billion vs. $447.9 billion
•
Institutional volume:$503.7 billion vs. $260.0
billion
•
Client assets up 49% to $426.6 million as of
September 30, 2012
•
Retail FX: $316.9 million vs. $286.4 million
•
OEC: $109.7 million
43%
45%
48%
44%
48%
49%
48%
0%
10%
20%
30%
40%
50%
60%
1Q 11
2Q 11
3Q 11
4Q 11
1Q 12
2Q 12
3Q 12
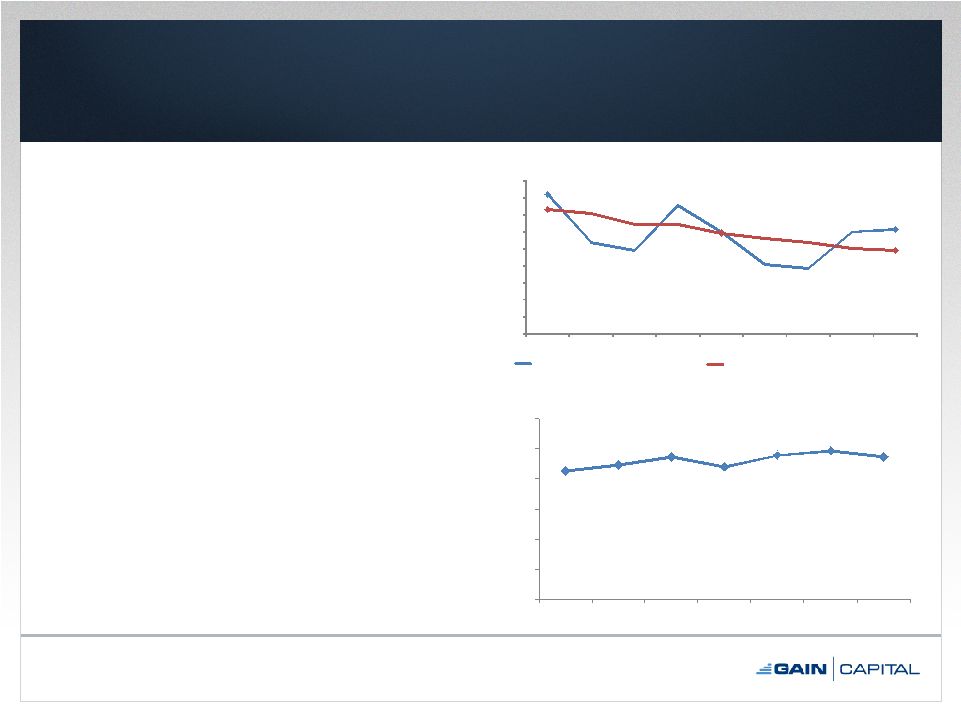
Active Account Yield
All comparisons based on 3Q 2011
$164.2
$119.3
$123.1
$146.2
$118.9
$98.5
$0.0
$20.0
$40.0
$60.0
$80.0
$100.0
$120.0
$140.0
$160.0
$180.0
3Q 10
4Q 10
1Q 11
2Q 11
3Q 11
4Q 11
1Q 12
2Q 12
3Q 12
Retail Trading Revenue per Million
Retail Trading Revenue per Million (Quarterly)
Retail Trading Revenue per Million (Last Twelve Months)
(1)
Adjusted EBITDA is a non-GAAP financial measure that represents our earnings
before interest, taxes, depreciation, amortization and non-recurring expenses. A reconciliation of net income to adjusted EBITDA is available in
the appendix to this presentation.
(2)
in the appendix to this presentation.
(3)
Reconciliation of EPS to adjusted EPS is available in the appendix to this
presentation. (4)
Calculation of balance sheet liquidity is available in the appendix to this
presentation. (5)
Definitions for all our operating metrics are available in the appendix to this
presentation. Adjusted net income is a non-GAAP financial measure that represents our net
income excluding purchase intangible amortization. A reconciliation of net income to adjusted net income is available |
 3
rd
Quarter
Trading
Conditions
6
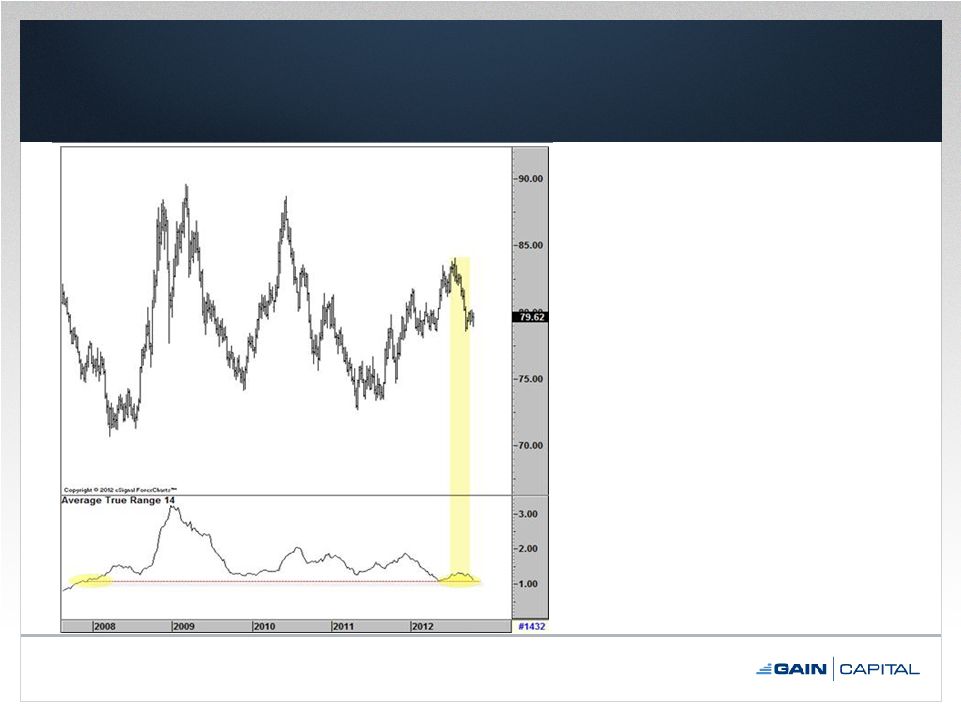
US Dollar Index Chart
•
Third quarter
volatility declined
back to 4-year lows
after modest uptick
in prior quarter
•
Average True
Range remains
significantly lower
than prior years
•
Trading conditions
translated into lower
retail volume |
 Retail
Business •
Enhanced CFD offering
–
TRADE platform launched
–
Expands retail product offering to over 250 tradable markets
•
Indices, commodities & FX
–
Platform features innovative tools for market monitoring,
technical trading and strategy building
–
Future enhancements will add new asset classes, analytics,
community features and social trading tools
•
Opportunistic marketing spend
–
New marketing campaigns to promote TRADE
–
Positions GAIN to benefit from improved market conditions
•
Actively pursuing M&A opportunities
7 |
 Open E
Cry (OEC) •
OEC acquisition closed on August 31
–
Purchase price: $12mm
•
Key Financial & Operating Metrics
–
Run-rate revenue: ~$15mm
–
Customers
(1)
: 8,100
–
Customer Assets
(1)
: $109.7mm
•
Quickly achieving operational synergies
•
Commission-based model will provide a stable
quarterly revenue stream
8
(1)
As of September 30, 2012. |
 Institutional Business (GTX)
9
•
GTX demonstrated strong growth in revenue and volume:
–
3Q 2012 revenue: $4.2mm; average daily volume: $7.6bn
–
3Q 2011 revenue: $1.4mm; average daily volume: $2.6bn
•
Volumes continued to grow at a time many competitors are
reporting decreasing trading volumes
•
14-person specialty execution desk became operational in
September
•
Addition of new products and team expected to continue to
drive growth in volume and revenue |
 Financial Review
Daryl
Carlough,
Interim
CFO |
 $42.2
$35.6
$119.9
$110.3
$0
$20
$40
$60
$80
$100
$120
$140
2011
2012
2011
2012
Total Expenses
Comp & Benefits
Marketing
Trading
Purchase Intangible Amort.
All Other
$53.9
$40.0
$149.9
$118.9
$0.0
$20.0
$40.0
$60.0
$80.0
$100.0
$120.0
$140.0
$160.0
2011
2012
2011
2012
Net Revenue
3
rd
Quarter & 9 Months 2012 Financial Results
11
$9.3
$3.6
$23.0
$9.0
$7.6
$3.2
$19.0
$6.4
$0.0
$5.0
$10.0
$15.0
$20.0
$25.0
2011
2012
2011
2012
GAAP & Adjusted Net Income
(1)
Adjusted Net Income
GAAP Net Income
$15.6
$6.2
$39.7
$16.3
$0.0
$5.0
$10.0
$15.0
$20.0
$25.0
$30.0
$35.0
$40.0
$45.0
2011
2012
2011
2012
Adjusted EBITDA
(2)
3 Quarter
rd
9 Months
3 Quarter
rd
9 Months
3 Quarter
rd
9 Months
3 Quarter
rd
9 Months
Note: Dollars in millions.
(1)
Reconciliation of net income to adjusted net income available in appendix to this
presentation.
(2)
Adjusted EBITDA is a non-GAAP financial measure that represents our earnings before
interest, taxes, depreciation, amortization and non-recurring expenses. A reconciliation of
net income to Adjusted EBITDA is available in the appendix to this presentation. |
 Quarterly Dividend & Share Buyback
•
$0.05 per share quarterly dividend approved
–
Record Date: December 12, 2012
–
Payment Date: December 21, 2012
•
Continue to repurchase shares pursuant to our
share buyback program
–
1.3mm shares repurchased through September 30
•
140k repurchased in 3Q 2012 at an average price of $4.64
–
$3mm remains available for additional repurchases
12 |
 Expense Management…
•
3Q 2012 operating expenses of $33.8mm down
12.2% compared to 3Q 2011
–
Down 10.0% compared to 2Q 2011
•
Core retail expenses of $28.9mm declined 23.0%
compared to 3Q 2011
–
Core retail compensation & benefit expenses down
21.9% from 2Q 2012 and 5.2% from 3Q 2011
•
Savings of $4.5mm invested in institutional (GTX)
and futures (OEC) businesses
13 |
 14
: Retail OTC
: Institutional
: Exchange
3%
97%
3Q
2011
10%
87%
3%
3Q
2012
8%
84%
8%
PF
2012
(1)
25%
50%
25%
Target
…Drives Revenue Diversification
(1) Pro forma data assumes OEC was acquired on January 1, 2012.
|
 Closing Remarks
•
Solid profitability and margins despite challenging trading
conditions
•
Managing costs to facilitate investment in new areas
•
Successfully implementing strategy of investment in
retail and institutional businesses to grow and diversify
revenue sources
•
Well positioned to pursue organic and inorganic growth
opportunities
15 |
 Appendix |
 Condensed Consolidated Statements of Operations
17
Note: Unaudited. Dollars in millions, except per share data.
(1)
Non-recurring expenses relating to cost savings effected in 2Q 2012.
Three
Months
Ended
Sept.
30,
Nine
Months
Ended
Sept.
30,
Revenue
2012
2011
2012
2011
Retail trading revenue
34.3
$
52.2
$
104.6
$
146.1
$
Institutional trading revenue
4.2
1.4
12.2
3.3
Other revenue
1.4
0.6
2.1
1.3
Total non-interest revenue
39.9
54.2
118.9
150.7
Interest revenue
0.1
0.1
0.4
0.3
Interest expense
-
(0.4)
(0.4)
(1.1)
Total net interest revenue/(expense)
0.1
(0.3)
-
(0.8)
Net revenue
40.0
53.9
118.9
149.9
Expenses
Employee compensation and benefits
11.9
11.6
35.5
34.9
Selling and marketing
5.7
8.8
20.1
28.0
Trading expenses and commissions
8.9
9.9
26.9
25.5
Bank fees
0.8
1.3
2.5
3.4
Depreciation and amortization
1.2
1.0
3.2
2.9
Purchased intangible amortization
0.6
2.7
3.5
6.4
Communication and data processing
0.8
0.7
2.3
2.1
Occupancy and equipment
1.2
1.2
3.5
3.5
Bad debt provision
-
0.2
0.2
0.8
Professional fees
1.6
1.9
3.6
3.8
Product development, software and maintenance
1.1
1.0
3.3
3.0
Restructuring
(1)
-
-
0.6
-
Other
1.8
1.9
5.1
5.6
Total
35.6
42.2
110.3
119.9
Income before income tax expense
and equity in earnings of equity method
investment
4.4
11.7
8.6
30.0
Income tax expense
1.2
4.1
2.2
11.0
Net income
3.2
$
7.6
$
6.4
$
19.0
$
Earnings per common share:
Basic
0.09
$
0.22
$
0.18
$
0.55
$
Diluted
0.08
$
0.20
$
0.16
$
0.49
$
Weighted averages common shares outanding used
in computing earnings per common share:
Basic
35,250,404
34,625,525
34,893,622
34,313,987
Diluted
38,560,657
38,916,038
38,927,673
39,025,699 |
 Consolidated Balance Sheet
18
Note: Unaudited. Dollars in millions.
September 30,
December 31,
2012
2011
ASSETS:
Cash
and
cash
equivalents
7.6
$
60.3
$
Cash and cash equivalents, held for customers
426.6
310.4
Short term investments
45.0
0.1
Receivables from banks and brokers
83.9
85.4
Property and
equipment -
net of accumulated depreciation
9.9
7.5
Prepaid assets
8.4
9.9
Goodwill
10.2
3.1
Intangible
assets,
net
10.7
10.8
Other
assets
17.3
18.1
Total
assets
619.6
$
505.6
$
LIABILITIES AND SHAREHOLDERS' EQUITY:
Payables to brokers, dealers, FCM'S and other regulated entities
12.6
$
17.3
$
Payable to customers
414.0
293.1
Accrued compensation & benefits payable
4.9
4.9
Accrued expenses and other liabilities
15.5
14.9
Income tax payable
2.6
2.6
Notes payable
-
7.9
Total
liabilities
449.6
$
340.7
$
Shareholders' Equity
170.0
$
164.9
$
Total
liabilities
and
shareholders'
equity
619.6
$
505.6
$
|
 Current Liquidity
19
Note: Dollars in millions.
(1)
Reflects cash that would be received from brokers following the close-out of
all open positions. (2)
Excludes current liabilities of $21.3mm and capital charges associated with open
positions as of 9/30/2012. 9/30/2012
6/30/2012
12/31/2011
Cash & cash equivalents
$7.6
$22.4
$60.3
Cash & cash equivalents held for customers
426.6
320.2
310.4
Short term investments
45.0
0.1
0.1
Receivable
from
banks
and
brokers
(1)
83.9
115.7
85.4
Total Operating Cash
$563.1
$458.4
$456.2
Less: Cash & cash equivalents held for customers
(426.6)
(320.2)
(310.4)
Free Operating Cash
$136.5
$138.2
$145.8
Less: Minimum regulatory capital requirements
(42.9)
(42.6)
(35.8)
Less: Note payable
-
-
(7.9)
Free Cash Available
(2)
$93.6
$95.6
$102.1
Add: Available credit facility
50.0
50.0
50.0
Available Cash & Liquidity
$143.6
$145.6
$152.1 |
 3
rd
Quarter
&
9
Months
2012
Financial
Summary
20
Note: Dollars in millions, except per share data.
(1)
See page 22 for a reconciliation of GAAP net income to adjusted EBITDA.
(2)
See page 21 for a reconciliation of GAAP net income to adjusted net income.
(3)
See page 23 for a reconciliation of GAAP EPS to adjusted EPS.
(4)
Adjusted
EBITDA
Margin
calculated
as
Adjusted
EBITDA/Net
Revenue
(ex.
Interest
expense).
3 Months Ended September 30,
9 Months Ended September 30,
'12 v '11 % Change
2012
2011
2012
2011
3rd Quarter
9 Months
Net Revenue
$40.0
$53.9
$118.9
$149.9
(26%)
(21%)
Interest Expense
-
0.2
0.4
0.4
(100%)
0%
Net Revenue (ex. Interest expense)
$40.0
$54.1
$119.3
$150.3
(26%)
(21%)
Operating Expenses
33.8
38.5
103.0
110.6
(12%)
(7%)
Adjusted EBITDA
(1)
$6.2
$15.6
$16.3
$39.7
(60%)
(59%)
GAAP Net Income
$3.2
$7.6
$6.4
$19.0
(58%)
(66%)
Adjusted Net Income
(2)
3.6
9.3
9.0
23.0
(61%)
(61%)
GAAP EPS (Diluted)
$0.08
$0.20
$0.16
$0.49
(60%)
(67%)
Adjusted EPS (Diluted)
(3)
0.09
0.24
0.23
0.59
(61%)
(61%)
Adjusted EBITDA Margin %
(1)(4)
15.5%
28.8%
13.7%
26.4%
(13 pts)
(13 pts)
Net Income Margin %
8.0%
14.1%
5.4%
12.7%
(6 pts)
(7 pts)
Adjusted Net Income Margin %
(2)
9.0%
17.3%
7.6%
15.3%
(8 pts)
(8 pts) |
 Adjusted Net Income & Margin Reconciliation
21
Note: Dollars in millions, except per share data.
Three Months Ended September 30,
Nine Months Ended September 30
2012
2011
2012
2011
Net Revenue
40.0
$
53.9
$
118.9
$
149.9
$
Net income
3.2
7.6
6.4
19.0
Plus: Purchase intangible amortization (net of tax)
0.4
1.7
2.6
4.0
Adjusted Net Income
3.6
$
9.3
$
9.0
$
23.0
$
Adjusted Earnings per Share
Basic
0.10
$
0.27
$
0.26
$
0.67
$
Diluted
0.09
$
0.24
$
0.23
$
0.59
$
Net Income Margin %
8.0%
14.1%
5.4%
12.7%
Adjusted Net Income Margin %
9.0%
17.3%
7.6%
15.3% |
 Adjusted EBITDA & Margin Reconciliation
22
Note: Dollars in millions.
(1)
Non-recurring
expenses
relating
to
cost
savings
effected
in
2Q
2012.
(2)
Adjusted
EBITDA
Margin
calculated
as
Adjusted
EBITDA/Net
Revenue
(ex.
Interest
expense).
Three Months Ended September 30,
Nine Months Ended September 30,
2012
2011
2012
2011
Net Revenue
40.0
$
53.9
$
118.9
$
149.9
$
Interest expense
-
0.2
0.4
0.4
Net Revenue (ex. Interest
expense) 40.0
$
54.1
$
119.3
$
150.3
$
Net income
3.2
$
7.6
$
6.4
$
19.0
$
Plus: Depreciation & amortization
1.2
1.0
3.2
2.9
Plus: Purchase intangible
amortization 0.6
2.7
3.5
6.4
Plus: Interest expense
-
0.2
0.4
0.4
Plus: Restructuring
(1)
-
-
0.6
-
Plus: Income tax expense
1.2
4.1
2.2
11.0
Adjusted EBITDA
6.2
$
15.6
$
16.3
$
39.7
$
Adjusted EBITDA Margin %
(2)
15.5%
28.8%
13.7%
26.4% |
 Adjusted EPS (Diluted) Reconciliation
23
(1)
Net of tax.
Three Months Ended September 30,
Nine Months Ended September 30,
2012
2011
2012
2011
GAAP Earnings per Share (Diluted)
0.08
$
0.20
$
0.16
$
0.49
$
Plus: Purchase intangible amortization
(1)
0.01
0.04
0.07
0.10
Adjusted Earnings per Share (Diluted)
0.09
$
0.24
$
0.23
$
0.59
$
|
 3
rd
Quarter & 9 Months 2012 Operating Metrics
(1)
24
Note: Dollars in millions, except retail trading revenue per million.
(1)
Definitions for all our operating metrics are available in the appendix to this
presentation. (2)
Includes 145 new OEC accounts.
(3)
Average calculated using excess net capital balance at each month-end during the
relevant period. (4)
Includes 8,100 OEC accounts.
3rd Quarter
9 Months
'12 v '11 % Change
2012
2011
2012
2011
3rd Quarter
9 Months
For Period Ending September 30,
Total Trading Volume (billions)
$782.4
$707.9
$2,418.8
$1,675.0
11%
44%
Retail
278.7
447.9
1,004.6
1,207.5
(38%)
(17%)
Institutional
503.7
260.0
1,414.2
467.5
94%
202%
Traded Retail Accounts (Period)
35,377
36,927
52,385
56,247
(4%)
(7%)
Traded Retail Accounts (Last 12 Months)
59,166
65,401
59,166
65,401
(10%)
(10%)
New Retail Accounts
(2)
6,121
7,852
19,855
24,764
(22%)
(20%)
Trades
8,059,238
10,949,800
26,326,970
29,339,268
(26%)
(10%)
Retail Trading Revenue per Million
$123.1
$116.4
$104.9
$121.0
6%
(13%)
Average Excess Net Capital
(3)
$56.3
$60.7
$60.7
$55.5
(7%)
9%
As of September 30,
Funded Retail Accounts
(4)
82,394
77,013
82,394
77,013
7%
7%
Client Assets
$426.6
$286.4
$426.6
$286.4
49%
49% |
 $448
$279
$1,208
$1,005
$260
$504
$468
$1,414
$708
$782
$1,675
$2,419
$0
$500
$1,000
$1,500
$2,000
$2,500
$3,000
2011
2012
2011
2012
Total Trading Volume
(2)
Retail
Institutional
3
rd
Quarter & 9 Months 2012 Operating Metrics
(1)
(cont.)
25
3 Quarter
9 Months
$286.4
$316.9
$109.7
$426.6
$0.0
$50.0
$100.0
$150.0
$200.0
$250.0
$300.0
$350.0
$400.0
$450.0
2011
2012
Client Assets
(3)
Retail FX
Futures
65,401
59,166
-
10,000
20,000
30,000
40,000
50,000
60,000
70,000
2011
2012
Traded Retail Accounts (Last 12 Months)
77,013
74,294
8,100
82,394
0
10,000
20,000
30,000
40,000
50,000
60,000
70,000
80,000
90,000
2011
2012
Funded Retail Accounts
(3)
Retail FX
Futures
rd
(2)
Note: Trading volume in billions. Client assets in millions.
(1)
Definitions for all our operating metrics are available in the appendix to this
presentation. (2)
For periods ending September 30.
(3)
As of September 30. |
 Monthly Operating Metrics
26
Funded
New Retail
Client
Month
Retail Accts.
(2)
Accounts
(3)
Assets
(2)
Oct 2011
76,496
2,372
$311.8
Nov 2011
76,647
2,330
319.3
Dec 2011
76,485
2,195
310.4
Jan 2012
76,847
2,145
313.6
Feb 2012
75,904
2,371
320.2
Mar 2012
73,844
2,356
325.9
Apr 2012
73,996
2,260
332.4
May 2012
74,452
2,463
300.5
June 2012
74,621
2,139
320.2
July 2012
74,962
2,127
320.7
Aug 2012
83,174
1,979
433.7
Sep 2012
82,394
2,015
426.6
(1)
Note: Dollars in millions.
(1)
Definitions for all our operating metrics are available in the appendix to this presentation.
(2)
As of period ended. August 2012 and September 2012 include 7,955 and 8,100 OEC accounts, respectively. (3)
For period ended. September 2012 includes 145 new OEC accounts. |
 Quarterly
Operating
Metrics
(1)
27
Note: For period ended. Volume in billions.
(1)
Definitions for all our operating metrics are available in the appendix to this
presentation. Volume
Traded Retail
Quarter
Retail
Institutional
Accts. (Period)
Trades
4Q 11
$366.4
$386.4
34,019
9,852,951
1Q 12
385.1
468.0
36,041
9,291,722
2Q 12
340.8
442.5
36,660
8,976,010
3Q 12
278.7
503.7
35,377
8,059,238
|
 Definition of Metrics
•
Total Trading Volume
–
Represents the U.S. dollar equivalent of notional amounts traded
•
Traded Retail Accounts
–
Retail accounts who executed a transaction during a given period
•
Funded Retail Accounts
–
Retail accounts who maintain a cash balance
•
Active Account Yield
–
Represents the percentage of average funded retail accounts who executed a
transaction during a given period •
Client Assets
–
Represents amounts due to clients, including customer deposits and unrealized
gains or losses arising from open positions
•
New Retail Accounts
–
The number of customer accounts that have initially opened and funded their
accounts •
Net Deposits from Retail Customers
–
Represents
customers’
deposits
less
withdrawals
for
a
given
period
•
Trades
–
The
number
of
transactions
retail
customers
have
completed
for
a
given
period
•
Retail Trading Revenue per Million
–
The revenue we realize from our forex, CFDs and metals trading activities per one
million of U.S. dollar-equivalent trading volume
•
Excess Net Capital
–
Represents the excess funds held over the regulatory minimum capital requirements,
as defined by the regulatory bodies that regulate our operating
subsidiaries 28 |
 3
rd
Quarter 2012
Financial and Operating Results
November 1, 2012 |