Attached files
| file | filename |
|---|---|
| 8-K - 8-K - Beneficial Mutual Bancorp Inc | a12-25850_18k.htm |
Exhibit 99.1
|
|
Beneficial Mutual Bancorp Investor Presentation Third Quarter – Ended September 30, 2012 |
|
|
1 SAFE HARBOR STATEMENT This presentation may contain projections and other “forward-looking statements” within the meaning of the federal securities laws. These statements are not historical facts, rather statements based on the current expectations of Beneficial Mutual Bancorp, Inc. (the “Company”) regarding its business strategies, intended results and future performance. Forward-looking statements are preceded by terms such as “expects,” “believes,” “anticipates,” “intends” and similar expressions. Management’s ability to predict results or the effect of future plans or strategies is inherently uncertain. Factors that could affect actual results include interest rate trends, the general economic climate in the market area in which the Company operates, as well as nationwide, the Company’s ability to control costs and expenses, competitive products and pricing, loan delinquency rates, changes in federal and state legislation and regulation and other factors that may be described in the Company’s filings with the Securities and Exchange Commission, including its Annual Reports on Form 10-K and Quarterly Reports on Form 10-Q and other required filings. These factors should be considered in evaluating the forward-looking statements and undue reliance should not be placed on such statements. The Company assumes no obligation to update any forward-looking statements. This presentation includes interim and unaudited financials, which are subject to further review by the Company’s independent accountants. |

|
|
2 PRESENTATION TOPICS Our Market Current Focus Q3 2012 Financial Highlights |

|
|
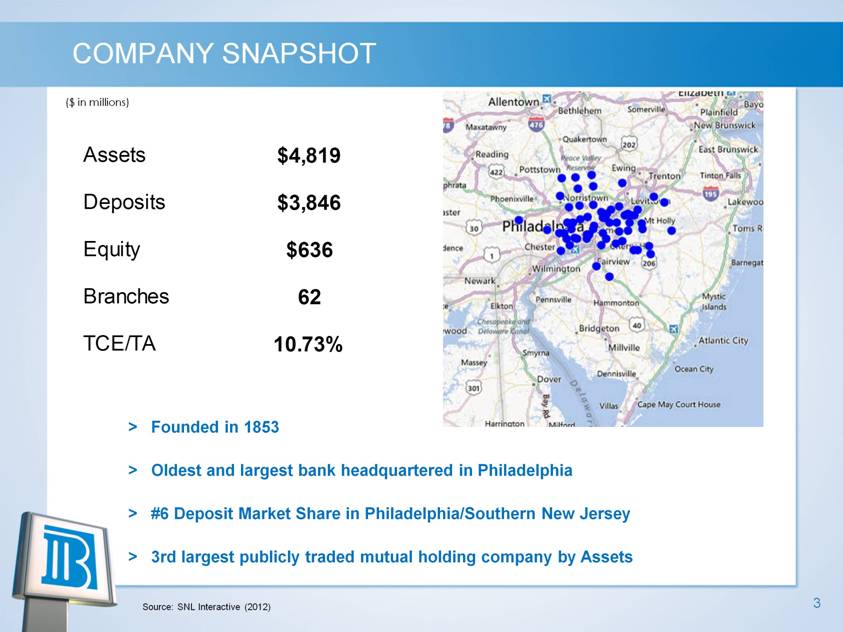
3 COMPANY SNAPSHOT > Founded in 1853 > Oldest and largest bank headquartered in Philadelphia > #6 Deposit Market Share in Philadelphia/Southern New Jersey > 3rd largest publicly traded mutual holding company by Assets Source: SNL Interactive (2012) ($ in millions) ($ in millions) Assets $4,819 Deposits $3,846 Equity $636 Branches 62 TCE/TA 10.73% |
|
|
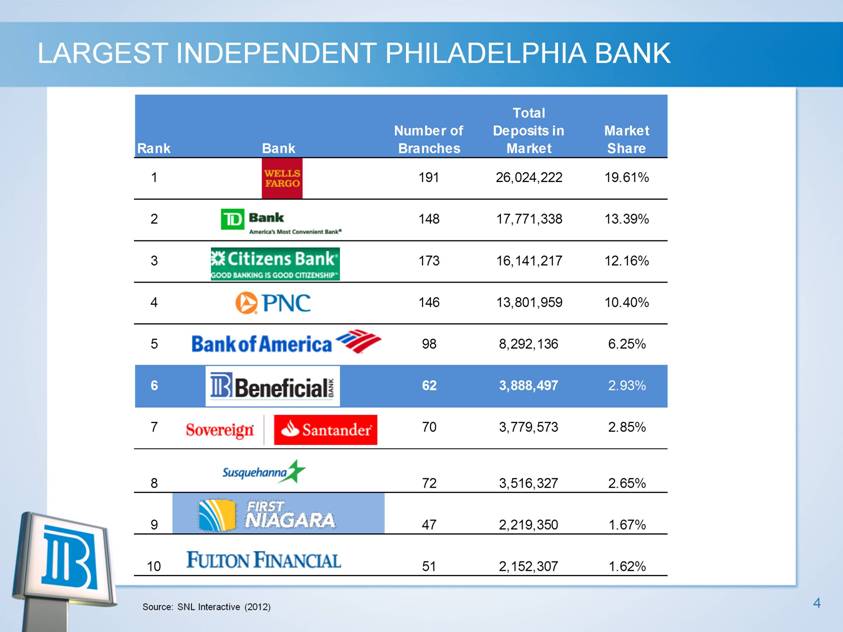
4 LARGEST INDEPENDENT PHILADELPHIA BANK Source: SNL Interactive (2012) |
|
|
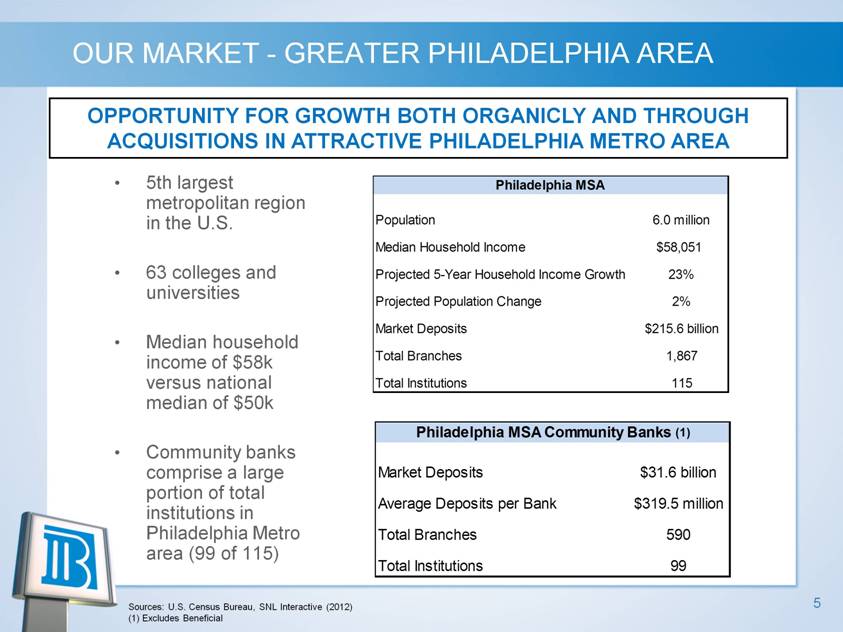
5 OUR MARKET - GREATER PHILADELPHIA AREA 5th largest metropolitan region in the U.S. 63 colleges and universities Median household income of $58k versus national median of $50k Community banks comprise a large portion of total institutions in Philadelphia Metro area (99 of 115) Sources: U.S. Census Bureau, SNL Interactive (2012) (1) Excludes Beneficial OPPORTUNITY FOR GROWTH BOTH ORGANICLY AND THROUGH ACQUISITIONS IN ATTRACTIVE PHILADELPHIA METRO AREA Philadelphia MSA Population 6.0 million Median Household Income $58,051 Projected 5-Year Household Income Growth 23% Projected Population Change 2% Market Deposits $215.6 billion Total Branches 1,867 Total Institutions 115 Philadelphia MSA Community Banks (1) Market Deposits $31.6 billion Average Deposits per Bank $319.5 million Total Branches 590 Total Institutions 99 |
|
|
6 OUR MARKET - GREATER PHILADELPHIA AREA We operate in a dynamic medium between regional and super regional competitors, and local community banks Large enough to compete with the largest financial institutions There are 115 banking institutions in the Philadelphia metro area including Beneficial 85 of these institutions have less than 10 branch locations Only 10 of these institutions including Beneficial have more than 50 branch locations Beneficial is positioned to take advantage of marketplace consolidation Enough pre-second step capital for another bank acquisition to either enhance existing branch footprint or strategically grow in other key Philadelphia/Southern New Jersey markets Also targeting fee based businesses such as specialty finance, wealth management and insurance Source: SNL Interactive (2012) |
|
|
7 PRESENTATION TOPICS Our Market Current Focus Q3 2012 Financial Highlights |
|
|
8 CURRENT FOCUS – CAPITAL & PROFITABILITY Capital Strength Maintain strong capital levels to allow strategic flexibility Continue fundamental organic growth Active balance sheet management Opportunistic acquisition strategy Continue to evaluate second step based on market and strategy Share repurchases Improved Profitability Balance sheet mix, and loan and deposit pricing Focused on operating efficiency and cost structure Developing and growing fee based businesses – completed build-out of mortgage banking team Expanding C&I team to organically grow commercial loan portfolio |
|
|
9 CURRENT FOCUS – COMMERICAL LENDING We are Investing in Experienced C&I and CRE Lenders Directors with 47 years of combined experience Team of 11 lenders Separate Business Development officers to establish new relationships CRE J. GOULD (CLO) 38 Years of Experience Director with 41 years of experience hired to lead group in Q1 2012 Team of 4 lenders Planning on expanding team in 2013 C&I |

|
|
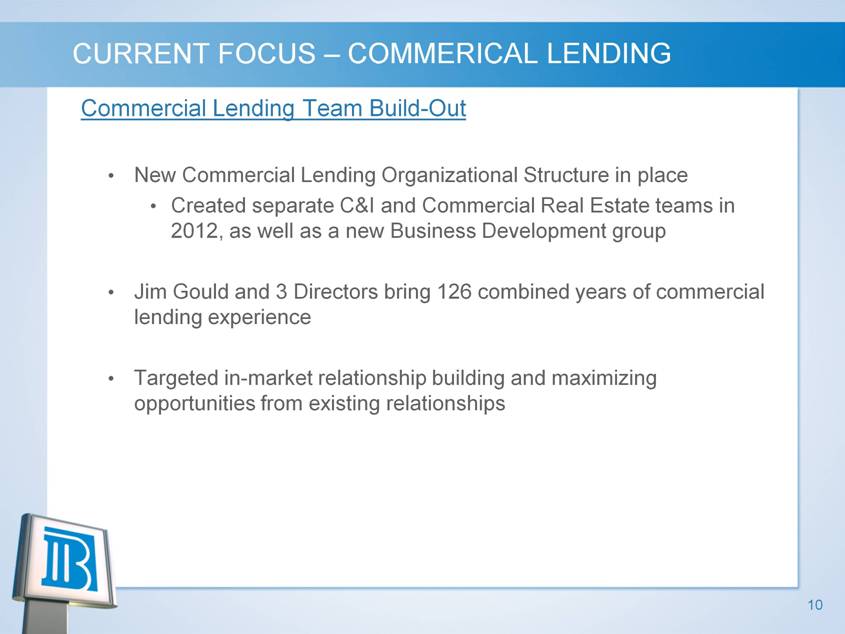
10 CURRENT FOCUS – COMMERICAL LENDING Commercial Lending Team Build-Out New Commercial Lending Organizational Structure in place Created separate C&I and Commercial Real Estate teams in 2012, as well as a new Business Development group Jim Gould and 3 Directors bring 126 combined years of commercial lending experience Targeted in-market relationship building and maximizing opportunities from existing relationships |
|
|
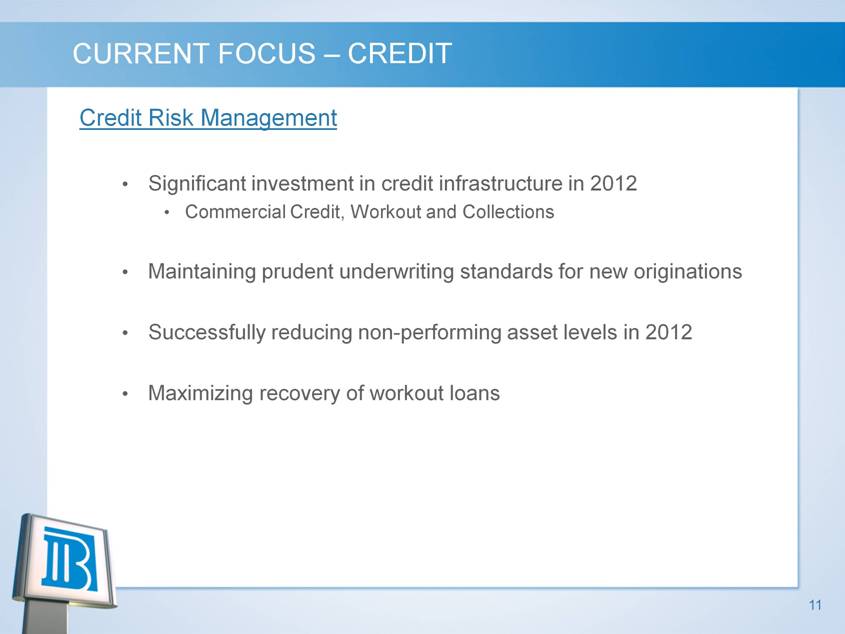
11 CURRENT FOCUS – CREDIT Credit Risk Management Significant investment in credit infrastructure in 2012 Commercial Credit, Workout and Collections Maintaining prudent underwriting standards for new originations Successfully reducing non-performing asset levels in 2012 Maximizing recovery of workout loans |
|
|
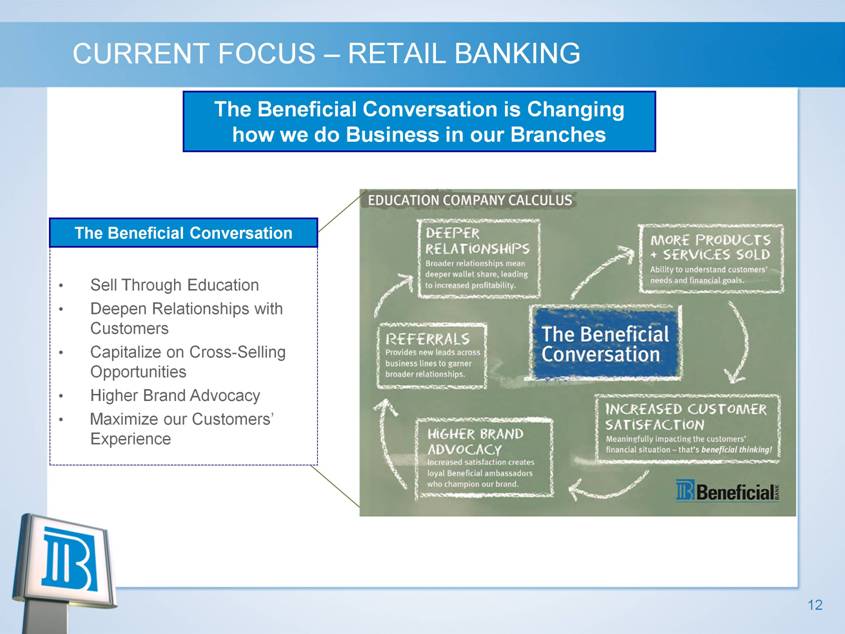
12 CURRENT FOCUS – RETAIL BANKING The Beneficial Conversation is Changing how we do Business in our Branches Sell Through Education Deepen Relationships with Customers Capitalize on Cross-Selling Opportunities Higher Brand Advocacy Maximize our Customers’ Experience The Beneficial Conversation |
|
|
13 CURRENT FOCUS – RETAIL BANKING Relationship Banking & Focused Deposit Gathering Pam Cyr (former SEFL CEO) brought in to lead Retail Banking team Align our products and services to our customers’ needs Mobile Banking Bill Pay (Q1 2013) Remote Capture (Q1 2013) On-Line Account Opening (Q4 2013) Four new branches will open in 2013 Development of alternative delivery channels Improve pricing and mix of deposits |

|
|
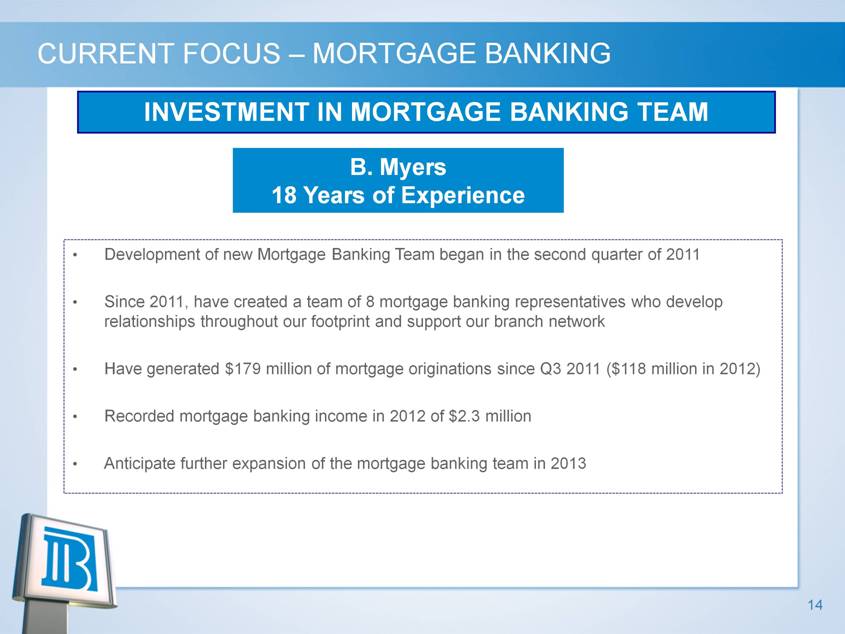
14 CURRENT FOCUS – MORTGAGE BANKING INVESTMENT IN MORTGAGE BANKING TEAM Development of new Mortgage Banking Team began in the second quarter of 2011 Since 2011, have created a team of 8 mortgage banking representatives who develop relationships throughout our footprint and support our branch network Have generated $179 million of mortgage originations since Q3 2011 ($118 million in 2012) Recorded mortgage banking income in 2012 of $2.3 million Anticipate further expansion of the mortgage banking team in 2013 B. Myers 18 Years of Experience |
|
|
15 PRESENTATION TOPICS Our Market Current Focus Q3 2012 Financial Highlights |
|
|
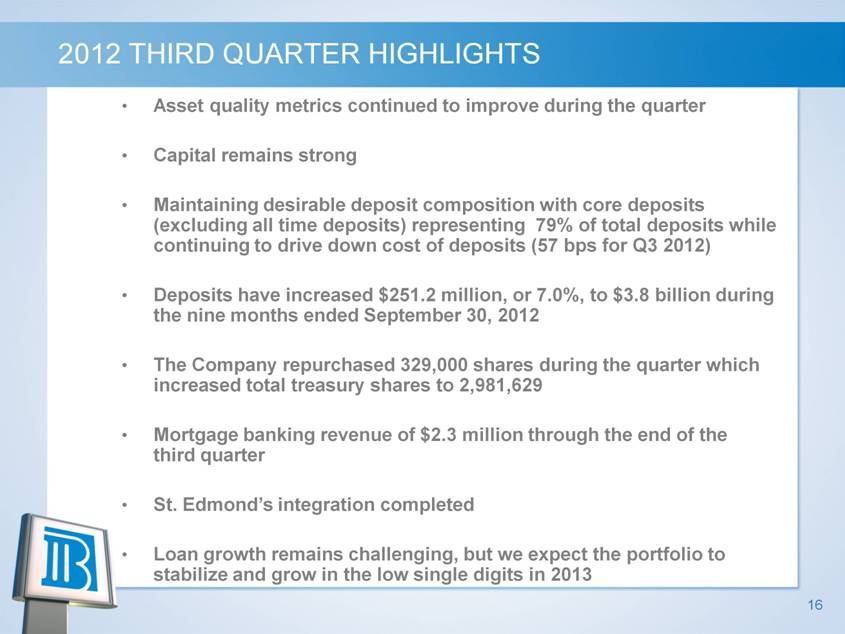
16 2012 THIRD QUARTER HIGHLIGHTS Asset quality metrics continued to improve during the quarter Capital remains strong Maintaining desirable deposit composition with core deposits (excluding all time deposits) representing 79% of total deposits while continuing to drive down cost of deposits (57 bps for Q3 2012) Deposits have increased $251.2 million, or 7.0%, to $3.8 billion during the nine months ended September 30, 2012 The Company repurchased 329,000 shares during the quarter which increased total treasury shares to 2,981,629 Mortgage banking revenue of $2.3 million through the end of the third quarter St. Edmond’s integration completed Loan growth remains challenging, but we expect the portfolio to stabilize and grow in the low single digits in 2013 |
|
|
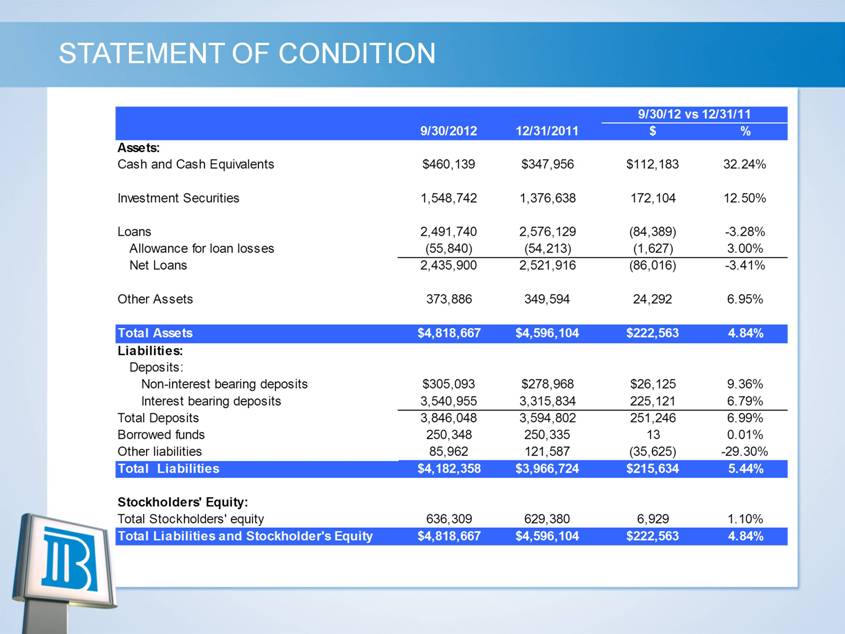
STATEMENT OF CONDITION 9/30/12 vs 12/31/11 9/30/2012 12/31/2011 $ % Assets: Cash and Cash Equivalents $460,139 $347,956 $112,183 32.24% Investment Securities 1,548,742 1,376,638 172,104 12.50% Loans 2,491,740 2,576,129 (84,389) -3.28% Allowance for loan losses (55,840) (54,213) (1,627) 3.00% Net Loans 2,435,900 2,521,916 (86,016) -3.41% Other Assets 373,886 349,594 24,292 6.95% Total Assets $4,818,667 $4,596,104 $222,563 4.84% Liabilities: Deposits: Non-interest bearing deposits $305,093 $278,968 $26,125 9.36% Interest bearing deposits 3,540,955 3,315,834 225,121 6.79% Total Deposits 3,846,048 3,594,802 251,246 6.99% Borrowed funds 250,348 250,335 13 0.01% Other liabilities 85,962 121,587 (35,625) -29.30% Total Liabilities $4,182,358 $3,966,724 $215,634 5.44% Stockholders' Equity: Total Stockholders' equity 636,309 629,380 6,929 1.10% Total Liabilities and Stockholder's Equity $4,818,667 $4,596,104 $222,563 4.84% |
|
|
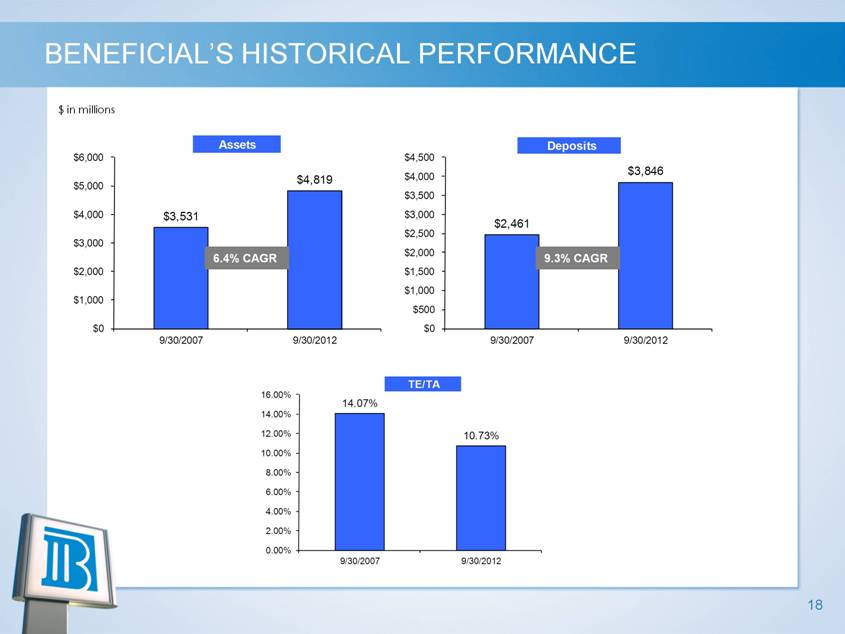
BENEFICIAL’S HISTORICAL PERFORMANCE $ in millions Assets - Deposits -$6,000 $4,500 $3,846 $4,819 $4,000 $5,000 $3,500 $4,000 $3,531 $3,000 $2,461 $2,500 $3,000 $2,000 6.4% CAGR 9.3% CAGR $2,000 $1,500 $1,000 $1,000 $500 $0 $0 9/30/2007 9/30/2012 9/30/2007 9/30/2012 TE/TA -16.00% 14.07% 14.00% 12.00% 10.73% 10.00% 8.00% 6.00% 4.00% 2.00% 0.00% 9/30/2007 9/30/2012 |
|
|
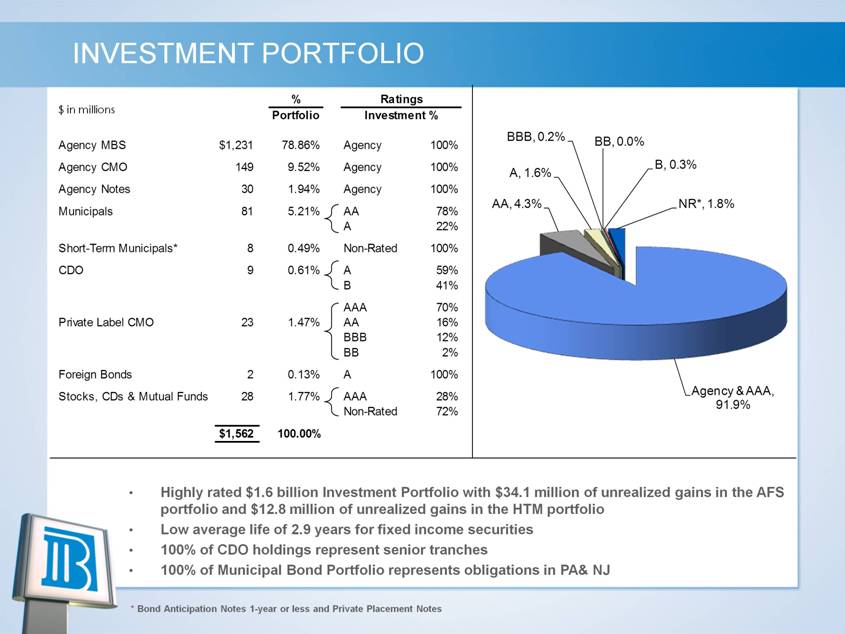
INVESTMENT PORTFOLIO % Ratings $ in millions Portfolio Investment % BBB, 0.2% BB, 0.0% Agency MBS $1,231 78.86% Agency 100% Agency CMO 149 9.52% Agency 100% B, 0.3% A, 1.6% Agency Notes 30 1.94% Agency 100% AA, 4.3% NR*, 1.8% Municipals 81 5.21% AA 78% A 22% Short-Term Municipals* 8 0.49% Non-Rated 100% CDO 9 0.61% A 59% B 41% AAA 70% Private Label CMO 23 1.47% AA 16% BBB 12% BB 2% Foreign Bonds 2 0.13% A 100% Agency & AAA, Stocks, CDs & Mutual Funds 28 1.77% AAA 28% 91.9% Non-Rated 72% $1,562 100.00% Highly rated $1.6 billion Investment Portfolio with $34.1 million of unrealized gains in the AFS portfolio and $12.8 million of unrealized gains in the HTM portfolio Low average life of 2.9 years for fixed income securities 100% of CDO holdings represent senior tranches 100% of Municipal Bond Portfolio represents obligations in PA& NJ * Bond Anticipation Notes 1-year or less and Private Placement Notes |
|
|
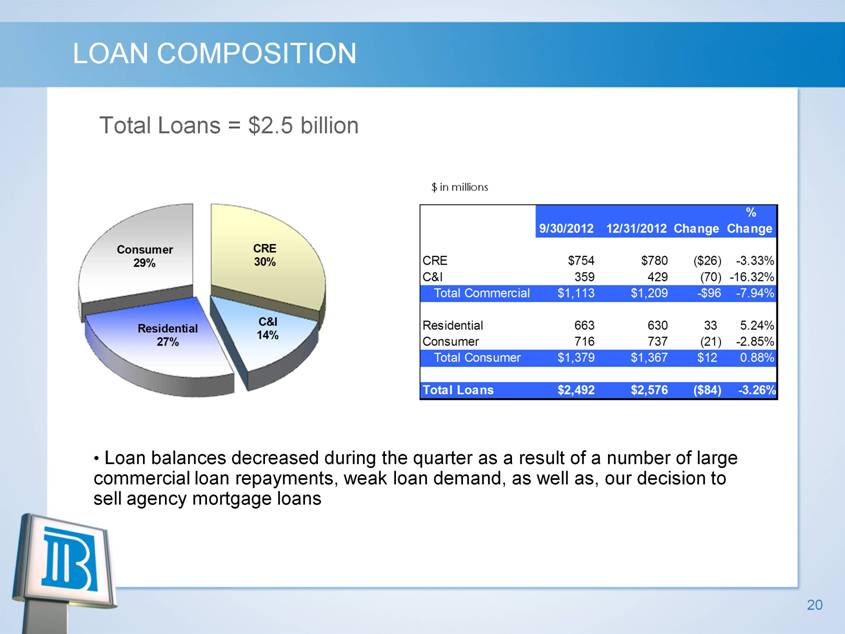
20 LOAN COMPOSITION Total Loans = $2.5 billion $ in millions Loan balances decreased during the quarter as a result of a number of large commercial loan repayments, weak loan demand, as well as, our decision to sell agency mortgage loans $ in millions % 9/30/2012 12/31/2012 Change Change CRE $754 $780 ($26) -3.33% C&I 359 429 (70) -16.32% Total Commercial $1,113 $1,209 -$96 -7.94% Residential 663 630 33 5.24% Consumer 716 737 (21) -2.85% Total Consumer $1,379 $1,367 $12 0.88% Total Loans $2,492 $2,576 ($84) -3.26% |
|
|
21 DEPOSIT COMPOSITION Total Deposits = $3.8 billion Total Core Deposits = $3.04 billion (79%) $ in millions Core deposit balances (excluding municipal deposits) increased by $371 million, which includes $220 million from the SE Financial acquisition Municipal deposits decreased by $90 million or 13% $ in millions % 9/30/2012 12/31/2011 Change Change Checking $916 $ 765 $151 19.74% Savings 1,009 783 226 28.86% Money Market 524 530 (6) -1.13% Total $2,449 $2,078 $371 17.85% Municipal Deposits 589 679 (90) -13.25% Time Deposits 808 838 (30) -3.58% Total Deposits $3,846 $3,595 $251 6.98% |

|
|
22 STATEMENT OF OPERATIONS Returned to profitability in 2011. Further improvement in 2012. However, asset quality continues to significantly improve our financial results. ($ in 000) 2008 2009 2010 2011 Q3 2012 (YTD) Interest Income $192,926 $192,974 $197,514 $180,143 $130,096 Interest Expense 78,915 65,632 49,896 38,046 23,908 Net Interest Income 114,011 127,342 147,618 142,097 106,188 Provision for loan loss 18,901 15,697 70,200 37,500 22,000 Non-Interest Income 23,604 26,847 27,220 25,236 20,789 Non-Interest Expense 98,303 119,866 128,390 120,710 92,744 Pre-Tax Earnings 20,411 18,626 (23,752) 9,123 12,233 Tax Provision (Benefit) 3,865 1,537 (14,789) (1,913) 1,869 Net Income $16,546 $17,089 ($8,963) $11,036 $10,364 Diluted EPS $0.21 $0.22 ($0.12) $0.14 $0.13 |

|
|
23 NET INTEREST MARGIN NIM will be under pressure in future periods given the continued low interest rate environment Building out commercial loan team to drive future loan growth $ in thousands $ in thousands $40,000 3. 90% $36,166 $35,569 $34,831 $34,817 $34,452 3. 70% $35,000 3. 50% 3.26% 3.23% 3.21% 3.21% 3.16% 3. 30% $30,000 3. 10% 2. 90% $25,000 2. 70% $20,000 2. 50% Q311 Q411 Q112 Q212 Q312 Net Interest Income Net Interest Margin |

|
|
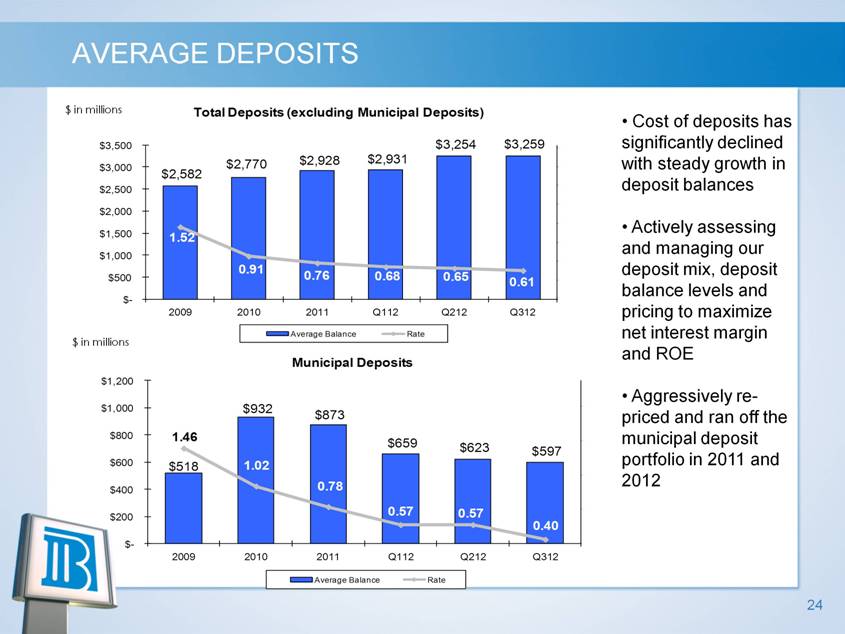
24 AVERAGE DEPOSITS $ in millions Cost of deposits has significantly declined with steady growth in deposit balances Actively assessing and managing our deposit mix, deposit balance levels and pricing to maximize net interest margin and ROE Aggressively re-priced and ran off the municipal deposit portfolio in 2011 and 2012 $ in millions $ in millions Total Deposits (excluding Municipal Deposits) $3,500 $3,254 $3,259 3.20 $2,928 $2,931 $3,000 $2,770 2.80 $2,582 2.40 $2,500 2.00 $2,000 1.60 $1,500 1.52 1.20 $1,000 0.80 0.91 0.76 0.68 $500 0.65 0.61 0.40 $- -2009 2010 2011 Q112 Q212 Q312 Average Balance Rate $ in millions Municipal Deposits $1,200 $1,000 $932 1.95 $873 $800 1.46 $659 1.55 $623 $597 $600 $518 1.02 1.15 $400 0.78 0.57 0.57 0.75 $200 0.40 $- 0.35 2009 2010 2011 Q112 Q212 Q312 Average Balance Rate |
|
|
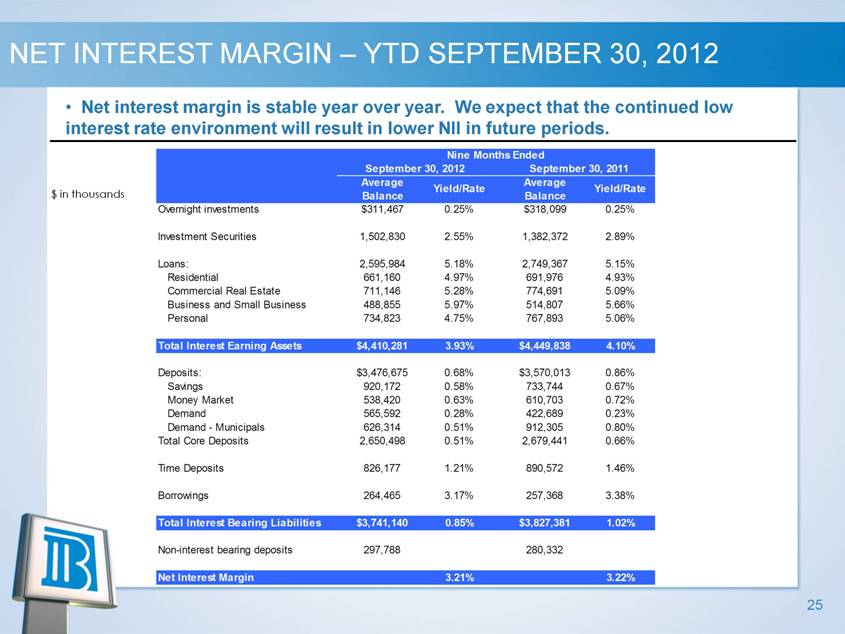
25 $ in thousands NET INTEREST MARGIN – YTD SEPTEMBER 30, 2012 Net interest margin is stable year over year. We expect that the continued low interest rate environment will result in lower NII in future periods. Nine Months Ended September 30, 2012 September 30, 2011 Average Average Yield/Rate Yield/Rate $ in thousands Balance Balance Overnight investments $311,467 0.25% $318,099 0.25% Investment Securities 1,502,830 2.55% 1,382,372 2.89% Loans: 2,595,984 5.18% 2,749,367 5.15% Residential 661,160 4.97% 691,976 4.93% Commercial Real Estate 711,146 5.28% 774,691 5.09% Business and Small Business 488,855 5.97% 514,807 5.66% Personal 734,823 4.75% 767,893 5.06% Total Interest Earning Assets $4,410,281 3.93% $4,449,838 4.10% Deposits: $3,476,675 0.68% $3,570,013 0.86% Savings 920,172 0.58% 733,744 0.67% Money Market 538,420 0.63% 610,703 0.72% Demand 565,592 0.28% 422,689 0.23% Demand - Municipals 626,314 0.51% 912,305 0.80% Total Core Deposits 2,650,498 0.51% 2,679,441 0.66% Time Deposits 826,177 1.21% 890,572 1.46% Borrowings 264,465 3.17% 257,368 3.38% Total Interest Bearing Liabilities $3,741,140 0.85% $3,827,381 1.02% Non-interest bearing deposits 297,788 280,332 Net Interest Margin 3.21% 3.22% |
|
|
26 ASSET QUALITY SUMMARY Credit costs have decreased during the quarter but continue to have a significant impact on our financial results During the quarter, we recorded a provision for credit losses of $7.0 million compared to $9.0 million in the prior year We have seen improvement in our credit quality with non-performing assets, excluding guaranteed students loans, decreasing $37.4 million, or 27.1% to $100.6 million, as compared to $138 million as of September 30, 2011. However charge-offs remain high. We remain cautious as we continue to build our Allowance for Loan Loss with the reserve coverage ratio now at 2.24%, which is markedly higher than our peer group’s average. Excluding the acquired SE Financial loan portfolio which was recorded at fair market value, our loan loss reserve coverage is 2.39%. We expect that the provision for credit losses will remain elevated in 2012 as we continue to focus on reducing our non-performing asset levels |
|
|
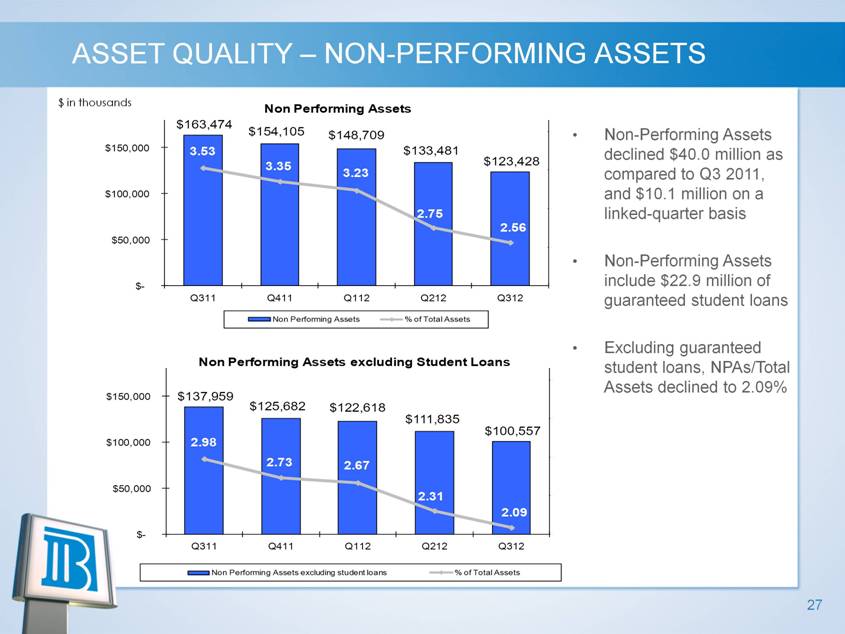
27 ASSET QUALITY – NON-PERFORMING ASSETS $ in thousands Non-Performing Assets declined $40.0 million as compared to Q3 2011, and $10.1 million on a linked-quarter basis Non-Performing Assets include $22.9 million of guaranteed student loans Excluding guaranteed student loans, NPAs/Total Assets declined to 2.09% $ in thousands Non Performing Assets $163,474 $154,105 $148,709 4.00 $150,000 3.53 $133,481 $123,428 3.35 3.50 3.23 $100,000 3.00 2.75 2.56 $50,000 2.50 $- 2.00 Q311 Q411 Q112 Q212 Q312 Non Performing Assets % of Total Assets Non Performing Assets excluding Student Loans 4.00 $150,000 $137,959 $125,682 $122,618 $111,835 3.50 $100,557 $100,000 2.98 3.00 2.73 2.67 $50,000 2.31 2.50 2.09 $- 2.00 Q311 Q411 Q112 Q212 Q312 Non Performing Assets excluding student loans % of Total Assets |
|
|
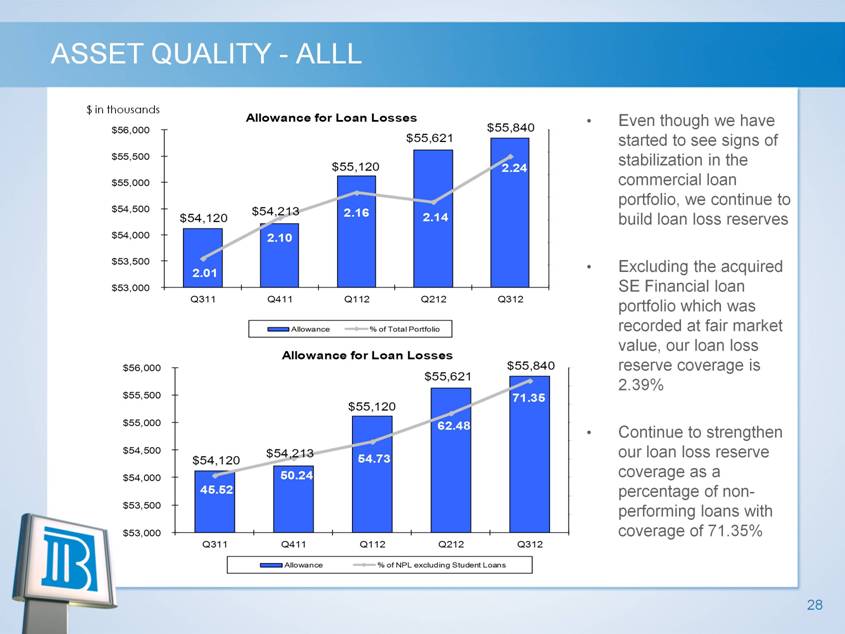
28 ASSET QUALITY - ALLL $ in thousands Even though we have started to see signs of stabilization in the commercial loan portfolio, we continue to build loan loss reserves Excluding the acquired SE Financial loan portfolio which was recorded at fair market value, our loan loss reserve coverage is 2.39% Continue to strengthen our loan loss reserve coverage as a percentage of non-performing loans with coverage of 71.35% $ in thousands Allowance for Loan Losses $56,000 $55,840 2.30 $55,621 2.25 $55,500 $55,120 2.24 2.20 $55,000 2.15 $54,500 $54,213 2.16 $54,120 2.14 2.10 $54,000 2.10 2.05 $53,500 2.00 2.01 $53,000 1.95 Q311 Q411 Q112 Q212 Q312 Allowance % of Total Portfolio Allowance for Loan Losses $56,000 $55,840 75.00 $55,621 70.00 $55,500 71.35 $55,120 65.00 $55,000 62.48 60.00 55.00 $54,500 $54,213 $54,120 54.73 50.00 $54,000 50.24 45.00 45.52 40.00 $53,500 35.00 $53,000 30.00 Q311 Q411 Q112 Q212 Q312 Allowance % of NPL excluding Student Loans |
|
|
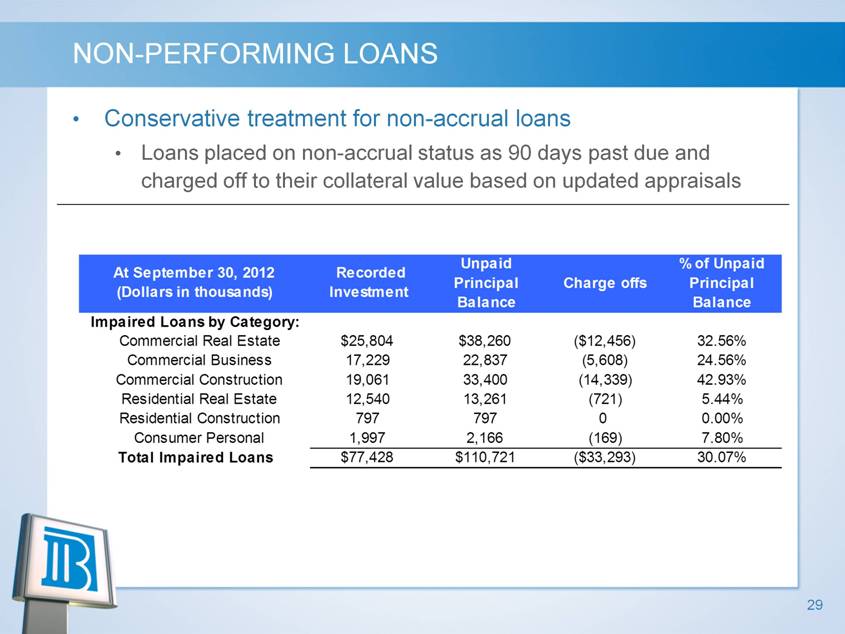
29 NON-PERFORMING LOANS Conservative treatment for non-accrual loans Loans placed on non-accrual status as 90 days past due and charged off to their collateral value based on updated appraisals Unpaid % of Unpaid At September 30, 2012 Recorded Principal Charge offs Principal (Dollars in thousands) Investment Balance Balance Impaired Loans by Category: Commercial Real Estate $25,804 $38,260 ($12,456) 32.56% Commercial Business 17,229 22,837 (5,608) 24.56% Commercial Construction 19,061 33,400 (14,339) 42.93% Residential Real Estate 12,540 13,261 (721) 5.44% Residential Construction 797 797 0 0.00% Consumer Personal 1,997 2,166 (169) 7.80% Total Impaired Loans $77,428 $110,721 ($33,293) 30.07% |
|
|
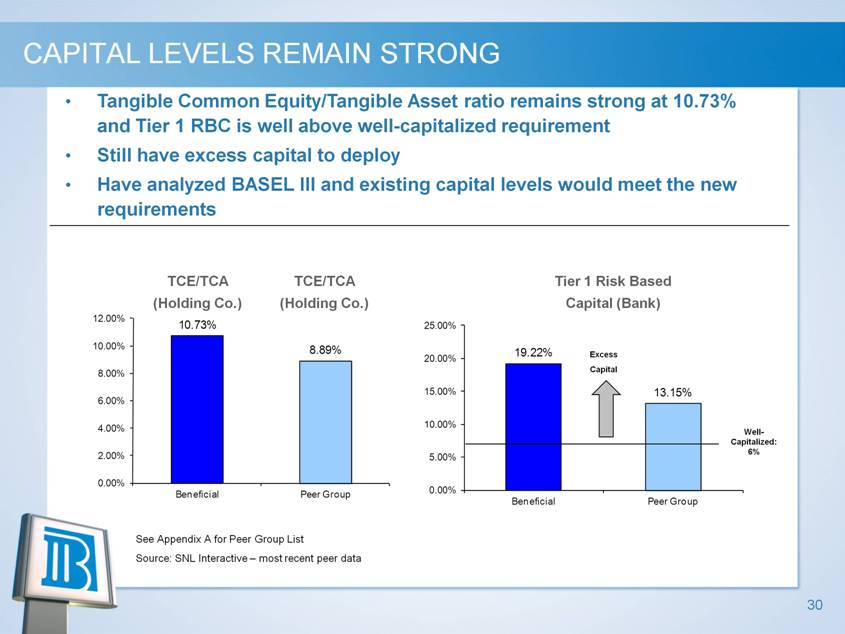
30 CAPITAL LEVELS REMAIN STRONG Tangible Common Equity/Tangible Asset ratio remains strong at 10.73% and Tier 1 RBC is well above well-capitalized requirement Still have excess capital to deploy Have analyzed BASEL III and existing capital levels would meet the new requirements Tier 1 Risk Based Capital (Bank) See Appendix A for Peer Group List Source: SNL Interactive – most recent peer data TCE/TCA (Holding Co.) TCE/TCA (Holding Co.) Well- Capitalized: 6% $298Mil $149Mil Excess Capital |
|
|
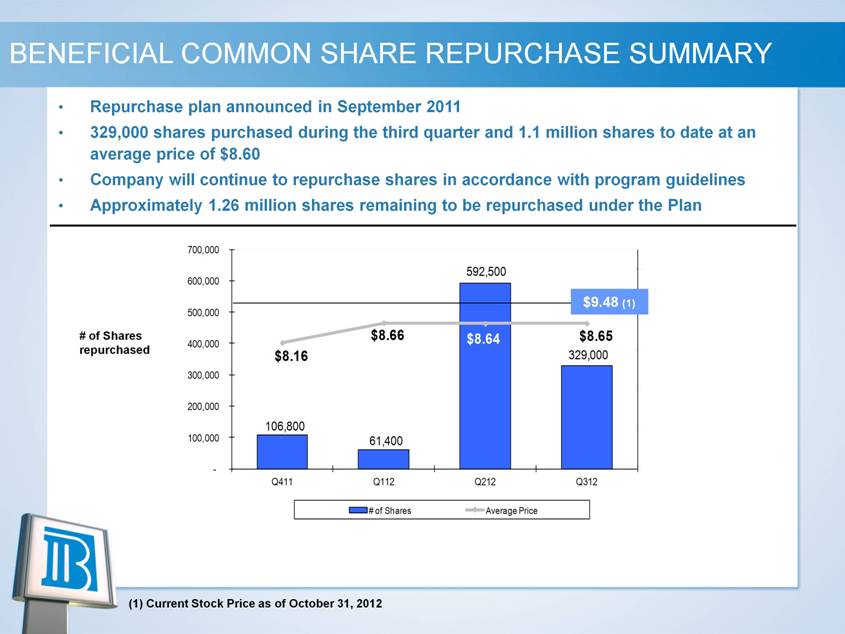
BENEFICIAL COMMON SHARE REPURCHASE SUMMARY Repurchase plan announced in September 2011 329,000 shares purchased during the third quarter and 1.1 million shares to date at an average price of $8.60 Company will continue to repurchase shares in accordance with program guidelines Approximately 1.26 million shares remaining to be repurchased under the Plan 700,000 592,500 $10.00 600,000 $9.48 (1) 500,000 # of Shares $8.66 $8.64 $8.65 400,000 repurchased $8.16 329,000 $8.00 300,000 $7.00 200,000 106,800 $6.00 100,000 61,400 - $5.00 Q411 Q112 Q212 Q312 # of Shares Average Price (1) Current Stock Price as of October 31, 2012 |
|
|
32 APPENDIX A – PEER GROUP LIST First National Bank of Pennsylvania Northwest Savings Bank First Commonwealth Bank Provident Bank (NJ) Investors Bank National Penn Bank NBT Bank, N.A. Community Bank, N.A. S&T Bank Hudson Valley Bank, N.A. Dime Savings Bank Trustco Bank Wilmington Savings Fund Society, FSB Provident Bank (NY) Flushing Savings Bank, FSB Kearny Federal Savings Bank Lakeland Bank Tompkins Trust Company |
|
|
33 |