Attached files
| file | filename |
|---|---|
| 8-K - FORM 8-K - TELEFLEX INC | d431247d8k.htm |

| 1 TELEFLEX INCORPORATED THIRD QUARTER 2012 EARNINGS CONFERENCE CALL Exhibit 99.1 |

| 2 Conference Call Logistics The release, accompanying slides, and replay webcast available online at www.teleflex.com (click on "Investors") Telephone replay available by dialing 888-286-8010 or for international calls, 617- 801-6888, pass code number 77519595 |

| 3 Introductions Benson Smith Chairman, President and CEO Thomas Powell Senior Vice President and CFO Jake Elguicze Treasurer and Vice President of Investor Relations |

| 4 4 4 4 4 4 4 Forward-Looking Statements/Additional Notes This presentation and our discussion contain forward-looking information and statements including, but not limited to, our expectation that the acquisition of LMA International N.V. will be accretive to 2012 and 2013 adjusted earnings per share; anticipated benefits related to the closure of our manufacturing facility in Mount Holly, N.J., including the expectation that it will contribute to the future expansion of gross and operating margins; forecasted 2012 constant currency revenue growth; forecasted 2012 adjusted earnings per share; and other matters which inherently involve risks and uncertainties which could cause actual results to differ from those projected or implied in the forward-looking statements. These risks and uncertainties are addressed in our SEC filings, including our most recent Form 10-K. This presentation includes certain non-GAAP financial measures, which include revenue growth on a constant currency basis; adjusted operating income and margins; adjusted earnings per share; adjusted selling, general and administrative expenses; and adjusted operating expenses. Adjusted earnings per share excludes, depending on the period presented, the effect of charges associated with a goodwill impairment, our restructuring programs and asset impairments, losses and other charges related to acquisition costs, gain on sale of businesses and assets, refinancing transactions and costs associated with severance payments and benefits to be provided to our former chief executive officer, charges associated with the amortization of additional interest expense related to an interest rate swap terminated in 2011, intangible amortization expense, the amortization of debt discount on convertible notes and certain tax adjustments relating to the resolution of various tax matters relating to prior years. Consistent with past practice, adjusted earnings per share has not been adjusted to exclude the benefit resulting from the forfeiture of equity awards. Constant currency revenue growth excludes the impact of translating the results of international subsidiaries at different currency exchange rates from period to period. Adjusted selling, general and administrative expenses and adjusted operating expenses exclude costs associated with severance payments and benefits to be provided to our former chief executive officer and acquisition costs. Adjusted operating income and margin exclude costs associated acquisitions, restructuring and impairment charges and (gain) loss on sale of businesses and assets. Reconciliation of these non-GAAP measures to the most comparable GAAP measures is contained within this presentation. The following slides reflect continuing operations. |

| 5 THIRD QUARTER 2012 HIGHLIGHTS |

| 6 Financial Highlights Revenue of $368.1 million, up 6.2% constant currency Gross margin of 49.1%, up 70 bps vs. prior year Adjusted operating margins of 16.5%, down 50 bps vs. prior year Adjusted EPS of $1.04, up 4% vs. prior year |

| 7 Strategic Development Highlights Marketplace continues to accept pricing initiatives Up 120 bps versus prior year Fifth consecutive quarter of positive year-over-year pricing Investment in research and development paying benefits Research & Development spending reaches 4.0% of revenue New product introductions contribute 150 bps to top-line growth Gained marketing clearances for new vascular access and anesthesia products |

| 8 Acquired LMA International N.V. and affiliates Global market leader in laryngeal masks Strengthens existing Anesthesia franchise Provides access to key clinical U.S. and international call points Further strengthens Group Purchasing Organization relationships Revenues of approximately $132 million in 2011 Expected to be accretive to 2012 and 2013 adjusted earnings per share Strategic Development Highlights |

| 9 Strategic Development Highlights Completed divestiture of OEM Orthopedics business Consistent with strategy to achieve higher revenue growth and expand gross and operating margins Remainder of OEM division will focus on expanding its leadership positions in custom extrusion, catheters, medical devices, sutures, and performance fibers |

| 10 Strategic Development Highlights Announced the planned closure, and reallocation of operations, of Mount Holly, N.J. manufacturing facility Reduces operational footprint Expected to contribute to future expansion of gross and operating margins |

| 11 Group Purchasing Organization and Integrated Delivery Network Update Awarded 5 GPO contracts during the quarter 2 new awards 3 award renewals Awarded 2 new IDN contracts during the quarter |

| 12 THIRD QUARTER 2012 FINANCIAL REVIEW |

| 13 Third Quarter - Financial Results Revenue of $368.1 million Up 1.5% as-reported; up 6.2% constant currency Gross margin of 49.1% Up 70 bps vs. prior year Research & development spending up 20% from prior year Adjusted operating margin of 16.5% Down 50 bps vs. prior year Adjusted EPS of $1.04, up 4% vs. prior year |

| 14 THIRD QUARTER 2012 PRODUCT & GEOGRAPHIC REVENUE REVIEW |

| 15 Product Revenue Review Critical Care Surgical Care Cardiac Care OEM 0.66 0.19 0.05 0.1 Q3'12 Q3'11 Constant Currency Revenue Commentary Critical Care Surgical Care Cardiac Care OEM 0.68 0.18 0.05 0.09 Critical Care: $244.1 million, up 4.5% Surgical Care: $69.6 million, up 10.1% Respiratory - up 9.4% Urology - up 6.5% Anesthesia - up 4.3% Vascular access - up 2.1% Cardiac Care: $17.2 million, up 1.6% OEM: $36.9 million, up 13.0% Note: Increases and decreases in revenue referred to above are as compared to results for the third quarter of 2011. |

| 16 Segment Revenue Review Americas EMEA Asia OEM 0.46 0.32 0.12 0.1 Q3'12 Q3'11 Constant Currency Revenue Commentary Americas EMEA Asia OEM 0.46 0.35 0.1 0.09 Americas: $169.7 million, up 1.7% EMEA: $116.0 million, up 3.1% Asia: $45.5 million, up 32.1% OEM: $36.9 million, up 13.0% Note: Increases and decreases in revenue referred to above are as compared to results for the third quarter of 2011. |

| 17 2012 OUTLOOK |

| 18 2012 Outlook Constant currency revenue growth range of 6.0% to 7.0% Prior guidance was 4.0% to 6.0% Adjusted earnings per share range of $4.35 to $4.40 Represents growth of between 14% to 15% Prior guidance was $4.25 to $4.45 |

| 19 QUESTION & ANSWER |

| 20 APPENDICES |

| 21 Appendix A - Reconciliation of Product Constant Currency Revenue Growth Dollars in Millions |
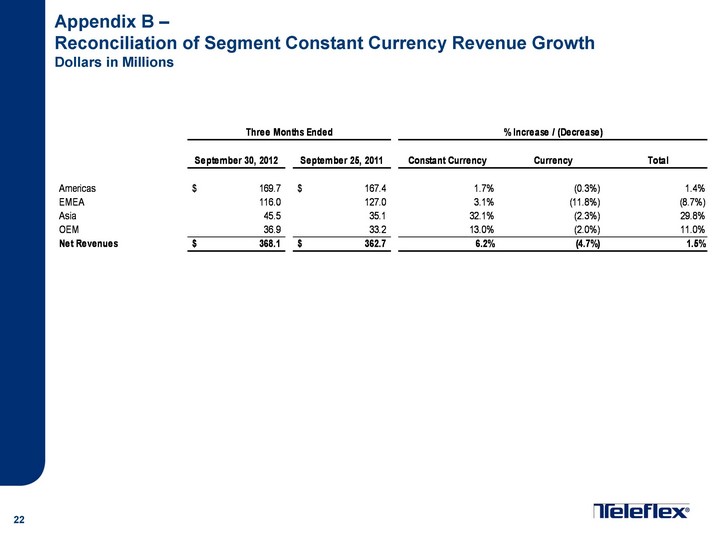
| 22 Appendix B - Reconciliation of Segment Constant Currency Revenue Growth Dollars in Millions |

| 23 Appendix C - Reconciliation of Critical Care Product Constant Currency Revenue Growth Dollars in Millions |

| 24 Appendix D - Reconciliation of Teleflex Selling, General and Administrative Expenses |

| 25 Appendix E - Reconciliation of Teleflex Operating Expenses |

| 26 Appendix F - Third Quarter Income Statement from Continuing Operations Dollars in millions, except per share |

| 27 Appendix G - EPS Reconciliation from Continuing Operations In 2012, losses and other charges include approximately $8.4 million, net of tax, or $0.20 per share, related to acquisition costs. In 2011, the Company terminated our interest rate swap that, at the date of termination, had a notional amount of $350 million. The interest rate swap was designated as a cash flow hedge against the term loan under our senior credit facility. At the date of termination, the interest rate swap was in a liability position, resulting in a cash payment of approximately $14.8 million, which included $3.1 million of accrued interest. In accordance with GAAP, the Company amortized this amount as additional interest expense over the remainder of the original term of the interest rate swap, which expired in September 2012. In the third quarter of 2012, the non-cash, net of tax impact was approximately $2.3 million, or $0.06 per share. The tax adjustment represents a net benefit resulting from the filing of amended prior years' tax returns. |

| 28 Appendix H - Reconciliation of Product Constant Currency Revenue Growth Dollars in Millions |

| 29 Appendix I - Reconciliation of Segment Constant Currency Revenue Growth Dollars in Millions |

| 30 Appendix J - Reconciliation of Critical Care Product Constant Currency Revenue Growth Dollars in Millions |

| 31 Appendix K - Year-to-Date Income Statement from Continuing Operations Dollars in millions, except per share |

| 32 Appendix L - EPS Reconciliation from Continuing Operations In 2012, losses and other charges include approximately $8.7 million, net of tax, or $0.22 per share, related to acquisition costs; and ($0.3) million, net of tax, or ($0.01) per share, related to a gain on sale of businesses and assets. In 2011, losses and other charges include approximately $9.8 million, net of tax, or $0.24 per share, related to the loss on extinguishment of debt; and $3.5 million, net of tax, or $0.09 per share, in charges related to severance payments and benefits provided to our former chief executive officer. In 2011, the Company terminated our interest rate swap that, at the date of termination, had a notional amount of $350 million. The interest rate swap was designated as a cash flow hedge against the term loan under our senior credit facility. At the date of termination, the interest rate swap was in a liability position, resulting in a cash payment of approximately $14.8 million, which included $3.1 million of accrued interest. In accordance with GAAP, the Company amortized this amount as additional interest expense over the remainder of the original term of the interest rate swap, which expired in September 2012. In the first nine months of 2012, the non-cash, net of tax impact was approximately $7.0 million, or $0.17 per share. The tax adjustment represents a net benefit resulting from (i) the resolution (including the expiration of statutes of limitations) of various prior years' U.S. federal, state and foreign tax matters, and (ii) the filing of amended prior years' tax returns. The Company has presented results using basic weighted average shares with the impact of dilution on adjusted income, separately. In accordance with ASC 260, if income from continuing operations is a loss no potential common shares are included in the computation of diluted per-share amounts because inclusion would result in an anti-dilutive per share amount. |

| 33 Appendix M - Reconciliation of 2012 Outlook Earnings per Share Guidance Note: In 2012, special items include approximately $7.0 million, net of tax, or $0.17 per share related to the acceleration of an interest rate swap; approximately $14.5 million, net of tax, or $0.36 per share related to acquisition costs; approximately ($9.0) million, net of tax, or ($0.22) per share related to tax adjustments; approximately ($0.3) million, net of tax, or ($0.01) per share related to a gain on sale of businesses and assets; approximately $3.3 million, net of tax, or $0.08 per share related to restructuring costs; approximately ($0.03) per share associated with using basic weighted average shares when computing expected full year earnings per share. |