Attached files
| file | filename |
|---|---|
| 8-K - FORM 8-K - C. H. ROBINSON WORLDWIDE, INC. | d427593d8k.htm |
| EX-99.1 - PRESS RELEASE DATED OCTOBER 23, 2012 OF C.H. ROBINSON WORLDWIDE, INC - C. H. ROBINSON WORLDWIDE, INC. | d427593dex991.htm |
 Earnings Conference Call –
Third Quarter 2012
October 23, 2012
John Wiehoff, Chairman & CEO
Chad Lindbloom, CFO
Angie Freeman, VP
Exhibit 99.2 |
 2
Safe Harbor Statement
Except for the historical information contained herein, the matters set forth in
this presentation and the accompanying earnings release are
forward-looking statements that represent our expectations, beliefs,
intentions or strategies concerning future events. These forward-looking
statements are subject to certain risks and uncertainties that could cause actual
results to differ materially from our historical experience or our present
expectations, including, but not limited to such factors as changes in
economic conditions, including uncertain consumer demand; changes in market
demand and pressures on the pricing for our services; competition and growth
rates within the third party logistics industry; freight levels and increasing costs and
availability of truck capacity or alternative means of transporting freight, and
changes in relationships with
existing
truck,
rail,
ocean
and
air
carriers; changes in our customer base due
to possible consolidation
among
our
customers;
our
ability
to integrate the operations of
acquired companies with
our
historic
operations
successfully;
risks associated with litigation
and
insurance
coverage;
risks
associated
with
operations
outside
of
the
U.S.;
risks
associated
with
the
potential
impacts
of
changes
in
government
regulations;
risks
associated
with
the
produce industry, including food safety and contamination issues; fuel prices and
availability; the impact of war on the economy; and other risks and
uncertainties detailed in our Annual and Quarterly Reports.
Any forward-looking statement speaks only as of the date on which such
statement is made, and we undertake no obligation to update such statement
to reflect events or circumstances arising after such date. All remarks made
during our financial results conference call will be current at the time of
the call and we undertake no obligation to update the replay. |
 3
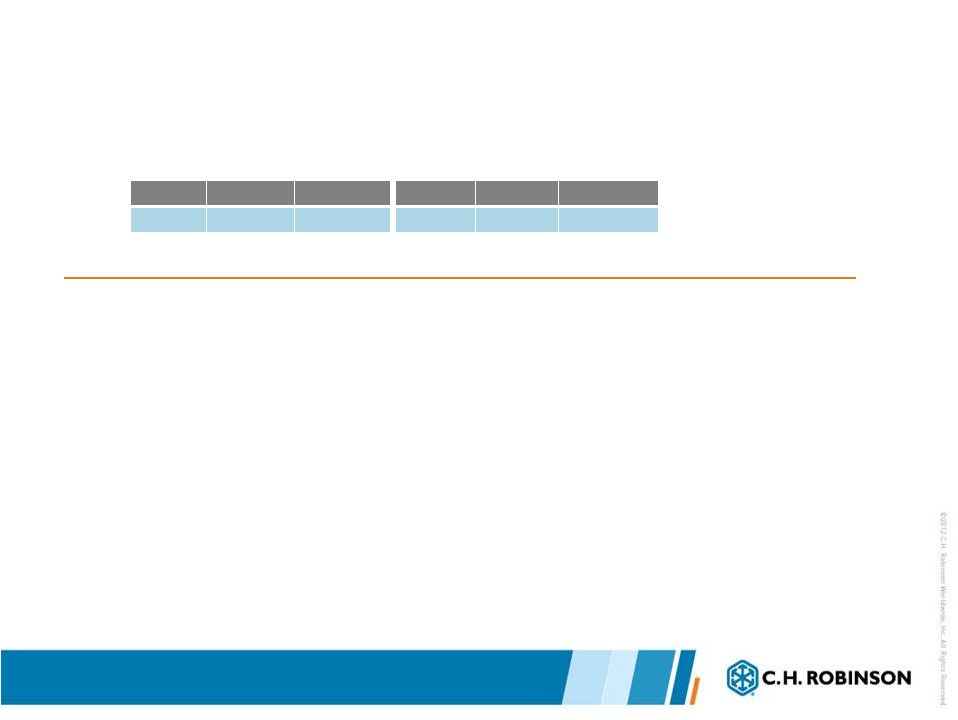
Q3 2012 Results
2012
2011
% Change
2012
2011
% Change
Total revenues
$2,880,409
$2,694,928
6.9%
$8,388,237
$7,768,062
8.0%
Total net revenues
$432,670
$423,066
2.3%
$1,272,939
$1,231,273
3.4%
Income from
operations
$187,257
$183,965
1.8%
$541,716
$520,775
4.0%
Net income
$116,330
$114,347
1.7%
$337,412
$322,398
4.7%
Earnings per share
(diluted)
$0.72
$0.70
2.9%
$2.08
$1.95
6.7%
Three months ended September 30
Nine months ended September 30
In thousands, except per share amounts |
 4
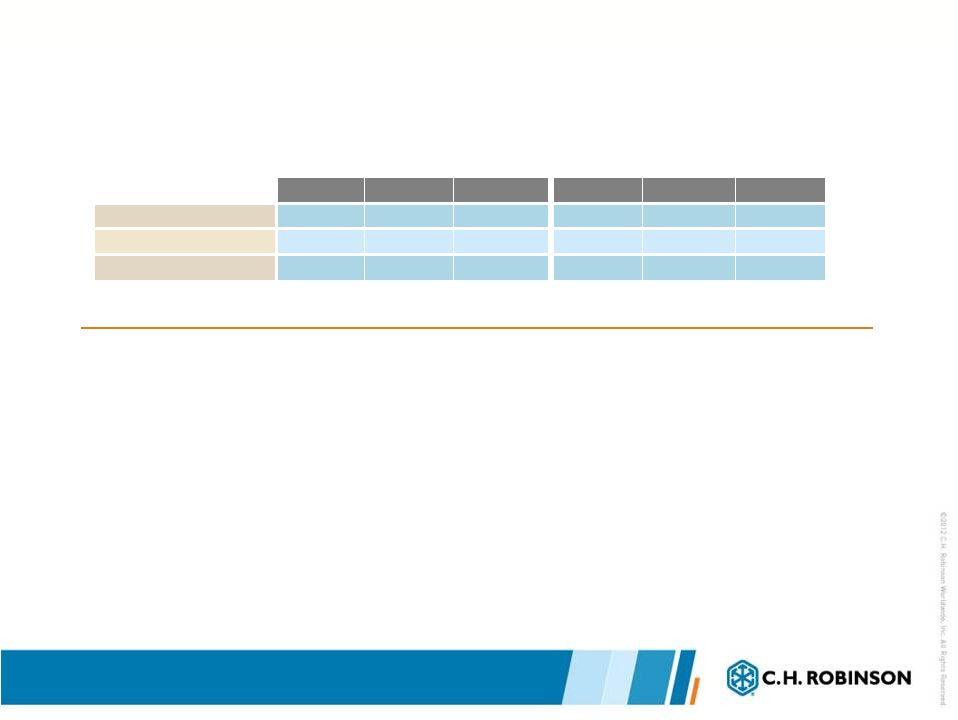
Transportation Results Q3 2012
•
Volume growth in nearly all services.
•
Consolidated transportation net revenue margin declined in the quarter due to
margin compression in truckload, LTL, and intermodal services.
2012
2011
% Change
2012
2011
% Change
Total revenues
$2,445,883
$2,280,208
7.3%
$7,099,485
$6,540,266
8.6%
Total net revenues
$382,774
$374,477
2.2%
$1,118,996
$1,085,244
3.1%
Net revenue margin
15.6%
16.4%
-4.7%
15.8%
16.6%
-5.0%
Three months ended September 30
Nine months ended September 30
TRANSPORTATION in thousands
TRANSPORTATION NET REVENUE MARGIN PERCENTAGE
2002
2003
2004
2005
2006
2007
2008
2009
2010
2011
2012
Q1
17.7%
17.8%
16.8%
17.4%
18.3%
20.2%
18.2%
22.6%
17.4%
17.2%
16.9%
Q2
16.1%
15.9%
15.4%
16.3%
17.1%
17.9%
15.4%
20.6%
15.8%
16.2%
14.9%
Q3
15.6%
16.0%
15.9%
16.3%
17.5%
18.0%
15.9%
19.8%
16.6%
16.4%
15.6%
Q4
16.2%
15.8%
16.0%
15.7%
18.3%
17.7%
19.0%
18.3%
17.6%
16.3% |
 5
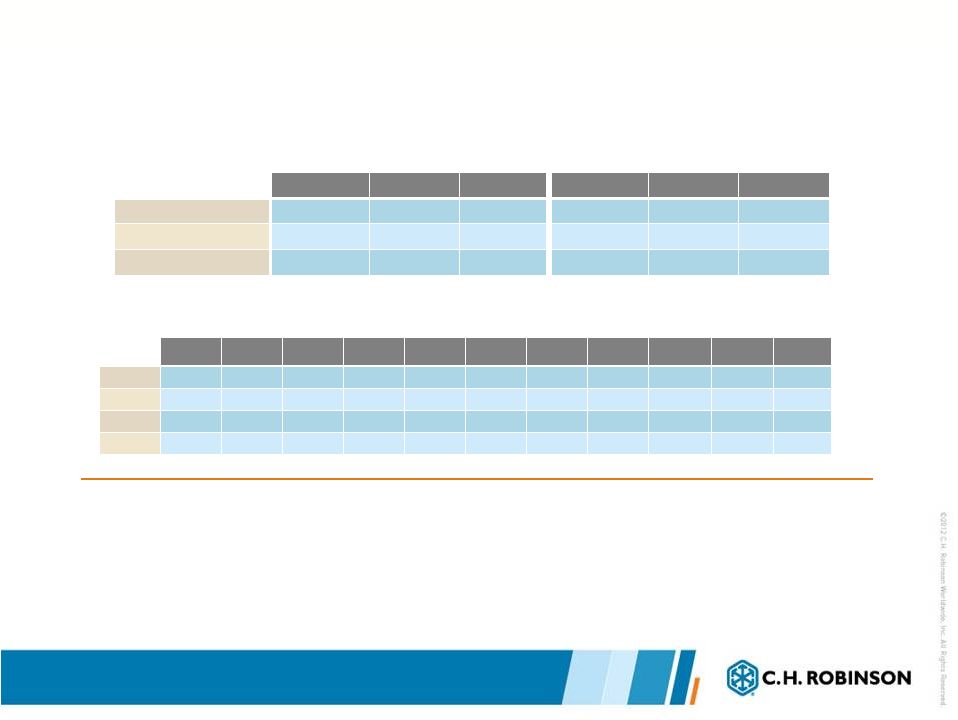
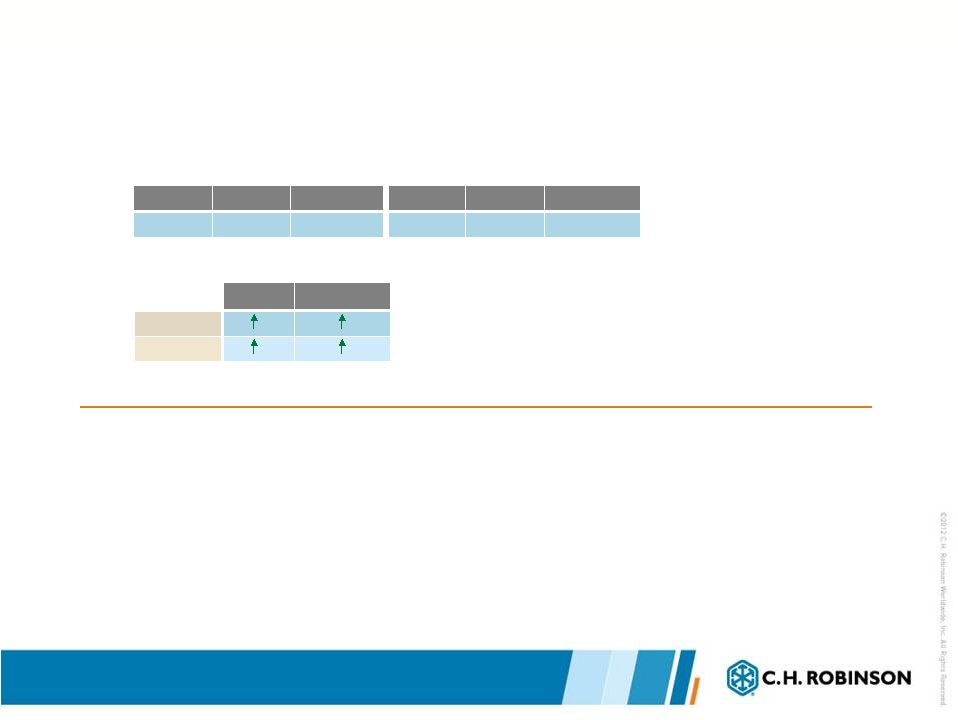
Truck Results Q3 2012
2012
2011
% Change
2012
2011
% Change
$327,960
$321,366
2.1%
$956,007
$930,168
2.8%
Three months ended September 30
Nine months ended September 30
TRUCK NET REVENUES in thousands
Quarter
Year to Date
Volume
8%
9%
Pricing *
Flat
1%
Net revenue margin
TRUCKLOAD
Quarter
Year to Date
Volume
17%
16%
Pricing
Net revenue margin
LTL
Year over year change
Year over year change
*Excluding estimated impact of fuel
•
Truckload volume growth offset by net revenue margin decline.
•
Truckload cost per mile increased; our pricing to our customers was flat. Fuel not
a factor in net
revenue
margin
compression
in
the
third
quarter
of
2012
compared
to
the
third
quarter
of
2011.
•
Less-than-Truckload net revenue growth of approximately 11 percent driven
primarily by volume growth, partially offset by decreased net revenue
margin. |
 6
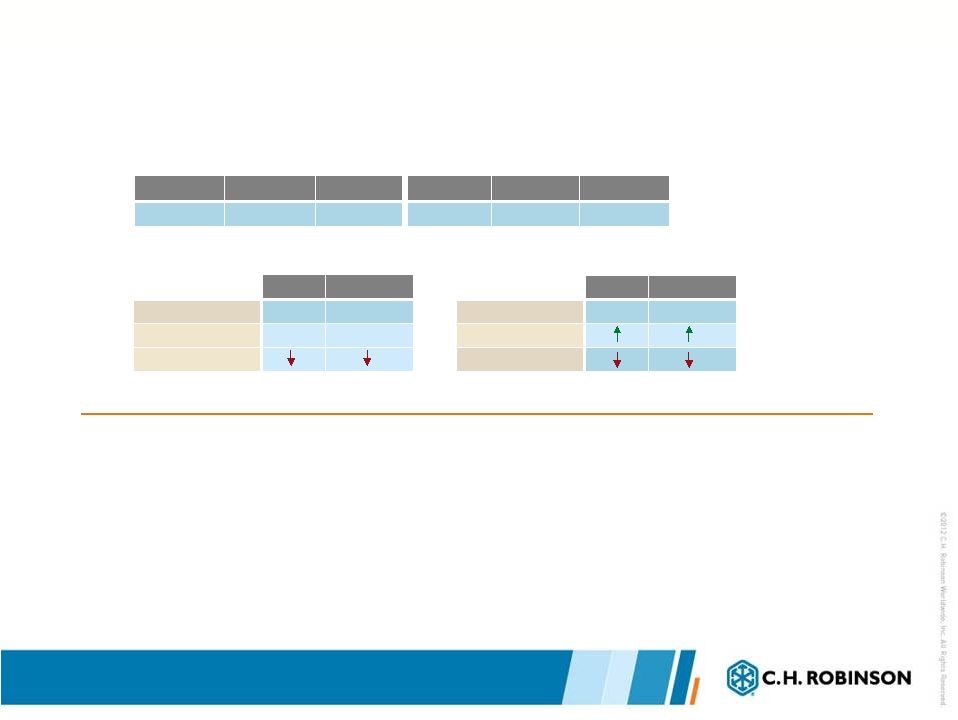
Intermodal Results Q3 2012
•
Net revenue decline due to net revenue margin compression, partially offset by
volume growth.
•
Net revenue margin decline due to changing mix of business and increased cost of
capacity. •
Approximately 1,000 owned containers now in service.
2012
2011
% Change
2012
2011
% Change
$10,074
$10,538
-4.4%
$29,804
$31,000
-3.9%
Three months ended September 30
Nine months ended September30
INTERMODAL NET REVENUES in thousands
Quarter
Year to Date
Volume
Pricing
Net revenue margin
Year over year change |
 7
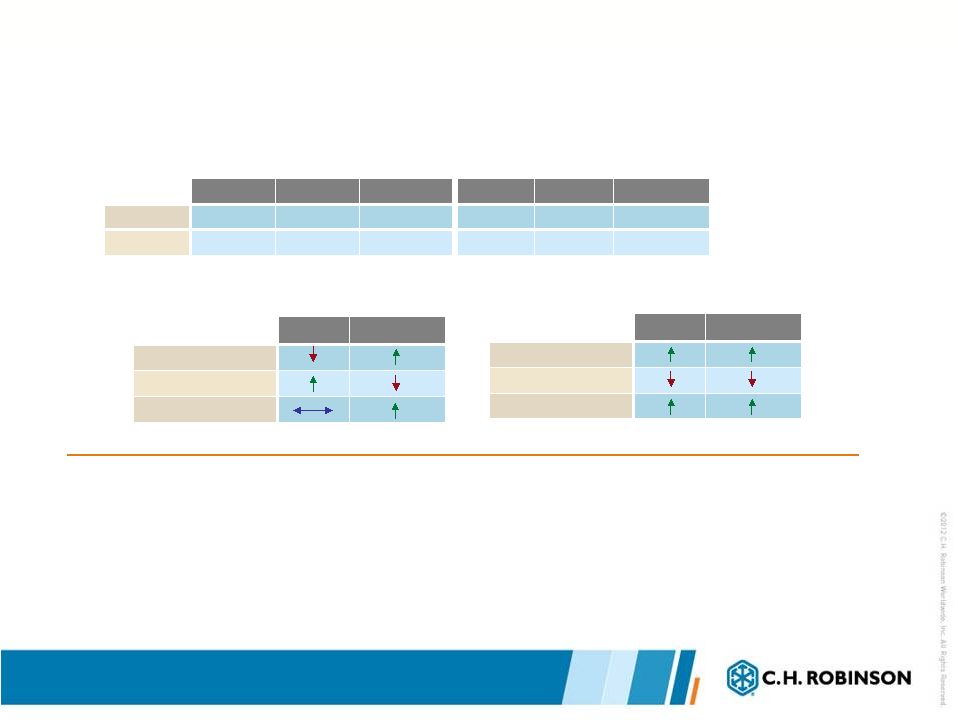
Ocean & Air Results Q3 2012
2012
2011
% Change
2012
2011
% Change
Ocean
$18,498
$17,881
3.5%
$51,217
$49,851
2.7%
Air
$9,046
$9,940
-9.0%
$28,496
$30,560
-6.8%
Three months ended September 30
Nine months ended September 30
NET REVENUES in thousands
Quarter
Year to Date
Volume
Pricing
Net revenue margin
OCEAN
Quarter
Year to Date
Volume
Pricing
Net revenue margin
AIR
Year over year change
Year over year change
•
Ocean net revenue growth due to increased pricing, partially offset by volume
declines. •
Air net revenue decline due to decreased pricing. Air volumes increased and
net revenue margin expanded. |
 8
Other Logistics Services Results Q3 2012
•
Other Logistics Services includes Transportation Management Services, Customs,
Warehousing, and Small Parcel.
•
Transportation Management and Customs primarily drove net revenue growth in the
quarter. 2012
2011
% Change
2012
2011
% Change
$17,196
$14,752
16.6%
$53,472
$43,665
22.5%
Three months ended September 30
Nine months ended September 30
NET REVENUES in thousands
|
 9
Sourcing Results Q3 2012
•
Sourcing net revenue growth driven by increased volumes, partially offset by
decreased net revenue margin.
•
Excluding Timco, which was acquired on September 26, 2011, we estimate Sourcing
net revenues declined 2% in the quarter.
•
Growth with large customers drove volume increases.
2012
2011
% Change
2012
2011
% Change
Total revenues
$418,377
$399,220
4.8%
$1,240,704
$1,182,784
4.9%
Total net revenues
$33,747
$33,089
2.0%
$105,895
$101,017
4.8%
Net revenue margin
8.1%
8.3%
-2.7%
8.5%
8.5%
0.0%
Three months ended September 30
Nine months ended September 30
SOURCING in thousands |
 10
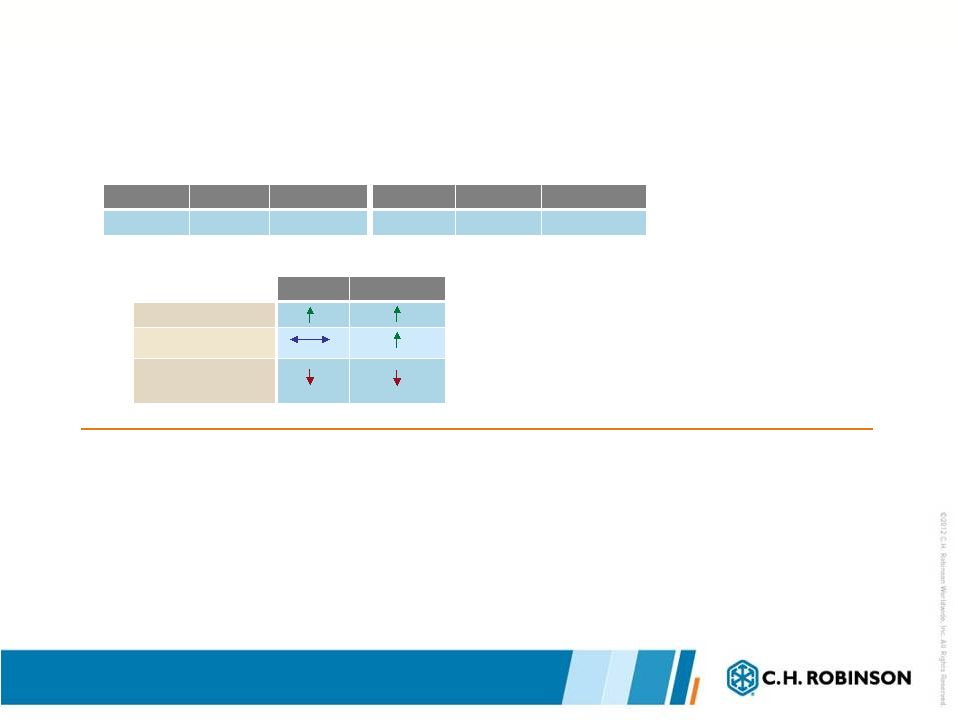
Payment Services Results Q3 2012
2012
2011
% Change
2012
2011
% Change
$16,149
$15,500
4.2%
$48,048
$45,012
6.7%
Three months ended September 30
Nine months ended September 30
PAYMENT SERVICES Net Revenues in thousands
Quarter
Year to Date
Volume
Pricing
Year over year change
•
Net revenue growth due primarily to transaction volume increases.
•
Fuel services, MasterCard
®
, and permit services drove net revenue growth.
•
On October 16, 2012, we completed the sale of our Payment Services business,
T-Chek Systems, Inc., to Electronic Funds Source, LLC.
|
 11
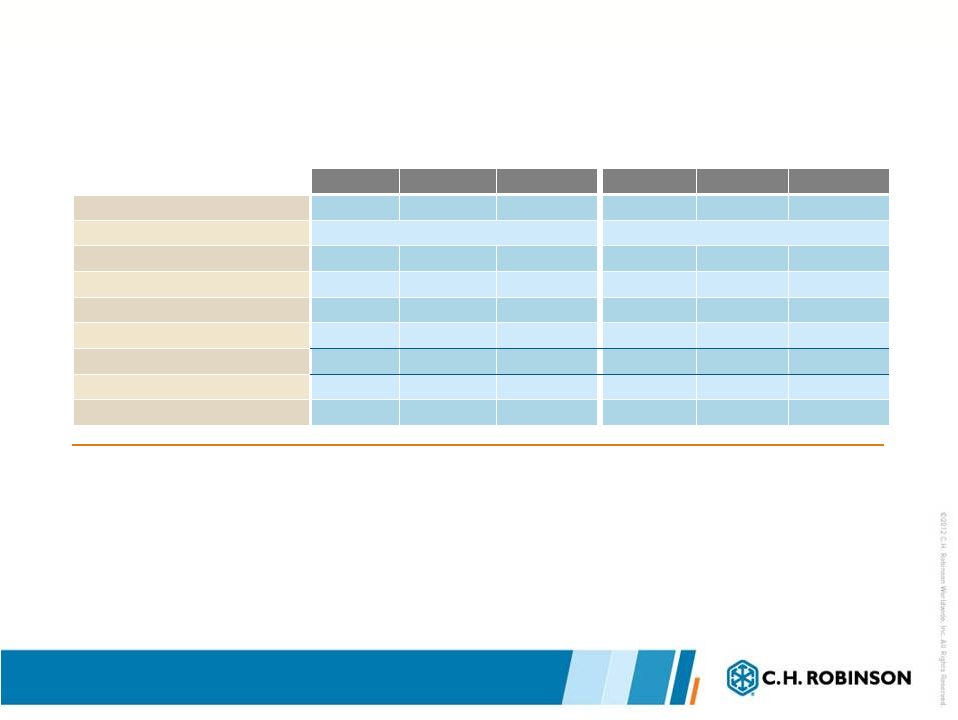
Summarized Income Statement
2012
2011
% Change
2012
2011
% Change
Total net revenues
$432,670
$423,066
2.3%
$1,272,939
$1,231,273
3.4%
Operating expenses:
Personnel expenses
$179,342
$178,117
0.7%
$539,964
$532,171
1.5%
Percent of net revenues
41.5%
42.1%
42.4%
43.2%
Other operating expenses
$66,071
$60,984
8.3%
$191,259
$178,327
7.3%
Percent of net revenues
15.3%
14.4%
15.0%
14.5%
Total Operating expenses
$245,413
$239,101
2.6%
$731,223
$710,498
2.9%
Income from Operations
$187,257
$183,965
1.8%
$541,716
$520,775
4.0%
Percent of net revenues
43.3%
43.5%
42.6%
42.3%
Three months ended September 30
Nine months ended September 30
•
Average headcount grew approximately 9.0% in the third quarter.
•
For the quarter, personnel expense as a percentage of net revenue decreased due to
declines in incentive compensation plans that are based on growth in
earnings. •
Other operating expense growth driven primarily by an increased provision for
doubtful accounts, accounting and legal due diligence costs related to
acquisitions, and increased travel expenses.
In thousands |
 12
2012
2011
% Change
2012
2011
% Change
Net cash provided by operating
activities
$157,128
$214,701
-26.8%
$267,156
$293,555
-9.0%
Capital expenditures, net
$13,921
$9,296
49.8%
$38,891
$29,081
33.7%
Three months ended September 30
Nine months ended September 30
Quarter
Year to Date
Shares repurchased
1,079,674
2,784,652
Average price per
share
$54.99
$60.01
Total cost of shares
repurchased
$59,371
$167,105
Cash &
investments
$272,955
Current assets
$1,726,166
Total assets
$2,243,267
Current liabilities
$938,055
Stockholders’
investment
$1,290,875
CASH FLOW DATA
2012
BALANCE SHEET DATA
REPURCHASES OF COMMON STOCK
Other Financial Information
In thousands, except share and per share amounts
September 30, 2012 |
 13
Strategic Alignment Update
Focus on core strategy:
•
Phoenix International acquisition:
•
Expected November 1, 2012 closing
•
Total purchase price of $635 million; 90% cash and 10% newly-issued CHRW
stock •
Integration planning is ongoing
•
Approximately $8 million of acquisition-related expenses expected in Q4
2012 •
T-Chek divestiture:
•
Sale proceeds of $302.5 million were received on closing date, subject to
post-closing adjustments
•
Estimated tax amount of $100 million will be paid on March 15, 2013
•
Carriers should see no change in cash advance services
Capital structure:
•
Target capital structure strategy is being reviewed
•
Interest rate environment
•
Valuation of stock
•
Expect dividends and share repurchase activity to continue
•
Credit facility:
•
$500 million revolver with a $500 million accordion feature; 5 year term
•
Opening spread of 1.0% over LIBOR. Grid-based pricing based on debt to
capitalization •
Expected to close at end of October |
 |