Attached files
| file | filename |
|---|---|
| 8-K - 8-K - Beneficial Mutual Bancorp Inc | a12-22368_18k.htm |
Exhibit 99.1
|
|
Beneficial Mutual Bancorp Investor Presentation Second Quarter - Ended June 30, 2012 |
|
|
1 SAFE HARBOR STATEMENT This presentation may contain projections and other “forward-looking statements” within the meaning of the federal securities laws. These statements are not historical facts, rather statements based on the current expectations of Beneficial Mutual Bancorp, Inc. (the “Company”) regarding its business strategies, intended results and future performance. Forward-looking statements are preceded by terms such as “expects,” “believes,” “anticipates,” “intends” and similar expressions. Management’s ability to predict results or the effect of future plans or strategies is inherently uncertain. Factors that could affect actual results include interest rate trends, the general economic climate in the market area in which the Company operates, as well as nationwide, the Company’s ability to control costs and expenses, competitive products and pricing, loan delinquency rates, changes in federal and state legislation and regulation and other factors that may be described in the Company’s filings with the Securities and Exchange Commission, including its Annual Reports on Form 10-K and Quarterly Reports on Form 10-Q and other required filings. These factors should be considered in evaluating the forward-looking statements and undue reliance should not be placed on such statements. The Company assumes no obligation to update any forward-looking statements. This presentation includes interim and unaudited financials, which are subject to further review by the Company’s independent accountants. |
|
|
2 COMPANY SNAPSHOT Founded in 1853 Oldest and largest bank headquartered in Philadelphia 3rd largest publicly traded mutual holding company by Assets |
|
|
3 PRESENTATION TOPICS Our Market Current Focus Financial Performance Asset Quality St. Edmond’s Update |
|
|
4 OUR MARKET - GREATER PHILADELPHIA AREA We operate in a dynamic medium between regional and super regional competitors, and local community banks Large enough to compete with the largest financial institutions There are 115 banking institutions in the Philadelphia metro area including Beneficial 87 of these institutions have less than 10 branch locations Only 10 of these institutions including Beneficial have more than 50 branch locations Beneficial is positioned to take advantage of marketplace consolidation Source: SNL Interactive |
|
|
5 OUR MARKET - GREATER PHILADELPHIA AREA 5th largest metropolitan region in the U.S. 63 colleges and universities Median household income of $58k versus national median of $50k 62 branches (36 in PA, 26 in NJ) Population of 6.0 million Sources: U.S. Census Bureau, SNL Interactive (2011) |
|
|
6 OUR PRESENCE & MARKET OPPORTUNITY #1 Ranked Thrift and #9 Overall in Philadelphia MSA Still have opportunities for growth in our marketplace Source: SNL Interactive (2011) |
|
|
7 PRESENTATION TOPICS Our Market Current Focus Financial Performance Asset Quality St. Edmond’s Update |
|
|
8 CURRENT FOCUS Capital Strength Maintain strong capital levels to allow strategic flexibility Continue fundamental organic growth Active balance sheet management Opportunistic acquisition strategy Continue to evaluate second step based on market and strategy Improved Profitability Balance sheet mix, and loan and deposit pricing Focused on operating efficiency, and cost structure Developing and growing fee based businesses – completed build-out of mortgage banking team Expanding C&I team to organically grow commercial loan portfolio |
|
|
9 CURRENT FOCUS Relationship banking & focused deposit gathering Align our products and services to our customers’ needs BankThanks Reward Program Mobile Banking All-Purpose Small Business Packages with Interest Bearing Checking Accounts Drive core business growth Development of alternative delivery channels Improve pricing and mix of municipal deposits Credit risk management Maintaining prudent underwriting standards Continue credit and loss prevention discipline Reducing non-performing asset levels Maximizing recovery of workout loans |
|
|
10 PRESENTATION TOPICS Our Market Current Focus Financial Performance Asset Quality St. Edmond’s Update |
|
|
11 2012 Q2 SUMMARY Net income of $2.3 million, or $0.03 per share, for the quarter ended June 30, 2012, compared to net income of $2.0 million, or $0.03 per share, for the quarter ended June 30, 2011. Net income of $2.3 million includes $2.7 million of restructuring charges related to the SE Financial acquisition. Completed the acquisition of SE Financial which increased total assets by approximately $301 million. All systems have been converted and branches consolidated successfully. Non-performing loans, excluding guaranteed students loans, decreased $29.7 million, or 25% to $89 million, as compared to $118.7 million as of June 30, 2011 Mortgage banking revenue of $0.6 million recognized during the quarter generated primarily from the mortgage banking team established in 2011 Allowance for Loan Losses as a percentage of total loans outstanding increased to 2.14% as compared to 2.10% at December 31, 2011 and 1.88% at June 30, 2011. Excluding the acquired SE Financial loan portfolio which was recorded at fair market value, our loan loss reserve coverage is 2.29%. Tier 1 Leverage, Tier 1 Risk Based and Total Risk Based Capital ratios remain strong. |
|
|
12 STATEMENT OF OPERATIONS Returned to profitability in 2011. Further improvement in 2012. |
|
|
13 NET INTEREST MARGIN Despite the low interest rate environment, our net interest margin has remained relatively stable over the past several quarters given our ability to re-price the deposit portfolio; and run-off high cost municipal deposits NIM will be under pressure in future periods given our high level of overnight investments, weak overall loan demand and the impact of the current rate environment on the investment and loan portfolios. Building out commercial loan team to drive future loan growth. $ in thousands |
|
|
14 LOAN COMPOSITION Total Loans = $2.6 billion $ in millions Loan balances increased during the quarter due to the acquisition of SE Financial, which added $174.6 million to the portfolio, offset by a number large commercial loan repayments and weak loan demand |
|
|
15 AVERAGE LOANS Yields have decreased given a declining interest rate environment. Yields were higher by 8bps compared to Q1 2012. Build out of the Mortgage Team is complete; in the process of building out Commercial Lending team $ in millions |
|
|
16 DEPOSIT COMPOSITION Total Deposits = $3.8 billion; Total Core Deposits = $3.02 billion (78%) $ in millions Core deposit balances (excluding municipal deposits) increased $278 million or 12.8% on a linked quarter basis primarily due to the acquisition of SE Financial (added Core Deposits of $219.8 million) Municipal deposits decreased by $47 million or 7.7% consistent with strategy to reduce certain high cost deposits |
|
|
17 AVERAGE DEPOSITS $ in millions Cost of deposits has significantly declined with steady growth in deposit balances Actively assessing and managing our deposit mix, deposit balance levels and pricing to maximize net interest margin and ROE Aggressively re-priced and ran off the municipal deposit portfolio in 2011 and 2012 $ in millions |
|
|
18 AVERAGE BORROWINGS Cost of borrowings has declined along with underlying balances. $35 million of borrowings will mature in Q3 2012. $ in millions |
|
|
19 EFFICIENCY RATIO Efficiency ratio has improved since 2010 due to effective cost management measures Focused on improving operating efficiency Additional non-interest expense anticipated in 2012 with build out of Credit and Lending functions (1) Includes restructuring charges incurred for the respective periods (1) 72.1% 76.3% (1) |
|
|
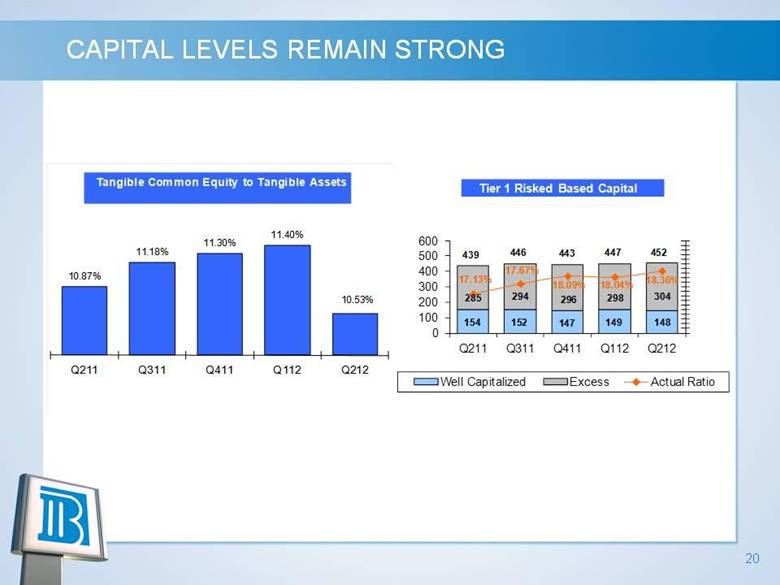
20 CAPITAL LEVELS REMAIN STRONG |
|
|
21 CAPITAL LEVELS REMAIN STRONG Tangible Common Equity/Tangible Asset ratio remains strong at 10.53% and Tier 1 RBC is well above well-capitalized requirement Tier 1 Risk Based Capital (Bank) See Appendix A for Peer Group List Source: SNL Interactive – most recent peer data TCE/TCA (Holding Co.) TCE/TCA (Holding Co.) Excess Capital Well- Capitalized: 6% $298Mil $149Mil |
|
|
22 BENEFICIAL COMMON SHARE REPURCHASES 592,500 shares repurchased during the quarter under Beneficial’s stock repurchase plan adopted in September 2011 for a total of 653,900 for 2012 Company will continue to repurchase shares in accordance with program guidelines Approximately 1.59 million shares remaining to be repurchased under the Plan |
|
|
23 PRESENTATION TOPICS Our Market Current Focus Financial Performance Asset Quality St. Edmond’s Update |
|
|
24 ASSET QUALITY SUMMARY Credit costs have decreased during the quarter but continue to have a significant impact on our financial results During the quarter we recorded a provision for credit losses of $7.5 million compared to $10.0 million in the prior year We have seen improvement in our credit quality with non-performing loans, excluding guaranteed students loans, decreasing $29.7 million, or 25% to $89 million, as compared to $118.7 million as of June 30, 2011. However charge-offs remain high. We remain cautious as we continue to build our Allowance for Loan Loss with the reserve coverage ratio now at 2.14%, which is markedly higher than our peer group’s average. Excluding the acquired SE Financial loan portfolio which was recorded at fair market value, our loan loss reserve coverage is 2.29%. We expect that the provision for credit losses will remain elevated in 2012 as we continue to focus on reducing our non-performing asset levels |
|
|
25 ASSET QUALITY Non-Performing Assets declined $29.1 million as compared to Q2 2011, and $15.2 million on a linked-quarter basis Non-Performing Assets include $21.6 million of guaranteed student loans Excluding guaranteed student loans, NPAs/Total Assets declined to 2.31% $ in thousands $ in thousands |
|
|
26 ASSET QUALITY Even though we have started to see signs of stabilization in the commercial loan portfolio, we continue to build loan loss reserves. Excluding the acquired SE Financial loan portfolio which was recorded at fair market value, our loan loss reserve coverage is 2.29%. Continue to strengthen our loan loss reserve coverage as a percentage of non-performing loans with coverage of 62.5% $ in thousands |
|
|
27 NON-PERFORMING LOANS Conservative treatment for non-accrual loans All loans put on non-accrual status as 90 days past due and charged off to their collateral value based on updated appraisals |
|
|
28 PRESENTATION TOPICS Our Market Current Focus Financial Performance Asset Quality St. Edmond’s Update |
|
|
29 ST. EDMOND’S UPDATE SE transaction was closed during the quarter All systems have been converted and branches consolidated successfully Low capital dilution in line with estimates Accretive to 2012 EPS, excluding merger expenses; and cost savings will be achieved Key employees and branch managers retained – Pam Cyr named Chief Retail Banking Officer in June 2012 |
|
|
30 APPENDIX A – PEER GROUP LIST First National Bank of Pennsylvania Northwest Savings Bank First Commonwealth Bank Provident Bank (NJ) Investors Bank National Penn Bank NBT Bank, N.A. Community Bank, N.A. S&T Bank Hudson Valley Bank, N.A. Dime Savings Bank Trustco Bank Wilmington Savings Fund Society, FSB Provident Bank (NY) Flushing Savings Bank, FSB Kearny Federal Savings Bank Lakeland Bank Tompkins Trust Company |
|
|
31 |