Attached files
| file | filename |
|---|---|
| 8-K - PULSE ELECTRONICS CORPORATION 8-K 9-13-2012 - PULSE ELECTRONICS CORP | form8k.htm |
Exhibit 99.1

Pulse Electronics Corporation
CL King 10th Annual Best Ideas
Conference
CL King 10th Annual Best Ideas
Conference
Ralph Faison, Chairman, President & CEO
Drew Moyer, CFO
September 13, 2012

2
Administrative Items
Safe Harbor
This presentation contains statements, including projections of future business objectives and financial
results, that are "forward-looking" within the meaning of the Private Securities Litigation Reform Act of
1995 and involve a number of risks and uncertainties. These forward-looking statements are based on
the Company's current information and expectations. There can be no assurance the forward-looking
statements will be achieved. Actual results may differ materially due to the risk factors listed from time
to time in the Company's SEC reports including, but not limited to, those discussed in the Company's
Form 10-K for the year ended December 30, 2011 and Form 10-Q for the quarter ended June 29,
2012 in Item 1a under the caption "Factors That May Affect Our Future Results (Cautionary
Statements for Purposes of the "Safe Harbor" Provisions of the Private Securities Litigation Reform
Act of 1995)." All such risk factors are incorporated herein by reference as though set forth in full. The
Company undertakes no obligation to update any forward looking statement.
Non-GAAP Measures
Throughout this presentation all references to operating profit (loss) and diluted earnings (loss) per
share are non-GAAP and exclude severance, impairment and associated costs; non-cash stock-based
compensation expenses; and costs associated with an unsolicited takeover attempt in the respective
fiscal periods. For a reconciliation of these non-GAAP measures to U.S. GAAP results, see slides 20-
21. For the Company’s rationale for its usage of non-GAAP measures, see slide 22.
Not An Offer
This presentation shall not constitute an offer to sell nor the solicitation of an offer to buy any securities
of Pulse Electronics Corporation.
of Pulse Electronics Corporation.

3
Pulse Electronics:
A Leading Global Electronic Component Supplier
A Leading Global Electronic Component Supplier
CY2011 Sales by product group
Source: Company filings.
CY2011 Sales by geography
Source: Company filings.
n Global producer of precision-engineered electronic components and
modules
modules
− Approximately 1.5 billion devices produced annually
− Low cost / high value dynamics
n Differentiated, defensible position
− Highly customized,
engineering-intensive
engineering-intensive
− Broad IP portfolio
− “Globally local” design solutions
`
n Global, low cost operations with scale
− High-volume component
manufacturing expertise
manufacturing expertise
− OEM-driven

4
Executive Summary
n Improving liquidity and delevering the balance sheet
are the major near-term challenges
are the major near-term challenges
n Pulse markets represent opportunity
− Well positioned to reap benefits of IP traffic growth - infrastructure
and client side
and client side
− Industry leading products to broad industry leading customer base
n Solid progress on strategic turnaround plan
− Improve wireless
− Control operating expenses
− Optimize manufacturing footprint
− Implement ERP system
− Automate manufacturing
− Build on technology leadership
5
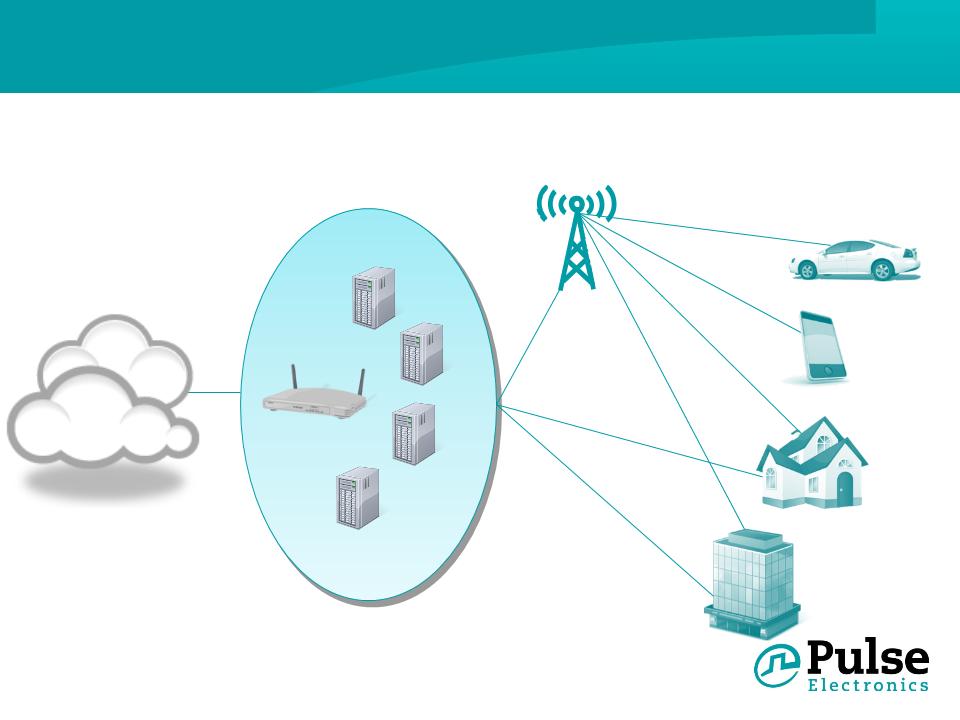
Wired, Wireless, Infrastructure and Client Devices - IP
Traffic Drives Our Growth
Traffic Drives Our Growth
IP Infrastructure
• Routers
• Switches
• Servers
• Storage
Client Devices
• Smartphones
• Tablets
• Laptops
• In-Car communications
Internet
Cloud
6
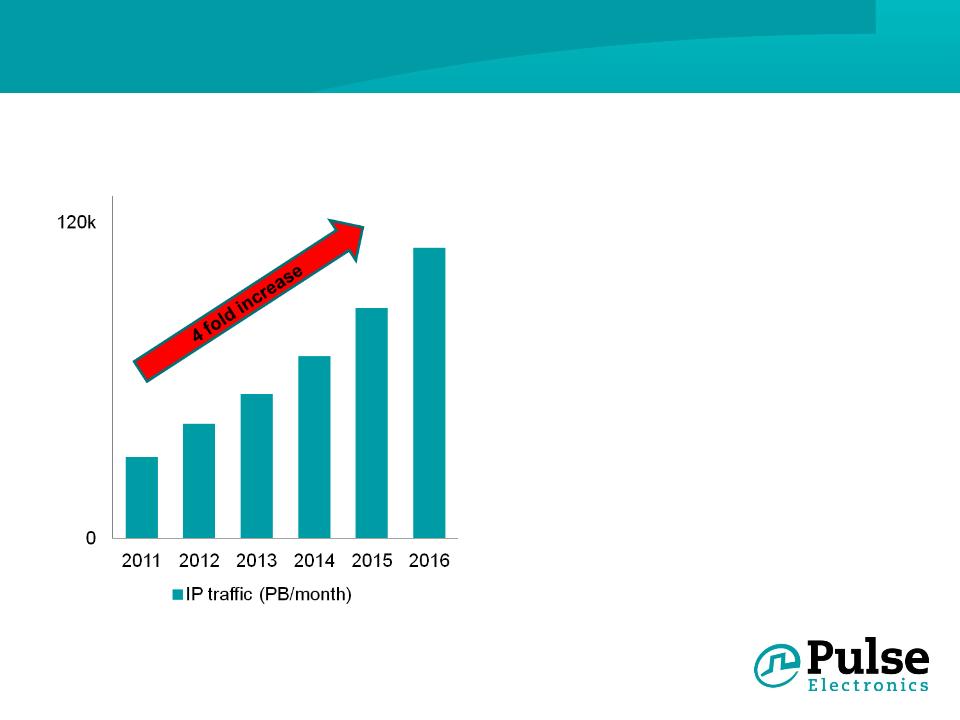
Internet Traffic Drives Our Growth In All Segments
• Network
– Global IP network providers
– Filtered connectors and
filters/chokes for network
switches, routers, hubs,
servers, PCs, game
consoles
filters/chokes for network
switches, routers, hubs,
servers, PCs, game
consoles
• Power
– Global IP providers
– Power management for high
efficiency computing
efficiency computing
• Wireless
– Major handset providers
– Antennas for handheld
internet access
internet access
Source: The Bishop Report 2012 and Cisco Visual Networking Index Forecasts
7
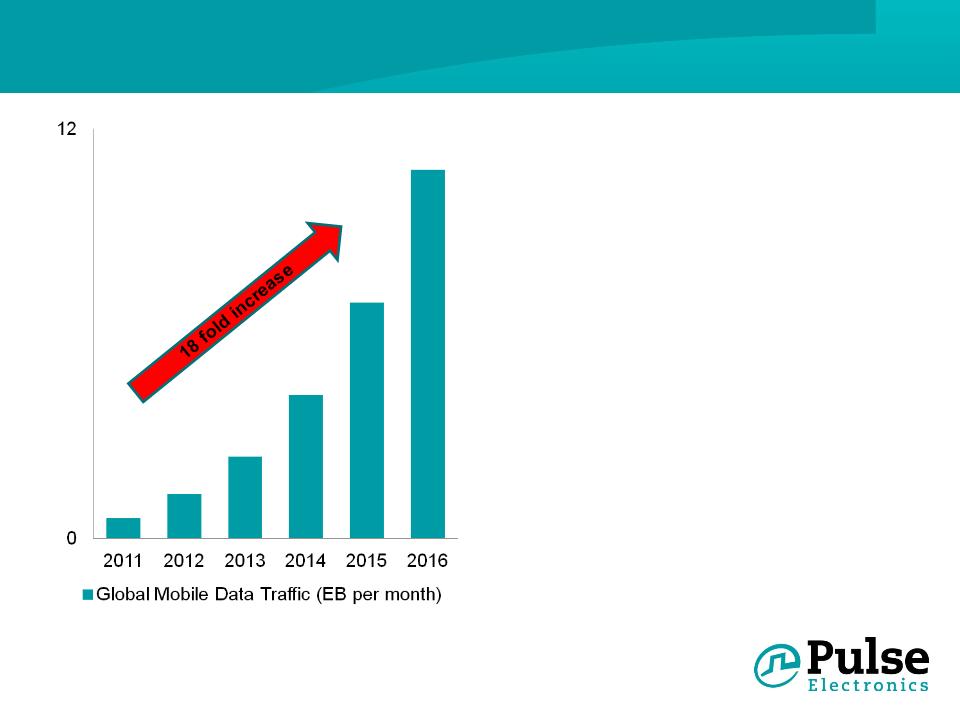
Mobile Data Traffic Drives Wireless Growth
• Mobile video content will
generate the majority of
growth
generate the majority of
growth
• Pulse well positioned with
leading global smartphone
OEMs
leading global smartphone
OEMs
• 2011 revenue to new
customers grew 314%
customers grew 314%
Source: Evercore partners “Trends in Mobile Communications and Technology” 3/2012,
Cisco Visual Networking Index Forecasts

8
Revenue
n Addressable market: Enterprise networks, wide
area networks, RF
area networks, RF
n Total TAM: $1.4 billion
n Key functions: Filter signal with different
frequencies, connect and balance lines, match
impedance and split signals
frequencies, connect and balance lines, match
impedance and split signals
n Growth Strategies:
• Leverage magnetic design expertise
• Build on leadership in filtered connectors
• Capitalize on global network / internet build
• Reduce dependence on labor
• Introduce new, higher margin products
Network:
Ongoing Industry Challenges
Ongoing Industry Challenges

9
Power:
Stability Across Product Lines
Stability Across Product Lines
Revenue
($ in millions)
n Addressable market: Datacomm, high-efficiency
computing, LED lighting, motor control
computing, LED lighting, motor control
n Total TAM: $1.4 billion
n Key functions: Modify voltage, limit signal
distortion, deliver power, regulate and control
electrical energy
distortion, deliver power, regulate and control
electrical energy
n Growth strategies:
• Grow sales for voltage and current sensing
products
products
• Extend in high-efficiency computing
• Grow revenues with auto manufacturers in
China
China
10
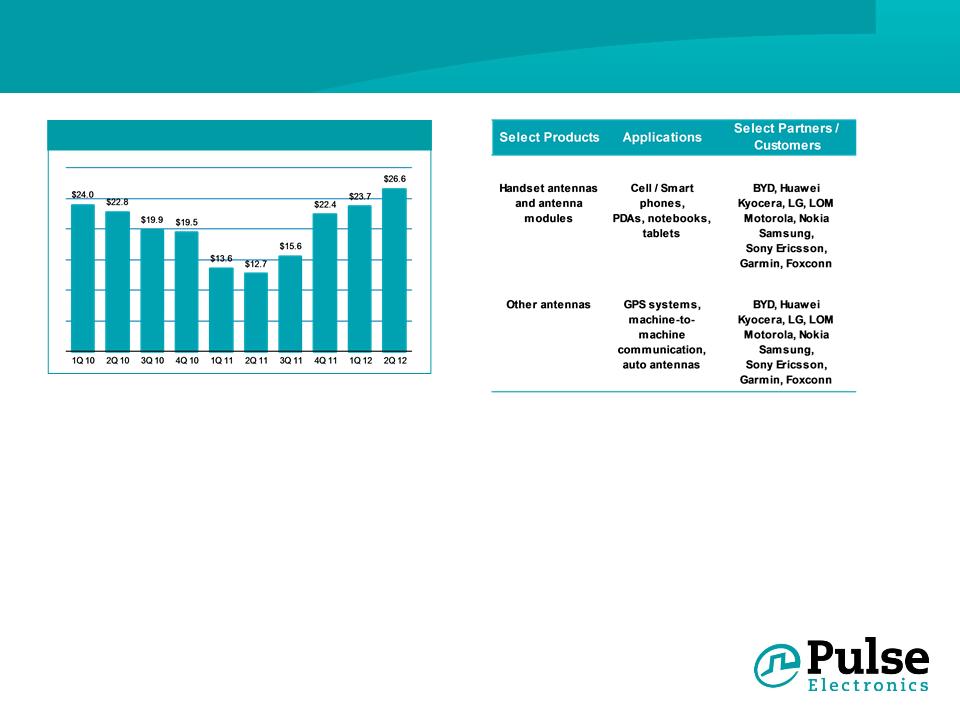
Wireless:
Return to Growth with New Antenna Customers
Return to Growth with New Antenna Customers
Revenue
($ in millions)
n Addressable market: Cellular, GPS, smart
grid, WLAN, LMR
grid, WLAN, LMR
n Total TAM: $1.5+ billion
n Key functions: Capture and transmit signal
n Growth Strategies:
• Rebuild cellular antenna sales
• Grow non-cellular sales
• Maintain technology leadership
• Capitalize on global mobility demand

11
Market Leading Positions with Diversified, Long-Term
Customer Relationships
Customer Relationships
Product leadership
n Pure-play electronics provider serving leading
companies across various industries for over
60 years
companies across various industries for over
60 years
n China-based expertise in design and
manufacturing deepens local relationships
manufacturing deepens local relationships
n Core strengths of each segment include:
− Network: high bandwidth in tightly
integrated designs
integrated designs
− Power: high frequency and high power in
challenging environmental conditions
challenging environmental conditions
− Wireless: multiple, complex frequency
management in small form factors
management in small form factors
n Expertise in advanced technology
− 420 patents
− Experienced core engineering team
− 3-D antenna - the new industry standard
− “Best & Brightest” Innovators & Qualifiers
MDB Capital Group, Feb 2011
Key customers
n Alcatel-Lucent
n Apple
n BMW
n Bosch
n Cisco
n Dell
n Ericsson
n Flextronics
n Foxconn
n Fujitsu
n Garmin
n Hewlett-Packard
n Honeywell
n Huawei
n IBM
n Intel
n Jabil
n Juniper
n Lenovo
n Nokia
n Nokia Siemens
n Microsoft
n Motorola
n Oracle
n Samsung
n Schneider
n Siemens
n Sony
n Vestel
n Volkswagen Audi

12
Strong Core Operating Skill Sets
Pulse Electronics’ principal
manufacturing facilities reduced
from 10 to 4
manufacturing facilities reduced
from 10 to 4
Design / engineering
n Demonstrated “globally local” design /
engineering and high-volume product launch
expertise
engineering and high-volume product launch
expertise
– Design / engineering teams embedded
with our key customers
with our key customers
n Strong relationships with leading OEMs
China-based manufacturing
expertise
expertise
n Low-cost and high-volume manufacturing
capability
capability
n Geographic proximity to customers’ production
with global channel relationships
with global channel relationships
n High labor content in Western China
n Pulse has been operating owned facilities in
China for 25 years
China for 25 years
− Over 12 years of average tenure for senior
in-region operations managers
in-region operations managers
Mianyang
Suzhou
Suzhou
Suining
Changan

13
Operating Outlook
§ Large addressable markets
§ Growth characteristics
§ Further cost reduction opportunities, particularly in G&A
§ Custom designs and engineering-driven
§ Cyclical demand
§ Continued investment in the core businesses throughout
the recent downturn
the recent downturn

14
Long-Term Financial Target

15
Significant Progress on Strategic Turnaround Plan
n Expect to achieve break-even profitability by the end of 2012
n Revenue growth ahead of that necessary to achieve $100m
annual run-rate at which break-even is sustainable
annual run-rate at which break-even is sustainable
Improve wireless
Lower operating
expenses
expenses
Optimize manufacturing
efficiencies
efficiencies
Implement new ERP
system
system
n Reduced approximately $16m on annualized basis
compared to $12m target
compared to $12m target
n Consolidated from 10 to 4 factories with 80+% of high labor
processes now in lower cost western China
processes now in lower cost western China
n Planned cutover of largest manufacturing facility completed
July 2012. Final facilities will likely go live in Q1 2013.
July 2012. Final facilities will likely go live in Q1 2013.
Increase automation
n Initiative underway to automate existing products as a
mitigation to rising labor costs
mitigation to rising labor costs
Build on technology
leadership
leadership
n New technology platforms introduced across all three groups:
LDS antennas, MagPac, Sidewinder
LDS antennas, MagPac, Sidewinder

16
Balance Sheet
($ in millions)
n Improving liquidity and delevering are the major challenges
facing Pulse due to ongoing industry challenges and overall
economic uncertainty.
facing Pulse due to ongoing industry challenges and overall
economic uncertainty.

17
Delevering Status
§ All options remain under consideration to increase
liquidity and reduce debt
liquidity and reduce debt
§ Asset sales
– Non-core asset sale process continues
– Strategic asset sales
– Retained advisors to assist with evaluation of all options
§ Financing alternatives
– Engaging with existing and potentially new financing partners
– Balance sheet restructuring
– Retained advisors to assist with evaluation of all options

18
Executive Summary
n Improving liquidity and delevering the balance sheet
are the major near-term challenges
are the major near-term challenges
n Pulse markets represent opportunity
− Well positioned to reap benefits of IP traffic growth - infrastructure
and client side
and client side
− Industry leading products to broad industry leading customer base
n Solid progress on strategic turnaround plan
− Improve wireless
− Control operating expenses
− Optimize manufacturing footprint
− Implement ERP system
− Automate manufacturing
− Build on technology leadership

Appendix


21
Non-GAAP Adjusted EBITDA Reconciliation

22
Non-GAAP Rationale
Non-GAAP operating profit or loss (operating profit or loss according to accounting principles generally accepted in the United States excluding
pre-tax severance, impairment and other associated costs; pre-tax non-cash stock-based compensation expenses; and other pre-tax
adjustments as described in the applicable period), non-GAAP diluted earnings (loss) per share (net earnings (loss) per share from continuing
operations according to principles generally accepted in the United States excluding after-tax severance, impairment and other associated costs;
after-tax non-cash stock-based compensation expenses; and other after-tax adjustments as described in the applicable period) and adjusted
EBITDA (net earnings attributable to Pulse Electronics Corporation plus net earnings from discontinued operations and non-controlling interest,
excluding income taxes; depreciation and amortization; interest expense/income; non-cash stock-based compensation expenses; other
expense/income; and severance, impairment and other associated costs and other adjustments as described in the applicable period), are not
measures of performance under accounting principles generally accepted in the United States. Non-GAAP operating profit or loss, non-GAAP
diluted earnings (loss) per share and adjusted EBITDA should not be considered a substitute for, and an investor should also consider, net
income, operating profit, cash flow from operations and other measures of performance as defined by accounting principles generally accepted
in the United States as indicators of our profitability or liquidity. Non-GAAP operating profit (loss) and non-GAAP diluted earnings (loss) per
share are often used by our shareholders and analysts as an additional measure of our operating performance. Adjusted EBITDA is often used
by our shareholders and analysts as an indicator of a company’s ability to service debt and fund capital expenditures. We believe these non-
GAAP measures enhance a reader’s understanding of our financial condition, results of operations and cash flow because they are unaffected
by capital structure and, therefore, enable investors to compare our operating performance to that of other companies. We understand that our
presentation of non-GAAP operating profit (loss), non-GAAP diluted earnings (loss) per share and adjusted EBITDA may not be comparable to
other similarly titled captions of other companies due to differences in the method of calculation.
Based on discussions with investors and analysts, we believe that a reader’s understanding of the Company’s operating performance is
enhanced by references to these non-GAAP measures. Removing charges for severance, impairment and other associated costs, non-cash
stock-based compensation expenses and other adjustments may facilitate comparisons of operating performance among financial periods and
peer companies. These charges may result from facility closures, the exit of a product line, production relocations and capacity reductions and /
or restructuring of overhead and operating expenses to enhance or maintain profitability in an increasingly competitive environment. Removing
non-cash stock-based compensation expenses facilitates comparisons of the Company’s operating performance with that of other companies
with differing compensation structures and with the Company’s performance in periods during which its own compensation structure may have
been different. Impairment charges, accelerated depreciation and costs related to an unsolicited takeover attempt are not part of the normal
operating expense structure of the relevant business in the period in which the charge is recorded.