Attached files
| file | filename |
|---|---|
| EX-21 - EXHIBIT 21 - PULSE ELECTRONICS CORP | ex21.htm |
| EX-23 - EXHIBIT 23 - PULSE ELECTRONICS CORP | ex23.htm |
| EX-32.2 - EXHIBIT 32.2 - PULSE ELECTRONICS CORP | ex32_2.htm |
| EX-31.2 - EXHIBIT 31.2 - PULSE ELECTRONICS CORP | ex31_2.htm |
| EX-32.1 - EXHIBIT 32.1 - PULSE ELECTRONICS CORP | ex32_1.htm |
| EX-31.1 - EXHIBIT 31.1 - PULSE ELECTRONICS CORP | ex31_1.htm |
UNITED
STATES
SECURITIES
& EXCHANGE COMMISSION
Washington,
D. C. 20549
FORM
10-K
|
T
|
Annual
Report Pursuant to Section 13 or 15(d) of the Securities Exchange Act of
1934
|
For the
fiscal year ended December 25,
2009
or
|
£
|
Transition
Report Pursuant to Section 13 or 15(d) of the Securities Exchange Act of
1934
|
For the
transition period from _______________ to _______________
Commission
File No. 1-5375
TECHNITROL,
INC.
(Exact
name of registrant as specified in Charter)
|
PENNSYLVANIA
|
23-1292472
|
|
(State
of Incorporation)
|
(IRS
Employer Identification Number)
|
|
1210
Northbrook Drive, Suite 470, Trevose, Pennsylvania
|
19053
|
|
|
(Address
of principal executive
offices)
|
(Zip
Code)
|
|
|
Registrant’s
telephone number, including area code:
|
215-355-2900
|
Securities
registered pursuant to Section 12(b) of the Act:
|
Title of each class
|
Name of each Exchange on which
registered
|
|
Common
Stock par value $0.125 per share
|
New
York Stock Exchange
|
|
Common
Stock Purchase Rights
|
New
York Stock Exchange
|
Indicate
by check mark if the registrant is a well-known seasoned issuer, as defined in
Rule 405 of the Securities Act Yes T No £
Indicate
by check mark if the registrant is not required to file reports pursuant to
Section 13 or Section 15(d) of the Act. Yes £ No T
Indicate
by check mark whether the registrant (1) has filed all reports required to be
filed by Section 13 or 15(d) of the Securities Exchange Act of 1934 during the
preceding 12 months (or for such shorter period that the registrant was required
to file such reports), and (2) has been subject to the filing requirements for
at least the past 90
days. Yes T No £
Indicate
by check mark whether the registrant has submitted electronically and posted on
its corporate website, if any, every Interactive Data File required to be
submitted and posted pursuant to Rule 405 of Regulation S-T during the preceding
12 months (or for such shorter period that the registrant was required to submit
and post such files). Yes £ No £
Indicate
by check mark if disclosure of delinquent filers pursuant to Item 405 of
Regulation S-K is not contained herein, and will not be contained, to the best
of registrant’s knowledge, in definitive proxy or information statements
incorporated by reference in Part III of this Form 10-K or any amendment to this
Form 10-K.T
Indicate
by check mark whether the registrant is a large accelerated filer, an
accelerated filer, or a non-accelerated filer (as defined in Rule 12b-2 of the
Act). Large accelerated filer £ Accelerated
filer T Non-accelerated
filer £ Smaller
reporting company £
Indicate
by check mark whether the registrant is a shell company (as defined in Rule
12b-2 of the Act). Yes £ No T
The
aggregate market value of voting stock held by non-affiliates as of June 26,
2009 is $266,535,000 computed by reference to the closing price on the New York
Stock Exchange on such date.
|
Number
of shares outstanding
|
|
|
Title of each class
|
February 24,
2010
|
|
Common
stock par value $0.125 per share
|
41,242,286
|
DOCUMENTS INCORPORATED BY
REFERENCE
Portions
of the Registrant’s definitive proxy statement to be used in connection with the
registrant’s 2009 Annual Shareholders Meeting are incorporated by reference into
Part III of this Form 10-K where indicated.
1
TABLE OF CONTENTS
|
PAGE
|
||
|
PART
I
|
||
|
Item
1.
|
3
|
|
|
Item
1a.
|
7
|
|
|
Item
1b.
|
15
|
|
|
Item
2.
|
15
|
|
|
Item
3.
|
15
|
|
| Item 4. | Submission of Matters to a Vote of Security Holders | 15 |
|
PART
II
|
||
|
Item
5.
|
16
|
|
|
Item
6.
|
18
|
|
|
Item
7.
|
19
|
|
|
Item
7a.
|
35
|
|
|
Item
8.
|
36
|
|
|
Item
9.
|
36
|
|
|
Item
9a.
|
37
|
|
|
Item
9b.
|
38
|
|
|
PART
III
|
||
|
Item
10.
|
39
|
|
|
Item
11.
|
39
|
|
|
Item
12.
|
39
|
|
|
Item
13.
|
40
|
|
|
Item
14.
|
40
|
|
|
PART
IV
|
||
|
Item
15.
|
41
|
|
Part
I
Item 1 Business
General
Technitrol,
Inc. is a global producer of precision-engineered electronic components and
modules. We sometimes refer to Technitrol, Inc. as “Technitrol”, “we” or
“our.” We believe we are a leading global producer of electronic
components and modules in the primary markets we serve, based on our estimates
of the annual revenues in our primary markets and our share of those markets
relative to our competitors. Our electronic components and modules
are used in virtually all types of electronic products to manage and regulate
electronic signals and power, making them critical to the functioning of our
customer’s end product.
During
2009, we announced our intention to explore monetization alternatives with
respect to our Electrical Contract Products Group or Electrical, as we refer to
it, or AMI Doduco, as it is known in its markets, which is now held for sale and
classified as a discontinued operations in our Consolidated Financial
Statements. As a result, we currently operate our business in a
single segment, our Electronic Components Group, which we refer to as
Electronics and is known as Pulse in its markets.
We
incorporated in Pennsylvania on April 10, 1947 and we are headquartered in
Trevose, Pennsylvania. Our mailing address is 1210 Northbrook Drive,
Suite 470, Trevose, PA 19053-8406, and our telephone number is
215-355-2900. Our website is www.technitrol.com.
Products
We design
and manufacture a wide variety of highly-customized electronic components and
modules. Many of these components and modules capture wireless
communication signals, filter and share signals on wireline communication
systems, convert communication signals into sound and video, filter out radio
frequency interference, adjust and ensure proper current and voltage and
activate certain automotive functions. These products are often referred to as
antennas, speakers, receivers, splitters, chokes, inductors, filters,
transformers and coils. Our primary customers are multinational original
equipment manufacturers, original design manufacturers, contract manufacturers
and distributors.
We have
three primary product groups. Our network group includes our integrated
connector modules, transformers, filters, splitters, chokes and other magnetic
components. Our wireless group produces our handset antenna products,
our non-cellular wireless and antenna products and our mobile speakers and
receivers. Our power group includes our power and signal transformers
and inductors, automotive coils, military and aerospace products and other power
magnetics products.
Net
sales of our primary product groups for the years ended December 25, 2009,
December 26, 2008 and December 27, 2007 were as follows (in millions):
|
2009
|
2008
|
2007
|
||||||||||
|
Network
|
$ | 152.7 | $ | 216.0 | $ | 226.4 | ||||||
|
Wireless
|
151.0 | 263.3 | 277.9 | |||||||||
|
Power
|
95.1 | 147.0 | 167.3 | |||||||||
|
Net
sales
|
$ | 398.8 | $ | 626.3 | $ | 671.6 | ||||||
Our
products are generally characterized by relatively short life cycles and rapid
technological change, allowing us to utilize our design, engineering and
production expertise to meet our customers’ evolving needs. We
believe that the industries we serve have been, and will continue to be,
characterized by ongoing product design and manufacturing innovation that will
drive growth in the electronic components industry.
The
following table contains a list of some of our key products:
|
Primary
Products
|
Function
|
Application
|
||
|
Internal
handset antenna and handset antenna modules
|
Capture
communication signals in mobile handsets, personal digital assistants and
notebook computers
|
Cell
phones, other mobile terminal and information devices
|
||
|
Speakers
and receivers
|
Convert
electronic signals into sound
|
Cell
phones, laptops, smart phones and other mobile terminal
devices
|
||
|
Mobile
and portable antennas
|
Capture
and transmit non-cellular signals
|
Global
positioning systems, automotive antennas and machine-to-machine
communication
|
||
|
Discrete
filter or choke
|
Separate
high and low frequency signals. Shares incoming and outgoing
signals to match industry templates.
|
Network
switches, routers, hubs and personal computers
Phone,
fax and alarm systems used with digital subscriber lines, or
DSL
|
||
|
Filtered
connectors, which combines a filter with a connector and stand alone
connector products
|
Remove
interference, or noise, from circuitry and connects electronic
applications
|
Local
area networks, or LANs, and wide area networks, or WANs, equipment for
personal computers and video game consoles
|
||
|
Inductor/chip
inductor
|
Regulate
electrical current under conditions of varying load
|
AC/DC
& DC/DC power supplies
Mobile
phones and portable devices
|
||
|
Power
transformer
|
Modify
circuit voltage
|
AC/DC
& DC/DC power supplies
|
||
|
Signal
transformer
|
Limit
distortion of signal as it passes from one medium to
another
|
Analog
circuitry, military/aerospace navigation and weapons guidance
systems
|
||
|
Automotive
ignition coils
|
Provide
power for automotive ignition
|
Ignition
systems for automotive gasoline engines
|
||
|
Other
automotive coils
|
Provide
power for a variety of automotive electronic functions
|
Automotive
management systems such as safety, communication, navigation, fuel
efficiency and emissions control
|
Sales,
Customers and Distribution
We sell
products predominantly through worldwide direct sales forces. Given the highly
technical nature of our customers’ needs, our direct salespeople typically team
up with members of our engineering staff to discuss a sale with a customer’s
purchasing and engineering personnel. During the sales process, there is close
interaction between our engineers and those in our customers’ organizations.
This interaction extends throughout a product’s life cycle, engendering strong
customer relationships. Also, we believe that our coordinated sales effort
provides a high level of market penetration and efficient coverage of our
customers on a cost-effective basis. As of December 25, 2009, we had
more than 60 salespeople in 11 sales offices worldwide.
We sell
our products and services to original equipment manufacturers, original design
manufacturers and contract equipment manufacturers, which design, build and
market end-user products. We refer to original equipment
manufacturers as “OEMs”, original design manufacturers as “ODMs” and contract
equipment manufacturers as “CEMs.” ODMs typically contract with OEMs
to design products, where as CEMs contract with OEMs to manufacture
products. Many OEMs use CEMs primarily or exclusively to build their
products. Independent distributors sell components and materials to
both OEMs and CEMs. While OEMs are often our design partners, most
sales are to CEMs, as OEMs have generally outsourced procurement and
manufacturing responsibilities to CEMs. In order to maximize our
sales opportunities, our engineering and sales teams maintain close
relationships with OEMs, ODMs, CEMs and other independent
distributors. We provide support for our multinational customer base
with local customer service and design centers in North America, Europe and
Asia.
For the
year ended December 25, 2009, a major cell phone manufacturer and a CEM for that
cell phone manufacturer each individually accounted for more than 10% of our
continuing operations net sales. In addition, a group of CEMs of a
major network infrastructure company also accounted for more than 10% of our
2009 continuing operations net sales. Sales to our ten largest
customers accounted for 61.9% of net sales for the year ended December 25, 2009,
64.4% of net sales for the year ended December 26, 2008 and 60.7% of net sales
for the year ended December 28, 2007.
A large
percentage of our sales in recent years has been outside of the United
States. For the years ended December 25, 2009, December 26, 2008 and
December 28, 2007, 89.9%, 91.3% and 89.4% of our net sales were outside of the
United States, respectively.
Manufacturing
We have
developed our manufacturing processes in ways intended to maximize our
profitability without sacrificing quality. The manufacturing of our
magnetic components, connectors, chokes and filters tend to be labor intensive
and highly variable. This model enables us to decrease production
rapidly to contain costs during slower periods, reflecting the often
unpredictable nature of these product lines. However, this model may
prevent us from rapidly increasing our production capacity in periods of intense
demand in tight labor markets. Conversely, the manufacturing of our
antennas, speakers, receivers, automotive and military/aerospace products is
highly mechanized or, in some cases, automated, which causes costs and
profitability related to these products to be sensitive to the volume of
production.
Generally,
once our engineers design products to meet the end users’ product needs and a
contract is awarded by, or orders are received from, the customer we begin to
mass-produce the products. To a much lesser extent, we also service
customers that design their own components and outsource production of these
components to us. In such case, we build the components to the
customer’s design. We also maintain a portfolio of catalog parts
which our customers can easily design into their own products.
We cannot
accurately estimate or forecast the utilization of our overall production
capacity at a given time. In any facility, maximum capacity and
utilization vary periodically depending on our manufacturing strategies, the
product being manufactured, current market conditions, customer demand and other
non-specific variables.
Research,
Development and Engineering
Our
research, development and engineering efforts are focused on the design and
development of innovative products in collaboration with our customers or their
ODM partners. We work closely with OEMs and ODMs to identify their design and
engineering requirements. We maintain strategically located design centers
throughout the world where proximity to customers enables us to better
understand and more readily satisfy their design and engineering needs. Our
design process is disciplined and orderly, using a product lifecycle management
system to track the level of design activity enabling us to manage and improve
how our engineers design products. We typically own the customized designs used
to make our products.
Research,
development and engineering expenditures from continuing operations were $28.2
million for the year ended December 25, 2009, $42.6 million for the year ended
December 26, 2008, and $35.1 million for the year ended December 28,
2007. The decrease over the past year is primarily due to tightened
spending controls initiated at the end of 2008 in response to the general
recession. In limited circumstances, we generate revenue as a result of
providing research, development and engineering services to our
customers. This revenue is not material to our Consolidated Financial
Statements.
Competition
We do not
believe that any one company competes with all of our product lines on a global
basis. However, we have strong competition within individual product
lines, both domestically and internationally. In addition, several OEMs
internally, or through CEMs, manufacture some of our product
offerings. We believe that this may represent an opportunity to
capture additional market share as OEMs continue to outsource their component
manufacturing. Therefore, we pursue opportunities to convince these OEMs that
our economies of scale, purchasing power and core competencies in manufacturing
enable us to produce these products more efficiently. Increasingly,
we compete against manufacturers located in inexpensive countries, many of which
sometimes aggressively seek market share at the detriment of
profits.
Competitive
factors in the markets for our products include:
|
|
·
|
product
quality and reliability;
|
|
|
·
|
global
design and manufacturing
capabilities;
|
|
|
·
|
breadth
of product line;
|
|
|
·
|
price;
|
|
|
·
|
customer
service;
|
|
|
·
|
delivery
time;
|
|
|
·
|
technology;
and
|
|
|
·
|
product
leadership and development.
|
We
believe we are adequately competitive with respect to each of these factors.
Product quality and reliability, as well as design and manufacturing
capabilities, are enhanced through our continuing commitment to invest in and
improve our manufacturing and designing resources and our close relationships
with our customers’ engineers. Also, the breadth of our product offering
provides customers with the ability to satisfy multiple needs through one
supplier. Our global presence enables us to deepen our relationship with our
customers and to better understand and more easily satisfy the needs of local
markets. In addition, our ability to purchase raw materials in large quantities
and our focus on continually reducing production expenses and maximizing
capacity lowers our manufacturing costs and enables us to price our products
competitively.
Employees
As of
December 25, 2009, we had approximately 19,400 full-time employees as compared
to 21,400 as of December 26, 2008. Employees related to our
continuing operations increased from approximately 17,100 at December 26, 2008
to 17,700 at December 25, 2009 due to a concentrated effort to increase capacity
in our operations in the People’s Republic of China (“PRC” or “China”) to
address the surging demand of our network group experienced during the second
half of 2009. The number of employees at year-end includes employees
of certain subcontractors that are integral to our operations in the
PRC. Such employees numbered approximately 6,400 and 8,200 as of
December 25, 2009 and December 26, 2008, respectively. In addition to
these employees, we began utilizing temporary staff to supplement our labor
capacity during 2009. Excluded from our total employment figures for
December 25, 2009 were approximately 3,000 temporary staff. None of
our employees were covered by collective-bargaining agreements during the year
ended December 25, 2009. Approximately 500 of our total 19,400
full-time employees were located in the United States. We did not
experience any major work stoppages during 2009 and consider our relations with
our employees to be good.
Raw
Materials
The
primary raw materials necessary to manufacture our products
include:
|
|
·
|
base
metals such as copper;
|
|
|
·
|
ferrite
cores; and
|
|
|
·
|
plastics
and plastic resins.
|
Currently,
we do not have significant difficulty obtaining any of our raw materials and do
not anticipate that we will face any significant difficulty in the near
future. However, some of these materials are produced by a limited
number of suppliers. We may be unable to obtain these raw materials
in sufficient quantities or in a timely manner to meet the demand for our
products. The lack of availability or a delay in obtaining any of the
raw materials used in our products could adversely affect our manufacturing
costs and profit margins. In addition, if the price of our raw
materials increases significantly over a short period of time due to increased
market demand or a shortage of supply, customers may be unwilling to bear the
increased price for our products and we may be forced to sell our products
containing these materials at lower prices causing a reduction in our profit
margins.
Our
discontinued operations at Electrical use silver and other precious metals in
manufacturing most of its electrical contacts, contact materials and contact
subassemblies. Historically, Electrical has leased or held these materials
through consignment-type arrangements with its suppliers, except in China where
leasing of such precious metals is prohibited. Leasing and consignment costs
have typically been lower than the costs to borrow funds to purchase the metals
and, more importantly, these arrangements eliminate the effects of fluctuations
in the market price of owned precious metal and enable Electrical to minimize
its inventories. Electrical’s terms of sale generally allow it to charge
customers for precious metal content based on the market value of precious metal
on the day after shipment to the customer. Suppliers invoice
Electrical based on the market value of the precious metal on the day after
shipment to the customer as well. Thus far, Electrical has been
successful in managing the costs associated with its precious metals. While
limited amounts are purchased for use in production, the majority of precious
metal inventory continues to be leased or held on consignment. If leasing or
consignment costs increase significantly in a short period of time, and
Electrical is unable to recover these increased costs through higher sales
prices, a negative impact on Electrical’s results of operations and liquidity
may result. Leasing and consignment fee increases are caused primarily by
increases in interest rates or volatility in the price of the consigned
material. Similarly, if Electrical is unable to maintain the
necessary bank commitments and credit limits for its precious metal leasing and
consignment facilities, or obtain alternative facilities on a timely basis,
Electrical may be required to finance the direct purchase of precious metals,
reduce its production volume or take other actions that could negatively impact
its financial condition and results of operations.
Backlog
Our
backlog of orders at December 25, 2009 was $76.3 million compared to $49.3
million at December 26, 2008. The significant increase in backlog
from 2008 to 2009 is the result of a substantial increase in demand in our
network group, which has recently been impacted by capacity
constraints. We expect to ship the majority of the backlog over the
next six months. We do not believe that our backlog is an accurate indicator of
near-term business activity because variability in lead times, capacity, demand
uncertainty on the part of our customers and increased use of vendor managed
inventory and similar consignment type arrangements tend to limit the
significance of backlog.
Intellectual
Property
We
utilize proprietary technology, often developed and protected by us or, to a
much lesser extent, licensed from others. Also, we require every
employee with access to proprietary technology to enter into confidentiality
agreements with us and we restrict access to our proprietary
information.
Existing
legal protections afford only limited advantage to us. For example,
others may independently develop similar or competing products or attempt to
copy or use aspects of our products that we regard as
proprietary. Furthermore, intellectual property law in certain areas
of the world may not fully protect our products or technology from such
actions.
While our
intellectual property is important to us in the aggregate, we do not believe any
individual patent, trademark, or license is material to our business or
operations.
Environmental
Our
manufacturing operations are subject to a variety of local, state, federal and
international environmental laws and regulations governing air emissions,
wastewater discharges, the storage, use, handling, disposal and remediation of
hazardous substances and wastes and employee health and safety. It is our policy
to meet or exceed the environmental standards set by these laws. We
also strive through planning and continual process improvements to protect and
preserve the environment through prevention of pollution and reduced consumption
of natural resources and materials. However, in the normal course of
business, environmental issues may arise. We may incur increased
costs associated with environmental compliance and cleanup projects necessitated
by the identification of new environmental issues or new environmental laws and
regulations.
Available
Information
We make
available free of charge on our website, www.technitrol.com, all materials that
we file electronically with the Securities and Exchange Commission (“SEC”),
including our annual reports on Form 10-K, quarterly reports on Form 10-Q,
current reports on Form 8-K and amendments to those reports and all Board and
Committee charters, as soon as reasonably practicable after we electronically
file or furnish such materials to the SEC.
Item
1a Risk Factors
Factors
That May Affect Our Future Results (Cautionary Statements for Purposes of the
“Safe Harbor” Provisions of the Private Securities Litigation Reform Act of
1995)
Our
disclosures and analysis in this report contain forward-looking
statements. Forward-looking statements reflect our current
expectations of future events or future financial performance. You
can identify these statements by the fact that they do not relate strictly to
historical or current facts. They often use words such as
“anticipate”, “estimate”, “expect”, “project”, “intend”, “plan”, “believe” and
similar terms. These forward-looking statements are based on our
current plans and expectations.
Any or
all of our forward-looking statements in this report may prove to be
incorrect. They may be affected by inaccurate assumptions we might
make or by risks and uncertainties which are either unknown or not fully known
or understood. Accordingly, actual outcomes and results may differ materially
from what is expressed or forecasted in this report.
We
sometimes provide forecasts of future financial performance. The
risks and uncertainties described under “Risk Factors” as well as other risks
identified from time to time in other Securities and Exchange Commission
reports, registration statements and public announcements, among others, should
be considered in evaluating our prospects for the future. We
undertake no obligation to release updates or revisions to any forward-looking
statement, whether as a result of new information, future events or
otherwise.
The
following factors represent what we believe are the major risks and
uncertainties in our business, including risks inherent in operations which we
are in the process of divesting. They are listed in no particular
order.
Cyclical
changes in the markets we serve could result in a significant decrease in demand
for our products, which may reduce our profitability and/or our cash
flow.
Our
components are used in various products sold in the electronics market. Markets
are cyclical. Generally, the demand for our components reflects the demand for
products in the electronics market. A contraction in demand would
result in a decrease in sales of our products, as our customers:
|
|
·
|
may
cancel existing orders;
|
|
|
·
|
may
introduce fewer new products;
|
|
|
·
|
may
discontinue current products; and
|
|
|
·
|
may
decrease their inventory levels.
|
A
decrease in demand for our products could have a significant adverse effect on
our operating results, profitability and cash flows which may adversely affect
our liquidity, our ability to retire debt or our ability to comply with debt
covenants. Accordingly, we may experience volatility in our revenues,
profits and cash flows.
Reduced
prices for our products may adversely affect our profit margins if we are unable
to reduce our cost structure.
The
average selling prices for our products tend to decrease over their life cycle.
In addition, foreign currency movements and the desire to retain market share
increase the pressure on our customers to seek lower prices from their
suppliers. As a result, our customers are likely to continue to demand lower
prices from us. To maintain our margins and remain profitable, we must continue
to meet our customers’ design needs while concurrently reducing costs through
efficient raw material procurement, process and product improvements and
focusing our operating expense levels. Our profit margins and cash flows may
suffer if we are unable to reduce our overall cost structure relative to
decreases in sales prices.
Rising
raw material and production costs may decrease our gross margin.
We use
commodities such as copper and plastic resins in manufacturing our
products. Prices of these and other raw materials have experienced
significant volatility in the past. Other manufacturing costs, such
as direct and indirect labor, energy, freight and packaging costs, also directly
impact the costs of our products. If we are unable to pass increased
costs through to our customers or recover the increased costs through production
efficiencies, our gross margins may suffer.
An
inability to adequately respond to changes in technology, applicable standards
or customer needs may decrease our sales.
We
operate in an industry characterized by rapid change caused by the frequent
emergence of new technologies and standards. Generally, we expect
life cycles for products in the electronic components industry to be relatively
short. This requires us to anticipate and respond rapidly to changes in industry
standards and customer needs and to develop and introduce new and enhanced
products on a timely and cost effective basis. Our engineering and
development teams place a priority on working closely with our customers to
design innovative products and improve our manufacturing
processes. Improving performance and reducing costs for our customers
requires continual development of new products and/or to the components of our
products. Our inability to react quickly and efficiently to changes
in technology, standards or customers’ needs may decrease our sales or
margins.
If
our inventories become obsolete, our future performance and operating results
will be adversely affected.
The life
cycles of our products depend heavily upon the life cycles of the end products
into which our products are designed. Products with short life cycles
require us to closely manage our production and inventory levels. Inventory may
become obsolete because of adverse changes in end market demand. During market
slowdowns, this may result in significant charges for inventory write-offs. Our
future operating results may be adversely affected by material levels of
obsolete or excess inventories.
An
inability to capitalize on our prior or future acquisitions or our decisions to
strategically divest our current businesses may adversely affect our
business.
We have
completed numerous acquisitions in the past and we continually seek acquisitions
to grow our businesses. We may fail to derive significant benefits from our
acquisitions. In addition, if we fail to achieve sufficient financial
performance from an acquisition, long-lived assets, such as property, plant and
equipment, goodwill and other intangibles, could become impaired and result in
the recognition of an impairment loss similar to the losses recorded in 2009 and
2008.
The
success of any of our acquisitions depends on our ability to:
|
|
·
|
successfully
execute the integration or consolidation of the acquired operations into
our existing businesses;
|
|
|
·
|
develop
or modify the financial reporting and information systems of the acquired
entity to ensure overall financial integrity and adequacy of internal
control procedures;
|
|
|
·
|
identify
and take advantage of cost reduction opportunities;
and
|
|
|
·
|
further
penetrate the markets for the product capabilities
acquired.
|
Integration
of acquisitions may take longer than we expect and may never be achieved to the
extent originally anticipated. This could result in lower than anticipated
business growth or higher than anticipated costs. In addition, acquisitions
may:
|
|
·
|
cause
a disruption in our ongoing
business;
|
|
|
·
|
distract
our managers;
|
|
|
·
|
increase
our debt and leverage;
|
|
|
·
|
unduly
burden our other resources; and
|
|
|
·
|
result
in an inability to maintain our historical standards, procedures and
controls, which may result
in non-compliance with external laws and
regulations.
|
Alternatively,
we may also consider making strategic divestitures, which may:
|
|
·
|
cause
a disruption in our ongoing
business;
|
|
|
·
|
distract
our managers;
|
|
|
·
|
unduly
burden our other resources; and
|
|
|
·
|
result
in an inability to maintain our historical standards, procedures and
controls, which may result in non-compliance with external laws and
regulations.
|
We may
record impairment losses in the future. We assess the impairment of
long-lived assets whenever events or changes in circumstances indicate the
carrying value may not be recoverable. Factors we consider important
that could trigger an impairment review include significant changes in the use
of any asset, changes in historical trends in operating performance, a
significant decline in the price of our common stock, changes in projected
operating performance and significant negative economic trends.
Integration
of acquisitions may limit the ability of investors to track the performance of
individual acquisitions and to analyze trends in our operating
results.
Our
historical practice has been to rapidly integrate acquisitions into our existing
business and to report financial performance on a company-wide
level. As a result of this practice, we do not separately track the
standalone performance of acquisitions after the date of the
transaction. Consequently, investors cannot quantify the financial
performance and success of any individual acquisition or our consolidated
financial performance and success excluding the impact of
acquisitions. In addition, our practice of rapidly integrating
acquisitions into our financial results may limit the ability of investors to
analyze any trends in our operating results over time.
An
inability to identify, consummate or integrate acquisitions may slow our future
growth.
We plan
to continue to identify and consummate additional acquisitions to further
diversify our businesses and to penetrate or expand important markets. We may
not be able to identify suitable acquisition candidates at reasonable prices.
Even if we identify promising acquisition candidates, the timing, price,
structure and success of future acquisitions are uncertain. An inability to
consummate or integrate attractive acquisitions may reduce our growth rate and
our ability to penetrate new markets.
If
any of our major customers terminates a substantial amount of existing
agreements, chooses not to enter into new agreements or elects not to submit
additional purchase orders for our products, our business may
suffer.
Most of
our sales are made on a purchase order basis. We have a concentration
of several primary customers that we rely on for a material amount of these
purchase orders. To the extent we have agreements in place with these
customers, most of these agreements are either short-term in nature or provide
these customers with the ability to terminate the arrangement. Such
agreements typically do not provide us with any material recourse in the event
of non-renewal or early termination.
We will
lose business and our revenues may decrease if one of these major
customers:
|
|
·
|
does
not submit additional purchase
orders;
|
|
|
·
|
does
not enter into new agreements with
us;
|
|
|
·
|
elects
to reduce or prolong their purchase orders;
or
|
|
|
·
|
elects
to terminate their relationship with
us.
|
If
we do not effectively manage our business in the face of fluctuations in the
size of our organization, our business may be disrupted.
We have
grown both organically and as a result of acquisitions. We have also
contracted as a result of declines in global demand and
divestitures. We may significantly reduce or expand our workforce and
facilities in response to rapid changes in demand for our products due to
prevailing global market conditions. These rapid fluctuations place strains on
our resources and systems. If we do not effectively manage our resources and
systems, our business may be adversely affected.
Uncertainty
in demand for our products may result in increased costs of production, an
inability to service our customers or higher inventory levels which may
adversely affect our results of operations and financial condition.
We have
very little visibility into our customers’ future purchasing patterns and are
highly dependent on our customers’ forecasts. These forecasts are non-binding
and often highly unreliable. Given the fluctuation in growth rates
and cyclical demand for our products, as well as our reliance on often imprecise
customer forecasts, it is difficult to accurately manage our production
schedule, equipment and personnel needs and our raw material and working capital
requirements.
Our
failure to effectively manage these issues may result in:
|
|
·
|
production
delays;
|
|
|
·
|
increased
costs of production;
|
|
|
·
|
excessive
inventory levels and reduced financial
liquidity;
|
|
|
·
|
an
inability to make timely deliveries;
and
|
|
|
·
|
a
decrease in profits or cash flows.
|
A
decrease in availability of our key raw materials could adversely affect our
profit margins.
We use
several types of raw materials in the manufacturing of our products,
including:
|
|
·
|
base
metals such as copper;
|
|
|
·
|
ferrite
cores; and
|
|
|
·
|
plastics
and plastic resins.
|
Some of
these materials are produced by a limited number of suppliers. We may
be unable to obtain these raw materials in sufficient quantities or in a timely
manner to meet the demand for our products. The lack of availability or a delay
in obtaining any of the raw materials used in our products could adversely
affect our manufacturing costs and profit margins. In addition, if the price of
our raw materials increases significantly over a short period of time due to
increased market demand or shortage of supply, customers may be unwilling to
bear the increased price for our products and we may be forced to sell our
products containing these materials at lower prices causing a reduction in our
profit margins.
Costs
associated with precious metals and base metals may not be
recoverable.
Some of
Electrical’s raw materials, such as precious metals and certain base metals, are
considered commodities and are subject to price volatility. Electrical attempts
to limit its exposure to fluctuations in the cost of precious materials,
including silver, by obtaining the majority of the precious metal in its
facilities through leasing or consignment arrangements with suppliers.
Electrical then typically purchases the precious metal from its supplier at the
current market price on the day after shipment to the customer and passes this
cost on to the customer. Electrical attempts to limit its exposure to base metal
price fluctuations by attempting to pass through the cost of base metals to
customers, typically by indexing the cost of the base metal, so that the cost of
the base metal closely relates to the price charged to customers, but Electrical
may not always be successful in indexing these costs or fully passing through
costs to its customers.
Leasing/consignment
fee increases are primarily caused by increases in interest rates or volatility
in the price of the consigned material. Fees charged by the consignor
are driven by interest rates and the market price of the consigned
material. The market price of the consigned material is determined by
its supply and demand. Consignment fees may increase if interest rates or the
price of the consigned material increase.
Electrical’s
results of operations and liquidity may be negatively impacted if it is unable
to:
|
|
·
|
enter
into new leasing or consignment arrangements with similarly favorable
terms after its existing agreements
terminate;
|
|
|
·
|
recover
increased leasing or consignment costs through an increase in
prices;
|
|
|
·
|
pass
through higher base metals’ costs to its customers;
or
|
|
|
·
|
comply
with existing leasing or consignment
obligations.
|
Competition
may result in reduced demand for our products and reduced sales.
We
frequently encounter strong competition within individual product lines from
various competitors throughout the world. We compete principally on the basis
of:
|
|
·
|
product
quality and reliability;
|
|
|
·
|
global
design and manufacturing
capabilities;
|
|
|
·
|
breadth
of product line;
|
|
|
·
|
price;
|
|
|
·
|
customer
service; and
|
|
|
·
|
delivery
time.
|
Our
inability to successfully compete on any or all of the above or other factors
may result in reduced sales.
Fluctuations
in foreign currency exchange rates may adversely affect our operating
results.
We
manufacture and sell our products in various regions of the world and export and
import these products to and from a large number of countries. Fluctuations in
exchange rates could negatively impact our cost of production and sales which,
in turn, could decrease our operating results and cash flow. In
addition, if the functional currency of our manufacturing costs strengthened
compared to the functional currency of our competitors’ manufacturing costs, our
products may become more costly than our competitors. Although we
engage in limited hedging transactions, including foreign currency exchange
contracts which may reduce our transaction and economic exposure to
foreign currency fluctuations, these measures may not eliminate or substantially
reduce our risk in the future.
Our
international operations subject us to the risks of unfavorable political,
regulatory, labor and tax conditions in other countries.
We
manufacture and assemble most of our products in locations outside the United
States, such as China, and a majority of our revenues are derived from sales to
customers outside the United States. Our future operations and earnings may be
adversely affected by the risks related to, or any other problems arising from,
operating in international locations and markets.
Risks
inherent in doing business internationally may include:
|
|
·
|
the
inability to repatriate or transfer cash on a timely or efficient
basis;
|
|
|
·
|
economic
and political instability;
|
|
|
·
|
expropriation
and nationalization;
|
|
|
·
|
trade
restrictions;
|
|
|
·
|
capital
and exchange control programs;
|
|
|
·
|
transportation
delays;
|
|
|
·
|
uncertain
rules of law;
|
|
|
·
|
foreign
currency fluctuations; and
|
|
|
·
|
unexpected
changes in the laws and policies of the United States or of the countries
in which we manufacture and sell our
products.
|
The
majority of our manufacturing occurs in the PRC. Although the PRC has
a large and growing economy, political, legal and labor developments entail
uncertainties and risks. For example, during the second half of 2009, we began
to encounter difficulties in attracting and retaining the level of labor
required to meet our customer’s demand. Also, wages have been
increasing rapidly over the last several years in southern
China. While China has been receptive to foreign investment, its
investment policies may not continue indefinitely into the future and future
policy changes may adversely affect our ability to conduct our operations in
these countries or the costs of such operations.
We have
benefited in prior years from favorable tax incentives and we operate in
countries where we realize favorable income tax treatment relative to the U.S.
statutory rate. We have been granted special tax incentives,
including tax holidays, in jurisdictions such as the PRC. This
favorable situation could change if these countries were to increase rates or
discontinue the special tax incentives, or if we discontinue our manufacturing
operations in any of these countries and do not replace the operations with
operations in other locations with similar tax incentives or policies.
Accordingly, in the event of changes in laws and regulations affecting our
international operations, we may not be able to continue to recognize or take
advantage of similar benefits in the future.
Shifting
our operations between regions may entail considerable expense, capital and
opportunity costs.
Within
countries in which we operate, particularly China, we sometimes shift our
operations from one region to another in order to maximize manufacturing and
operational efficiency. We may close one or more additional factories in the
future. This could entail significant earnings charges and cash payments to
account for severance, asset impairments, write-offs, write-downs, moving
expenses, start-up costs and inefficiencies, as well as certain adverse tax
consequences including the loss of specialized tax incentives, non-deductible
expenses or value-added tax consequences.
Liquidity
requirements could necessitate movements of existing cash balances which may be
subject to restrictions or cause unfavorable tax and earnings
consequences.
A
significant portion of our cash is held offshore by international subsidiaries
and may be denominated in currencies other than the U.S.
dollar. While we intend to use a significant amount of the cash held
overseas to fund our international operations and growth, if we encounter a
significant need for liquidity domestically or at a particular location that we
cannot fulfill through borrowings, equity offerings, or other internal or
external sources, we may experience unfavorable tax and earnings consequences
due to cash transfers. These adverse consequences would occur, for
example, if the transfer of cash into the United States is taxed and no
offsetting foreign tax credit is available to offset the U.S. tax liability,
resulting in lower earnings. In addition, we may be prohibited from
transferring cash from a country such as the PRC. Foreign exchange ceilings
imposed by local governments and the sometimes lengthy approval processes which
foreign governments require for international cash transfers may delay our
internal cash transfers from time to time. We have not experienced
any significant liquidity restrictions in any country in which we operate and
none are presently foreseen.
All of
our retained earnings are free from legal or contractual restrictions, with the
exception of approximately $30.2 million of retained earnings as of December 25,
2009, primarily in the PRC that are restricted in accordance with the PRC
Foreign Investment Enterprises Law. This law restricts 10% of our net
earnings in the PRC, up to a maximum amount equal to 50% of the total capital we
have invested in the PRC. The $30.2 million includes approximately $5.7 million
of retained earnings of a majority owned subsidiary and approximately $1.9
million of a discontinued operation.
Losing
the services of our executive officers or our other highly qualified and
experienced employees could adversely affect our businesses.
Our
success depends upon the continued contributions of our executive officers and
senior management, many of whom have numerous years of experience and would be
extremely difficult to replace. We must also attract and maintain experienced
and highly skilled engineering, sales and marketing, finance and manufacturing
personnel. Competition for qualified personnel is often intense, and
we may not be successful in hiring and retaining these people. If we lose the
services of these key employees or cannot attract and retain other qualified
personnel, our businesses could be adversely affected.
On
February 22, 2010 we announced that our board of directors has named Daniel M.
Moloney our next chief executive officer, replacing James M. Papada, III, who is
retiring, pursuant to a plan announced to the board in 2008. Mr.
Moloney comes to Technitrol from Motorola, Inc., where he served most recently
as Executive Vice President and President of its Home and Network Mobility
business, a leading provider of integrated and customized end-to-end media
solutions for cable, wireline, and wireless service providers. He
played a leading role in expanding the breadth and global presence of this
business. Mr. Moloney served nearly 10 years in senior-level
capacities at Motorola and, previously, 16 years in managerial positions of
increasing responsibility at General Instrument Corporation before its
acquisition by Motorola early in 2000. He holds a bachelor's degree
in electrical engineering from the University of Michigan and a master of
business administration from the University of Chicago. Mr. Moloney
is expected to join Technitrol at the end of March
2010.
Public
health epidemics (such as flu strains or severe acute respiratory syndrome) or
natural disasters (such as earthquakes or fires) may disrupt operations in
affected regions and affect operating results.
We
maintain extensive manufacturing operations in the PRC as do many of our
customers and suppliers. A sustained interruption of our
manufacturing operations, or those of our customers or suppliers, resulting from
complications caused by a public health epidemic or natural disasters could have
a material adverse effect on our business and results of
operations.
The
unavailability of insurance against certain business and product liability risks
may adversely affect our future operating results.
As part
of our comprehensive risk management program, we purchase insurance coverage
against certain business and product liability risks. However, not
all risks are insured, and those that are insured differ in covered amounts by
type of risk, end market and customer location. If any of our insurance carriers
discontinues an insurance policy, significantly reduces available coverage or
increases our deductibles and we cannot find another insurance carrier to write
comparable coverage at similar costs, or if we are not fully insured for a
particular risk in a particular place, then we may be subject to increased costs
of uninsured or under-insured losses which may adversely affect our operating
results.
Also, our
components, modules and other products are used in a broad array of
representative end products. If our insurance program does not
adequately cover liabilities arising from the direct use of our products or as a
result of our products being used in our customers’ products, we may be subject
to increased costs of uninsured losses which may adversely affect our operating
results.
Environmental
liability and compliance obligations may adversely affect our operations and
results.
Our
manufacturing operations are subject to a variety of environmental laws and
regulations as well as internal programs and policies governing:
|
|
·
|
air
emissions;
|
|
|
·
|
wastewater
discharges;
|
|
|
·
|
the
storage, use, handling, disposal and remediation of hazardous substances,
wastes and chemicals; and employee health and
safety.
|
If
violations of environmental laws should occur, we could be held liable for
damages, penalties, fines and remedial actions for contamination discovered at
our present or former facilities. Our operations and results could be
adversely affected by any material obligations arising from existing laws or new
regulations that may be enacted in the future. We may also be held
liable for past disposal of hazardous substances generated by our business or
businesses we acquire.
Our
debt levels could adversely affect our financial position, liquidity and
perception of our financial condition in the financial markets.
We were
in compliance with the covenants of our amended and restated credit agreement as
of December 25, 2009. Outstanding borrowings against this agreement,
which allows for a maximum facility of $100.0 million, were $81.0 million at
December 25, 2009. In addition to the debt outstanding under our
credit agreement, we issued $50.0 million of convertible senior notes during the
fourth quarter of 2009. We believe the severe economic and credit
crisis that began in late 2008 and continued into 2009 has resulted in these
borrowings having a significant adverse affect on our share
price. Our share price may continue to be depressed until our
leverage improves.
Covenants
with our lenders require compliance with specific financial ratios that may make
it difficult for us to obtain additional financing on acceptable terms for
future acquisitions or other corporate needs. Although we anticipate
meeting our covenants in the normal course of operations, our ability to remain
in compliance with the covenants may be adversely affected by future events
beyond our control. Violating any of these covenants could result in
being declared in default, which may result in our lenders electing to declare
our outstanding borrowings immediately due and payable and terminate all
commitments to extend further credit. If the lenders accelerate the
repayment of borrowings, we cannot provide assurance that we will have
sufficient liquid assets to repay our credit facilities and other
indebtedness. In addition, certain domestic and international
subsidiaries have pledged the shares of certain subsidiaries, as well as
selected accounts receivable, inventory, machinery and equipment and other
assets as collateral. If we default on our obligations, our lenders
may take possession of the collateral and may license, sell or otherwise dispose
of those related assets in order to satisfy our obligations.
Our
results may be negatively affected by changing interest rates.
We are
subject to market risk from exposure to changes in interest rates. To
mitigate the risk of changing interest rates, we may utilize derivatives or
other financial instruments. We do not expect changes in interest rates to have
a material effect on our income or cash flows for the foreseeable future,
although there can be no assurances that interest rates will not significantly
change or that our results would not be negatively affected by such
changes.
Our
intellectual property rights may not be adequately protected.
We may
not be successful in protecting our intellectual property through patent laws,
other regulations or by contract. As a result, other companies may be able to
develop and market similar products which could materially and adversely affect
our business. We may be sued by third parties for alleged infringement of their
proprietary rights and we may incur defense costs and possibly royalty
obligations or lose the right to use technology important to our
business.
From time
to time, we receive claims by third parties asserting that our products violate
their intellectual property rights. Any intellectual property claims,
with or without merit, could be time consuming and expensive to litigate or
settle and could divert management attention from administering our
business. A third party asserting infringement claims against us or
our customers with respect to our current or future products may materially and
adversely affect us by, for example, causing us to enter into costly royalty
arrangements or forcing us to incur settlement or litigation costs.
Our
stock price, like that of many technology companies, has been and may continue
to be volatile.
The
market price of our common stock may fluctuate as a result of variations in our
quarterly operating results and other factors, some of which may be beyond our
control. These fluctuations may be exaggerated if the trading volume
of our common stock is low.
In
addition, the market price of our common stock may rise and fall in response to
the following factors, or the perception or anticipation of the following
factors:
|
|
·
|
announcements
of technological or competitive
developments;
|
|
|
·
|
acquisitions
or strategic alliances by us or our
competitors;
|
|
|
·
|
divestitures
of core and non-core businesses;
|
|
|
·
|
the
gain or loss of a significant customer or
order;
|
|
|
·
|
the
existence of debt levels which significantly exceed our cash
levels;
|
|
|
·
|
changes
in our liquidity, capital resources or financial
position;
|
|
|
·
|
changes
in estimates or forecasts of our financial performance or changes
in recommendations by securities analysts regarding us or our
industry;
|
|
|
·
|
general
market or economic conditions; or
|
|
|
·
|
future
business prospects.
|
Worldwide
recession and disruption of financial markets.
The
slowdown in economic activity in 2008 and 2009 caused by the ongoing global
recession and the reduced availability of liquidity and credit has adversely
affected our business. Difficult financial and economic
conditions may adversely affect our customers’ ability to meet the terms of sale
or our suppliers’ ability to fully perform according to their commitments to
us.
Item
1b Unresolved Staff Comments
None
Item 2 Properties
We are
headquartered in Trevose, Pennsylvania where we lease approximately 8,000 square
feet of office space. We operated 22 manufacturing plants in 5 countries as of
December 25, 2009, of which 7 manufacturing plants in 3 of those countries only
manufacture products of Electrical. We sold 3 of Electrical’s plants
located in North America on January 4, 2010. We seek to maintain
facilities in those regions where we market our products in order to maintain a
local presence with our customers.
The
following is a list of the principal manufacturing locations of our continuing
operations as of December 25, 2009:
|
Approx.
Percentage
|
|||||||||
|
Location (1)
|
Approx. Square Ft. (2)
|
Owned/Leased
|
Used For Manufacturing
|
||||||
|
Zhuhai,
PRC
|
374,000 |
Leased
|
90 | % | |||||
|
Ningbo,
PRC
|
363,000 |
Owned
|
80 | % | |||||
|
Mianyang,
PRC
|
318,000 |
Leased
|
80 | % | |||||
|
Dongguan,
PRC
|
231,000 |
Leased
|
100 | % | |||||
|
Suzhou,
PRC
|
171,000 |
Leased
|
100 | % | |||||
|
Shenzhen,
PRC
|
68,000 |
Leased
|
100 | % | |||||
|
Vancouver,
Washington
|
25,000 |
Leased
|
60 | % | |||||
|
Bristol,
Pennsylvania
|
20,000 |
Leased
|
60 | % | |||||
|
Total
|
1,570,000 | ||||||||
|
(1)
|
In
addition to these manufacturing locations, we have 371,000 square feet of
space which is used for engineering, sales and administrative support
functions at various locations, including Electronics’ headquarters in San
Diego, California. In addition, we lease approximately 956,000 square feet
of space for dormitories, canteens and other employee-related facilities
in the PRC.
|
|
(2)
|
Consists
of aggregate square footage in each locality where manufacturing
facilities are located. More than one manufacturing facility may be
located within each locality.
|
Item 3 Legal Proceedings
We are a
party to various legal proceedings and other actions. See discussion
in Note 10 to the Consolidated Financial Statements. We expect litigation to
arise in the normal course of business. Although it is difficult to
predict the outcome of any legal proceeding, we do not believe that the outcome
of these proceedings and actions will, individually or in the aggregate, have a
material adverse effect on our consolidated financial condition or results of
operations.
Item 4 Submission of
Matters to a Vote of Security Holders
None
Part
II
Item 5 Market for Registrant’s Common
Equity and Related Stockholder Matters
Our
common stock is traded on the New York Stock Exchange under the ticker symbol
“TNL.” The following table reflects the highest and lowest sales
prices in each quarter of the last two years.
|
First Quarter
|
Second Quarter
|
Third Quarter
|
Fourth Quarter
|
|||||||||||||
|
2009
High
|
$ | 4.04 | $ | 6.80 | $ | 9.14 | $ | 10.43 | ||||||||
|
2009
Low
|
$ | 1.00 | $ | 1.71 | $ | 5.29 | $ | 4.18 | ||||||||
|
2008
High
|
$ | 28.99 | $ | 25.28 | $ | 17.37 | $ | 15.35 | ||||||||
|
2008
Low
|
$ | 19.51 | $ | 17.05 | $ | 12.16 | $ | 2.47 | ||||||||
On
December 25, 2009, there were approximately 921 registered holders of our common
stock, which has a par value of $0.125 per share and is the only class of stock
that we have outstanding. See additional discussion on restricted
retained earnings of subsidiaries in Item 7, Liquidity and Capital Resources,
and in Note 11 of our Consolidated Financial Statements.
We paid
dividends of approximately $6.7 million during the year ended December 25,
2009. We used $14.3 million for dividend payments during the years
ended December 26, 2008 and December 28, 2007, respectively. On
November 2, 2009, we announced a quarterly cash dividend of $0.025 per common
share, payable on January 15, 2010 to shareholders of record on January 1,
2010. This quarterly dividend resulted in a cash payment to
shareholders of approximately $1.0 million in the first quarter of
2010. We expect to continue making quarterly cash dividend payments
for the foreseeable future.
Information
as of December 25, 2009 concerning plans under which our equity securities are
authorized for issuance are as follows:
|
Plan
Category
|
Number of shares to be issued upon exercise of
options, grant of restricted shares or other incentive
shares
|
Weighted average exercise price of outstanding
options
|
Number of securities remaining
available
for future issuance
|
|||||||||
|
Equity
compensation plans approved by security holders
|
6,150,000 | $ | 17.53 | 2,779,789 | ||||||||
|
|
||||||||||||
|
Equity
compensation plans not approved by security holders
|
-- | -- | -- | |||||||||
|
|
||||||||||||
|
Total
|
6,150,000 | $ | 17.53 | 2,779,789 | ||||||||
On May
15, 1981, our shareholders approved an incentive compensation plan (“ICP”)
intended to enable us to obtain and retain the services of employees by
providing them with incentives that may be created by the Board of Directors
Compensation Committee under the ICP. Subsequent amendments to the
plan were approved by our shareholders including an amendment on May 23, 2001
which increased the total number of shares of our common stock which may be
granted under the plan to 4,900,000 shares. Our 2001 Stock Option
Plan and the Restricted Stock Plan II were adopted under the ICP. In
addition to the ICP, other plans approved include a 250,000 share Board of
Director Stock Plan and a 1,000,000 share Employee Stock Purchase Plan
(“ESPP”). During 2004, the operation of the ESPP was suspended
following an evaluation of its affiliated expense and perceived value by
employees. Of the 2,779,789 shares remaining available for future
issuance, 1,856,498 shares are attributable to our ICP, 812,099 shares are
attributable to our ESPP and 111,192 shares are attributable to our Board of
Director Stock Plan. Note 12 to the Consolidated Financial Statements contains
additional information regarding our stock-based compensation
plans.
|
|
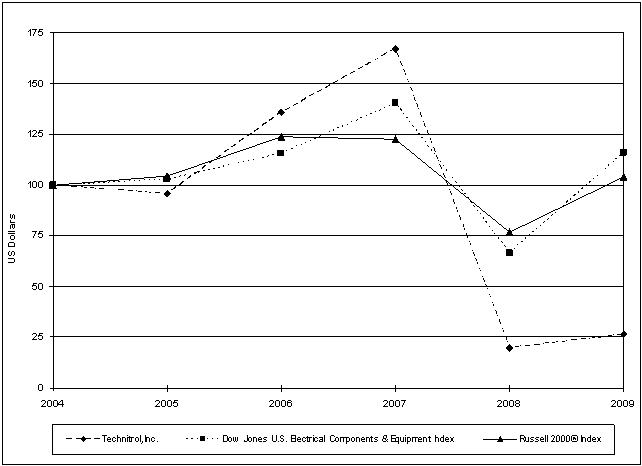
Comparison
of Five-Year Cumulative Total
Return
|
The
following graph compares the growth in value on a total-return basis of $100
investments in Technitrol,
Inc., the Russell 2000® Index and the Dow Jones U.S. Electrical Components
and Equipment Industry Group Index between December 31, 2004 and December
25, 2009. Total-return data reflect closing share prices on the final
day of each Technitrol fiscal year. Cash dividends paid are
considered as if reinvested. The graph does not reflect intra-year
price fluctuations.
The Russell 2000® Index consists
of approximately the 2,000 smallest companies and about 8% of the total market
capitalization of the Russell 3000® Index. The Russell 3000
represents about 98% of the investable U.S. equity market.
At
December 25, 2009, the Dow
Jones U.S. Electrical Components and Equipment Industry Group Index
included the common stock of American Superconductor Corp., Amphenol Corp.,
Anixter International, Inc., Arrow Electronics, Inc., Avnet, Inc., AVX Corp.,
Baldor Electric Co., Belden, Benchmark Electronics, Inc., Commscope, Inc.,
Cooper Industries Ltd. Class A, EnerSys, Flextronics International, Ltd.,
General Cable Corp., GrafTech International Ltd., Hubbell Inc. Class B, Jabil
Circuit, Inc., Littelfuse, Inc., Molex, Inc. and Molex, Inc. Class A, Plexus
Corp., Regal-Beloit Corp., Thomas & Betts Corp., Tyco Electronics
Ltd., Wesco International, Inc. and Vishay Intertechnology, Inc.
|
2004
|
2005
|
2006
|
2007
|
2008
|
2009
|
|||||||||||||||||||
|
Technitrol,
Inc.
|
$ | 100.00 | $ | 95.67 | $ | 135.72 | $ | 167.18 | $ | 19.78 | $ | 26.27 | ||||||||||||
|
Dow
Jones U.S. Electrical Components & Equipment Industry Group
Index
|
$ | 100.00 | $ | 102.64 | $ | 115.74 | $ | 140.19 | $ | 66.61 | $ | 116.15 | ||||||||||||
|
Russell
2000® Index
|
$ | 100.00 | $ | 104.55 | $ | 123.76 | $ | 122.73 | $ | 76.93 | $ | 103.94 | ||||||||||||
Item 6 Selected Financial
Data (in thousands, except per share
amounts)
|
2009(1)(2)(3)
|
2008(1)(2)(4)(5)
|
2007(2)
|
2006(2)(6)
|
2005(2)(7)
|
||||||||||||||||
|
Net
sales
|
$ | 398,803 | $ | 626,270 | $ | 671,569 | $ | 627,495 | $ | 361,552 | ||||||||||
|
(Loss)
earnings from continuing operations before cumulative effect of accounting
changes
|
$ | (72,859 | ) | $ | (123,553 | ) | $ | 42,173 | $ | 46,464 | $ | (28,550 | ) | |||||||
|
Cumulative
effect of accounting changes, net of income taxes
|
-- | -- | -- | 75 | (564 | ) | ||||||||||||||
|
Net
(loss) earnings from discontinued operations
|
(119,978 | ) | (151,467 | ) | 19,740 | 12,175 | 3,189 | |||||||||||||
|
Net
(loss) earnings
|
(192,837 | ) | (275,020 | ) | 61,913 | 58,714 | (25,925 | ) | ||||||||||||
|
Less:
Net earnings attributable to non-controlling interest
|
375 | 738 | 256 | 1,511 | 939 | |||||||||||||||
|
Net
(loss) earnings attributable to Technitrol, Inc.
|
$ | (193,212 | ) | $ | (275,758 | ) | $ | 61,657 | $ | 57,203 | $ | (26,864 | ) | |||||||
|
Basic
(loss) earnings per share:
|
||||||||||||||||||||
|
Net
(loss) earnings from continuing operations before cumulative effect of
accounting changes
|
$ | (1.79 | ) | $ | (3.05 | ) | $ | 1.03 | $ | 1.11 | $ | (0.74 | ) | |||||||
|
Cumulative
effect of accounting changes, net of income taxes
|
-- | -- | -- | 0.00 | (0.01 | ) | ||||||||||||||
|
Net
(loss) earnings from discontinued operations
|
(2.94 | ) | (3.72 | ) | 0.49 | 0.31 | 0.08 | |||||||||||||
|
Net
(loss) earnings
|
$ | (4.73 | ) | $ | (6.77 | ) | $ | 1.52 | $ | 1.42 | $ | (0.67 | ) | |||||||
|
Diluted
(loss) earnings per share:
|
||||||||||||||||||||
|
Net
(loss) earnings from continuing operations before cumulative effect of
accounting changes
|
$ | (1.79 | ) | $ | (3.05 | ) | $ | 1.03 | $ | 1.11 | $ | (0.74 | ) | |||||||
|
Cumulative
effect of accounting changes, net of income taxes
|
-- | -- | -- | 0.00 | (0.01 | ) | ||||||||||||||
|
Net
(loss) earnings from discontinued operations
|
(2.94 | ) | (3.72 | ) | 0.48 | 0.30 | 0.08 | |||||||||||||
|
Net
(loss) earnings
|
$ | (4.73 | ) | $ | (6.77 | ) | $ | 1.51 | $ | 1.41 | $ | (0.67 | ) | |||||||
|
Total
assets
|
$ | 379,911 | $ | 769,911 | $ | 821,353 | $ | 769,480 | $ | 684,902 | ||||||||||
|
Total
long-term debt and convertible senior notes
|
$ | 131,000 | $ | 343,189 | $ | 10,467 | $ | 57,391 | $ | 83,492 | ||||||||||
|
Technitrol,
Inc. shareholders’ equity
|
$ | 56,186 | $ | 197,446 | $ | 561,079 | $ | 479,029 | $ | 417,264 | ||||||||||
|
Net
worth per share
|
$ | 1.36 | $ | 4.82 | $ | 13.72 | $ | 11.76 | $ | 10.30 | ||||||||||
|
Number
of shares outstanding:
|
||||||||||||||||||||
|
Year
end
|
41,242 | 40,998 | 40,901 | 40,751 | 40,529 | |||||||||||||||
|
Dividends
declared per share
|
$ | 0.10 | $ | 0.35 | $ | 0.35 | $ | 0.35 | $ | 0.35 | ||||||||||
|
Price
range per share:
|
||||||||||||||||||||
|
High
|
$ | 10.43 | $ | 28.99 | $ | 30.50 | $ | 32.28 | $ | 19.03 | ||||||||||
|
Low
|
$ | 1.00 | $ | 2.47 | $ | 21.06 | $ | 16.78 | $ | 12.20 | ||||||||||
|
(1)
|
On
June 25, 2009, we completed the disposition of our Medtech components
business, for approximately $201.4 million in cash. We have reflected the
results of Medtech as a discontinued operation on the December 25, 2009
and December 26, 2008 Consolidated Statements of
Operations.
|
|
(2)
|
During
the second quarter of 2009, our board of directors approved a plan to
divest our Electrical segment. We have reflected the results of
Electrical as a discontinued operation on the Consolidated Statements of
Operations for all periods presented. Electrical has
approximately $84.5 million of assets and $24.8 million of liabilities
that are considered held for sale and are included in currents assets and
liabilities, respectively, on the December 25, 2009 Consolidated Balance
Sheet.
|
|
(3)
|
During
the first quarter of 2009, we recorded a $68.9 million goodwill
impairment, which was finalized in the second quarter with an additional
$2.1 million charge.
|
|
(4)
|
During
the fourth quarter of 2008, we recorded a $310.4 million intangible asset
impairment, less a $17.6 million tax
benefit.
|
|
(5)
|
On
February 28, 2008, we acquired Sonion A/S for $426.4 million in cash,
which was financed primarily through borrowings from our multi-currency
credit facility. Additionally, a plan for the divestiture of
the MEMS division of Sonion A/S was approved during the third quarter of
2008 and is reflected as a discontinued
operations.
|
|
(6)
|
On
January 4, 2006, we acquired the ERA Group for $53.4 million in
cash.
|
|
(7)
|
During
2005, we recorded a charge for a cumulative effect of accounting change of
$0.6 million net of an income tax benefit which is included in net (loss)
earnings from continuing operations. Additionally, we recorded
a $38.5 million intangible asset
impairment.
|
Introduction
This
discussion and analysis of our financial condition and results of operations as
well as other sections of this report contain certain “forward-looking
statements” within the meaning of the Private Securities Litigation Reform Act
of 1995 and involve a number of risks and uncertainties. Actual results may
differ materially from those anticipated in these forward-looking statements for
many reasons, including the risks faced by us described in the “Risk Factors”
section of this report on pages 7 through 15.
Overview
We
operate our continuing operations in one segment, our Electronic Components
Group, which we refer to as Electronics and is known as Pulse in its
markets. Electronics is a world-wide producer of precision-engineered
electronic components and modules. We believe we are a leading global producer
of these products in the primary markets we serve based on our estimates of the
annual revenues of our primary markets and our share of those markets relative
to our competitors.
We have
three primary product groups. Our network group includes the production of our
connectors, filters, chokes and other magnetic components. Our wireless group
produces our handset antenna products, our non-cellular wireless and automotive
antenna products and our mobile speakers and receivers. Our power
group includes our power and signal transformers, automotive coils and military
and aerospace products and other power magnetics
products. Net sales for our primary product groups for
the years ended December 25, 2009, December 26, 2008 and December 27, 2007 were
as follows (in
millions):
|
2009
|
2008
|
2007
|
||||||||||
|
Network
|
$ | 152.7 | $ | 216.0 | $ | 226.4 | ||||||
|
Wireless
|
151.0 | 263.3 | 277.9 | |||||||||
|
Power
|
95.1 | 147.0 | 167.3 | |||||||||
|
Net
sales
|
$ | 398.8 | $ | 626.3 | $ | 671.6 | ||||||
General. We define
net sales as gross sales less returns and allowances. We sometimes refer to net
sales as revenue.
Historically,
our gross margin has been significantly affected by acquisitions, product mix
and capacity utilization. Our markets are characterized by relatively
short product life cycles. As a result, significant product turnover
occurs each year and, subsequently, there are frequent variations in the prices
of products sold. Due to the constantly changing quantity of parts we
offer and frequent changes in our average selling prices, we cannot isolate the
impact of changes in unit volume and unit prices on our net sales and gross
margin in any given period. Changes in foreign exchange rates,
especially the U.S. dollar to the euro and the U.S. dollar to the Chinese
renminbi also affect U.S. dollar reported sales.
We
believe our focus on acquisitions, technology and cost reduction programs
provides us opportunities for future growth in net sales and operating
profit. However, unfavorable economic and market conditions may
result in a reduction in demand for our products, thus, negatively impacting our
financial performance.
Acquisitions. Acquisitions
have been an important part of our growth strategy. In many cases,
our moves into new product lines and extensions of our existing product lines or
markets have been facilitated by acquisitions. Our acquisitions continually
change our product mix and broaden our product offerings in new or existing
markets. We may pursue additional acquisition opportunities in the
future.
Technology. Our
products must evolve along with changes in technology, availability and price of
raw materials and design preferences of the end users of our products. Also,
regulatory requirements occasionally impact the design and functionality of our
products. We address these conditions, as well as our customers’ demands, by
continuing to invest in product development and by maintaining a diverse product
portfolio which contains both mature and emerging technologies.
Management
Focus. Our executives focus on a number of important metrics
to evaluate our financial condition and operating performance. For
example, we use revenue growth, gross profit as a percentage of revenue,
operating profit as a percentage of revenue and economic profit as performance
measures. We define economic profit as after-tax operating profit
less our cost of capital. Operating leverage, or incremental
operating profit as a percentage of incremental sales, is also reviewed, as this
reflects the benefit of absorbing fixed overhead and operating
expenses. In evaluating working capital management, liquidity and
cash flow, our executives also use performance measures such as free cash flow,
days sales outstanding, days payables outstanding, inventory turnover,
debt-to-EBITDA leverage and cash conversion efficiency. We define
free cash flow as cash flow from operations less capital
spending. Additionally, as the continued success of our business is
largely dependent on meeting and exceeding customers’ expectations,
non-financial performance measures relating to product development, on-time
delivery and quality assist our management in monitoring customer satisfaction
on an on-going basis.
Cost Reduction
Programs. As a result of our focus on both economic and
operating profit, we continue to aggressively size our operations so that
capacity is optimally matched to current and anticipated future revenues and
unit demand. Future expenses associated with these programs will depend on
specific actions taken. Actions taken over the past several years
such as divestitures, plant closures, plant relocations, asset impairments and
reduction in personnel at certain locations have resulted in the elimination of
a variety of costs. The majority of the non-impairment related costs
that were eliminated represent the annual salaries and benefits of terminated
employees, including both those related to manufacturing and those providing
selling, general and administrative services. Also, we’ve had depreciation
savings from disposed equipment and a reduction in rental expense from the
termination of lease agreements. We have also reduced overhead costs
as a result of relocating factories to lower-cost locations. Savings
from these actions will impact cost of goods sold and selling, general and
administrative expenses. However, the timing of such savings may not
be apparent due to many factors such as unanticipated changes in demand, changes
in unit selling prices, operational challenges or changes in operating
strategies.
During
the year ended December 25, 2009, we determined that approximately $71.0 million
of our wireless group’s goodwill was impaired. Refer to Note 5 for
further details. Additionally, we incurred a charge of $11.9 million
for a number of cost reduction actions. These charges include
severance and related payments of $3.0 million and fixed asset impairments of
$8.9 million. The impaired assets include production lines associated
with products that have no expected future demand and two real estate properties
which were disposed.
During
the year ended December 26, 2008, we determined that $310.4 million of goodwill
and other intangibles were impaired, including $170.3 million of goodwill and
identifiable intangibles of a discontinued operation. Additionally,
we incurred a charge of $13.2 million for a number of cost reduction
actions. These charges include severance and related payments and
other associated costs of $5.5 million resulting from the termination of
manufacturing and support personnel at our operations primarily in Asia, Europe
and North America and $4.1 million of other costs primarily resulting from the
transfer of manufacturing operations from Europe and North Africa to
Asia. Additionally, we recorded fixed asset impairments of $3.6
million.
During
the year ended December 28, 2007, we incurred a charge of $17.6 million for a
number of cost reduction actions. These charges include severance and
related payments of $10.6 million resulting from the termination of
manufacturing and support personnel at our operations in Asia, Europe and North
America and $5.5 million for the write down of certain fixed assets to their
disposal values. Additionally, we incurred approximately $1.5 million
of other plant closure, relocation and similar costs associated with these
actions.
Divestitures. We engage in
divestitures to streamline our operations, focus on our core businesses, reduce
debt and strengthen our financial position. In February 2009, we
announced our intention to explore monetization alternatives with respect to our
Electrical segment, a producer of a full array of precious metal electrical
contact products that range from materials used in the fabrication of electrical
contacts to completed contact subassemblies. During the second quarter of
2009, we determined that Electrical met the qualifications to be reported as a
discontinued operation in our Consolidated Statement of Operations for all
periods presented. In addition, the assets and liabilities of
Electrical are considered held for sale and reported as current on our December
25, 2009 Consolidated Balance Sheet. On January 4, 2010, we completed the sale
of Electrical’s North American business for an amount immaterial to our
Consolidated Financial Statements. We expect the disposition of
the remaining Electrical business to be completed by the end of June
2010. On June 25, 2009, we divested Electronics’ Medtech components
business for approximately $201.4 million. These proceeds were subject to final
working capital and financial indebtedness adjustments which were finalized in
early January, 2010 for a payment immaterial to our Consolidated Financial
Statements. All open customer orders were transferred at the date of
sale. Also, in April 2009, we divested our non-core MEMS business for an amount
immaterial to our Consolidated Financial Statements. We have had no material
continuing involvement with the operations of Medtech or MEMS after each
respective sale.
International Operations. At
December 25, 2009, we had manufacturing operations in five countries, three of
which are only engaged in operations which we are in the process of
divesting. We produce a majority of our products in China and
sell the majority of these products to customers in China and other countries in
Asia. Our net sales are denominated primarily in U.S. dollars,
euros and Chinese renminbi. Changing exchange rates often impact our
financial results and our period-over-period comparisons. This is
particularly true of movements in the exchange rate between the U.S. dollar and
the renminbi and the U.S. dollar and the euro and each of these and other
foreign currencies relative to each other. Sales and net earnings
denominated in currencies other than the U.S. dollar may result in higher or
lower dollar sales and net earnings upon translation for our U.S. dollar
denominated Consolidated Financial Statements. Certain divisions of
our wireless and power groups’ sales are denominated primarily in euros and
renminbi. Net earnings may also be affected by the mix of sales and
expenses by currency within each group. We may also experience a positive or
negative translation adjustment to equity because our investments in non-U.S.
dollar-functional subsidiaries may translate to more or less U.S. dollars in our
U.S. Consolidated Financial Statements. Foreign currency gains or
losses may also be incurred when non-functional currency denominated
transactions are remeasured to an operation’s functional currency for financial
reporting purposes. If a higher percentage of our transactions are denominated
in non-U.S. currencies, increased exposure to currency fluctuations may
result.
In order
to reduce our exposure to currency fluctuations, we may purchase currency
exchange forward contracts and/or currency options. These contracts guarantee a
predetermined exchange rate or range of rates at the time the contract is
purchased. This allows us to shift the majority of the risk of currency
fluctuations from the date of the contract to a third party for a
fee. In determining the use of forward exchange contracts and
currency options, we consider the amount of sales, purchases and net assets or
liabilities denominated in local currencies, the currency to be hedged and the
costs associated with the contracts. At December 25, 2009, we had
seven foreign exchange forward contracts outstanding to sell forward
approximately 7.0 million euro, or approximately $10.1 million, to receive
Chinese renminbi. The fair value of these forward contracts was
a liability of $0.2 million as determined through use of Level 2 fair value
inputs as defined in the fair value hierarchy of Topic 815 in the Financial
Accounting Standards Board’s (“FASB”) Accounting Standards Codification
(“ASC”). These contracts are used to mitigate the risk of currency
fluctuations at our Chinese operations. At December 26, 2008, we had
twelve foreign exchange forward contracts outstanding to sell forward
approximately $12.0 million U.S. dollars to receive Danish krone, and eight
foreign exchange forward contracts outstanding to sell forward approximately 8.0
million euro, or approximately $11.3 million, to receive Chinese
renminbi. The fair value of these forward contracts was an asset of
$0.1 million as determined through use of Level 2 inputs.
Precious Metals. Electrical,
the segment we are currently in the process of divesting, uses silver and other
precious metals in manufacturing most of its electrical contacts, contact
materials and contact subassemblies. Historically, Electrical has leased or held
these materials through consignment-type arrangements with its suppliers, except
in China where such leasing arrangements are prohibited. Leasing and consignment
costs have typically been lower than the costs to borrow funds to purchase the
metals and, more importantly, these arrangements eliminate the effects of
fluctuations in the market price of owned precious metal and enable Electrical
to minimize its inventories. Electrical’s terms of sale generally allow it to
charge customers for precious metal content based on the market value of
precious metal on the day after shipment to the customer. Suppliers
invoice Electrical based on the market value of the precious metal on the day
after shipment to the customer as well. Thus far, Electrical has been
successful in managing the costs associated with its precious metals. While
limited amounts are purchased for use in production, the majority of precious
metal inventory continues to be leased or held on consignment. If leasing or
consignment costs increase significantly in a short period of time, and
Electrical is unable to recover these increased costs through higher sales
prices, a negative impact on Electrical’s results of operations and liquidity
may result. Leasing and consignment fee increases are caused primarily by
increases in interest rates or volatility in the price of the consigned
material. Similarly, if Electrical is unable to maintain the
necessary bank commitments and credit limits necessary for its precious metal
leasing and consignment facilities, or obtain alternative facilities on a timely
basis, Electrical may be required to finance the direct purchase of precious
metals, reduce its production volume or take other actions that could negatively
impact its financial condition and results of operations.
Income Taxes. Our effective
income tax rate is affected by the proportion of our income earned in high-tax
jurisdictions, such as those in Europe and the U.S. and income earned in low-tax
jurisdictions, such as Hong Kong and the PRC. This mix of income can
vary significantly from one period to another. Additionally, our effective
income tax rate will be impacted from period to period by significant
transactions and the deductibility of severance, impairment, financing and other
costs. We have benefited over the years from favorable tax incentives
and other tax policies, however, there is no guarantee as to how long these
benefits will continue to exist. Also, changes in operations, tax
legislation, estimates, judgments and forecasts may affect our tax rate from
period to period.
Except in
limited circumstances, we have not provided for U.S. income and foreign
withholding taxes on our non-U.S. subsidiaries’ undistributed earnings. Such
earnings may include our pre-acquisition earnings of foreign entities acquired
through stock purchases, which, with the exception of approximately $40.0
million, are intended to be reinvested outside of the U.S.
indefinitely.
Critical
Accounting Policies
The
preparation of financial statements and related disclosures in conformity with
U.S. generally accepted accounting principles requires us to make judgments,
assumptions and estimates that affect the amounts reported in the consolidated
financial statements and accompanying notes. Note 1 to the
Consolidated Financial Statements on pages 48 through 52 describes the
significant accounting policies and methods used in the preparation of the
Consolidated Financial Statements. Estimates are used for, but not limited to,
the accounting for inventory, divestiture accounting, purchase accounting,
goodwill and identifiable intangibles, income taxes, defined benefit plans,
contingency accruals and severance and asset impairment. Actual results could
differ from these estimates. The following critical accounting policies are
subject to review by our Audit Committee of our Board of Directors are impacted
significantly by judgments, assumptions and estimates used in the preparation of
our Consolidated Financial Statements.
Inventory Valuation. We carry
our inventories at lower of cost or market. We establish inventory
provisions to write down excess and obsolete inventory to market
value. We utilize historical trends and customer forecasts to
estimate expected usage of on-hand inventory. The establishment of
inventory provisions requires judgments and estimates which may change over time
and may cause final amounts to differ materially from original estimates.
However, we do not believe that a reasonable change in these assumptions would
result in a material impact to our financial statements. In addition,
inventory purchases are based upon future demand forecasts estimated by taking
into account actual sales of our products over recent historical periods and
customer forecasts. If there is a sudden and significant decrease in
demand for our products or there is a higher risk of inventory obsolescence
because of rapidly changing technology or customer requirements, we may be
required to write down our inventory and our gross margin could be negatively
affected. However, if we were to sell or use a significant portion of
inventory already written down, our gross margin could be positively
affected. Inventory provisions at December 25, 2009 were $5.7 million
and at December 26, 2008 were $15.4 million, including approximately $8.1
million at our Medtech and Electrical discontinued operations.
Divestiture
Accounting. We have divested certain components of our
business. When this occurs, we report the component that either has
been disposed of, or is classified as held for sale, as a discontinued operation
when the operations and cash flows of the component have been (or will be)
eliminated from our ongoing operations and when we do not expect to have any
significant continuing involvement in the operations of the component after the
disposal transaction. If we plan to dispose of the component by sale,
we would be required to report the component at the lower of its carrying amount
or at fair value less costs to sell in the period which the component is
classified as held for sale. These assessments require judgments and
estimates which include determining when it is appropriate to classify the
component as held for sale, if the component meets the specifications of a
discontinued operation, the fair value of the component and the level and type
of involvement, if any, we will have in the disposed component in the
future. Furthermore, when removing the component from our
Consolidated Balance Sheets and in restating results for prior period, we are
required to make assumptions, judgments and estimates regarding, among other
things, the assets, liabilities and activities of the component and their
relation to our continuing businesses.
Purchase
Accounting. The purchase price of an acquired business is
allocated to the underlying tangible and intangible assets acquired and
liabilities assumed based upon their respective fair market values, with the
excess recorded as goodwill. Such fair market value assessments
require judgments and estimates which may change over time and may cause final
amounts to differ materially from original estimates. Adjustments to
fair value assessments are recorded to goodwill over the purchase price
allocation period which cannot exceed twelve months.
Goodwill and Identifiable
Intangibles. We perform an annual review of goodwill in our
fourth fiscal quarter of each year, or more frequently if indicators of a
potential impairment exist, to determine if the carrying amount of the recorded
goodwill is impaired. The impairment review
process compares the fair value of each reporting unit where goodwill resides
with its carrying value. If the net book value of the reporting unit
exceeds its fair value, we would perform the second step of the impairment test
which requires allocation of the reporting unit’s fair value to all of its
assets and liabilities in a manner similar to a purchase price allocation, with
any residual fair value being allocated to goodwill. An impairment
charge will be recognized only when the implied fair value of a reporting unit’s
goodwill is less than its carrying amount. We have identified three
reporting units, which are our Legacy Electronics unit, including our power and
network groups but excluding a component of our connector group known as FRE,
our wireless group and FRE.
Our
impairment review incorporates both an income and comparable-companies market
approach to estimate potential impairment. We believe the use of
multiple valuation techniques results in a more accurate indicator of the fair
value of each reporting unit, rather than only using an income
approach.
The
income approach is based on estimating future cash flows using various growth
assumptions and discounting based on a present value factor. We develop the
future net cash flows during our annual budget process, which is completed in
our fourth fiscal quarter each year or more frequently if we believe a potential
impairment exists. The growth rates we use are an estimate of the future growth
in the industries in which we participate. Our discount rate assumption is based
on an estimated cost of capital, which we determine annually based on our
estimated costs of debt and equity relative to our capital structure. The
comparable-companies market approach considers the trading multiples of our peer
companies to compute our estimated fair value. The majority of the
comparable-companies utilized in our evaluation are included in the Dow Jones
U.S. Electrical Components and Equipment Industry Group Index.
Our
annual review of goodwill was performed in the fourth quarter of 2009. Step one
of the analysis yielded no impairment as the estimated fair value of each
reporting unit where goodwill has been allocated substantially exceeded its
carrying value.
We
performed step one of the goodwill impairment test during the first quarter of
2009 as a result of the decline in our forecasted operating profit. Our wireless
group did not pass the first step of the impairment test. The second step of the
impairment test yielded a $71.0 million goodwill impairment at our wireless
group. In addition to the 2009 impairment, our annual review in 2008 resulted in
a pre-tax goodwill and other indefinite-lived intangible asset impairment of
$254.7 million. Refer to Note 5 of the Consolidated Financial Statements for
additional details.
The
determination of the fair value of the reporting units and the allocation of
that value to the individual assets and liabilities within those reporting units
requires us to make significant estimates and assumptions. These estimates and
assumptions include, but are not limited to, the selection of the appropriate
discount rate, terminal growth rates, forecasted net cash flows, appropriate
peer group companies and control premiums appropriate for acquisitions in the
industries in which we compete. Due to the inherent uncertainty involved in
making these estimates, actual findings could differ from those estimates.
Changes in assumptions concerning projected financial results or any of the
other underlying assumptions would have a significant impact on either the fair
value of the reporting unit or the amount of the goodwill impairment charge.
Additionally, significant changes in any of these estimates or assumptions in
the future may result in a future impairment. Changes in key assumptions would
affect the 2009 and 2008 recognized goodwill impairments as follows (in millions, except assumption
percentages):
|
2009 Impairment
|
Increase
100
|
Decrease
100
|
||||||||||
|
Assumption
|
Basis
Points
|
Basis
Points
|
||||||||||
|
Discount
rate
|
22.5 | % | $ | 2.9 | $ | (3.0 | ) | |||||
|
Terminal
growth rate
|
3.0 | % | $ | (1.7 | ) | $ | 1.8 | |||||
|
Control
premium
|
25.0 | % | $ | (0.4 | ) | $ | 0.5 | |||||
|
2008 Impairment
|
Increase
100
|
Decrease
100
|
||||||||||
|
Assumption
|
Basis
Points
|
Basis
Points
|
||||||||||
|
Discount
rate
|
21.5 | % | $ | 8.1 | $ | (8.9 | ) | |||||
|
Terminal
growth rate
|
3.0 | % | $ | (4.9 | ) | $ | 4.5 | |||||
|
Control
premium
|
25.0 | % | $ | (0.8 | ) | $ | 0.8 | |||||
We also
assess the impairment of long-lived assets, including identifiable intangible
assets subject to amortization and property, plant and equipment, whenever
events or changes in circumstances indicate the carrying value may not be
recoverable. Factors we consider important that could trigger an impairment
review include significant changes in the use of any asset, changes in
historical trends in operating performance, changes in projected operating
performance, stock price, failure to pass step one of our annual goodwill
impairment test and significant negative economic trends. We performed a
recoverability test on certain definite and indefinite-lived intangible assets
in the first quarter of 2009 that yielded no impairment of identifiable
intangible assets. During our annual review in 2008, we also reviewed our
intangible assets for impairment, which resulted in a pre-tax finite-lived
intangible impairment of $55.7 million. Refer to Note 5 of the Consolidated
Financial Statements for additional details.
Assigning
useful lives and periodically reassessing useful lives of intangible assets is
predicated on various assumptions. Also, the fair values of our intangible
assets are impacted by factors such as changing technology, declines in demand
that lead to excess capacity and other factors. In addition to the various
assumptions, judgments and estimates mentioned above, we may strategically
realign our resources and consider restructuring, disposing of, or otherwise
exiting businesses in response to changes in industry or market conditions,
which may result in an impairment of goodwill or other intangibles. While we
believe the estimates and assumptions used in determining the fair value of
goodwill and identifiable assets are reasonable, a change in those assumptions
could affect their valuation.
Income Taxes. We use the
asset and liability method of accounting for income taxes. Under this
method, income tax expense/benefit is recognized for the amount of taxes payable
or refundable for the current year and for deferred tax liabilities and assets
for the future tax consequences of events that have been recognized in an
entity’s financial statements or tax returns. We must make
assumptions, judgments and estimates to determine our current provision for
income taxes and also our deferred tax assets and liabilities and any valuation
allowance to be recorded against a deferred tax asset. Our judgments,
assumptions and estimates relative to the provision for income tax take into
account current tax laws, our interpretation of current tax laws and possible
outcomes of current and future audits conducted by foreign and domestic tax
authorities. Changes in tax law or our interpretation of tax laws and
the resolution of current and future tax audits could significantly impact the
amounts provided for income taxes in our consolidated financial
statements. Our assumptions, judgments and estimates relative to the
value of a deferred tax asset also take into account predictions of the amount
and category of future taxable income. Actual operating results and
the underlying amount and category of income in future years could render our
current assumptions, judgments and estimates of recoverable net deferred taxes
inaccurate. Any of the assumptions, judgments and estimates mentioned
above could cause our actual income tax obligations to differ from our
estimates.
In
accordance with the recognition standards established, we perform a
comprehensive review of uncertain tax positions regularly. In this
regard, an uncertain tax position represents our expected treatment of a tax
position taken in a filed tax return, or planned to be taken in a future tax
return or claim, that has not been reflected in measuring income tax expense for
financial reporting purposes. Until these positions are sustained by
the taxing authorities, or the statutes of limitations otherwise expire, we have
benefits resulting from such positions and report the tax effects as a liability
for uncertain tax positions in our Consolidated Balance Sheets.
Defined Benefit
Plans. The costs and obligations of our defined benefit plans
are dependent on actuarial assumptions. The three most critical
assumptions used, which impact the net periodic pension expense (income) and the
benefit obligation, are the discount rate, expected return on plan assets and
rate of compensation increase. The discount rate is determined based
on high-quality fixed income investments that match the duration of expected
benefit payments. For our pension obligations in the United States, a
yield curve constructed from a portfolio of high quality corporate debt
securities with varying maturities is used to discount each future year’s
expected benefit payments to their present value. This generates our
discount rate assumption for our domestic pension plans. For our
foreign plans, we use market rates for high quality corporate bonds to derive
our discount rate assumption. The expected return on plan assets
represents a forward projection of the average rate of earnings expected on the
pension assets. We have estimated this rate based on historical
returns of similarly diversified portfolios. The rate of compensation
increase represents the long-term assumption for expected increases to salaries
for pay-related plans. These key assumptions are evaluated
annually. Changes in these assumptions can result in different
expense and liability amounts, as well as a change in future contributions to
the plans. However, we do not believe that a reasonable change in
these assumptions would result in a material impact to our financial
statements. Refer to Note 9 to the Consolidated Financial Statements
for further details of the primary assumptions used in determining the cost and
obligations of our defined benefit plans.
Contingency
Accruals. During the normal course of business, a variety of
issues may arise, which may result in litigation, environmental compliance and
other contingent obligations. In developing our contingency accruals
we consider both the likelihood of a loss or incurrence of a liability as well
as our ability to reasonably estimate the amount of exposure. We
record contingency accruals when a liability is probable and the amount can be
reasonably estimated. We periodically evaluate available information
to assess whether contingency accruals should be adjusted. Our
evaluation includes an assessment of legal interpretations, judicial
proceedings, recent case law and specific changes or developments regarding
known claims. We could be required to record additional expenses in
future periods if our initial estimates were too low, or reverse part of the
charges that we recorded initially if our estimates were too
high. Additionally, litigation costs incurred in connection with a
contingency are expensed as incurred.
Severance, Impairment and Other
Associated Costs. We record severance, tangible asset
impairments and other restructuring charges, such as lease terminations, in
response to declines in demand that lead to excess capacity, changing technology
and other factors. These costs, which we refer to as restructuring
costs, are expensed during the period in which we determine that we will incur
those costs, and all of the requirements for accrual are met in accordance with
the applicable accounting guidance. Restructuring costs are recorded
based upon our best estimates at the time the action is
initiated. Our actual expenditures for the restructuring activities
may differ from the initially recorded costs. If this occurs, we
could be required either to record additional expenses in future periods if our
initial estimates were too low, or reverse part of the initial charges if our
initial estimates were too high. In the case of acquisition-related
restructuring costs, we would recognize an acquired liability for costs we are
obligated to incur in accordance with the acquisition method as defined in the
applicable accounting guidance. Additionally, the cash flow impact of
an activity may not be recognized in the same period the expense is
incurred.
Recently
Adopted Accounting Pronouncements
In June
2009, FASB established the ASC as the authoritative source of U.S. Generally
Accepted Accounting Principles (“GAAP”). This pronouncement does not change
current GAAP, but is intended to simplify user research by providing all FASB
literature in a topical manner and in a single set of rules. All existing
accounting standard documents are superseded and all other accounting literature
not included in the ASC is considered non-authoritative. These provisions were
effective for fiscal years and interim periods ending after September 15, 2009.
We adopted this statement as of September 15, 2009, and we have revised our
disclosures by eliminating all references to pre-codification standards as
required by ASC 105.
In
January, 2010, FASB issued an Accounting Standards Update (“ASU”) to clarify the
change in ownership guidance and to expand the required disclosures for the
deconsolidation of a subsidiary. The update was effective beginning
in the period that an entity adopted these provisions. We previously
adopted this guidance as of December 27, 2008 and the update had no impact on
our financial statements.
In August
2009, FASB issued an ASU to reduce potential ambiguity in financial reporting
when measuring the fair value of liabilities, specifically in circumstances
where a quoted a price in an active market for a similar liability is not
available. The guidance provided in this ASU is effective immediately
and the adoption had no impact on our financial statements.
In June
2009, FASB issued guidance on an ASC which requires reporting entities to
evaluate former Qualified Special Purpose Entities (“QSPE”) for consolidation,
changing the approach to determine a Variable Interest Entity’s (“VIE”) primary
beneficiary from a quantitative to a qualitative assessment and increasing the
frequency of reassessments for determining whether a company is the primary
beneficiary of a VIE. This guidance also clarifies the
characteristics that identify a VIE. These provisions are effective
for financial statements issued for fiscal years and interim periods ending
after November 15, 2009. Adoption of these provisions did not have a
material impact on our financial statements.
In May
2009, FASB issued an ASC which establishes general standards of accounting for,
and disclosures of, events that occur after the balance sheet date but before
financial statements are issued or are available to be issued. This
ASC was effective for interim or fiscal periods ending after June 15,
2009. In December 2009, FASB amended this ASC to not require
disclosure of the dates at which subsequent events were evaluated unless the
filing is for restated financial statements. We have adopted these
provisions as of December 25, 2009. See Note 20 regarding our
evaluation of subsequent events.
In April
2009, FASB issued an ASC which provides additional guidance on estimating fair
value when the volume and level of activity for an asset or liability has
significantly decreased in relation to the normal market activity for the asset
or liability. Also, this ASC provides guidance on circumstances that
may indicate that a transaction is not orderly. The guidance under this ASC was
effective for interim and annual periods ending after June 15,
2009. Adoption of these provisions did not have a material
impact on our financial statements.
In
December 2008, FASB issued guidance on an ASC which provides guidance on an
employer’s disclosures about plan assets of a defined benefit pension plan or
other postretirement plans. Specifically, these provisions address
concentrations of risk in pension and postretirement plans, and are effective
for financial statements issued for fiscal years and interim periods ending
after December 15, 2009. We have adopted these provisions and have expanded
our disclosures as required. See Note 9 regarding adoption of these
provisions.
In
November 2008, FASB issued guidance on an ASC which clarifies the accounting for
certain transactions and impairment considerations involving equity method
investments. We adopted these provisions as of December 27, 2008 and
this adoption had no impact on our financial statements.
In
October 2008, FASB issued guidance on an ASC which demonstrates how the fair
value of a financial asset is determined when the market for that financial
asset is inactive. These provisions were effective upon issuance, including
prior periods for which financial statements had not been issued. We adopted
these provisions as of December 27, 2008 and this adoption had no impact on our
financial statements.
In June
2008, FASB issued guidance on an ASC which states that unvested share-based
payment awards that contain non-forfeitable rights to dividends or dividend
equivalents are required to be treated as participating securities and should be
included in the two-class method of computing earnings per share. Adoption of
these provisions is retrospective, therefore, all previously reported earnings
per share data is restated to conform with the requirements of this
pronouncement. We adopted these provisions as of December 27, 2008 and
calculated basic and diluted earnings per share under both the treasury stock
method and the two-class method. For the years ended December 25,
2009,
December
26, 2008 and December 28, 2007, there were no significant differences in
the per share amounts calculated under the two methods, therefore, we have not
presented the reconciliation of earnings per share under the two class
method. See Note 13 regarding adoption of this guidance.
In April
2008, FASB issued guidance on an ASC which amends the factors an entity should
consider in developing renewal or extension assumptions used in determining the
useful life of recognized intangible assets. These provisions apply
prospectively to intangible assets that are acquired individually or with a
group of other assets in business combinations and asset
acquisitions. We adopted these provisions as of December 27, 2008 and
the adoption had no impact on our financial statements.
In March
2008, FASB issued guidance on an ASC which applies to the disclosures of all
derivative instruments and hedged items. These provisions amend and expand
previous disclosure requirements, requiring qualitative disclosures about
objectives and strategies for using derivatives, quantitative disclosures about
fair value amounts and gains and losses on derivative instruments, and
disclosures about the credit risk related contingent features in derivative
agreements. We adopted these provisions as of December 27, 2008 and
have expanded our disclosures as required. See Note 16 regarding our
adoption of this guidance.
In
December 2007, FASB issued guidance on an ASC which changed the accounting and
reporting for minority interests, which were recharacterized as non-controlling
interests and classified as a component of equity. In addition,
companies are required to report a net income (loss) measure that includes the
amounts attributable to such non-controlling interests. We adopted these
provisions as of December 27, 2008 and they were applied prospectively to all
non-controlling interests. However, the presentation and disclosure requirements
of these provisions were applied retrospectively for all periods
presented.
In
December 2007, FASB issued guidance on an ASC which changed the accounting for
business combinations in a number of areas including the treatment of contingent
consideration, contingencies, acquisition costs, in-process research and
development costs and restructuring costs. In addition, these
provisions change the method of measurement for deferred tax asset valuation
allowances and acquired income tax uncertainties in a business
combination. We adopted these provisions as of December 27, 2008 and
the adoption had no impact on our financial statements.
New
Accounting Pronouncements
In
January 2010, FASB issued an ASU which requires additional disclosures related
to transfers between levels in the hierarchy of fair value
measurement. This ASU is effective for interim and annual reporting
periods beginning after December 15, 2009. We are currently
evaluating the effect that this ASU may have on our financial
statements.
In
October 2009, the FASB issued an ASU to address the accounting for
multiple-deliverable sales arrangements. The update provides guidance
to enable vendors to account for products or services (deliverables) separately,
rather than as a combined unit. This ASU also expands the required
disclosures related to a vendor’s multiple-deliverable revenue
arrangements. This guidance will be effective prospectively for
revenue arrangements entered into or materially modified in fiscal years
beginning on or after June 15, 2010. We are currently evaluating the
effect that this ASU may have on our financial statements.
Results
of Operations
Year
ended December 25, 2009 compared to the year ended December 26,
2008
The table
below shows our results of continuing operations and the absolute and percentage
change in those results from period to period (in thousands):
|
Change
|
Change
|
Results
as %
of
net sales
|
||||||||||||||||||||||
|
2009
|
2008
|
$
|
%
|
2009
|
2008
|
|||||||||||||||||||
|
Net
sales
|
$ | 398,803 | $ | 626,270 | $ | (227,467 | ) | (36.3 | )% | 100.0 | % | 100.0 | % | |||||||||||
|
Cost
of sales
|
298,035 | 477,763 | 179,728 | 37.6 | (74.7 | ) | (76.3 | ) | ||||||||||||||||
|
Gross
profit
|
100,768 | 148,507 | (47,739 | ) | (32.1 | ) | 25.3 | 23.7 | ||||||||||||||||
|
Selling,
general and administrative expenses
|
89,698 | 123,203 | 33,505 | 27.2 | (22.5 | ) | (19.7 | ) | ||||||||||||||||
|
Severance,
impairment and other associated costs
|
82,867 | 153,294 | 70,427 | 45.9 | (20.8 | ) | (24.5 | ) | ||||||||||||||||
|
Operating
loss
|
(71,797 | ) | (127,990 | ) | 56,193 | 43.9 | (18.0 | ) | (20.5 | ) | ||||||||||||||
|
Interest
expense, net
|
(2,967 | ) | (2,623 | ) | (344 | ) | (13.1 | ) | (0.7 | ) | (0.4 | ) | ||||||||||||
|
Other
income, net
|
3,784 | 4,072 | (288 | ) | (7.1 | ) | 0.9 | 0.7 | ||||||||||||||||
|
Loss
from continuing operations before income taxes
|
(70,980 | ) | (126,541 | ) | 55,561 | 43.9 | (17.8 | ) | (20.2 | ) | ||||||||||||||
|
Income
tax expense (benefit)
|
1,879 | (2,998 | ) | (4,877 | ) | (162.7 | ) | (0.5 | ) | 0.5 | ||||||||||||||
|
Net
loss from continuing operations
|
$ | (72,859 | ) | $ | (123,553 | ) | $ | 50,694 | 41.0 | % | (18.3 | )% | (19.7 | )% | ||||||||||
Net Sales. Our consolidated
net sales decreased by 36.3% as a result of the decline in customer demand
resulting from the adverse developments in the global economy. The
overall demand reduction realized during the year ended December 25, 2009 was
incurred generally across all of our wireless, network communications and power
products throughout the year. However, demand began to improve in the
second half of 2009 in most markets. Also, a stronger U.S. dollar
relative to the euro experienced during the year ended December 25, 2009 as
compared to the same period of 2008 resulted in lower U.S. dollar reported
sales.
Cost of
Sales. As a
result of lower sales, our cost of sales decreased. Our consolidated
gross margin for the year ended December 25, 2009 was 25.3% compared to 23.7% for the year ended December 26,
2008. The primary factors that caused our consolidated gross margin
increase were the positive effects of cost-reduction and price increasing
activities initiated in late 2008 as a response to the adverse conditions in the
global economy. Partially offsetting these activities was a decline
in operating leverage as a result of decreased sales of our wireless, network
communications and power products during 2009.
Selling, General and Administrative
Expenses. Total selling, general and administrative expenses
decreased primarily due to our overall emphasis on cost reducing measures
initiated at the end of 2008 in response to the overall economic
downturn. Expenses were reduced in virtually all administrative
areas. Also, intangible amortization expense declined compared to the
2008 period as a result of the impairment charges on finite-lived intangibles
which were recorded in the fourth quarter of 2008.
Research,
development and engineering expenses (“RD&E”) are included in selling,
general and administrative expenses. For the year ended December 25, 2009 and
December 26, 2008, respectively, RD&E was as follows (in thousands):
|
2009
|
2008
|
|||||||
|
RD&E
|
$ | 28,174 | $ | 42,559 | ||||
|
Percentage
of sales
|
7.1 | % | 6.8 | % | ||||
The
decrease in research, development and engineering expenses is due to our cost
reducing initiative beginning at the end of in 2008. However, as a
percentage of sales, 2009 spending was at a higher level as compared to the 2008
period. We believe that future sales in the electronic components
markets will be driven by next-generation products. As a result, design and
development activities with our OEM customers continue at an aggressive pace
that is consistent with market activity.
Severance, Impairment and Other
Associated Costs. During the year ended December 25, 2009, we
determined that approximately $71.0 million of our wireless group’s goodwill was
impaired. Refer to Note 5 for further
details. Additionally, we incurred a charge of $11.9 million for a
number of cost reduction actions. These charges include severance and
related payments of $3.0 million and fixed asset impairments of $8.9
million. The impaired assets include production lines associated with
products that have no expected future demand and two real estate properties
which were disposed.
During
2008, we determined that $310.4 million of goodwill and other intangibles were
impaired, including $170.3 million of goodwill and identifiable intangibles of a
discontinued operation. Additionally, our continuing operations
incurred a charge of $13.2 million for a number of cost reduction
actions. These charges include severance and related payments and
other associated costs of $5.5 million resulting from the termination of
manufacturing and support personnel at our operations primarily in Asia, Europe
and North America and $4.1 million of other costs primarily resulting from the
transfer of manufacturing operations from Europe and North Africa to
Asia. We also recorded fixed asset impairments of $3.6
million.
Interest. Net
interest expense increased primarily as a result of the accelerated amortization
of capitalized loan fees resulting from credit facility amendments effective in
2009. Interest on our outstanding loans and amortization of
capitalized loan fees was allocated between continuing and discontinued
operations on a pro-rata basis for the year ended December 25, 2009 and the
comparable period in 2008, based upon the actual and expected debt to be repaid
as a result of the dispositions compared to total debt
outstanding. Also, interest income in the year ended December 25,
2009 was significantly lower than the comparable period in 2008 due to lower
average cash balances during 2009.
Other. The
decrease in other income is primarily attributable to lower net foreign exchange
gains realized during the year ended December 25, 2009 of $3.5 million, as
compared to net foreign exchange gains of $4.1 million incurred in the
comparable period of 2008. The primary reason for the decrease in
foreign exchange gains during the year ended December 25, 2009 was due to the
effects of a larger strengthening of the U.S. dollar to euro exchange rate
during 2008 as compared to 2009.
Income Taxes. The
effective income tax rate for the year ended December 25, 2009 was (2.6%)
compared to 2.4% for the year ended December 26, 2008. The 2009
effective tax rate was affected by the $71.0 million of goodwill impairment
charges recorded in 2009 which were non-deductible. In addition, the
2009 tax rate was negatively impacted by certain losses and restructuring
charges incurred by entities in high-tax jurisdictions where the future tax
benefit is unlikely to be realized.
Discontinued
Operations. Net loss from discontinued operations was
approximately ($120.0) million during the year ended December 25, 2009 as
compared to approximately ($151.5) million in the year ended December 26, 2008.
Results for the 2009 period include charges of approximately $109.3 to write
down our net investment in these operations to the net proceeds received or
expected to be received, charges for the curtailment and settlement of certain
retirement plan benefits and allocated interest expense based upon the debt
retired or expected to be retired. Similar interest charges in
2008 were approximately $9.7 million. The 2008 period also reflects a
charge for the impairment of goodwill and identifiable intangible assets of
Medtech of approximately $170.3 million. A summary of our net loss
from each of our discontinued operations for the years ended December 25, 2009
and December 26, 2008 is as follows (in thousands):
|
2009
|
2008
|
|||||||
|
Electrical
|
$ | (61,926 | ) | $ | 9,063 | |||
|
Medtech
|
(48,399 | ) | (159,277 | ) | ||||
|
MEMS
|
(9,653 | ) | (1,253 | ) | ||||
|
Total
|
$ | (119,978 | ) | $ | (151,467 | ) | ||
Year
ended December 26, 2008 compared to the year ended December 28,
2007
The table
below shows our results of our continuing operations and the absolute and
percentage change in those results from period to period (in thousands):
|
Change
|
Change
|
Results
as %
of
net sales
|
||||||||||||||||||||||
|
2008
|
2007
|
$
|
%
|
2008
|
2007
|
|||||||||||||||||||
|
Net
sales
|
$ | 626,270 | $ | 671,569 | $ | (45,299 | ) | (6.7 | )% | 100.0 | % | 100.0 | % | |||||||||||
|
Cost
of sales
|
477,763 | 496,471 | 18,708 | 3.8 | (76.3 | ) | (73.9 | ) | ||||||||||||||||
|
Gross
profit
|
148,507 | 175,098 | (26,591 | ) | (15.2 | ) | 23.7 | 26.1 | ||||||||||||||||
|
Selling,
general and administrative Expenses
|
123,203 | 112,430 | (10,773 | ) | ( 9.6 | ) | (19.7 | ) | (16.7 | ) | ||||||||||||||
|
Severance,
impairment and other associated costs
|
153,294 | 17,650 | (135,644 | ) | (768.5 | ) | (24.5 | ) | (2.6 | ) | ||||||||||||||
|
Operating
(loss) profit
|
(127,990 | ) | 45,018 | (173,088 | ) | (384.3 | ) | (20.5 | ) | 6.8 | ||||||||||||||
|
Interest
expense, net
|
(2,623 | ) | (427 | ) | (2,196 | ) | (514.3 | ) | (0.4 | ) | (0.1 | ) | ||||||||||||
|
Other
income (expense), net
|
4,072 | (1,077 | ) | 5,149 | 478.1 | 0.7 | (0.2 | ) | ||||||||||||||||
|
(Loss)
earnings from continuing operations before income taxes
|
(126,541 | ) | 43,514 | (170,055 | ) | (390.8 | ) | (20.2 | ) | 6.5 | ||||||||||||||
|
Income
tax (benefit) expense
|
(2,988 | ) | 1,341 | 4,329 | 322.8 | 0.5 | (0.2 | ) | ||||||||||||||||
|
Net
(loss) earnings from continuing operations
|
$ | (123,553 | ) | $ | 42,173 | $ | (165,726 | ) | (393.0 | )% | (19.7 | )% | 6.3 | % | ||||||||||
Net Sales. The decrease in
consolidated net sales in the year ended December 26, 2008 compared to the year
ended December 28, 2007 was primarily attributable to a decline in demand for
certain wireless, network and power products, particularly in the second half of
2008 coinciding with the initial decline in the global economy. Also, 2008 sales
declined due to a temporary capacity constraint related to employee retention
difficulties surrounding the Chinese New Year and the temporary operations
stoppage in Mianyang, China caused by an earthquake. Partially
offsetting the sales decline were additional sales from the inclusion of ten
months of the mobile communications group acquired in the Sonion acquisition and
higher euro-to-U.S. dollar exchange rates incurred in 2008 as compared to
2007.
Cost of Sales. As
a result of lower sales, our cost of sales decreased. Our
consolidated gross margin for the year ended December 26, 2008 was 23.7%
compared to 26.1% for the year ended December 28 2007. The primary
factors that caused the reduction in our consolidated gross margin decrease were
a decline in operating leverage as a result of reduced sales of our wireless
network communication and power products, coupled with increased training and
other personnel costs incurred related to the capacity constraints caused by the
Mianyang earthquake.
Selling, General and Administrative
Expenses. Total selling, general and administrative expenses
increased primarily due to additional expenses from the inclusion of ten months
of the mobile communications group acquired in the Sonion
acquisition. Also, the higher euro-to-U.S. dollar exchange rate
incurred in 2008 as compared to 2007 increased selling, general and
administrative expenses.
Research,
development and engineering expenses are included in selling, general and
administrative expenses. For the year ended December 26, 2008 and
December 28, 2007, respectively, RD&E was as follows (in thousands):
|
2008
|
2007
|
|||||||
|
RD&E
|
$ | 42,559 | $ | 35,137 | ||||
|
Percentage
of sales
|
6.8 | % | 5.2 | |||||
The
increase in research, development and engineering expenses was primarily due to
the inclusion of ten months of the mobile communications group acquired in the
Sonion acquisition. Also, the higher euro-to-U.S. dollar exchange
rate incurred in 2008 as compared to 2007 increased selling, general and
administrative expenses.
Severance, Impairment and Other
Associated Costs. During 2008, we determined that $310.4
million of goodwill and other intangibles were impaired, including $170.3
million of goodwill and identifiable intangibles of a discontinued
operation. Additionally, we incurred a charge of $13.2 million to our
continuing operations for a number of cost reduction actions. These
charges include severance and related payments and other associated costs of
$5.5 million resulting from the termination of manufacturing and support
personnel at our operations primarily in Asia, Europe and North America and $4.1
million of other costs primarily resulting from the transfer of manufacturing
operations from Europe and North Africa to Asia. Additionally, we
recorded fixed asset impairments of $3.6 million.
During
2007, we incurred a charge of $17.6 million for cost reduction
actions. These include severance and related payments of $10.6
million resulting from the termination of manufacturing and support personnel in
Asia, Europe and North America, $5.5 million for the write down of certain fixed
assets to their disposal values and, additionally, we incurred approximately
$1.5 million of other plant closure, relocation and similar costs associated
with these actions.
Interest. Net
interest expense increased primarily as a result of higher average debt balances
in 2008 as compared to 2007. Interest expense on our outstanding
loans was allocated between continuing and discontinued operations on a pro-rata
basis for the year ended December 26, 2008 and the comparable period in 2007,
based upon the actual and expected debt to be repaid with the proceeds of the
divestitures compared to total debt outstanding. In addition, we
incurred higher amortization of capitalized loan fees resulting from our credit
facility amendment. Interest income in the year ended December
26, 2008 was significantly lower than the comparable period in 2007 due to lower
average cash balances during 2008.
Other. The
increase in other income is primarily attributable to higher net foreign
exchange gains incurred during the year ended December 26, 2008 of $4.1 million,
as compared to foreign exchange losses of $1.3 million during the year ended
December 28, 2007. The primary reason for the increase in foreign
exchange gains was the overall strengthening of the euro as compared to the U.S.
dollar in 2008 as compared to 2007.
Income Taxes. The
effective income tax rate for the year ended December 26, 2008 was 2.4% compared
to 3.1% for the year ended December 28, 2007. The decrease in the effective tax
rate is primarily a result of the non-deductibility of the impairment of
goodwill and certain identifiable intangible assets in 2008, thus reducing the
tax benefits on the overall loss.
Discontinued
Operations. Net loss from discontinued operations was
approximately ($151.5) million during the year ended December 26, 2008 as
compared to net earnings of approximately $19.7 million in the year ended
December 28, 2007. Results in the 2008 period include charges of
approximately $9.7 million resulting from allocated interest expense based upon
the debt retired or expected to be retired and a charge of approximately $170.3
million resulting from the impairment of goodwill and identifiable intangible
assets at Medtech. A summary of our net (loss) earnings from
each of our discontinued operations for the years ended December 26, 2008 and
December 28, 2007 is as follows (in thousands):
|
2008
|
2007
|
|||||||
|
Electrical
|
$ | 9,063 | $ | 19,740 | ||||
|
Medtech
|
(159,277 | ) | -- | |||||
|
MEMS
|
(1,253 | ) | -- | |||||
|
Total
|
$ | (151,467 | ) | $ | 19,740 | |||
Business
Outlook
The
adverse developments in the financial markets and the dramatic contractions in
the global economy that began in 2008 have increased our exposure to liquidity
and credit risks. We are exposed to market risk resulting from changes in the
prices of commodities, such as non-precious metals and certain
fuels. To the extent we cannot transfer these costs to our customers,
fluctuations in commodity prices will impact our gross margin and available
cash. We are also exposed to financial risk resulting from changes in
interest and foreign currency rates, as well as the credit risk of our
customers.
Although
we expect net sales to continue to improve, customer and product mix will impact
our gross margin, net income, EBITDA and cash available to repay our
debt. For example, while handset production generally has begun to
recover from early 2009 levels, a significant portion of handset antenna
business currently served by our wireless group has begun a transition away from
OEM driven hardware development and manufacturing, a transition led by a
large
OEM customer seeking to purchase full handset modules from one of several CEMs
who can each provide full handset modules. Accordingly, our wireless
group is adjusting its marketing and engineering efforts to significantly
increase its support for those CEMs as well as for OEMs which have not embraced
this sourcing change and for the sources which will provide full handsets to the
OEM principally driving this change. Based on the expected revenues
and cash flows of our wireless group, an impairment of goodwill or identifiable
intangibles is not necessary at this time. Our network group is
experiencing a surge of demand which began in the second half of
2009. Our ability to meet this demand has been constrained by
capacity issues in the PRC resulting from tight labor
markets. However, we continue to vigorously address this issue by
increasing our capacity through varying means, including the use of temporary
staff.
Considering
the issues mentioned above, as well as other risks inherent in our business and
taking into account our significant reduction of debt as a result of
divestitures, we believe we have ample liquidity to fund our business
requirements. This belief is based on our current balances of cash
and cash equivalents, our history of positive cash flows from continuing
operations, including $37.3 million for the year ended December 25, 2009, and
access to our multi-currency credit facility. Our credit agreement
requires that we maintain certain financial covenants which are measured at the
end of each fiscal quarter. The primary covenants are senior secured
debt and fixed charges compared to our rolling four-quarter EBITDA as defined by
the amended and restated credit agreement. If we are not able to
maintain the EBITDA level required relative to our senior secured debt or fixed
charges, we would default on our covenants. We have substantially
decreased our borrowings from the credit facility through the issuance of $50.0
million of convertible senior notes in December 2009, which are not subject to
covenant calculations. Accordingly, we believe that we will continue
generating sufficient EBITDA and free cash flows in the foreseeable future to
remain compliant with our covenants.
Liquidity
and Capital Resources
We have
presented all assets and liabilities of Electrical as current due to their
classification as held for sale. Such classification resulted in
approximately $7.9 million of assets and $0.3 million of liabilities to be
classified as current which would otherwise be considered
long-term.
Including
assets and liabilities held for sale, working capital as of December 25, 2009
was $121.3 million, compared to $175.9 million as of December 26,
2008. The decrease of $54.6 million was primarily due to reductions
in trade receivables, prepaid expenses and inventory, partially offset by
decreases in accounts payable, accrued expenses and other current
liabilities. Also, our working capital decrease was partially offset
by the elimination of current installments of long-term debt which were
associated with our former senior secured term loan and an unsecured term loan
at Electrical. Cash and cash equivalents, which are included in
working capital, decreased from $41.4 million as of December 26, 2008
to $39.7 million as of December 25, 2009.
We
present our statement of cash flows using the indirect method. Our
management has found that investors and analysts typically refer to changes in
accounts receivable, inventory and other components of working capital when
analyzing operating cash flows. Also, changes in working capital are more
directly related to the way we manage our business and cash flow than are items
such as cash receipts from the sale of goods, as would appear using the direct
method. Cash flows from discontinued operations have been separated
from continuing operations and are disclosed in the aggregate by each cash flow
activity.
Net cash
provided by operating activities was $37.3 million for the year ended December
25, 2009 as compared to $43.3 million in the comparable period of 2008, a
decrease of $6.0 million. The decrease from 2008 to 2009 is primarily a result
of decreased reductions of net working capital. Despite improvements
in demand in late 2009, our management team has continued to reduce inventory
and has managed to improve the aging of our accounts receivables throughout
2009.
Capital
expenditures were $2.2 million during the year ended December 25, 2009 and $11.6
million in the comparable period of 2008. The decrease of $9.4
million in the 2009 period was due primarily to a concentrated effort in 2009 to
limit new investment to only key programs. Additionally, spending in
2008 included the completion of our production facility in Mianyang,
China. We make capital expenditures to expand production capacity and
to improve our operating efficiency. We plan to continue making such
expenditures in the future as and when necessary.
We used
$6.7 million for dividend payments during the year ended December 25,
2009. On November 2, 2009 we announced a quarterly cash dividend of
$0.025 per common share, payable on January 15, 2010 to shareholders of record
on January 1, 2010. This quarterly dividend resulted in a cash
payment to shareholders of approximately $1.0 million in the first quarter of
2010. We expect cash payments for dividends to be approximately $4.1
million in 2010.
During
2009, we contributed approximately $6.1 million to our principal defined benefit
plans. We expect to contribute approximately $4.5 million in 2010
after the disposition of Electrical is completed.
On
December 22, 2009, we issued $50.0 million in convertible senior notes, which
will mature on December 15, 2014. The notes bear a coupon rate of
7.0% per annum, which is payable semi-annually in arrears on June 15 and
December 15 of each year, beginning with our June 15, 2010 payment. We expect to
pay $3.5 million of interest on these notes in 2010. We incurred debt issuance
costs of approximately $3.0 million in 2009, which have been deferred and will
be amortized over the life of the notes.
The
convertible notes are senior unsecured obligations and are equal in right of
payment with our senior unsecured debt, but senior to any subordinated
debt. Further, these convertible notes rank junior to any of our
secured indebtedness to the extent of the assets that secure such indebtedness,
and are structurally subordinated in right of payment to all indebtedness and
other liabilities and commitments of our subsidiaries.
Holders
of our convertible notes may convert their shares to common stock at their
option any day prior to the close of business on December 14,
2014. Upon conversion, for each $1,000 in principal amount
outstanding, we will deliver a number of shares of our common stock equal to the
conversion rate. The initial conversion rate for the notes is approximately
156.64 shares of common stock per $1,000 in principal amount of
notes. The initial conversion price is approximately $6.38 per share
of common stock. The conversion rate is subject to change upon the
occurrence of specified normal and customary events as defined by the indenture,
such as stock splits or stock dividends, but will not be adjusted for accrued
interest.
Subject
to certain fundamental change exceptions specified in the indenture, which
generally pertain to circumstances in which the majority of our common stock is
obtained, exchanged or no longer available for trading, holders may require us
to repurchase all or part of their notes for cash, at a price equal to 100% of
the principal amount of the notes being repurchased plus any accrued and unpaid
interest up to, but excluding, the relevant repurchase
date. However, we are not permitted to redeem the notes prior
to maturity.
On
December 2, 2009, we finalized an amendment to our credit agreement that
permitted us to issue senior convertible notes and restated certain other
provisions of our previous agreement. The amended and restated credit agreement
provides for a $100.0 million senior revolving credit facility and provides for
borrowing in U.S. dollars, euros and yen, with a multicurrency facility
providing for the issuance of letters of credit in an aggregate amount not to
exceed the U.S. dollar equivalent of $10.0 million.
The
amended and restated credit agreement does not permit us to increase the total
commitment without the consent of our lenders. Therefore, the total amount
outstanding under the revolving credit facility may not exceed $100.0
million. The amount outstanding under our credit facility as of
December 25, 2009 was $81.0 million.
Outstanding
borrowings are subject to leverage and fixed charges covenants, which are
computed on a rolling four-quarter basis as of the most recent
quarter-end. Each covenant requires the calculation of EBITDA
according to a definition prescribed by the amended and restated credit
agreement.
The
leverage covenant requires our total debt outstanding, excluding the senior
convertible notes, to not exceed the following multiples of our prior four
quarters’ EBITDA:
|
Applicable
date
(Period
or quarter ended)
|
EBITDA
Multiple
|
|
December
2009
|
3.50x
|
|
March
2010
|
3.00x
|
|
Thereafter
|
2.75x
|
The fixed
charges covenant requires that our EBITDA exceed total fixed charges, as defined
by the amended credit agreement, by the following multiples:
|
Applicable
date
(Period
or quarter ended)
|
EBITDA
Multiple
|
|
December
2009
|
1.25x
|
|
Thereafter
|
1.50x
|
We were
in compliance with the covenants required by the amended and restated credit
facility as of December 25, 2009.
The fee
on the unborrowed portion of the commitment ranges from 0.225% to 0.450% of the
total commitment, depending on the following debt-to-EBITDA ratios:
|
Total debt-to-EBITDA ratio
|
Commitment fee percentage
|
|||
|
Less
than 0.75
|
0.225 | % | ||
|
Less
than 1.50
|
0.250 | % | ||
|
Less
than 2.25
|
0.300 | % | ||
|
Less
than 2.75
|
0.350 | % | ||
|
Less
than 3.25
|
0.375 | % | ||
|
Less
than 3.75
|
0.400 | % | ||
|
Greater
than 3.75
|
0.450 | % | ||
The
interest rate for each currency’s borrowing is a combination of the base rate
for that currency plus a credit margin spread.
The
credit margin spread is the same for each currency and ranges from 1.25% to
3.25%, depending on the following debt-to-EBITDA ratios:
|
Total debt-to-EBITDA
ratio
|
Credit margin spread
|
|||
|
Less
than 0.75
|
1.25 | % | ||
|
Less
than 1.50
|
1.50 | % | ||
|
Less
than 2.25
|
2.00 | % | ||
|
Less
than 2.75
|
2.50 | % | ||
|
Less
than 3.25
|
2.75 | % | ||
|
Less
than 3.75
|
3.00 | % | ||
|
Greater
than 3.75
|
3.25 | % | ||
The
weighted-average interest rate, including the credit margin spread, was
approximately 3.5% as of December 25, 2009.
The
amended and restated credit agreement limits our annual cash dividends to $5.0
million. Also, there are covenants specifying capital expenditure
limitations and other customary and normal provisions.
Multiple
subsidiaries, both domestic and international, have guaranteed the obligations
incurred under the amended and restated credit agreement. In
addition, certain domestic and international subsidiaries have pledged the
shares of certain subsidiaries, as well as selected accounts receivable,
inventory, machinery and equipment and other assets as collateral. If we default
on our obligations, our lenders may take possession of the collateral and may
license, sell or otherwise dispose of those related assets in order to satisfy
our obligations.
During
2009, we incurred costs of approximately $5.1 million related to current year
amendments to our credit facility, which have been deferred and will be
amortized over its remaining term. In addition, we recorded a charge of
approximately $6.3 million to impair previously capitalized fees and costs that
related to our February 28, 2008 credit agreement and its related
amendments. Of the $6.3 million of charges, $4.7 million was
allocated to discontinued operations on a pro-rata basis for the year ended
December 25, 2009, based upon the debt retired or expected to be retired
from the dispositions compared to our total debt outstanding. Similar
fees of our continuing operations are classified as interest expense on our
Consolidated Statement of Operations.
We had
four standby letters of credit outstanding at December 25, 2009 in the aggregate
amount of $1.9 million securing transactions entered into in the ordinary course
of business.
Electrical,
the segment we are in the process of divesting, uses silver and other precious
metals in manufacturing some of its electrical contacts, contact materials and
contact subassemblies. Historically, Electrical has leased or held these
materials through consignment-type arrangements with its suppliers. Leasing and
consignment costs have typically been lower than the costs to borrow funds to
purchase the metals and, more importantly, these arrangements eliminate the
effects of fluctuations in the market price of owned precious metal and enable
Electrical to minimize its inventories. Electrical’s terms of sale generally
allow it to charge customers for precious metal content based on the market
value of precious metal on the day after shipment to the
customer. Suppliers invoice Electrical based on the market value of
the precious metal on the day after shipment to the customer as
well. Thus far, Electrical has been successful in managing the costs
associated with its precious metals. While limited amounts are purchased for use
in production, the majority of precious metal inventory continues to be leased
or held on consignment. If leasing or consignment costs increase significantly
in a short period of time, and Electrical is unable to recover these increased
costs through higher sales prices, a negative impact on Electrical’s results of
operations and liquidity may result. Leasing
and
consignment fee increases are caused primarily by increases in interest rates or
volatility in the price of the consigned material. Similarly, if
Electrical is unable to maintain the necessary bank commitments and credit
limits necessary for its precious metal leasing and consignment facilities, or
obtain alternative facilities on a timely basis, Electrical may be required to
finance the direct purchase of precious metals, reduce its production volume or
take other actions that could negatively impact its financial condition and
results of operations.
Electrical
had commercial commitments outstanding at December 25, 2009 of approximately
$113.4 million due under precious metal consignment-type leases. This
represents a decrease of $9.4 million from the $122.8 million outstanding as of
December 26, 2008 and is attributable to significant volume decreases offset by
higher silver prices during the year ended December 25, 2009.
On
January 4, 2010, we completed the sale of Electrical’s North American business
for an amount immaterial to our Consolidated Financial
Statements. Electrical’s North American business has manufacturing
facilities in Export, Pennsylvania, Luquillo, Puerto Rico and Mexico City,
Mexico. The rivet production operations located in Mexico City were
not part of the sale agreement, as these operations are intended to be sold as
part of Electrical’s operations in Europe and Asia. We applied the
net proceeds from the sale to reduce the debt outstanding under our revolving
credit facility. In conjunction with the disposition of the North
American operations of Electrical on January 4, 2010, our consignment-type
leases were reduced by $13.9 million. We expect to further reduce
North America’s consignment-type leases by approximately $18.0 million by April
15, 2010.
The net
decrease in cash resulting from discontinued operations was $26.2 million for
the year ended December 25, 2009. Cash used in operating activities
was approximately $8.2 million which was primarily a result of the changes in
working capital and the net losses of these operations excluding depreciation,
amortization and impairment charges. Capital expenditures were $6.2 which are
included in investing activities. Also, Electrical made principle
payments of long-term debt of approximately $7.4 million which are included in
net cash used in financing activities. We do not expect these uses of cash to
recur and we also do not expect significant continuing cash flows from these
operations after their disposition.
Excluding
the impact of the North American business which was disposed in January 2010,
Electrical's remaining operations generate positive net cash flows which could
be used to pay down our debt or fund our ongoing operations. Further, we believe
the inclusion of Electrical in our calculations of covenant compliance and
available debt capacity would increase our borrowing capacity.
Material
changes in our contractual obligations during the year ended December 25, 2009
include the amendments to our credit facility during 2009, the incremental
benefits recognized on the Technitrol, Inc. Supplemental Retirement Plan, the
issuance of our convertible senior notes and the elimination of obligations
related to our former Medtech business.
As of
December 25, 2009, future payments related to contractual obligations were as
follows (in
thousands):
|
Amounts
expected to be paid by period
|
||||||||||||||||||||
|
Total(4)
|
Less than 1 year
|
1 to 3 years
|
3 to 5 years
|
Thereafter
|
||||||||||||||||
|
Long-term
debt (1)
|
$ | 81,000 | $ | -- | $ | -- | $ | 81,000 | $ | -- | ||||||||||
|
Convertible
senior notes
|
$ | 50,000 | $ | -- | $ | -- | $ | 50,000 | $ | -- | ||||||||||
|
Estimated
interest payments (1)
|
$ | 26,387 | $ | 6,320 | $ | 12,640 | $ | 7,427 | $ | -- | ||||||||||
|
Operating
leases (2)
|
$ | 15,319 | $ | 5,645 | $ | 5,681 | $ | 1,691 | $ | 2,302 | ||||||||||
|
Retirement
plans (3)
|
$ | 33,536 | $ | 13,535 | $ | 3,836 | $ | 4,136 | $ | 12,029 | ||||||||||
|
|
(1)
|
Excludes
expected payments from a sale of Electrical that would result in a
reduction of debt and lower interest
payments.
|
|
|
(2)
|
Excludes
approximately $113.4 million due under precious metal consignment–type
leases and approximately $2.5 million due under operating leases at
Electrical.
|
|
|
(3)
|
Includes
an estimated cash settlement of the Technitrol, Inc. Supplemental
Retirement Plan which is contingent upon the sale of
Electrical.
|
|
|
(4)
|
Excludes
other obligations under employment contracts that are generally only
payable upon a change of control.
|
We have
excluded from the table above unrecognized tax benefits due to the uncertainty
of the amount and the period of payment. As of December 25, 2009, we
had unrecognized tax benefits of approximately $23.2 million. Refer
to Note 8 to the Consolidated Financial Statements.
We
believe that the combination of cash on hand, cash generated by operations and,
if necessary, borrowings under our amended credit agreement will be sufficient
to satisfy our operating cash requirements in the foreseeable future. In
addition, we may use internally generated funds or obtain additional borrowings
or additional equity offerings for acquisitions of suitable businesses or
assets.
We have
not experienced any significant liquidity restrictions in any country in which
we operate and none are foreseen. However, foreign exchange ceilings imposed by
local governments and the sometimes lengthy approval processes which foreign
governments require for international cash transfers may delay our internal cash
movements from time to time. We expect to reinvest this cash and earnings
outside of the United States, because we anticipate that a significant portion
of our opportunities for future growth will be abroad. In addition,
we expect to use a significant portion of the cash to service debt outside the
United States. Thus, we have not accrued U.S. income and foreign
withholding taxes on foreign earnings that have been indefinitely invested
abroad. If these earnings were brought back to the United States,
significant tax liabilities could be incurred in the United States as several
countries in which we operate have tax rates significantly lower than the U.S.
statutory rate.
All of
our retained earnings are free from legal or contractual restrictions as of
December 25, 2009, with the exception of approximately $30.2 million of retained
earnings primarily in the PRC, that are restricted in accordance with Section 58
of the PRC Foreign Investment Enterprises Law. The $30.2 million
includes approximately $5.7 million of retained earnings of a majority owned
subsidiary and approximately $1.9 million of a discontinued operation. The
amount restricted in accordance with the PRC Foreign Investment Enterprise Law
is applicable to all foreign investment enterprises doing business in the
PRC. The restriction applies to 10% of our net earnings in the PRC,
limited to 50% of the total capital invested in the PRC.
Item 7a Quantitative and Qualitative Disclosures about
Market Risk
Interest
Rate Risk
Our
financial instruments, including cash and cash equivalents and long-term debt
borrowed under our revolving credit facility, are exposed to changes in interest
rates in both the U.S. and abroad. We invest our excess cash in
short-term, investment-grade interest-bearing securities. We
generally limit our exposure to any one financial institution to the extent
practical. Our Board of Directors has adopted policies relating to these risks
and continually monitors compliance with these policies.
Our
revolving credit facility has variable interest rates. Accordingly,
interest expense may increase if we borrow and/or if the rates associated with
our borrowings move higher. In addition, we may pursue additional or
alternative financing. We may also use financial derivatives such as
interest rate swaps or other instruments in order to manage the risk associated
with changes in market interest rates. However, we have not used any
of these instruments to date.
The table
below presents principal amounts in U.S. dollars and related weighted average
interest rates by year of maturity for our debt obligations. The
column captioned “Approximate Fair Value” sets forth the carrying
value of our long-term debt as of December 25, 2009 after taking into
consideration the current interest rates of our amended credit
facility. As our convertible senior notes were issued three days
prior to our 2009 Consolidated Balance Sheet date, we consider their carrying
value to approximate their fair value (in thousands):
|
2010
|
2011
|
2012
|
2013
|
2014
|
Thereafter
|
Total
|
Approx.
Fair Value
|
|||||||||||||||||||||||||
|
Liabilities
|
||||||||||||||||||||||||||||||||
|
Convertible senior notes
|
||||||||||||||||||||||||||||||||
|
Fixed
rate:
|
||||||||||||||||||||||||||||||||
|
US
Dollar
|
-- | -- | -- | -- | $ | 50,000 | -- | $ | 50,000 | $ | 50,000 | |||||||||||||||||||||
|
Weighted
average interest rate
|
-- | -- | -- | -- | 7.00 | % | -- | |||||||||||||||||||||||||
|
Long-term debt
|
||||||||||||||||||||||||||||||||
|
Variable
rate (1):
|
||||||||||||||||||||||||||||||||
|
US
Dollar
|
-- | -- | -- | $ | 81,000 | -- | -- | $ | 81,000 | $ | 85,412 | |||||||||||||||||||||
|
Weighted
average interest rate
|
-- | -- | -- | 3.48 | % | -- | -- | |||||||||||||||||||||||||
|
|
(1)
|
The
weighted average interest rate reflects the applicable interest rate as of
December 25, 2009 and is subject to change in accordance with the terms of
our amended credit facility.
|
Foreign
Currency Risk
As of
December 25, 2009, we had a substantial amount of assets denominated in
currencies other than the U.S. dollar. We conduct business in various
foreign currencies, including those of emerging market countries in Asia as well
as European countries. We may utilize derivative financial
instruments, such as forward exchange contracts in connection with fair value
hedges, to manage foreign currency risks. Gains and losses related to
fair value hedges are recognized in income along with adjustments of carrying
amounts of the hedged items. Therefore, all of our forward exchange
contracts are marked-to-market, and unrealized gains and losses are included in
current period net income. These contracts guarantee a predetermined
rate of exchange at the time the contract is purchased. This allows
us to shift the majority of the risk of currency fluctuations from the date of
the contract to a third party for a fee. We believe there could be
two potential risks of holding these instruments. The first is that
the foreign currency being hedged could move in a direction which could create a
better economic outcome than if hedging had not taken place. The
second risk is that the counterparty to a currency hedge defaults on its
obligations. We reduce the risk of counterparty default by entering
into relatively short-term hedges with well capitalized and highly rated
banks. In determining the use of forward exchange contracts, we
consider the amount of sales and purchases made in local currencies, the type of
currency and the costs associated with the contracts.
In the
year ended December 25, 2009, we utilized forward contracts to sell forward euro
to receive Chinese Renminbi and to sell forward U.S. dollar to receive Danish
krone. These contracts were used to mitigate the risk of currency
fluctuations at our former Medtech operations in Poland and Denmark and our
current operations in the PRC. At December 25, 2009, we had seven
foreign exchange forward contracts outstanding to sell forward approximately 7.0
million euro, or approximately $10.1 million, to receive Chinese
renminbi. The fair value of these forward contracts was a liability
of $0.2 million as determined through use of Level 2 inputs. At
December 26, 2008, we had twelve foreign exchange forward contracts outstanding
to sell forward approximately $12.0 million U.S. dollars to receive Danish
krone, and eight foreign exchange forward contracts outstanding to sell forward
approximately 8.0 million euro, or approximately $11.3 million, to receive
Chinese renminbi. The fair value of these forward contracts was an
asset of $0.1 million as determined through use of Level 2 inputs.
The table
below provides information about our other non-derivative, non-U.S. dollar
denominated financial instruments and presents the information in equivalent
U.S. dollars (in
thousands):
|
2010
|
2011
|
2012
|
2013
|
2014
|
Thereafter
|
Total
|
Approx.
Fair Value
|
|||||||||||||||||||||||||
|
Assets
|
||||||||||||||||||||||||||||||||
|
Cash and equivalents
|
||||||||||||||||||||||||||||||||
|
Euro
(1)
|
$ | 12,976 | -- | -- | -- | -- | -- | $ | 12,976 | $ | 12,976 | |||||||||||||||||||||
|
Renminbi
(1)
|
$ | 6,488 | -- | -- | -- | -- | -- | $ | 6,488 | $ | 6,488 | |||||||||||||||||||||
|
Other
currencies (1)
|
$ | 5,160 | -- | -- | -- | -- | -- | $ | 5,160 | $ | 5,160 | |||||||||||||||||||||
|
|
(1)
|
U.S.
dollar equivalent
|
At
December 25, 2009, all our financing obligations were denominated in U.S.
dollars.
Information
required by this item is incorporated by reference from the Report of
Independent Registered Public Accounting Firm on page 42 and from the
consolidated financial statements and supplementary schedule on pages 43 through
74.
Item 9 Changes in and Disagreements
with Accountants on Accounting and Financial Disclosure
None
Item 9a Controls and Procedures
Controls
and Procedures
Based on
their evaluation as of December 25, 2009, our Chief Executive Officer and Chief
Financial Officer, have concluded that our disclosure controls and procedures
(as defined in Rules 13a-15(e) and 15d-15(e) under the Securities Exchange Act
of 1934, as amended) were effective to ensure that information required to
be disclosed by us in the reports that we file or submit is recorded, processed,
summarized and reported, within the time periods specified in the Securities
Exchange Commission’s (“SEC”) rules and forms and is accumulated and
communicated to our management, including our principal executive and principal
financial officers, or persons performing similar functions, as appropriate to
allow timely decisions regarding required disclosure.
Management’s
Report on Internal Control over Financial Reporting
Our
management is responsible for establishing and maintaining adequate internal
control over financial reporting (as defined in Rule 13a-15(f) under the
Securities Exchange Act of 1934, as amended). Internal control over
financial reporting is a processes designed to provide reasonable, not absolute,
assurance regarding the reliability of financial reporting and the preparation
of consolidated financial statements in accordance with accounting principles
generally accepted in the United States of America. Our management
assessed the effectiveness of our internal control over financial reporting as
of December 25, 2009. In making this assessment, our management used
the criteria set forth by the Committee of Sponsoring Organizations of the
Treadway Commission (“COSO”) in Internal Control – Integrated
Framework. Our management has concluded that, as of December 25, 2009,
our internal control over financial reporting is effective based on these
criteria. Our independent registered public accounting firm has issued an audit
report on the effectiveness of our internal control over financial reporting,
which is included herein.
There
were no changes in our internal controls over financial reporting during the
quarter ended December 25, 2009 that have materially affected, or are reasonably
likely to materially affect our internal controls over financial
reporting.
Our
management, including our Chief Executive Officer and Chief Financial Officer,
does not expect that our disclosure controls and procedures or our internal
controls will prevent all error and all fraud. A control system, no
matter how well conceived and operated, can provide only reasonable, not
absolute, assurance that the objectives of the control system are
met. Further, the design of a control system must reflect the fact
that there are resource constraints, and the benefits of controls must be
considered relative to their costs. Because of the inherent
limitations in all control systems, no evaluation of controls can provide
absolute assurance that all control issues and instances of fraud, if any,
within Technitrol, Inc. have been detected.
Report
of Independent Registered Public Accounting Firm
The Board
of Directors and Stockholders
Technitrol,
Inc.:
We have
audited Technitrol, Inc. and subsidiaries’ internal control over financial
reporting as of December 25, 2009, based on criteria established in Internal
Control - Integrated Framework issued by the Committee of Sponsoring
Organizations of the Treadway Commission (COSO). Technitrol, Inc. and
subsidiaries’ management is responsible for maintaining effective internal
control over financial reporting and for its assessment of the effectiveness of
internal control over financial reporting, included in the accompanying
Management’s Report on Internal Control over Financial Reporting. Our
responsibility is to express an opinion on the Company’s internal control over
financial reporting based on our audit.
We
conducted our audit in accordance with the standards of the Public Company
Accounting Oversight Board (United States). Those standards require that we plan
and perform the audit to obtain reasonable assurance about whether effective
internal control over financial reporting was maintained in all material
respects. Our audit included obtaining an understanding of internal control over
financial reporting, assessing the risk that a material weakness exists, and
testing and evaluating the design and operating effectiveness of internal
control based on the assessed risk. Our audit also included performing such
other procedures as we considered necessary in the circumstances. We believe
that our audit provides a reasonable basis for our opinion.
A
company’s internal control over financial reporting is a process designed to
provide reasonable assurance regarding the reliability of financial reporting
and the preparation of financial statements for external purposes in accordance
with generally accepted accounting principles. A company’s internal control over
financial reporting includes those policies and procedures that (1) pertain to
the maintenance of records that, in reasonable detail, accurately and fairly
reflect the transactions and dispositions of the assets of the company; (2)
provide reasonable assurance that transactions are recorded as necessary to
permit preparation of financial statements in accordance with generally accepted
accounting principles, and that receipts and expenditures of the company are
being made only in accordance with authorizations of management and directors of
the company; and (3) provide reasonable assurance regarding prevention or timely
detection of unauthorized acquisition, use, or disposition of the company’s
assets that could have a material effect on the financial
statements.
Because
of its inherent limitations, internal control over financial reporting may not
prevent or detect misstatements. Also, projections of any evaluation of
effectiveness to future periods are subject to the risk that controls may become
inadequate because of changes in conditions, or that the degree of compliance
with the policies or procedures may deteriorate.
In our
opinion, Technitrol, Inc. and subsidiaries maintained, in all material respects,
effective internal control over financial reporting as of December 25, 2009,
based on criteria established in Internal Control - Integrated Framework issued
by the Committee of Sponsoring Organizations of the Treadway
Commission
We also
have audited, in accordance with the standards of the Public Company Accounting
Oversight Board (United States), the consolidated balance sheets of Technitrol,
Inc. and subsidiaries as of December 25, 2009 and December 26, 2008, and the
related consolidated statements of operations, cash flows, and changes in
equity for each of the years in the three-year period ended December 25, 2009,
and the related financial statement schedule, and our report dated February 24,
2010 expressed an unqualified opinion on those consolidated financial
statements.
/s/ KPMG
LLP
Philadelphia,
Pennsylvania
February
24, 2010
Item 9b Other Information
None
Part
III
Item 10 Directors, Executive Officers
and Corporate Governance
The
disclosure required by this item is incorporated by reference to the sections
entitled, “Directors and Executive Officers,” “Corporate Governance” and
“Section 16(a) Beneficial Ownership Reporting Compliance” in our definitive
proxy statement to be used in connection with our 2010 Annual Shareholders
Meeting.
We make
available free of charge within the “About Technitrol” section of our Internet
website, at www.technitrol.com
and in print to any shareholder who requests, our Statement of Principles Policy
and all of our Board and Committee charters. Requests for copies may
be directed to Investor Relations, Technitrol, Inc., 1210 Northbrook Drive,
Suite 470, Trevose, PA 19053-8406, or telephone 215-355-2900, extension
8428. We intend to disclose any amendments to our Statement of
Principles Policy, and any waiver from a provision of our Statement of
Principles Policy, on our Internet website within five business days following
such amendment or waiver. The information contained on or connected
to our Internet website is not incorporated by reference into this Form 10-K and
should not be considered part of this or any other report that we file with or
furnish to the SEC.
Item 11 Executive Compensation
The
disclosure required by this item is incorporated by reference to the sections
entitled, “Executive Compensation,” “Registrant’s
Compensation Policies and Practices as they Relate to the Registrant’s Risk
Management,” “Compensation Committee Report,” “Summary Compensation Table,”,
“Grants of Plan-Based Awards Table,” “Outstanding Equity Award at Fiscal
Year-End Table,” “Option Exercises and Stock Vested Table,” “Pension Benefits
Table,” “Nonqualified Deferred Compensation Table,” “Potential Payments Upon
Termination or Change in Control,” “Executive Employment Arrangements,”
“Director Compensation” and “Compensation Committee Interlocks and Insider
Participation” in our definitive proxy statement to be used in connection with
our 2010 Annual Shareholders Meeting.
Item
12 Security Ownership of Certain Beneficial
Owners and Management and Related Stockholder Matters
The
disclosure required by this item is (i) included under Part II, Item 5, and (ii)
incorporated by reference to the sections entitled, “Persons Owning More Than
Five Percent of Our Stock” and “Stock Owned by Directors and Officers” in our
definitive proxy statement to be used in connection with our 2010 Annual
Shareholders Meeting.
Information
as of December 25, 2009 concerning plans under which our equity securities are
authorized for issuance are as follows:
|
Plan Category
|
Number of shares to be issued upon exercise of
options, grant of restricted shares or other incentive
shares
|
Weighted average exercise price of outstanding
options
|
Number of securities remaining available for
future issuance
|
|||||||||
|
Equity
compensation plans approved by security holders
|
6,150,000 | $ | 17.53 | 2,779,789 | ||||||||
|
|
||||||||||||
|
Equity
compensation plans not approved by security holders
|
-- | -- | -- | |||||||||
|
|
||||||||||||
|
Total
|
6,150,000 | $ | 17.53 | 2,779,789 | ||||||||
On May
15, 1981, our shareholders approved an incentive compensation plan (“ICP”)
intended to enable us to obtain and retain the services of employees by
providing them with incentives that may be created by the Board of Directors
Compensation Committee under the ICP. Subsequent amendments to the
plan were approved by our shareholders including an amendment on May 23, 2001
which increased the total number of shares of our common stock which may be
granted under the plan to 4,900,000 shares. Our 2001 Stock Option
Plan and the Restricted Stock Plan II were adopted under the ICP. In
addition to the ICP, other plans approved include a 250,000 share Board of
Director Stock Plan and a 1,000,000 share Employee Stock Purchase Plan
(“ESPP”). During 2004, the operation of the ESPP was suspended
following an evaluation of its affiliated expense and perceived value by
employees. Of the 2,779,789 shares remaining available for future
issuance, 1,856,498 shares are attributable to our ICP, 812,099 shares are
attributable to our ESPP and 111,192 shares are attributable to our Board of
Director Stock Plan. Note 12 to the Consolidated Financial Statements contains
additional information regarding our stock-based compensation
plans.
Item
13 Certain Relationships, Related Transactions
and Director Independence
The
disclosure required by this item is incorporated by reference to the sections
entitled “Certain Relationships and Related Transactions” and “Independent
Directors” in our definitive proxy statement to be used in connection with our
2010 Annual Shareholders Meeting.
Item
14 Principal Accountant Fees and
Services
The
disclosure required by this item is incorporated by reference to the section
entitled “Audit and Other Fees Paid to Independent Accountant” in our definitive
proxy statement to be used in connection with our 2010 Annual Shareholders
Meeting.
Part
IV
Item
15 Exhibits and Financial Statement
Schedule
|
|
(a)
|
Documents
filed as part of this report
|
Consolidated Financial
Statements
|
PAGE
|
|
|
Report
of Independent Registered Public Accounting Firm
|
42
|
|
Consolidated
Balance Sheets – December 25, 2009 and December 26, 2008
|
43
|
|
Consolidated
Statements of Operations – Years ended December 25, 2009, December 26,
2008 and December 28, 2007
|
44
|
|
Consolidated
Statements of Cash Flows – Years ended December 25, 2009, December 26,
2008 and December 28, 2007
|
45
|
|
Consolidated
Statements of Changes in Equity – Years ended December 25, 2009,
December 26, 2008 and December 28, 2007
|
46
|
|
Notes
to Consolidated Financial Statements
|
47
|
| Financial Statement Schedule | |
| Schedule II, Valuation and Qualifying Accounts | 74 |
|
|
(b)
|
Exhibits
|
Information
required by this item is contained in the “Exhibit Index” found on page 75
through 78 of this report.
Report
of Independent Registered Public Accounting Firm
The Board
of Directors and Stockholders
Technitrol,
Inc.:
We have
audited the accompanying consolidated balance sheets of Technitrol, Inc. and
subsidiaries (the “Company”) as of December 25, 2009 and December 26, 2008, and
the related consolidated statements of operations, cash flows, and changes
in equity for each of the years in the three-year period ended December 25,
2009. In connection with our audits of the consolidated financial statements, we
also have audited the related financial statement schedule. These consolidated
financial statements and financial statement schedule are the responsibility of
the Company’s management. Our responsibility is to express an opinion on these
consolidated financial statements and financial statement schedule based on our
audits.
We
conducted our audits in accordance with the standards of the Public Company
Accounting Oversight Board (United States). Those standards require that we plan
and perform the audit to obtain reasonable assurance about whether the financial
statements are free of material misstatement. An audit includes examining, on a
test basis, evidence supporting the amounts and disclosures in the financial
statements. An audit also includes assessing the accounting principles used and
significant estimates made by management, as well as evaluating the overall
financial statement presentation. We believe that our audits provide a
reasonable basis for our opinion.
In our
opinion, the consolidated financial statements referred to above present fairly,
in all material respects, the financial position of Technitrol, Inc. and
subsidiaries as of December 25, 2009 and December 26, 2008, and the results of
their operations and their cash flows for each of the years in the three-year
period ended December 25, 2009, in conformity with U.S. generally accepted
accounting principles. Also in our opinion, the related financial statement
schedule, when considered in relation to the basic consolidated financial
statements taken as a whole, present fairly, in all material respects, the
information set forth therein.
We also
have audited, in accordance with the standards of the Public Company Accounting
Oversight Board (United States), the Company’s internal control over financial
reporting as of December 25, 2009, based on criteria established in Internal
Control - Integrated Framework issued by the Committee of Sponsoring
Organizations of the Treadway Commission (COSO), and our report dated February
24, 2010 expressed an unqualified opinion on the effectiveness of the Company’s
internal control over financial reporting.
/s/ KPMG
LLP
Philadelphia,
Pennsylvania
February
24, 2010
Technitrol,
Inc. and Subsidiaries
Consolidated
Balance Sheets
December
25, 2009 and December 26, 2008
In
thousands
|
Assets
|
2009
|
2008
|
||||||
|
Current
assets:
|
||||||||
|
Cash
and cash equivalents
|
$ | 39,707 | $ | 41,401 | ||||
|
Accounts
receivable, net
|
70,237 | 128,010 | ||||||
|
Inventory,
net
|
39,677 | 127,074 | ||||||
|
Prepaid
expenses and other current assets
|
19,832 | 58,568 | ||||||
|
Assets
of discontinued operations held for sale
|
84,672 | -- | ||||||
|
Total
current assets
|
254,125 | 355,053 | ||||||
| Long-term assets: | ||||||||
|
Property,
plant and equipment
|
134,660 | 323,847 | ||||||
|
Less
accumulated depreciation
|
94,256 | 171,116 | ||||||
|
Net
property, plant and equipment
|
40,404 | 152,731 | ||||||
|
Deferred
income taxes
|
34,700 | 34,933 | ||||||
|
Goodwill
|
15,857 | 164,778 | ||||||
|
Other
intangibles, net
|
23,308 | 51,351 | ||||||
|
Other
long-term assets
|
11,517 | 11,065 | ||||||
| $ | 379,911 | $ | 769,911 | |||||
|
Liabilities and Equity
|
||||||||
|
Current
liabilities:
|
||||||||
|
Current
installments of long-term debt
|
$ | -- | $ | 17,189 | ||||
|
Accounts
payable
|
49,614 | 75,511 | ||||||
|
Accrued
expenses and other current liabilities
|
58,333 | 86,477 | ||||||
|
Liabilities
of discontinued operations held for sale
|
24,905 | -- | ||||||
|
Total
current liabilities
|
132,852 | 179,177 | ||||||
|
Long-term
liabilities:
|
||||||||
|
Long-term
debt, excluding current installments
|
81,000 | 326,000 | ||||||
|
Convertible
senior notes
|
50,000 | -- | ||||||
|
Deferred
income taxes
|
12,288 | 16,255 | ||||||
|
Other
long-term liabilities
|
36,524 | 40,347 | ||||||
|
Commitments
and contingencies (Note 10)
|
||||||||
|
Equity:
|
||||||||
|
Technitrol,
Inc. shareholders equity:
|
||||||||
|
Common
stock: 175,000,000 shares authorized; 41,242,286 and 40,998,413
outstanding in 2009 and 2008, respectively; $0.125 par value per share and
additional paid-in capital
|
222,139 | 225,117 | ||||||
|
Retained
loss
|
(194,257 | ) | (1,045 | ) | ||||
|
Accumulated
other comprehensive income
|
28,304 | (26,626 | ) | |||||
|
Total
Technitrol, Inc. shareholders’ equity
|
56,186 | 197,446 | ||||||
|
Non-controlling
interest
|
11,061 | 10,686 | ||||||
|
Total
equity
|
67,247 | 208,132 | ||||||
| $ | 379,911 | $ | 769,911 | |||||
See
accompanying Notes to Consolidated Financial Statements.
Technitrol,
Inc. and Subsidiaries
Consolidated
Statements of Operations
Years
ended December 25, 2009, December 26, 2008 and December 28, 2007
In
thousands, except per share data
|
2009
|
2008
|
2007
|
||||||||||
|
Net
sales
|
$ | 398,803 | $ | 626,270 | $ | 671,569 | ||||||
|
Cost
of sales
|
298,035 | 477,763 | 496,471 | |||||||||
|
Gross
profit
|
100,768 | 148,507 | 175,098 | |||||||||
|
Selling,
general and administrative expenses
|
89,698 | 123,203 | 112,430 | |||||||||
|
Severance,
impairment and other associated costs
|
82,867 | 153,294 | 17,650 | |||||||||
|
Operating
(loss) profit
|
(71,797 | ) | (127,990 | ) | 45,018 | |||||||
|
Other
income (expense):
|
||||||||||||
|
Interest
income
|
613 | 1,743 | 1,653 | |||||||||
|
Interest
expense
|
(3,580 | ) | (4,366 | ) | (2,080 | ) | ||||||
|
Other,
net
|
3,784 | 4,072 | (1,077 | ) | ||||||||
|
Total
other income (expense)
|
817 | 1,449 | (1,504 | ) | ||||||||
|
(Loss)
earnings from continuing operations before Income taxes
|
(70,980 | ) | (126,541 | ) | 43,514 | |||||||
|
Income
tax expense (benefit)
|
1,879 | (2,988 | ) | 1,341 | ||||||||
|
Net
(loss) earnings from continuing operations
|
(72,859 | ) | (123,553 | ) | 42,173 | |||||||
|
Net
(loss) earnings from discontinued operations
|
(119,978 | ) | (151,467 | ) | 19,740 | |||||||
|
Net
(loss) earnings
|
(192,837 | ) | (275,020 | ) | 61,913 | |||||||
|
Less:
Net earnings attributable to non-controlling interest
|
375 | 738 | 256 | |||||||||
|
Net
(loss) earnings attributable to Technitrol, Inc.
|
$ | (193,212 | ) | $ | (275,758 | ) | $ | 61,657 | ||||
|
Amounts
attributable to Technitrol, Inc. common shareholders:
|
||||||||||||
|
Net
(loss) earnings from continuing operations
|
$ | (73,234 | ) | $ | (124,291 | ) | $ | 41,917 | ||||
|
Net
(loss) earnings from discontinued operations
|
(119,978 | ) | (151,467 | ) | 19,740 | |||||||
|
Net
(loss) earnings attributable to Technitrol, Inc.
|
$ | (193,212 | ) | $ | (275,758 | ) | $ | 61,657 | ||||
|
Per
share data:
|
||||||||||||
|
Basic
(loss) earnings per share:
|
||||||||||||
|
Net
(loss) earnings from continuing operations
|
$ | (1.79 | ) | $ | (3.05 | ) | $ | 1.03 | ||||
|
Net
(loss) earnings from discontinued operations
|
(2.94 | ) | (3.72 | ) | 0.49 | |||||||
|
Net
(loss) earnings attributable to Technitrol, Inc.
|
$ | (4.73 | ) | $ | (6.77 | ) | $ | 1.52 | ||||
|
Diluted
(loss) earnings per share:
|
||||||||||||
|
Net
(loss) earnings from continuing operations
|
$ | (1.79 | ) | $ | (3.05 | ) | $ | 1.03 | ||||
|
Net
(loss) earnings from discontinued operations
|
(2.94 | ) | (3.72 | ) | 0.48 | |||||||
|
Net
(loss) earnings attributable to Technitrol, Inc.
|
$ | (4.73 | ) | $ | (6.77 | ) | $ | 1.51 | ||||
See
accompanying Notes to Consolidated Financial Statements.
Technitrol,
Inc. and Subsidiaries
Consolidated
Statements of Cash Flows
Years
ended December 25, 2009, December 26, 2008 and December 28, 2007
In
thousands
|
2009
|
2008
|
2007
|
||||||||||
|
Cash
flows from operating activities - continuing operations:
|
||||||||||||
|
Net
(loss) earnings
|
$ | (192,837 | ) | $ | (275,020 | ) | $ | 61,913 | ||||
|
Net
loss (earnings) from discontinued operations
|
119,978 | 151,467 | (19,740 | ) | ||||||||
|
Adjustments
to reconcile net (loss) earnings to net cash provided by operating
activities:
|
||||||||||||
|
Depreciation
and amortization
|
18,454 | 27,215 | 27,387 | |||||||||
|
Tax
effect of stock compensation
|
-- | (32 | ) | (40 | ) | |||||||
|
Stock
incentive plan expense
|
1,446 | 2,517 | 3,730 | |||||||||
|
Loss
on disposal of assets
|
3,191 | 648 | 179 | |||||||||
|
Goodwill
and intangible asset impairment, net of income taxes
|
70,982 | 140,086 | -- | |||||||||
|
Deferred
taxes
|
(6,883 | ) | (8,579 | ) | (4,103 | ) | ||||||
|
Changes
in assets and liabilities, net of effect of acquisitions and
divestitures:
|
||||||||||||
|
Accounts
receivable
|
(1,161 | ) | 44,428 | 2,363 | ||||||||
|
Inventory
|
9,524 | (215 | ) | (9,462 | ) | |||||||
|
Inventory
write downs
|
4,260 | 10,877 | 6,465 | |||||||||
|
Prepaid
expenses and other current assets
|
2,270 | (3,255 | ) | 547 | ||||||||
|
Accounts
payable
|
(8,821 | ) | (29,838 | ) | 987 | |||||||
|
Accrued
expenses
|
14,226 | (16,938 | ) | 1,133 | ||||||||
|
Severance,
impairment and other associated costs, net of cash payments (excluding
loss on disposal of assets and intangible asset
impairments)
|
4,090 | 320 | 11,622 | |||||||||
|
Other,
net
|
(1,426 | ) | (383 | ) | 1,425 | |||||||
|
Net
cash provided by operating activities
|
37,293 | 43,298 | 84,406 | |||||||||
|
Cash
flows from investing activities - continuing operations:
|
||||||||||||
|
Acquisitions,
net of cash acquired of $6,556 in 2008
|
-- | (426,396 | ) | -- | ||||||||
|
Cash
received from dispositions
|
207,809 | -- | -- | |||||||||
|
Capital
expenditures
|
(2,220 | ) | (11,607 | ) | (13,155 | ) | ||||||
|
Purchases
of grantor trust investments available for sale
|
(6,077 | ) | (409 | ) | (141 | ) | ||||||
|
Proceeds
from sale of property, plant and equipment
|
2,162 | 6,598 | 7,088 | |||||||||
|
Foreign
currency impact on intercompany lending
|
(897 | ) | (1,655 | ) | (413 | ) | ||||||
|
Net
cash provided by (used in) investing activities
|
200,777 | (433,469 | ) | (6,621 | ) | |||||||
|
Cash
flows from financing activities - continuing operations:
|
||||||||||||
|
Principal
payments on short-term debt
|
-- | -- | (1,771 | ) | ||||||||
|
Long
term borrowings
|
50,000 | 421,000 | 2,742 | |||||||||
|
Principal
payments on long-term debt
|
(255,000 | ) | (87,943 | ) | (50,381 | ) | ||||||
|
Debt
issuance costs
|
(3,040 | ) | -- | -- | ||||||||
|
Dividends
paid
|
(6,668 | ) | (14,334 | ) | (14,293 | ) | ||||||
|
Exercise
of stock options
|
-- | 52 | 971 | |||||||||
|
Tax
effect of stock compensation
|
-- | 32 | 40 | |||||||||
|
Net
cash (used in) provided by financing activities
|
(214,708 | ) | 318,807 | (62,692 | ) | |||||||
|
Net
effect of exchange rate changes on cash
|
1,166 | 6,083 | 5,168 | |||||||||
|
Cash
flows of discontinued operations:
|
||||||||||||
|
Net
cash (used in) provided by operating activities
|
(8,207 | ) | 24,324 | 15,707 | ||||||||
|
Net
cash (used in) investing activities
|
(11,276 | ) | (34,141 | ) | (8,396 | ) | ||||||
|
Net
cash (used in) financing activities
|
(7,374 | ) | -- | -- | ||||||||
|
Net
effect of exchange rates on cash
|
635 | 210 | 1,522 | |||||||||
|
Net
(decrease) increase in cash and cash equivalents from discontinued
operations
|
(26,222 | ) | (9,607 | ) | 8,833 | |||||||
|
Net
(decrease) increase in cash and cash equivalents
|
(1,694 | ) | (74,888 | ) | 29,094 | |||||||
|
Cash
and cash equivalents at beginning of year
|
41,401 | 116,289 | 87,195 | |||||||||
|
Cash
and cash equivalents at end of year
|
$ | 39,707 | $ | 41,401 | $ | 116,289 | ||||||
See
accompanying Notes to Consolidated Financial Statements.
Technitrol,
Inc. and Subsidiaries
Consolidated
Statements of Changes in Equity
Years
ended December 25, 2009, December 26, 2008 and December 28, 2007
In
thousands, except per share data
|
Common stock and paid-in
capital
|
Retained earnings (loss)
|
Accumulated other comprehensive income
(loss)
|
Non-controlling interest
|
Total equity
|
Comprehensive income (loss)
|
|||||||||||||||||||||||
|
Shares
|
Amount
|
|||||||||||||||||||||||||||
|
Balance
at December 29, 2006
|
40,751 | $ | 218,919 | $ | 241,684 | $ | 18,426 | $ | 9,692 | $ | 488,721 | |||||||||||||||||
|
Stock
options, awards and related compensation
|
150 | 3,634 | -- | -- | -- | 3,634 | ||||||||||||||||||||||
|
Tax
effect of stock compensation
|
-- | 40 | -- | -- | -- | 40 | ||||||||||||||||||||||
|
Adjustments
to defined benefits plans
|
-- | -- | -- | (848 | ) | -- | (848 | ) | ||||||||||||||||||||
|
Dividends
declared ($0.35 per share)
|
-- | -- | (14,293 | ) | -- | (14,293 | ) | |||||||||||||||||||||
|
Net
income
|
-- | -- | 61,657 | -- | 256 | 61,913 | $ | 61,913 | ||||||||||||||||||||
|
Currency
translation adjustments
|
-- | -- | -- | 31,416 | -- | 31,416 | 31,416 | |||||||||||||||||||||
|
Unrealized
holding gains on securities
|
-- | -- | -- | 444 | -- | 444 | 444 | |||||||||||||||||||||
|
Comprehensive
income
|
$ | 93,773 | ||||||||||||||||||||||||||
|
Balance
at December 28, 2007
|
40,901 | 222,593 | 289,048 | 49,438 | 9,948 | 571,027 | ||||||||||||||||||||||
|
Stock
options, awards and related compensation
|
97 | 2,492 | -- | -- | -- | 2,492 | ||||||||||||||||||||||
|
Tax
effect of stock compensation
|
-- | 32 | -- | -- | -- | 32 | ||||||||||||||||||||||
|
Adjustments
to defined benefits plans
|
-- | -- | -- | (4,759 | ) | -- | (4,759 | ) | ||||||||||||||||||||
|
Dividends
declared ($0.35 per share)
|
-- | -- | (14,335 | ) | -- | -- | (14,335 | ) | ||||||||||||||||||||
|
Net
income
|
-- | -- | (275,758 | ) | -- | 738 | (275,020 | ) | $ | (275,020 | ) | |||||||||||||||||
|
Currency
translation adjustments
|
-- | -- | -- | (68,912 | ) | -- | (68,912 | ) | (68,912 | ) | ||||||||||||||||||
|
Unrealized
holding losses on securities
|
-- | -- | -- | (2,393 | ) | -- | (2,393 | ) | (2,393 | ) | ||||||||||||||||||
|
Comprehensive
loss
|
$ | (346,325 | ) | |||||||||||||||||||||||||
|
Balance
at December 26, 2008
|
40,998 | 225,117 | (1,045 | ) | (26,626 | ) | 10,686 | 208,132 | ||||||||||||||||||||
|
Stock
options, awards and related compensation
|
244 | 1,133 | -- | -- | -- | 1,133 | ||||||||||||||||||||||
|
Adjustments
to defined benefits plans
|
-- | -- | -- | 4,696 | -- | 4,696 | ||||||||||||||||||||||
|
Dividends
declared ($0.10 per share)
|
-- | (4,111 | ) | -- | -- | -- | (4,111 | ) | ||||||||||||||||||||
|
Net
loss
|
-- | -- | (193,212 | ) | -- | 375 | (192,837 | ) | $ | (192,837 | ) | |||||||||||||||||
|
Currency
translation adjustments
|
-- | -- | -- | 48,444 | 48,444 | 48,444 | ||||||||||||||||||||||
|
Unrealized
holding gains on securities
|
-- | -- | -- | 1,790 | 1,790 | 1,790 | ||||||||||||||||||||||
|
Comprehensive
loss
|
$ | (142,603 | ) | |||||||||||||||||||||||||
|
Balance
at December 25, 2009
|
41,242 | $ | 222,139 | $ | (194,257 | ) | $ | 28,304 | $ | 11,061 | $ | 67,247 | ||||||||||||||||
See
accompanying Notes to Consolidated Financial Statements.
Technitrol,
Inc. and Subsidiaries
Notes
to Consolidated Financial Statements
|
(1)
|
Summary of Significant
Accounting Policies
|
Principles of
Consolidation
Technitrol,
Inc. is a global producer of precision-engineered electronic components and
modules. We sometimes refer to Technitrol, Inc. as “Technitrol”, “we” or
“our.” We believe we are a leading global producer of electronic
components and modules in the primary markets we serve, based on our estimates
of the annual revenues in our primary markets and our share of those markets
relative to our competitors. Our electronic components and modules
are used in virtually all types of electronic products to manage and regulate
electronic signals and power, making them critical to the functioning of our
customer’s end product.
During
2009, we announced our intention to explore monetization alternatives with
respect to our Electrical Contract Products Group or Electrical, as we refer to
it, or AMI Doduco, as it is known in its markets, which is now held for sale and
classified as a discontinued operations in our Consolidated Financial
Statements. As a result, we currently operate our business in a
single segment, our Electronic Components Group, which we refer to as
Electronics and is known as Pulse in its markets.
The
consolidated financial statements include the accounts of Technitrol, Inc. and
all of our subsidiaries. All material intercompany accounts, transactions and
profits are eliminated in consolidation.
Cash and Cash
Equivalents
Cash and
cash equivalents include funds invested in a variety of liquid short-term
investments with an original maturity of three months or less.
Inventory
Inventory
is stated at the lower of cost or market. Cost is determined by the
first-in, first-out method. Cash flows from the sale of inventory are
recorded in operating cash flows. We establish inventory
provisions to write down excess and obsolete inventory to market
value. Inventory that is written down to market in the ordinary
course of business is not written back up after a write
down. Inventory provisions at December 25, 2009 were $5.7 million and
at December 26, 2008 were $15.4 million, including approximately $8.1 million at
our Medtech and Electrical discontinued operations. If there is a
sudden and significant decrease in demand for our products or there is a higher
risk of inventory obsolescence because of rapidly changing technology or
customer requirements, we may be required to increase our inventory reserves
which may negatively affect our gross margin.
Property, Plant and
Equipment
Property,
plant and equipment is stated at cost. Depreciation is based upon the
estimated useful life of the assets on both the accelerated and the
straight-line methods. Estimated useful lives of assets range from 5
to 30 years for buildings and improvements and from 3 to 10 years for machinery
and equipment. Expenditures for maintenance and repairs are charged
to operations as incurred, and major renewals and improvements are
capitalized. Upon sale or retirement, the cost of the asset and
related accumulated depreciation are removed from our balance sheet, and any
resulting gains or losses are recognized in earnings.
Divestiture
Accounting
We have
divested certain components of our business. When this occurs, we
report the component that either has been disposed of, or is classified as held
for sale, as a discontinued operation when the operations and cash flows of the
component have been (or will be) eliminated from our ongoing operations and when
we do not expect to have any significant continuing involvement in the
operations of the component after the disposal transaction. If we
plan to dispose of the component by sale, we would be required to report the
component at the lower of its carrying amount or at fair value less costs to
sell in the period which the component is classified as held for
sale. These assessments require judgments and estimates which include
determining when it is appropriate to classify the component as held for sale,
if the component meets the specifications of a discontinued operation, the fair
value of the component and the level and type of involvement, if any, we will
have in the disposed component in the future. Furthermore, when
removing the component from our Consolidated Balance Sheets and in restating
results for prior period, we are required to make assumptions, judgments and
estimates regarding, among other things, the assets, liabilities and activities
of the component and their relation to our continuing
businesses.
Technitrol,
Inc. and Subsidiaries
Notes to Consolidated Financial
Statements, continued
|
(1)
|
Summary of Significant
Accounting Policies,
continued
|
Purchase
Accounting
The
purchase price of an acquired business is allocated to the underlying tangible
and intangible assets acquired and liabilities assumed based upon their
respective fair market values, with the excess recorded as
goodwill. Such fair market value assessments require judgments and
estimates which may change over time and may cause final amounts to differ
materially from original estimates. Adjustments to fair value
assessments are recorded to goodwill over the purchase price allocation period
which does not exceed twelve months.
Goodwill and Other
Intangibles
Goodwill
and intangible assets with indefinite useful lives are tested for impairment at
least annually. Our impairment review process compares the fair value
of each reporting unit in which goodwill resides to its carrying
cost. We estimate our reporting units’ fair value using both an
income approach and a comparable-companies market approach. The
income approach is based on estimating future cash flows using various growth
assumptions and discounting based on a present value factor. The
comparable-companies market approach considers the trading multiples of peer
companies to compute our estimated fair value. We perform the review
of goodwill in our fourth fiscal quarter of each year, or more frequently if
indicators of a potential impairment exist, to determine if the carrying value
of the recorded goodwill is impaired. Other finite-lived intangible
assets are amortized over their respective estimated useful lives on a
straight-line basis over 5 to 10 years. We review these
intangible assets when there is an indicator of impairment. In 2009,
we recorded a goodwill impairment of $71.0 million. In 2008, our
goodwill and other indefinite-lived assets were impaired by $254.7 million and
our finite-lived intangible assets were impaired by $55.7 million, $170.3
million of which are included in discontinued operations. Refer to
Note 5 for additional information regarding goodwill and other intangible assets
and the associated impairment.
Revenue
Recognition
We
recognize revenue on product sales in the period when the sales process is
complete. This generally occurs when persuasive evidence of an
agreement exists, such as a sales contract or purchase order, title and risk of
loss have been transferred, the sales price is fixed or determinable and
collectability is reasonably assured. Title and risk of loss
pass at the time of shipment for the majority of our sales. We are
not subject to any material customer acceptance provisions.
We
provide cash discounts to customers in exchange for accelerated payment
terms. Also, at our sole discretion, we may provide volume discounts
to our customers. However, such discounts are included in the piece
price on our invoices. We do not believe these allowances are
material to our consolidated financial statements.
We
provide warranties to our customers that are limited to rework or the
replacement of products. We will not accept returned goods
until we authorize the return. Warranty returns typically occur within three
months of product shipment. We accrue for warranty returns based on
historical experience and record changes in our warranty provision through costs
of sales.
We have
agreements with a limited number of distributors which provide limited rights of
return. One agreement allows the distributer to return unsalable
products based upon a percentage of qualified purchases. We refer to
this program as stock rotation. Another agreement provides credit to
the distributor for the difference between our catalog price and a discounted
price on specific parts. We refer to this program as ship and
debit. We record a reduction of revenue with a corresponding increase
in accrued expenses each period based on the historical experience of returns or
credits under each of these programs. We believe these agreements are
customary in our industry. We meet each of the criteria
established in the applicable accounting guidance prior to recognizing
revenue. We do not believe any of our discount or return programs are
material to our consolidated financial statements.
We record
an allowance for doubtful receivables. Accounts receivable allowances
at December 25, 2009 were $1.4 million and were $2.5 million at December 26,
2008, including $0.8 million at our Medtech and Electrical discontinued
operations. To the extent our customers are negatively impacted by
the current economic recession, or other negative factors, we may be required to
increase our allowance for doubtful receivables in the future, negatively
affecting our gross margin.
Technitrol,
Inc. and Subsidiaries
Notes to Consolidated Financial
Statements, continued
|
(1)
|
Summary of Significant
Accounting Policies,
continued
|
Stock-based
Compensation
We
currently sponsor a stock option plan and a restricted stock award
plan. All compensation costs relating to stock-based payment
transactions are recognized in the financial statements and are based on the
fair value of the equity instruments issued. The value of restricted
stock issued is based on the market price of the stock at the award
date. We hold the restricted shares until the continued employment
requirement is attained. The market value of the restricted shares at the
date of grant is charged to expense on a straight-line basis over the vesting
period, which is generally three years. Cash awards, which are intended to
assist recipients with their resulting personal tax liability, are based on the
market value of the restricted shares and are accrued over the vesting
period. There have been no stock options granted since 2004 and all
compensation costs related to our stock option plan have been recognized as of
December 25, 2009.
Foreign Currency
Translation
Our
foreign subsidiaries either use the U.S. dollar as their functional currency or
another local currency depending on the denomination of their transactions and
certain other criteria. For subsidiaries using the U.S. dollar as the
functional currency, non-U.S. dollar monetary assets and liabilities are
remeasured at year-end exchange rates while non-monetary items are remeasured at
historical rates. Income and expense accounts are remeasured at the average
rates in effect during the year, except for depreciation which is remeasured at
historical rates. Gains or losses from changes in exchange rates are
recognized in earnings in the period of occurrence. For subsidiaries using a
local currency as the functional currency, net assets are translated at year-end
rates while income and expense accounts are translated at average exchange
rates. Adjustments resulting from these translations are reflected as currency
translation adjustments in shareholders’ equity. Due to changes in
foreign exchange rates, sales and net earnings denominated in currencies other
than the U.S. dollar may result in higher or lower dollar sales and net earnings
upon translation. We may also experience a positive or negative
translation adjustment within our shareholders’ equity.
Income
Taxes
We use
the asset and liability method of accounting for income taxes. Under
this method, income tax expense/benefit is recognized for the amount of taxes
payable or refundable for the current year and for deferred tax liabilities and
assets for the future tax consequences of events that have been recognized in an
entity’s financial statements or tax returns. We must make
assumptions, judgments and estimates to determine our current provision for
income taxes, our deferred tax assets and liabilities and any
valuation allowance to be recorded against a deferred tax asset. Our judgments,
assumptions and estimates relative to the provision for income tax take into
account current tax laws, our interpretation of current tax laws and possible
outcomes of current and future audits conducted by foreign and domestic tax
authorities. Changes in tax law or our interpretation of tax laws and
the resolution of current and future tax audits could significantly impact the
amounts provided for income taxes in our consolidated financial
statements. Our assumptions, judgments and estimates relative to the
value of a deferred tax asset also take into account predictions of the amount
and category of future taxable income. Actual operating results and
the underlying amount and category of income in future years could render our
current assumptions, judgments and estimates of recoverable net deferred taxes
inaccurate. Any of the assumptions, judgments and estimates mentioned
above could cause our actual income tax obligations to differ from our
estimates.
We
perform a comprehensive review of uncertain tax positions
regularly. In this regard, an uncertain tax position represents our
expected treatment of a tax position taken in a filed tax return, or planned to
be taken in a future tax return or claim, that has not been reflected in
measuring income tax expense for financial reporting purposes. Until
these positions are sustained by the taxing authorities or the statutes of
limitations otherwise expire, we have benefits resulting from such positions and
report the tax effects as a liability for uncertain tax positions in our
Consolidated Balance Sheets.
Defined Benefit
Plans
The costs
and obligations of our defined benefit plans are dependent on actuarial
assumptions. The three most critical assumptions used that impact the
net periodic pension expense (income) and our benefit obligation are the
discount rate, expected return on plan assets and rate of compensation
increase. The discount rate is determined based on high-quality fixed
income investments that match the duration of expected benefit
payments. For our pension obligations in the United States, a yield
curve constructed from a portfolio of high quality corporate debt securities
with varying maturities is used to discount each future year’s expected benefit
payments to their present value. This generates our discount rate
assumption for our domestic pension plans. For our foreign plans, we
use the market rates for high quality corporate bonds to derive our discount
rate assumption. The expected return on plan assets represents a
forward
Technitrol,
Inc. and Subsidiaries
Notes to Consolidated Financial
Statements, continued
|
(1)
|
Summary of Significant
Accounting Policies,
continued
|
projection of the average rate of
earnings expected on the pension assets. We have estimated this rate
based on historical returns of similarly diversified portfolios. The
rate of compensation increase represents the long-term assumption for expected
increases to salaries for pay-related plans. These key assumptions
are evaluated annually. Changes in these assumptions could result in
different expense and liability amounts, as well as a change in future
contributions to the plans. However, we do not believe that a
reasonable change to these assumptions would result in a material impact to our
financial statements.
Contingency
Accruals
During
the normal course of business, a variety of issues may arise that may result in
litigation, environmental compliance or other contingent
obligations. In developing our contingency accruals we consider the
likelihood of a loss or incurrence of a liability, as well as our ability to
reasonably estimate the amount of exposure. We only record
contingency accruals when a liability is probable and the amount can be
reasonably estimated. Periodically, we evaluate available information
to assess whether contingency accruals should be adjusted. Our
evaluation includes an assessment of legal interpretations, judicial
proceedings, recent case law and specific changes or developments regarding
known claims. We could be required to record additional expenses in
future periods if our initial estimates were too low, or reverse part of the
charges that we recorded initially if our estimates were too
high. Additionally, litigation costs resulting from a contingency are
expensed as incurred.
Severance, Impairment and
Other Associated Costs
We record
severance, tangible asset impairments and other restructuring charges such as
lease terminations, in response to declines in demand that lead to excess
capacity, changing technology and other factors. These costs, which
we refer to as restructuring costs, are expensed during the period in which we
determine that those costs have been incurred, and that all of the requirements
to accrue are met in accordance with the applicable accounting
guidance. Restructuring costs are recorded based upon our best
estimates at the time the action is initiated. Our actual
expenditures for the restructuring activities may differ from the initially
recorded costs. If our estimates were too low, we could be required
to record additional expenses in future periods. Conversely, we could
possibly reverse part of our initial charges if our initial estimates were too
high. Additionally, the cash flow impact of the activity may not be
recognized in the same period that the expense is incurred.
Financial Instruments and
Derivative Financial Instruments
The
carrying value of our cash and cash equivalents, accounts receivable,
inventories, accounts payable and accrued expenses are a reasonable estimate of
their fair value due to the short-term nature of these instruments. As of
December 25, 2009, the carrying value of our long-term debt approximates our
fair value after taking into consideration rates offered to us under our credit
facility, as the majority of our long-term borrowings are subject to variable
interest rates. Also, the fair value of our convertible senior notes
approximates its carrying value as the notes were issued on December 22, 2009,
three days before our December 25, 2009 balance sheet date. We do not
hold or issue financial instruments or derivative financial instruments for
trading purposes. We are exposed to market risk from changes in
interest rates and foreign currency exchange rates. To mitigate the
risk from these changes, we periodically enter into hedging transactions which
have been authorized pursuant to our policies and procedures. Gains
and losses related to fair value hedges are recognized in income along with
adjustments of carrying amounts of the hedged item. Therefore, all of
our forward exchange contracts are marked-to-market, and unrealized gains and
losses are included in current-period net income.
In the
year ended December 25, 2009, we utilized forward contracts to sell forward U.S.
dollar to receive Danish krone and to sell forward euro to receive Chinese
renminbi. These contracts were used to mitigate the risk of currency
fluctuations at our former operations in Denmark and our current operations in
the Peoples Republic of China (“PRC”). At December 25, 2009, we had
seven foreign exchange forward contracts outstanding to sell forward
approximately 7.0 million euro, or approximately $10.1 million, to receive
Chinese renminbi. The fair value of these forward contracts was a
liability of $0.2 million as determined through use of Level 2 fair value inputs
as defined in ASC Topic 815. At December 26, 2008, we had twelve
foreign exchange forward contracts outstanding to sell forward approximately
$12.0 million U.S. dollars to receive Danish krone, and eight foreign exchange
forward contracts outstanding to sell forward approximately 8.0 million euro, or
approximately $11.3 million, to receive Chinese renminbi. The fair
value of these forward contracts was an asset of $0.1 million as determined
through use of Level 2 inputs.
Technitrol,
Inc. and Subsidiaries
Notes to Consolidated Financial
Statements, continued
|
(1)
|
Summary of Significant
Accounting Policies,
continued
|
Precious Metal
Consignment-type Leases
Electrical
had custody of inventories under consignment-type leases from suppliers of
$113.4 million at December 25, 2009 and $122.8 million at December 26,
2008. The decrease is primarily the result of significant overall
volume decreases offset by higher silver prices during the year ended December
25, 2009 as compared to the year ended December 26, 2008. In
conjunction with the disposition of the North American operations of Electrical
on January 4, 2010, our consignment-type leases were reduced by $13.9
million. As of December 25, 2009, Electrical had four
consignment-type leases in place for
sourcing all precious metals. The related inventory and liability are
not recorded on Electrical’s balance sheet. The agreements are
generally one-year in duration and can be extended with annual renewals and
either party can terminate the agreements with thirty days written
notice. The primary covenant in each of the agreements is a
prohibition against us creating security interests in the consigned
metals. Consignment fees of $5.2 million were included in
Electrical’s discontinued operations for the year ended December 25,
2009. These consignment fees were $3.4 million and $2.9 million in
the years ended December 26, 2008 and December 28, 2007,
respectively.
Reclassifications
Certain
amounts in the prior-year financial statements have been reclassified to conform
with the current-year presentation. Also, see Note 2.
Estimates
Our
financial statements are in conformity with accounting principles generally
accepted in the United States of America (“U.S. GAAP”). The
preparation thereof requires us to make estimates and judgments that affect the
reported amounts of assets and liabilities and the disclosure of contingencies
at the date of the financial statements as well as the reported amounts of
revenues, expenses and cash flows during the period. Estimates have
been prepared on the basis of the most current and best available information
and actual results could differ materially from those
estimates. Also, the effects of the current economic recession have
increased the degree of uncertainty inherent in our estimates.
|
(2)
|
Divestitures
|
Electrical: In 2009, our
board of directors approved a plan to divest our Electrical Contact Products
Group (“Electrical”). Electrical’s manufacturing facilities in
Germany, Spain, China, Mexico and the United States produce a full array of
precious metal electrical contact products that range from materials used in the
fabrication of electrical contacts to completed contact
subassemblies. We divested the North American operations of
Electrical on January 4, 2010. See Note 20, Subsequent Events, for
further detail regarding this transaction. The divestiture of Electrical’s
European and Asian operations is expected to be completed by the end of June
2010. We have reflected the results of Electrical as a discontinued
operation on the Consolidated Statements of Operations for all periods
presented.
Electrical’s
net sales and (loss) earnings before income taxes were as follows (in thousands):
|
Years Ended
|
||||||||||||
|
December 25,
|
December 26,
|
December 27,
|
||||||||||
|
2009
|
2008
|
2007
|
||||||||||
|
Net
sales
|
$ | 261,101 | $ | 373,856 | $ | 354,986 | ||||||
|
(Loss)
earnings before income taxes
|
$ | (67,854 | ) | $ | 12,856 | $ | 25,906 | |||||
Electrical’s
loss before income taxes includes interest expense allocated pro-rata based upon
the debt expected to be retired from the Electrical disposition, an estimate of
the write down of Electrical’s net assets to the expected net proceeds we
anticipate receiving on the completion of the sale, a curtailment related to the
Technitrol, Inc. Retirement Plan and an estimate of the settlement of certain
retirement plan benefits under the Technitrol, Inc. Supplemental Retirement Plan
and other charges. These charges were approximately $60.7 million and
$2.5 million for the years ended December 25, 2009 and December 26, 2008.
There were no such charges in 2007.
Technitrol,
Inc. and Subsidiaries
Notes to Consolidated Financial
Statements, continued
|
(2)
|
Divestitures,
continued
|
The
following table summarizes Electrical’s assets and liabilities that are held for
sale as of December 25, 2009 (in millions):
|
2009
|
||||
|
Accounts
receivable
|
$ | 43.5 | ||
|
Inventory
|
23.3 | |||
|
Prepaid
expenses and other current assets
|
9.8 | |||
|
Total
current assets
|
76.6 | |||
|
Net
property, plant and equipment
|
1.1 | |||
|
Other
long-term assets
|
6.8 | |||
|
Total
assets
|
$ | 84.5 | ||
|
Accounts
payable
|
$ | 9.4 | ||
|
Accrued
expenses and other current liabilities
|
15.1 | |||
|
Total
current liabilities
|
24.5 | |||
|
Other
long-term liabilities
|
0.3 | |||
|
Total
liabilities
|
$ | 24.8 | ||
The
assets are available for immediate sale in their present condition subject only
to terms that are usual and customary. Although we continue to
manufacture Electrical products, we expect that open customer orders will be
transferred to the buyer in the divestiture.
Medtech: On
June 25, 2009, we completed the disposition of our Medtech components business
(“Medtech”) to Altor Fund III (“Altor”). Medtech was headquartered in Roskilde,
Denmark with manufacturing facilities in Denmark, Poland and Vietnam producing
our former Sonion components for the hearing aid, high-end audio headset and
medical device markets. We received approximately $201.4 million in
cash. However, these proceeds were subject to final working capital and
financial indebtedness adjustments, which were finalized in early January, 2010
for a payment immaterial to our Consolidated Financial
Statements. The net proceeds were used primarily to repay outstanding
debt under our credit facility. We have reflected the results of
Medtech as a discontinued operation on the Consolidated Statement of Operations
for all periods presented.
Medtech’s
net sales and loss before income taxes were as follows (in thousands):
|
Years Ended
|
||||||||||||
|
December
25,
|
December
26,
|
December
27,
|
||||||||||
|
2009
|
2008
|
2007
|
||||||||||
|
Net
sales
|
$ | 49,704 | $ | 97,037 | $ | -- | ||||||
|
Loss
before income taxes
|
$ | (44,025 | ) | $ | (175,030 | ) | $ | -- | ||||
Medtech’s
loss before income taxes includes interest expense allocated pro-rata based upon
the debt retired from the proceeds of the Medtech disposition, a charge recorded
to write down our net investment in Medtech to the net proceeds received, a
charge for the curtailment and settlement of certain retirement plan benefits
under the Technitrol, Inc. Supplemental Retirement Plan and other
charges. These charges were approximately $48.6 million and $7.2
million for the years ended December 25, 2009 and December 26,
2008. Included in Medtech’s loss before income taxes for 2008 is
approximately $170.3 million of goodwill and intangible asset impairment
charges. See Note 5 for further detail.
All open
customer orders were transferred to Altor upon disposition. We have
had no material continuing involvement with Medtech.
MEMS:
During 2008, our board of directors approved a plan to divest our non-core
microelectromechanical systems (“MEMS”) microphone business located in Denmark
and Vietnam. In the second quarter of 2009, we received an amount immaterial to
our Consolidated Financial Statements for the assets of MEMS. To
reflect MEMS’ net assets at their net sales proceeds, we recorded a $2.7 million
charge during 2009. We have reflected the results of MEMS as a
discontinued operation on the Consolidated Statements of Operations for all
periods presented.
Technitrol,
Inc. and Subsidiaries
Notes to Consolidated Financial
Statements, continued
|
(2)
|
Divestitures,
continued
|
Net sales
and loss before income taxes were as follows (in thousands):
|
Years Ended
|
||||||||||||
|
December 25,
|
December 26,
|
December 27,
|
||||||||||
|
2009
|
2008
|
2007
|
||||||||||
|
Net
sales
|
$ | 1,532 | $ | 7,261 | $ | -- | ||||||
|
Loss
before income taxes
|
$ | (6,168 | ) | $ | (2,975 | ) | $ | -- | ||||
MEMS was
purchased as part of the Sonion acquisition. There is approximately $0.2 million
of assets and $0.1 million of liabilities remaining at MEMS that are considered
held for sale and are included in current assets and current liabilities,
respectively, on the December 25, 2009 Consolidated Balance Sheet. We
are contractually obligated to fulfill an immaterial amount of customer orders
before we can fully exit MEMS. The assets and liabilities that remain
on our Consolidated Balance Sheet as of December 25, 2009 primarily relate to
these customer orders.
|
(3)
|
Acquisitions
|
Sonion
A/S: On
February 28, 2008, we acquired all of the capital stock of Sonion, headquartered
in Roskilde, Denmark with manufacturing facilities in Denmark, Poland, China and
Vietnam. The results of Sonion’s operations have been included in our
consolidated financial statements since February 29, 2008. Sonion
produced components used in hearing instruments, medical devices and mobile
communications devices. Our total investment was $426.4 million, which included
$243.3 million, net of cash acquired of $6.6 million, for the outstanding
capital stock, $177.8 million of acquired debt which was repaid concurrent with
the acquisition and $5.3 million of costs directly associated with the
acquisition. We financed the acquisition with proceeds from our multi-currency
credit facility and with cash on hand. The fair value of the net tangible assets
acquired, excluding the assumed debt, approximated $99.7 million. In
addition to the fair value of assets acquired, purchase price allocations
included $73.5 million for customer relationship intangibles, $27.7 million for
technology intangibles and $232.1 million allocated to goodwill. For goodwill
impairment testing purposes, Sonion’s mobile communications group, which
produces acoustical components for mobile devices, is included in our wireless
group. Prior to its disposition in June 2009, Sonion’s Medtech
components business was treated as a separate reporting unit.
|
(4)
|
Financial Statement
Details
|
The
following provides detail of certain financial statement captions at December
25, 2009 and December 26, 2008 (in thousands):
|
2009
|
2008
|
|||||||
|
Inventory:
|
||||||||
|
Finished
goods
|
$ | 17,772 | $ | 46,747 | ||||
|
Work
in progress
|
6,101 | 29,451 | ||||||
|
Raw
materials and supplies
|
15,804 | 50,876 | ||||||
| $ | 39,677 | $ | 127,074 | |||||
|
Property,
plant and equipment, at cost:
|
||||||||
|
Land
|
$ | 2,300 | $ | 15,355 | ||||
|
Buildings
and improvements
|
22,212 | 43,210 | ||||||
|
Machinery
and equipment
|
110,148 | 265,282 | ||||||
| $ | 134,660 | $ | 323,847 | |||||
|
Accrued
expenses and other current liabilities:
|
||||||||
|
Income
taxes payable
|
$ | 12,056 | $ | -- | ||||
|
Accrued
compensation
|
12,595 | 25,338 | ||||||
|
Other
accrued expenses
|
33,682 | 61,139 | ||||||
| $ | 58,333 | $ | 86,477 | |||||
During
2009, our Medtech operations were sold and our Electrical business was
reclassified to current assets and current liabilities as a held for sale
discontinued operation. However, both businesses remain in the 2008
Consolidated Balance Sheets, which has caused substantial decreases in certain
financial statement captions in 2009 as compared to 2008. For
example, our property plant and equipment at cost in our discontinued operations
was $170.9 million at December 26, 2008. In 2009, these assets have
either been sold or are considered held for sale and are therefore not included
in our December 25, 2009 fixed asset balances.
Technitrol,
Inc. and Subsidiaries
Notes to Consolidated Financial
Statements, continued
|
(5)
|
Goodwill and Other
Intangible Assets
|
We
perform an annual review of goodwill in our fourth fiscal quarter of each year,
or more frequently if indicators of a potential impairment exist, to determine
if the carrying amount of the recorded goodwill is impaired. The impairment review
process compares the fair value of each reporting unit where goodwill resides
with its carrying value. If the net book value of the reporting unit
exceeds its fair value, we would perform the second step of the impairment test
that requires allocation of the reporting unit’s fair value to all of its assets
and liabilities in a manner similar to a purchase price allocation, with any
residual fair value being allocated to goodwill. An impairment charge
will be recognized only when the implied fair value of a reporting unit’s
goodwill is less than its carrying amount. We have identified three
reporting units, which are our Legacy Electronics unit, including our power and
network groups but excluding a component of our connector group known as FRE,
our wireless group and FRE.
Our
impairment review incorporates both an income and comparable-companies market
approach to estimate potential impairment. We believe the use of
multiple valuation techniques results in a more accurate indicator of the fair
value of each reporting unit, rather than only using an income
approach.
The
income approach is based on estimating future cash flows using various growth
assumptions and discounting based on a present value factor. We
develop the future net cash flows during our annual budget process, which is
completed in our fourth fiscal quarter each year. The growth rates we
use are an estimate of the future growth in the industries in which we
participate. Our discount rate assumption is based on an estimated
cost of capital, which we determine annually based on our estimated costs of
debt and equity relative to our capital structure. The
comparable-companies market approach considers the trading multiples of our peer
companies to compute our estimated fair value. The majority of the
comparable-companies utilized in our evaluation are included in the Dow Jones
U.S. Electrical Components and Equipment Industry Group Index.
We
completed our annual goodwill impairment review in the fourth quarter of
2009. The results of our step one analysis yielded no impairment, as
the estimated fair value of each reporting unit where goodwill has been
allocated substantially exceeded its carrying
value. Therefore, we did not perform step two of the
analysis.
We
performed step one of the goodwill impairment test during the first quarter of
2009 as a result of the decline in our stock price and a decrease in our
forecasted operating profit. Our wireless group did not pass the
first step of the impairment test. The second step of the impairment
test yielded a $71.0 million goodwill impairment at the wireless
group.
As a
result of our annual 2008 review, we concluded that approximately $250.9 million
of goodwill was impaired at our reporting units as follows (in millions):
|
2008
|
||||
|
Legacy
|
$ | 124.4 | ||
|
Medtech
|
117.5 | |||
|
FRE
|
9.0 | |||
|
Total
|
$ | 250.9 | ||
We also
assess the impairment of long-lived assets, including identifiable intangible
assets subject to amortization and property, plant and equipment, whenever
events or changes in circumstances indicate the carrying value may not be
recoverable. Factors we consider important that could trigger an
impairment review include significant changes in the use of any asset, changes
in historical trends in operating performance, changes in projected operating
performance, stock price, failure to pass step one of our annual goodwill
impairment test and significant negative economic trends. An
impairment review was performed in the first quarter of 2009, but yielded no
impairment.
Technitrol,
Inc. and Subsidiaries
Notes to Consolidated Financial
Statements, continued
|
(5)
|
Goodwill and Other
Intangible Assets, continued
|
The
changes in the carrying amounts of goodwill for the years ended December 25,
2009 and December 26, 2008 were as follows (in thousands):
|
Balance
at December 28, 2007
|
$ | 224,656 | ||
|
Goodwill
acquired during the year
|
232,099 | |||
|
Purchase
price allocation and other adjustments
|
(1,125 | ) | ||
|
Goodwill
impairment
|
(250,934 | ) | ||
|
Currency
translation adjustment
|
(39,918 | ) | ||
|
Balance
at December 26, 2008
|
164,778 | |||
|
Goodwill
impairment
|
(70,982 | ) | ||
|
Goodwill
of divested reporting unit
|
(77,816 | ) | ||
|
Currency
translation adjustment
|
(123 | ) | ||
|
Balance
at December 25, 2009
|
$ | 15,857 |
Other
intangible assets at December 25, 2009 and December 26, 2008 were as follows
(in
thousands):
|
2009
|
2008
|
|||||||
|
Intangible
assets subject to amortization (definite
lives):
|
||||||||
|
Technology
|
$ | 6,620 | $ | 27,210 | ||||
|
Customer
relationships
|
25,903 | 30,999 | ||||||
|
Other
|
1,746 | 2,567 | ||||||
|
Total
|
$ | 34,269 | $ | 60,776 | ||||
|
Accumulated
amortization:
|
||||||||
|
Technology
|
$ | (1,924 | ) | $ | (2,370 | ) | ||
|
Customer
relationships
|
(11,150 | ) | (8,746 | ) | ||||
|
Other
|
(797 | ) | (1,219 | ) | ||||
|
Total
|
$ | (13,871 | ) | $ | (12,335 | ) | ||
|
Net
intangible assets subject to amortization
|
$ | 20,398 | $ | 48,441 | ||||
|
Intangible
assets not subject to amortization (indefinite lives):
|
||||||||
|
Tradename
|
$ | 2,910 | $ | 2,910 | ||||
|
Other
intangibles, net
|
$ | 23,308 | $ | 51,351 | ||||
During
2008, we completed the purchase price allocation for our former Sonion
operations resulting in approximately $101.2 million of identifiable intangibles
as of the acquisition date, of which $52.8 million were impaired at the end of
2008.
Prior to
completing our annual review of goodwill in 2008, we performed a recoverability
test on certain definite-lived and indefinite-lived intangible
assets. As a result of that analysis, our reporting units recorded
approximately $59.5 million of impairment charges in the fourth quarter of 2008
as follows (in
millions):
|
Technology
|
Customer
Relationships
|
Trademarks
and Tradenames (Indefinite-lived)
|
Total
|
|||||||||||||
|
Legacy
|
$ | 1.4 | $ | 1.5 | $ | 3.5 | $ | 6.4 | ||||||||
|
Medtech
|
-- | 52.8 | -- | 52.8 | ||||||||||||
|
FRE
|
-- | -- | 0.3 | 0.3 | ||||||||||||
|
Total
|
$ | 1.4 | $ | 54.3 | $ | 3.8 | $ | 59.5 | ||||||||
Technitrol,
Inc. and Subsidiaries
Notes to Consolidated Financial
Statements, continued
|
(5)
|
Goodwill and Other
Intangible Assets, continued
|
Continuing
operations amortization expense was approximately $3.6 million, $5.6 million and
$5.3 million for the years ended December 25, 2009, December 26, 2008 and
December 28, 2007, respectively. The decrease in amortization expense
is the result of lower amortizing intangibles in the year ended December 25,
2009 as compared to the same period of 2008 and 2007, due to the intangible
impairment recorded on certain finite-lived intangible assets in the fourth
quarter of 2008. Estimated annual amortization expense for each of
the next five years is as follows (in thousands):
|
Year Ending
|
|
|||
|
2010
|
$ | 3,720 | ||
|
2011
|
$ | 3,448 | ||
|
2012
|
$ | 3,341 | ||
|
2013
|
$ | 3,341 | ||
|
2014
|
$ | 2,870 | ||
|
(6)
|
Investments
|
As of
December 25, 2009 and December 26, 2008, we held approximately $7.4 million and
$6.3 million, respectively, of securities designated as available for
sale. In the periods ended December 25, 2009 and December 26, 2008,
we recognized approximately $1.8 million and ($2.4) million, respectively, of
unrealized holding gains (losses) as a component of accumulated other
comprehensive income as a result of holding these securities at their fair
values. These values were determined through the use of Level 1
inputs. See Note 16 for further details. These investments
are a component of other long-term assets on our 2009 and 2008 Consolidated
Balance Sheets. These securities are held in an irrevocable grantor
trust (“Rabbi Trust”) and will be used to fund future benefit payments to
participants in one of our defined benefit plans. The Rabbi Trust is
subject to the claims of our general creditors in the event of our
insolvency.
|
(7)
|
Debt
|
On
December 22, 2009, we issued $50.0 million in convertible senior notes, which
will mature on December 15, 2014. The notes bear a coupon rate of
7.0% per annum that is payable semi-annually in arrears on June 15 and December
15 of each year, beginning with our June 15, 2010 payment. We expect to pay $3.5
million of interest on these notes in 2010. We incurred debt issuance costs of
approximately $3.0 million in 2009, which have been deferred and will be
amortized over the life of the notes.
The
convertible notes are senior unsecured obligations and are equal in right of
payment with our senior unsecured debt, but senior to any subordinated
debt. Further, these convertible notes rank junior to any of our
secured indebtedness to the extent of the assets that secure such indebtedness,
and are structurally subordinated in right of payment to all indebtedness and
other liabilities and commitments of our subsidiaries.
Holders
of our convertible notes may convert their shares to common stock at their
option any day prior to the close of business on December 14,
2014. Upon conversion, for each $1,000 in principal amount
outstanding, we will deliver a number of shares of our common stock equal to the
conversion rate. The initial conversion rate for the notes is approximately
156.64 shares of common stock per $1,000 in principal amount of
notes. The initial conversion price is approximately $6.38 per share
of common stock. The conversion rate is subject to change upon the
occurrence of specified normal and customary events as defined by the indenture,
such as stock splits or stock dividends, but will not be adjusted for accrued
interest.
Subject
to certain fundamental change exceptions specified in the indenture, which
generally pertain to circumstances in which the majority of our common stock is
obtained, exchanged or no longer available for trading, holders may require us
to repurchase all or part of their notes for cash, at a price equal to 100% of
the principal amount of the notes being repurchased plus any accrued and unpaid
interest up to, but excluding, the relevant repurchase
date. However, we are not permitted to redeem the notes prior
to maturity.
Technitrol,
Inc. and Subsidiaries
Notes to Consolidated Financial
Statements, continued
|
(7)
|
Debt,
continued
|
On
December 2, 2009, we finalized an amendment to our credit agreement that
permitted us to issue senior convertible notes and restated certain other
provisions of our previous agreement. The amended and restated credit agreement
provides for a $100.0 million senior revolving credit facility and provides for
borrowing in U.S. dollars, euros and yen, with a multicurrency facility
providing for the issuance of letters of credit in an aggregate amount not to
exceed the U.S. dollar equivalent of $10.0 million.
The
amended and restated credit agreement does not permit us to increase the total
commitment without the consent of our lenders. Therefore, the total amount
outstanding under the revolving credit facility may not exceed $100.0
million. The amount outstanding under our credit facility as of
December 25, 2009 was $81.0 million.
Outstanding
borrowings are subject to leverage and fixed charges covenants, which are
computed on a rolling four-quarter basis as of the most recent
quarter-end. Each covenant requires the calculation of EBITDA
according to a definition prescribed by the final amended and restated credit
agreement.
The
leverage covenant requires our total debt outstanding, excluding the senior
convertible notes, to not exceed the following multiples of our prior four
quarters’ EBITDA:
|
Applicable
date
(Period
or quarter ended)
|
EBITDA
Multiple
|
|
December
2009
|
3.50x
|
|
March
2010
|
3.00x
|
|
Thereafter
|
2.75x
|
The fixed
charges covenant requires that our EBITDA exceed total fixed charges, as defined
by the amended and restated credit agreement, by the following
multiples:
|
Applicable
date
(Period
or quarter ended)
|
EBITDA
Multiple
|
|
December
2009
|
1.25x
|
|
Thereafter
|
1.50x
|
We were
in compliance with the covenants of our amended credit facility in effect as of
December 25, 2009.
The fee
on the unborrowed portion of the commitment ranges from 0.225% to 0.450% of the
total commitment, depending on the following debt-to-EBITDA ratios:
|
Total debt-to-EBITDA ratio
|
Commitment fee percentage
|
|||
|
Less
than 0.75
|
0.225 | % | ||
|
Less
than 1.50
|
0.250 | % | ||
|
Less
than 2.25
|
0.300 | % | ||
|
Less
than 2.75
|
0.350 | % | ||
|
Less
than 3.25
|
0.375 | % | ||
|
Less
than 3.75
|
0.400 | % | ||
|
Greater
than 3.75
|
0.450 | % | ||
The
interest rate for each currency’s borrowing is a combination of the base rate
for that currency plus a credit margin spread.
The
credit margin spread is the same for each currency and ranges from 1.25% to
3.25%, depending on the following debt-to-EBITDA ratios:
|
Total debt-to-EBITDA
ratio
|
Credit margin spread
|
|||
|
Less
than 0.75
|
1.25 | % | ||
|
Less
than 1.50
|
1.50 | % | ||
|
Less
than 2.25
|
2.00 | % | ||
|
Less
than 2.75
|
2.50 | % | ||
|
Less
than 3.25
|
2.75 | % | ||
|
Less
than 3.75
|
3.00 | % | ||
|
Greater
than 3.75
|
3.25 | % | ||
Technitrol,
Inc. and Subsidiaries
Notes to Consolidated Financial
Statements, continued
|
(7)
|
Debt,
continued
|
The
weighted-average interest rate, including the credit margin spread, was
approximately 3.5% as of December 25, 2009.
The
amended and restated credit agreement limits our annual cash dividends to $5.0
million. Also, there are covenants specifying capital expenditure
limitations and other customary and normal provisions.
Multiple
subsidiaries, both domestic and international, have guaranteed the obligations
incurred under the amended and restated credit agreement. In
addition, certain domestic and international subsidiaries have pledged the
shares of certain subsidiaries, as well as selected accounts receivable,
inventory, machinery and equipment and other assets as collateral. If we default
on our obligations, our lenders may take possession of the collateral and may
license, sell or otherwise dispose of those related assets in order to satisfy
our obligations.
During
2009, we incurred costs of approximately $5.1 million related to current year
amendments to our credit facility, which have been deferred and will be
amortized over its remaining term. In addition, we recorded a charge of
approximately $6.3 million to impair previously capitalized fees and costs that
related to our February 28, 2008 credit agreement and its related
amendments. Of the $6.3 million of charges, $4.7 million was
allocated to discontinued operations on a pro-rata basis for the year ended
December 25, 2009, based upon the debt retired or expected to be retired from
the dispositions compared to our total debt outstanding. Similar fees
of our continuing operations are classified as interest expense on our
Consolidated Statement of Operations.
We had
four standby letters of credit outstanding at December 25, 2009 in the aggregate
amount of $1.9 million securing transactions entered into in the ordinary course
of business.
At
December 25, 2009, we had no short-term debt or current installments of
long-term debt. Detail of our long-term debt was as follows (in thousands):
|
Bank Loans
|
2009
|
|||
|
Variable-rate,
(3.48%) unsecured debt in Denmark (denominated in US dollars) due
2013
|
$ | 71,000 | ||
|
Variable-rate,
(3.49%) unsecured debt in Denmark (denominated in US dollars) due
2013
|
10,000 | |||
|
Convertible Senior Notes
|
||||
|
Fixed-rate,
(7.0%) unsecured convertible notes (denominated in US dollars) due
2014
|
50,000 | |||
|
Total
long-term debt
|
$ | 131,000 | ||
At
December 26, 2008, we had no short-term debt. Detail of our long-term
debt was as follows (in
thousands):
|
Bank Loans
|
2008
|
|||
|
Variable-rate,
(1.96%) unsecured debt in Denmark (denominated in US dollars) due
2012
|
$ | 200,000 | ||
|
Variable-rate,
(1.96%) unsecured debt in Denmark (denominated in US dollars) due
2013
|
123,000 | |||
|
Variable-rate,
(3.38%) unsecured debt in Denmark (denominated in US dollars) due
2013
|
10,000 | |||
|
Fixed-rate,
(5.65%) unsecured debt in Germany (denominated in euros) due
2009
|
7,189 | |||
|
Variable-rate,
(2.70%) unsecured debt in Singapore (denominated in US dollars) due
2013
|
3,000 | |||
|
Total
long-term debt
|
343,189 | |||
|
Less
current installments of long-term debt
|
17,189 | |||
|
Long-term
debt excluding current installments
|
$ | 326,000 | ||
Principal
payments of long-term debt due within the next five years are as follows (in thousands):
|
Year Ending
|
||||
|
2010
|
-- | |||
|
2011
|
-- | |||
|
2012
|
-- | |||
|
2013
|
$ | 81,000 | ||
|
2014
|
$ | 50,000 | ||
|
Thereafter
|
-- | |||
Technitrol,
Inc. and Subsidiaries
Notes to Consolidated Financial
Statements, continued
|
(8)
|
Income
Taxes
|
For the
years ended, December 25, 2009, December 26, 2008 and December 27, 2007, our
(loss) earnings from continuing operations before income taxes were as follows
(in
thousands):
|
2009
|
2008
|
2007
|
||||||||||
|
Domestic
|
$ | (13,638 | ) | $ | (69,459 | ) | $ | (863 | ) | |||
|
Non-U.S.
|
(57,342 | ) | (57,082 | ) | 44,377 | |||||||
|
Total
|
$ | (70,980 | ) | $ | (126,541 | ) | $ | 43,514 | ||||
Income
tax expense (benefit) was as follows (in thousands):
|
Current:
|
2009
|
2008
|
2007
|
|||||||||
|
Federal
|
$ | 267 | $ | 2,644 | $ | 3,163 | ||||||
|
State
and local
|
(432 | ) | (292 | ) | (204 | ) | ||||||
|
Non-U.S.
|
8,927 | 3,239 | 2,485 | |||||||||
| 8,762 | 5,591 | 5,444 | ||||||||||
|
Deferred:
|
||||||||||||
|
Federal
|
(4,169 | ) | (4,162 | ) | (451 | ) | ||||||
|
State
and local
|
(464 | ) | (504 | ) | (185 | ) | ||||||
|
Non-U.S.
|
(2,250 | ) | (3,913 | ) | (3,467 | ) | ||||||
| (6,883 | ) | (8,579 | ) | (4,103 | ) | |||||||
|
Net
tax expense (benefit)
|
$ | 1,879 | $ | (2,988 | ) | $ | 1,341 | |||||
Also,
income tax expense (benefit) related to our discontinued operations was $1.9
million, ($13.7) million and $6.2 million for the years ended December 25, 2009,
December 26, 2008 and December 28, 2007, respectively.
A
reconciliation of the U.S statutory federal income tax rate with the effective
income tax rate was as follows:
|
2009
|
2008
|
2007
|
||||||||||
|
U.S.
statutory federal income tax rate
|
35 | % | 35 | % | 35 | % | ||||||
|
Increase
(decrease) resulting from:
|
||||||||||||
|
State
and local income taxes, net of federal tax effect
|
1 | -- | (1 | ) | ||||||||
|
Non-deductible
expenses and other
|
(2 | ) | (1 | ) | 5 | |||||||
|
Non-U.S.
income subject to U.S. income tax
|
(1 | ) | (1 | ) | 2 | |||||||
|
Tax
effect of intangible impairment
|
(29 | ) | (25 | ) | -- | |||||||
|
Lower
foreign tax rates
|
(7 | ) | (6 | ) | (38 | ) | ||||||
|
Effective
tax rate
|
(3 | %) | 2 | % | 3 | % | ||||||
The
effective tax rate for the year ended December 25, 2009 is primarily impacted by
the goodwill, indefinite-lived intangible and definite-lived intangible
impairment charges recorded in 2009. The majority of our goodwill and
intangible impairment is not deductible for income tax purposes. We
recognized tax benefits of $0.2 million during 2009, associated with the
indefinite-lived intangible and definite-lived intangible impairment charges. At
December 25, 2009 and December 26, 2008, we had approximately $23.2 million and
$24.1 million of unrecognized income tax benefits, $21.1 million and $21.5
million of which were classified as other long-term liabilities,
respectively. If all the tax benefits were recognized as of December
25, 2009, approximately $23.2 million would impact the 2009 effective tax
rate. A reconciliation of the total gross unrecognized tax benefits
for the years ended December 25, 2009 and December 26, 2008 were as follows
(in
thousands):
|
2009
|
2008
|
2007
|
||||||||||
|
Unrecognized
tax benefits at the beginning of the year
|
$ | 24,124 | $ | 23,576 | $ | 22,789 | ||||||
|
Additions
to tax positions related to current year
|
3,172 | 3,645 | 3,576 | |||||||||
|
Additions
to tax positions related to prior years
|
-- | 1,162 | 6 | |||||||||
|
Reductions
to tax positions related to prior years
|
(1,434 | ) | (523 | ) | (198 | ) | ||||||
|
Lapses
in statutes of limitation
|
(2,625 | ) | (3,736 | ) | (2,597 | ) | ||||||
|
Unrecognized
tax benefits at the end of the year
|
$ | 23,237 | $ | 24,124 | $ | 23,576 | ||||||
Technitrol,
Inc. and Subsidiaries
Notes to Consolidated Financial
Statements, continued
|
(8)
|
Income Taxes,
continued
|
Our
practice is to recognize interest and/or penalties related to income tax matters
as income tax expense. As of December 25, 2009, we have approximately
$1.0 million accrued for interest and/or penalties related to uncertain income
tax positions.
We are
subject to U.S. federal income tax as well as income tax in multiple state and
non-U.S. jurisdictions. With respect to federal and state income tax,
tax returns for all years after 2004 are subject to future examination by the
respective tax authorities. With respect to material non-U.S.
jurisdictions in which we operate, we have open tax years ranging from 2 to 10
years.
We do not
expect the amount of unrecognized tax benefits to significantly change within
the next twelve months. However, such balances may change
quarter-over-quarter during 2010.
Several
of our foreign subsidiaries continue to operate under tax holiday or incentive
arrangements as granted by certain foreign jurisdictions. The nature
and extent of such arrangements vary, and the benefits of such arrangements may
phase out in the future according to the specific terms and schedules as set
forth by the particular tax authorities having jurisdiction over the
arrangements. For example, the tax holidays applicable to most of our
PRC earnings will expire in 2010. In 2009, 2008 and 2007, taxes on
foreign earnings were favorably affected by tax holidays and other incentives in
certain foreign jurisdictions by $3.0 million, $8.2 million and $9.5 million,
respectively.
Deferred
tax assets and liabilities from continuing operations included the following
(in
thousands):
|
Assets:
|
2009
|
2008
|
||||||
|
Inventories
|
$ | 1,499 | $ | 490 | ||||
|
Plant
and equipment
|
9,216 | 13,434 | ||||||
|
Vacation
pay and other compensation
|
391 | 364 | ||||||
|
Pension
expense
|
2,734 | 6,743 | ||||||
|
Stock
awards
|
251 | 350 | ||||||
|
Accrued
liabilities
|
1,047 | 1,229 | ||||||
|
Net
operating losses – federal, state and foreign
|
24,771 | 17,305 | ||||||
|
Tax
credits
|
21,678 | 20,609 | ||||||
|
Other
|
341 | 5,716 | ||||||
|
Total
deferred tax assets
|
61,928 | 66,240 | ||||||
|
Valuation
allowance
|
(11,481 | ) | (9,697 | ) | ||||
|
Net
deferred tax assets
|
$ | 50,447 | $ | 56,543 | ||||
|
Liabilities:
|
||||||||
|
Foreign
earnings not permanently invested
|
$ | 20,972 | $ | 21,833 | ||||
|
Unrecognized
foreign exchange gains
|
1,297 | -- | ||||||
|
Acquired
intangibles
|
2,819 | 11,374 | ||||||
|
Total
deferred tax liabilities
|
25,088 | 33,207 | ||||||
|
Net
deferred tax assets
|
$ | 25,359 | $ | 23,336 | ||||
|
Short-term
deferred tax assets
|
$ | 5,538 | $ | 8,306 | ||||
|
Short-term
deferred tax liabilities
|
(2,591 | ) | (3,648 | ) | ||||
|
Long-term
deferred tax assets
|
34,700 | 34,933 | ||||||
|
Long-term
deferred tax liabilities
|
(12,288 | ) | (16,255 | ) | ||||
|
Net
deferred tax assets
|
$ | 25,359 | $ | 23,336 | ||||
Based on
our history of taxable income, our projection of future earnings and our ability
to repatriate earnings, we believe that it is more likely than not that
sufficient taxable income will be generated in the foreseeable future to realize
the net deferred tax assets. Unless utilized, net operating losses
will expire in fiscal years 2010 through 2027. Foreign tax credit
carry forwards will start to expire in 2011. Research and development credit
carry forwards will start to expire in 2019.
We have
not provided for U.S. federal and state income and foreign withholding taxes on
approximately $455.0 million of our non-U.S. continuing operations subsidiaries’
undistributed earnings (as calculated for income tax purposes) as of December
25, 2009, including pre-acquisition earnings of foreign entities acquired in
stock purchases. Unrecognized deferred taxes on these undistributed
earnings were estimated to be approximately $132.0 million.
Technitrol,
Inc. and Subsidiaries
Notes to Consolidated Financial
Statements, continued
|
(9)
|
Employee Benefit
Plans
|
We
maintain defined benefit pension plans for certain U.S. and non-U.S.
employees. Benefits are based on years of service and average final
compensation. For U.S. plans we fund at least the minimum amount required by the
Employee Retirement Income Security Act of 1974, as amended. We do
not provide any post-retirement benefits outside of the U.S., except as may be
required by certain foreign jurisdictions. Depending on the
investment performance of plan assets and other factors, the funding amount in
any given year may be zero. Pension expense related to our defined
benefit plans was $9.5 million, $1.2 million and $1.0 million in the years ended
December 25, 2009, December 26, 2008 and December 27, 2007, respectively, which
included the following components (in thousands):
|
2009
|
2008
|
2007
|
||||||||||
|
Service
cost
|
$ | 1,120 | $ | 1,269 | $ | 1,183 | ||||||
|
Interest
cost
|
2,327 | 2,515 | 2,417 | |||||||||
|
Expected
return on plan assets
|
(1,948 | ) | (2,719 | ) | (2,640 | ) | ||||||
|
Amortization
of transition obligation
|
5 | 7 | 9 | |||||||||
|
Amortization
of prior service costs
|
120 | 232 | 238 | |||||||||
|
Recognized
actuarial gains
|
52 | (154 | ) | (203 | ) | |||||||
|
Curtailment
gains
|
(949 | ) | -- | -- | ||||||||
|
Special
termination benefits
|
8,820 | -- | -- | |||||||||
|
Net
periodic pension cost
|
$ | 9,547 | $ | 1,150 | $ | 1,004 | ||||||
Included
in the $9.5 million pension cost incurred during the year ended December 25,
2009 is approximately $8.8 million of special termination benefits and $1.0
million of curtailment gains related to settlements and curtailments in the
Technitrol, Inc. Supplemental Retirement Plan and the Technitrol, Inc.
Retirement Plan that were triggered by the sale of Medtech and accrued as a
result of the pending sale of Electrical. These charges were
allocated to our discontinued operations in the Consolidated Statement of
Operations for the year ended December 25, 2009. Our continuing
operations net pension cost for 2009 was approximately $1.7
million.
The
financial status of our defined benefit plans at December 25, 2009 and December
26, 2008 was as follows (in
thousands):
|
2009
|
2008
|
|||||||
|
Change
in benefit obligation:
|
||||||||
|
Projected
benefit obligation at beginning of year
|
$ | 43,931 | $ | 44,910 | ||||
|
Service
cost
|
1,120 | 1,269 | ||||||
|
Interest
cost
|
2,327 | 2,515 | ||||||
|
Actuarial
(gains) loss
|
605 | (2,831 | ) | |||||
|
Benefits
paid
|
(1,898 | ) | (1,722 | ) | ||||
|
Plan
amendments/settlements
|
(5,899 | ) | (210 | ) | ||||
|
Plan
curtailments
|
(3,805 | ) | -- | |||||
|
Special
termination benefit
|
8,820 | -- | ||||||
|
Projected
benefit obligation at end of year
|
$ | 45,201 | $ | 43,931 | ||||
|
Change
in plan assets:
|
||||||||
|
Fair
value of plan assets at beginning of year
|
$ | 25,416 | $ | 34,653 | ||||
|
Actual
return on plan assets
|
5,851 | (7,741 | ) | |||||
|
Employer
contributions
|
6,279 | 250 | ||||||
|
Benefits
paid
|
(1,898 | ) | (1,746 | ) | ||||
|
Plan
settlements
|
(5,899 | ) | -- | |||||
|
Fair
value of plan assets at end of year
|
$ | 29,749 | $ | 25,416 | ||||
|
Accumulated
benefit obligation
|
$ | 43,720 | $ | 38,429 | ||||
Technitrol,
Inc. and Subsidiaries
Notes to Consolidated Financial
Statements, continued
|
(9)
|
Employee Benefit
Plans, continued
|
The
unrecognized components of net periodic pension cost have been included in
accumulated other comprehensive income. The accumulated other comprehensive
income (loss) for our defined benefit plans included the following components
(in
thousands):
|
2009
|
2008
|
|||||||
|
Actuarial
gains (losses)
|
$ | 171 | $ | (3,401 | ) | |||
|
Amortization
of prior service costs
|
(79 | ) | (1,203 | ) | ||||
|
Amortization
of transition obligations
|
(18 | ) | (18 | ) | ||||
|
Accumulated
other comprehensive income (loss)
|
$ | 74 | $ | (4,622 | ) | |||
The
pension cost expected to be amortized from accumulated other comprehensive
income in 2010 related to our defined benefit pension plans is expected to be
less than $0.1 million.
The
aggregate benefit obligation, accumulated benefit obligation and fair value of
plan assets for plans with benefit obligations in excess of plan assets, as of
the measurement date of each statement of financial position presented, is as
follows (in
thousands):
|
2009
|
2008
|
|||||||
|
Benefit
obligation
|
$ | 44,910 | $ | 43,677 | ||||
|
Accumulated
benefit obligation
|
$ | 43,531 | $ | 38,288 | ||||
|
Plan
assets
|
$ | 29,339 | $ | 25,070 | ||||
Securities
held in our Rabbi Trust are excluded from plan assets. However, the
Rabbi Trust securities will be used to fund future benefit payments to
participants of one of our defined benefit plans. As of December 25,
2009 and December 26, 2008, we held approximately $7.4 million and $6.3 million,
respectively, of securities in the Rabbi Trust. See Note 6 to the
Consolidated Financial Statements for further details regarding the Rabbi
Trust.
We expect
to contribute approximately $4.5 million to our defined benefit plans in 2010,
the majority of which is contingent upon the sale of
Electrical. Additionally, we expect to make benefit payments in 2010
of approximately $13.5 million from our defined benefit plans which is also
contingent upon the sale of Electrical. The 2010 expected payments contain an
estimated cash settlement from the Technitrol, Inc. Supplemental Retirement
Plan.
The
defined benefit plans’ weighted-average asset allocations at December 25, 2009
and December 26, 2008 were as follows:
|
Asset category:
|
2009
|
2008
|
||||||
|
Equity
securities
|
69 | % | 69 | % | ||||
|
Fixed
income securities
|
30 | % | 30 | % | ||||
|
Other
|
1 | % | 1 | % | ||||
|
Total
|
100 | % | 100 | % | ||||
Our asset
allocation policy for our primary benefit plans is for a target investment of
65% to 75% equity securities and 25% to 35% fixed income
securities. The goal of our asset investment policy is to achieve a
return in excess of the rate of inflation with acceptable levels of
volatility. We utilize professionally managed funds to invest our
assets in accordance with our investment policy.
Technitrol,
Inc. and Subsidiaries
Notes to Consolidated Financial
Statements, continued
|
(9)
|
Employee Benefit
Plans, continued
|
A summary
of our pension assets that are measured and recorded at fair value on a
recurring basis and their level within the fair value hierarchy as of December
25, 2009 is as follows (in
millions):
|
2009
|
Quoted
Prices In Active Markets for Identical Assets
(Level 1)
|
Significant
Other Observable Inputs
(Level 2)
|
Significant
Unobservable Inputs
(Level 3)
|
|||||||||||||
|
Plan
assets per asset category (1):
|
||||||||||||||||
|
Cash
and cash equivalents
|
$ | 0.1 | $ | 0.1 | $ | -- | $ | -- | ||||||||
|
Fixed
income securities:
|
||||||||||||||||
|
U.S.
Treasuries (2)
|
2.2 | 2.2 | -- | -- | ||||||||||||
|
Corporate
bonds (3)
|
6.4 | 6.4 | -- | -- | ||||||||||||
|
Short-term
debt securities (4)
|
0.5 | 0.5 | -- | -- | ||||||||||||
|
Equity
securities:
|
||||||||||||||||
|
International
small-cap value (5)
|
5.9 | 5.9 | -- | -- | ||||||||||||
|
International
mid-cap value (6)
|
11.8 | 11.8 | -- | -- | ||||||||||||
|
International diversified value
(7)
|
2.9 | 2.9 | -- | -- | ||||||||||||
|
Fair
value of plan assets
|
$ | 29.8 | $ | 29.8 | $ | -- | $ | -- | ||||||||
|
|
(1)
|
See
Note 16 for a description of the three levels within the fair value
hierarchy.
|
|
|
(2)
|
Debt
securities that invest in treasury and other related
instruments.
|
|
|
(3)
|
Debt
securities that specialize in investment grade bonds of institutional
investors and other treasury related
securities.
|
|
|
(4)
|
Generally,
money market securities that maintain cash for interim
purchases.
|
|
|
(5)
|
Equity
securities that focus on international public companies with low market
capitalization.
|
|
|
(6)
|
Equity
securities that focus on international public companies with a mid-rated
market capitalization.
|
|
|
(7)
|
Equity
securities that focus on international public companies, but diversify
their market capitalization to limit
investment
|
Assumptions
used to develop the defined benefit plan data were as follows:
|
2009
|
2008
|
|||||||
|
Discount
rate
|
6.00 | % | 6.20 | % | ||||
|
Annual
compensation increases
|
4.25 | % | 4.25 | % | ||||
|
Expected
long-term rates of return on plan assets
|
8.00 | % | 8.00 | % | ||||
The
discount rate is determined based on high-quality fixed income investments that
match the duration of expected benefit payments. For our pension
obligations in the United States, a yield curve constructed from a portfolio of
high quality corporate debt securities with varying maturities is used to
discount each future year’s expected benefit payments to their present
value. This generates our discount rate assumption for our domestic
pension plans. For our foreign plans, we use the market rates for
high quality corporate bonds to derive our discount rate
assumption. To develop the expected long-term rate of return on
assets assumption, we considered historical returns and future expectations for
returns of each asset class, weighted by the target asset
allocations. The rate of compensation increase represents
the long-term assumption for expected increases to salaries for pay-related
plans.
Our
measurement date is the last day of the calendar year.
The
following table shows expected benefit payments for the next five fiscal years
and the aggregate five years thereafter from our defined benefit plans (in thousands):
|
Year Ending
|
||||
|
2010
|
$ | 13,535 | ||
|
2011
|
$ | 1,876 | ||
|
2012
|
$ | 1,960 | ||
|
2013
|
$ | 2,027 | ||
|
2014
|
$ | 2,109 | ||
|
Thereafter
|
$ | 12,029 | ||
Technitrol,
Inc. and Subsidiaries
Notes to Consolidated Financial
Statements, continued
|
(9)
|
Employee Benefit
Plans, continued
|
For some
of our non-U.S. subsidiaries, there are varying defined contribution pension
plans, which provide benefits for substantially all of their
employees. The net pension expense of these plans included in the
results of our continuing operations was $2.8 million, $2.9 million and $1.2
million in 2009, 2008 and 2007, respectively.
We
maintain two defined contribution 401(k) plans covering substantially all U.S.
employees. The total contribution expense under the 401(k) plans for employees
of continuing operations was approximately $0.3 million, $1.1 million and $1.0
million in 2009, 2008 and 2007, respectively. During 2009, we amended
these plans and temporarily suspended employer matching
contributions. Future employer matching contributions will be made on
a discretionary basis.
|
(10)
|
Commitments and
Contingencies
|
We
conduct a portion of our operations on leased premises and also lease certain
equipment under operating leases. Total rental expense amounts for
our continuing operations for the years ended December 25, 2009, December 26,
2008 and December 28, 2007 were $7.3 million, $8.9 million and $7.7 million,
respectively. The aggregate minimum rental commitments under
non-cancelable leases in effect at December 25, 2009 were as follows (in thousands):
|
Year Ending
|
||||
|
2010
|
$ | 5,645 | ||
|
2011
|
3,887 | |||
|
2012
|
1,794 | |||
|
2013
|
936 | |||
|
2014
|
755 | |||
|
Thereafter
|
2,302 | |||
| $ | 15,319 | |||
The
aggregate minimum rental commitments schedule does not include $113.4 million
due under precious metal consignment-type leases and approximately $2.5
million due under operating leases at Electrical.
We had
four standby letters of credit outstanding at December 25, 2009 in the aggregate
amount of $1.9 million securing transactions entered into in the ordinary course
of business.
We had no
other material off-balance-sheet financing arrangements in addition to our
operating leases, precious metal leases and letters of credit.
Our
manufacturing operations are subject to a variety of local, state, federal and
international environmental laws and regulations governing air emissions,
wastewater discharges, the storage, use, handling, disposal and remediation of
hazardous substances and wastes and employee health and safety. It is our policy
to meet or exceed the environmental standards set by these
laws. However, in the normal course of business, environmental issues
may arise. We may incur increased costs associated with environmental
compliance and cleanup projects necessitated by the identification of new
environmental issues or new environmental laws and regulations.
We accrue
costs associated with environmental and legal matters when they become probable
and reasonably estimable. Accruals are established based on the
estimated undiscounted cash flows to settle the obligations and are not reduced
by any potential recoveries from insurance or other indemnification claims. We
believe that any ultimate liability with respect to these actions in excess of
amounts provided will not materially affect our operations or consolidated
financial position, liquidity or operating results.
We are
also subject to various lawsuits, claims and proceedings which arise in the
ordinary course of our business. These actions include routine tax
audits and assessments occurring throughout numerous jurisdictions on a
worldwide basis. We do not believe that the outcome of any of these
actions will have a material adverse effect on our financial
results.
Technitrol,
Inc. and Subsidiaries
Notes to Consolidated Financial
Statements, continued
|
(11)
|
Equity
|
All of
our retained earnings are free from legal or contractual restrictions as of
December 25, 2009, with the exception of approximately $30.2 million of
retained earnings, primarily in the PRC that are restricted in accordance with
Section 58 of the PRC Foreign Investment Enterprises Law. The law restricts 10%
of our net earnings in the PRC, limited to 50% of the total capital invested in
the PRC. Included in the $30.2 million are approximately
$5.7 million of retained earnings of a majority-owned subsidiary and
approximately $1.9 million of a discontinued operation.
See Note
7 for information regarding our convertible senior notes and Note 12 for
information regarding our stock-based compensation plans.
We have a
Shareholder Rights Plan. The Rights are currently not exercisable and
automatically trade with our common shares. However, after a person
or group has acquired 15% or more of our common shares, the Rights will become
exercisable, and separate certificates representing the Rights will be
distributed. In the event that any person or group acquires 15% of
our common shares, each holder of two Rights (other than the Rights of the
acquiring person) will have the right to receive, for $300, that number of
common shares having a market value equal to two times the exercise price of the
Rights. Alternatively, in the event that, at any time following the
date in which a person or group acquires ownership of 15% or more of our common
shares, and we are acquired in a merger or other business combination
transaction, or 50% or more of our consolidated assets are sold, each holder of
two Rights (other than the Rights of such acquiring person or group) will
thereafter have the right to receive, upon exercise, that number of shares of
common stock of the acquiring entity having a then market value equal to two
times the exercise price of the Rights. The Rights may be redeemed by
us at a price of $0.005 per Right at any time prior to becoming
exercisable. Rights that are not redeemed or exercised expire on
September 9, 2010.
|
(12)
|
Stock-Based
Compensation
|
We have
an incentive compensation plan for our employees. One component of
this plan is restricted stock, which grants the recipient the right of ownership
of our common stock, generally conditional on continued employment for a
specified period. Another component is stock options. All
compensation cost relating to stock-based payment transactions is recognized in
the financial statements and is based on the fair value of the equity
instruments issued. The following table presents the stock-based
compensation expense included in the Consolidated Statements of Operations for
the years ended December 25, 2009, December 26, 2008 and December 27, 2007,
respectively, (in
thousands):
|
2009
|
2008
|
2007
|
||||||||||
|
Restricted
stock
|
$ | 1,446 | $ | 2,367 | $ | 3,281 | ||||||
|
Stock
options
|
-- | 150 | 449 | |||||||||
|
Total
stock-based compensation included in selling, general and administrative
expenses
|
1,446 | 2,517 | 3,730 | |||||||||
|
Income
tax benefit
|
(506 | ) | (881 | ) | (1,262 | ) | ||||||
|
Total
after-tax stock-based compensation expense
|
$ | 940 | $ | 1,636 | $ | 2,468 | ||||||
Restricted Stock: The
value of restricted stock issued is based on the market price of the stock at
the award date. We retain the restricted shares until the continued
employment requirement has been met. The market value of the shares
at the date of grant is charged to expense on a straight-line basis over the
vesting period, which is generally three years. Cash awards, which are intended
to assist recipients with their resulting personal tax liability, are based on
the market value of the shares and are accrued over the vesting
period. If the recipient makes an election under Section 83(b) of the
Internal Revenue Code, the expense related to the cash award is generally fixed
based on the value of the awarded stock on the grant date. If the
recipient does not make the election under Section 83(b), the expense related to
the cash award will fluctuate based on the current market value of the shares,
subject to limitations set forth in our restricted stock plan.
Technitrol,
Inc. and Subsidiaries
Notes to Consolidated Financial
Statements, continued
|
(12)
|
Stock-Based
Compensation, continued
|
A summary
of the restricted stock activity for the years ended December 25, 2009 and
December 26, 2008 is as follows (in thousands, except per share
data):
|
2009
|
2008
|
|||||||||||||||
|
Shares
|
Weighted
Average Stock Grant Price
(Per Share)
|
Shares
|
Weighted
Average Stock Grant Price
(Per Share)
|
|||||||||||||
|
Opening
nonvested restricted stock
|
208 | $ | 24.59 | 219 | $ | 22.85 | ||||||||||
|
Granted
|
223 | $ | 6.11 | 89 | $ | 23.68 | ||||||||||
|
Vested
|
(75 | ) | $ | 24.13 | (87 | ) | $ | 18.79 | ||||||||
|
Forfeited/cancelled
|
(26 | ) | $ | 15.62 | (13 | ) | $ | 18.72 | ||||||||
|
Ending
nonvested restricted stock
|
330 | $ | 11.92 | 208 | $ | 24.59 | ||||||||||
As of
December 25, 2009, there was approximately $1.8 million of total unrecognized
compensation cost related to restricted stock grants. This
unrecognized compensation is expected to be recognized over a weighted-average
period of approximately 2.0 years.
Stock Options: Stock
options were granted at no cost to the employee and, under our plan agreement,
the exercise price of these options cannot be less than the fair market value of
our common shares on the date of grant. These options expire seven
years from the date of grant and vest equally over four years. We
value our stock options according to the fair value method using the
Black-Scholes option pricing model. There have been no options
granted since 2004, however, options may be granted in the future.
A summary
of our stock option activity for the years ended December 25, 2009 and
December 26, 2008, respectively, is as follows (in thousands, except per share
data):
|
2009
|
2008
|
|||||||||||||||||||||||
|
Shares
|
Weighted
Average Option Grant Price
(Per Share)
|
Aggregate
Intrinsic Value
|
Shares
|
Weighted
Average Option Grant Price
(Per Share)
|
Aggregate
Intrinsic Value
|
|||||||||||||||||||
|
Opening
stock options outstanding
|
125 | $ | 17.99 | 187 | $ | 18.96 | ||||||||||||||||||
|
Granted
|
-- | -- | -- | -- | ||||||||||||||||||||
|
Exercised
|
-- | -- | (3 | ) | $ | 18.83 | ||||||||||||||||||
|
Forfeited/cancelled
|
(43 | ) | $ | 18.90 | (59 | ) | $ | 21.00 | ||||||||||||||||
|
Ending
stock options outstanding
|
82 | $ | 17.53 | -- | 125 | $ | 17.99 | -- | ||||||||||||||||
|
Ending
stock options exercisable
|
82 | $ | 17.53 | -- | 125 | $ | 17.99 | -- | ||||||||||||||||
The
exercise prices of the options outstanding as of December 25, 2009 range from
$16.55 share to $18.41 per share. As of December 25, 2009, all
compensation costs related to option grants have been
recognized. There were no stock options exercised in the year ended
December 25, 2009. For the year ended December 26, 2008, cash
received from stock options exercised was less than $0.1 million and the total
intrinsic value of stock options exercised was less than $0.1
million.
Tax
benefits from deductions in excess of the compensation cost of stock options
exercised are required to be classified as a cash inflow from financing, which
caused our prior year December 26, 2008 net cash provided by operating
activities to be lower and net cash used in financing activities to be higher by
less than $0.1 million. There was no effect in the year ended
December 25, 2009, as there were no stock options exercised.
We have
not capitalized any stock-based compensation costs into inventory or other
assets during any period presented in the Consolidated Financial
Statements.
Technitrol,
Inc. and Subsidiaries
Notes to Consolidated Financial
Statements, continued
|
(13)
|
(Loss) Earnings Per
Share
|
Basic
(loss) earnings per share were calculated by dividing our net (loss) earnings by
the weighted average number of common shares outstanding during the year,
excluding restricted shares which are considered to be contingently
issuable. For calculating diluted earnings per share, common
share equivalents are added to the weighted average number of common shares
outstanding. Common share equivalents are computed based on the
number of outstanding options to purchase common stock and unvested restricted
shares as calculated using the treasury stock method. However, in
years when we have a net loss, or the exercise price of stock options, by grant,
are greater than the actual stock price as of the end of the year, those common
share equivalents will be excluded from the calculation of diluted earnings per
share. As we had a net loss for the years ended December 25, 2009 and December
26, 2008, we did not include any common stock equivalents in the calculation of
earnings per share. There were approximately 189,000 common share
equivalents for the year ended December 28, 2007. There were
approximately 82,000, 125,000 and 187,000 stock options outstanding as of
December 25, 2009, December 26, 2008 and December 28, 2007,
respectively. Also, we had unvested restricted shares outstanding of
approximately 330,000, 208,000 and 219,000 as of December 25, 2009, December 26,
2008 and December 28, 2007, respectively.
The
diluted effect of our convertible senior notes is also included in our diluted
earnings per share calculation using the if-converted
method. Interest attributable to the converible senior notes, net of
tax, is added back to the net earnings for the period, and the total shares that
would be converted if the notes were settled at the Consolidated Balance Sheet
date are added to the weighted average common shares
outstanding. However, in years when the amount of interest
attributable to the convertible senior notes, net of tax, per the potential
common shares obtainable in a settlement exceeds our basic earnings per share,
the overall dilutive effects of the convertible senior notes are considered
anti-dilutive and are excluded from the calculation of diluted earnings per
share. For the year ended December 25, 2009, the dilutive effects of
the convertible senior notes were excluded from the calculation of diluted
earnings per share as the interest attributable to the converible senior
notes, net of tax, per common shares obtainable was anti-dilutive.
Unvested
share-based payment awards that contain non-forfeitable rights to dividends or
dividend equivalents are required to be treated as participating securities.
Under our restricted stock plan, non-forfeitable dividends are paid on unvested
shares of restricted stock, which meets the qualifications of participating
securities and requires the two-class method of calculating earnings per share
to be applied. We have calculated basic and diluted earnings per share under
both the treasury stock method and the two-class method. For the
years ended December 25, 2009, December 26, 2008 and December 28,
2007, there were no significant differences in the per share amounts
calculated under the two methods, therefore, we have not presented the
reconciliation of earnings per share under the two class method.
For the
years ended December 25, 2009, December 26, 2008 and December 28, 2007, our
(loss) earnings per share calculations were as follows (in thousands, except per share
amounts):
|
2009
|
2008
|
2007
|
||||||||||
|
Net
(loss) earnings from continuing operations
|
$ | (72,859 | ) | $ | (123,553 | ) | $ | 42,173 | ||||
|
Net
(loss) earnings from discontinued operations
|
(119,978 | ) | (151,467 | ) | 19,740 | |||||||
|
Less:
Net earnings attributable to non-controlling interest
|
375 | 738 | 256 | |||||||||
|
Net
(loss) earnings attributable to Technitrol, Inc.
|
$ | (193,212 | ) | $ | (275,758 | ) | $ | 61,657 | ||||
|
Basic
(loss) earnings per share:
|
||||||||||||
|
Shares
|
40,853 | 40,744 | 40,605 | |||||||||
|
Continuing
operations
|
$ | (1.79 | ) | $ | (3.05 | ) | $ | 1.03 | ||||
|
Discontinued
operations
|
(2.94 | ) | (3.72 | ) | 0.49 | |||||||
|
Per
share amount
|
$ | (4.73 | ) | $ | (6.77 | ) | $ | 1.52 | ||||
|
Diluted
(loss) earnings per share:
|
||||||||||||
|
Shares
|
40,853 | 40,744 | 40,794 | |||||||||
|
Continuing
operations
|
$ | (1.79 | ) | $ | (3.05 | ) | $ | 1.03 | ||||
|
Discontinued
operations
|
(2.94 | ) | (3.72 | ) | 0.48 | |||||||
|
Per
share amount
|
$ | (4.73 | ) | $ | (6.77 | ) | $ | 1.51 | ||||
Technitrol,
Inc. and Subsidiaries
Notes to Consolidated Financial
Statements, continued
|
(14)
|
Research, Development
and Engineering Expenses
|
Research,
development and engineering expenses (“RD&E”) are included in selling,
general and administrative expenses and the amounts included in our continuing
operations were $28.2 million, $42.6 million and $35.1 million in 2009, 2008 and
2007, respectively. RD&E includes costs associated with new
product development, product and process improvement, engineering follow-through
during early stages of production, design of tools and dies and the adaptation
of existing technology to specific situations and customer
requirements. The research and development component of RD&E,
which generally includes only those costs associated with new technology, new
products or significant changes to current products or processes, was $27.7
million, $42.3 million and $35.0 million in 2009, 2008 and 2007,
respectively.
|
(15)
|
Severance, Impairment
and Other Associated Costs
|
As a
result of our continuing focus on both economic and operating profit, we
continue to aggressively size our operations so that costs are optimally matched
to current and anticipated future revenue and unit demand. The
amounts and timing of charges will depend on specific actions
taken. The actions taken include plant closures and relocations,
asset impairments and reduction in personnel worldwide have resulted in the
elimination of a variety of costs. The majority of the non-impairment
related costs represent the annual salaries and benefits of terminated
employees, both those directly related to manufacturing and those providing
selling, general and administrative services. The eliminated costs also include
depreciation from disposed equipment and rental payments from the termination of
lease agreements. We continued restructuring initiatives during the
year ended December 25, 2009 that were implemented in the years ended December
26, 2008 and December 27, 2007 in order to reduce our cost structure and
capacity.
Year Ended December 25,
2009
During
the year ended December 25, 2009, we determined that approximately $71.0 million
of our wireless group’s goodwill was impaired. Refer to Note 5 for
further details. Additionally, we incurred a charge of $11.9 million
for a number of cost reduction actions. These charges include
severance and related payments of $3.0 million and fixed asset impairments of
$8.9 million. The impaired assets include production lines associated
with products that have no expected future demand and two properties which were
disposed.
Of the
$3.0 million severance charges incurred during the year ended December 25, 2009,
approximately $1.0 million related to the transfer of production operations from
our facilities in Europe and North Africa to China. This program
began in 2007 and was substantially complete at the end of 2009. The
$1.0 million consists of a $1.6 million charge to adjust the liability to
reflect the final negotiated benefits for approximately 45 employees that was
reduced by a $0.6 million adjustment in the accrual to reflect final benefit
projections for approximately 90 employees.
During
the year ended December 26, 2008, we initiated a restructuring program at our
European, Asian and North American operations to reduce company-wide costs,
which included direct and indirect labor reductions. During the year
ended December 25, 2009, we incurred a charge for severance of $1.7 million and
other associated costs of $0.3 million in conjunction with this
program. There were approximately 320 employees severed under these
programs.
Year Ended December 26,
2008
During
the year ended December 26, 2008, we determined that $310.4 million of goodwill
and other intangibles were impaired, including $170.3 million of goodwill and
identifiable intangibles of a discontinued operation. Additionally,
we incurred a charge of $13.2 million to our continuing operations for a number
of cost reduction actions. These charges include severance and
related payments and other associated costs of $5.5 million resulting from the
termination of manufacturing and support personnel at our operations primarily
in Asia, Europe and North America and $4.1 million of other costs primarily
resulting from the transfer of manufacturing operations from Europe and North
Africa to Asia. Additionally, we recorded fixed asset impairments of
$3.6 million.
We
incurred approximately $4.7 million related to the transfer of production in
Europe and North Africa to China. The $4.7 million charge included
$0.7 million to adjust a liability recorded in 2007 to reflect updated benefit
projections for approximately 150 employees. Additionally, we
incurred approximately $4.0 million of other plant closure, relocation and
similar costs associated with this action.
During
2008, we initiated other restructuring programs at our European, Asian and North
American operations, which we incurred a charge for severance of $4.8 million
and other associated costs of $0.1 million in conjunction with these
programs. There were approximately 1,600 employees severed under
these programs.
Technitrol,
Inc. and Subsidiaries
Notes to Consolidated Financial
Statements, continued
|
(15)
|
Severance, Impairment
and Other Associated Costs,
continued
|
Year ended December 28,
2007
During
the year ended December 28, 2007, we incurred a charge of $17.6 million for cost
reduction actions. These include severance and related payments of
$10.6 million resulting from the termination of approximately 900 manufacturing
and support personnel in Asia, Europe and North America, $5.5 million for the
write down of certain fixed assets to their disposal values and, additionally,
we incurred approximately $1.5 million of other plant closure, relocation and
similar costs associated with these actions. Of the total $17.6
million of charges, approximately $13.8 million related to programs initiated in
2006.
The
change in our accrual related to severance, impairment and other associated
costs of our continuing operations in 2009, 2008 and 2007 is summarized as
follows (in
millions):
|
Balance
accrued at December 29, 2006
|
$ | 3.8 | ||
|
Expensed
during the year ended December 28, 2007
|
17.6 | |||
|
Severance
payments
|
(4.3 | ) | ||
|
Other
associated costs
|
(1.7 | ) | ||
|
Fixed
asset impairments and currency translation adjustments
|
(4.6 | ) | ||
|
Balance
accrued at December 28, 2007
|
10.8 | |||
|
Expensed
during the year ended December 26, 2008
|
13.2 | |||
|
Acquisition
accruals
|
0.8 | |||
|
Severance
payments
|
(8.5 | ) | ||
|
Other
associated costs
|
(4.3 | ) | ||
|
Fixed
asset impairments and currency translation adjustments
|
(4.2 | ) | ||
|
Balance
accrued at December 26, 2008
|
7.8 | |||
|
Expensed
during the year ended December 25, 2009
|
11.9 | |||
|
Severance
payments
|
(7.3 | ) | ||
|
Other
associated costs
|
(0.5 | ) | ||
|
Fixed
asset impairments and currency translation adjustments
|
(10.5 | ) | ||
|
Balance
accrued at December 25, 2009
|
$ | 1.4 |
The
ending balance accrued at December 25, 2009 primarily relates to future rental
payments, severance and other related charges incurred related to the transfer
of our productions from Europe to China.
|
(16)
|
Financial
Instruments
|
We
utilize derivative financial instruments, primarily forward exchange contracts,
to manage foreign currency risk. While these instruments are subject to
fluctuations in value, such fluctuations are generally offset by the value of
the underlying exposure being hedged. During the year ended December 25, 2009,
we utilized forward contracts to sell forward U.S. dollar to receive Danish
krone and to sell forward euro to receive Chinese renminbi. These
contracts are used to mitigate the risk of currency fluctuations at our current
operations in the PRC and our former operations in Denmark. At December 25,
2009, we had seven foreign exchange forward contracts outstanding to sell
forward approximately 7.0 million euro, or approximately $10.1 million, to
receive Chinese renminbi. The fair value of these forward contracts was a
liability of $0.2 million as determined through use of Level 2 inputs as defined
in ASC Topic 815. At December 26, 2008, we had twelve foreign
exchange forward contracts outstanding to sell forward approximately $12.0
million U.S. dollars to receive Danish krone, and eight foreign exchange forward
contracts outstanding to sell forward approximately 8.0 million euro, or
approximately $11.3 million, to receive Chinese renminbi. The fair
value of these forward contracts was an asset of $0.1 million as determined
through use of Level 2 inputs. For the years ended December 25, 2009 and
December 26, 2008 we had no financial instruments that were designated as
hedges.
Technitrol,
Inc. and Subsidiaries
Notes to Consolidated Financial
Statements, continued
|
(16)
|
Financial
Instruments, continued
|
The
following presents the classifications and fair values of our derivative
instruments not designated as hedges in our Consolidated Balance Sheets and our
Consolidated Statements of Operations (in thousands):
Consolidated
Balance Sheets
((Liability)/asset
derivative)
|
Derivatives
|
Classification
|
December
25,
2009
|
December
26,
2008
|
|||||||
|
Foreign
exchange forward contracts
|
Prepaid
expenses and other current assets
|
$ | -- | $ | 0.1 | |||||
|
Foreign
exchange forward contracts
|
Accrued
expenses and other current liabilities
|
(0.2 | ) | -- | ||||||
|
Total
|
$ | (0.2 | ) | $ | 0.1 | |||||
Consolidated
Statement of Operations
(Unrealized/realized
gains/(losses))
|
Year Ended
|
||||||||||
|
Derivatives
|
Classification
|
December
25,
2009
|
December
26,
2008
|
|||||||
|
Foreign
exchange forward contracts
|
Other
(expense) income, net
|
$ | (0.4 | ) | $ | 0.3 | ||||
|
Total
|
$ | (0.4 | ) | $ | 0.3 | |||||
We have
categorized our recurring financial assets and liabilities on our consolidated
balance sheet into a three-level fair value hierarchy based on inputs used for
valuation, which are categorized as follows:
Level 1
– Financial assets and liabilities whose values are based on quoted
prices for identical assets or liabilities in an active public
market.
Level 2
– Financial assets and liabilities whose values are based on quoted
prices in markets that are not active or a valuation using model inputs that are
observable for substantially the full term of the asset or
liability.
Level 3
– Financial assets and liabilities whose values are based on prices
or valuation techniques that require inputs that are both unobservable and
significant to the overall fair value measurement.
These
inputs reflect management’s assumptions and judgments when pricing the asset or
liability.
The
following table presents our fair value hierarchy for those financial assets and
liabilities measured at fair value on a recurring basis in our consolidated
balance sheets as of December 25, 2009 (in millions):
|
2009
|
Quoted
Prices In Active Markets for Identical Assets
(Level 1)
|
Significant
Other Observable Inputs
(Level 2)
|
Significant
Unobservable Inputs
(Level 3)
|
|||||||||||||
|
Assets
|
|
|||||||||||||||
|
Available-for-sale
securities (1)
|
$ | 7.4 | $ | 7.4 | $ | -- | $ | -- | ||||||||
|
Total
|
$ | 7.4 | $ | 7.4 | $ | -- | $ | -- | ||||||||
|
Liabilities
|
||||||||||||||||
|
Other
(2)
|
$ | (0.2 | ) | $ | -- | $ | (0.2 | ) | $ | -- | ||||||
|
Total
|
$ | (0.2 | ) | $ | -- | $ | (0.2 | ) | $ | -- | ||||||
|
|
(1)
|
Amounts
include grantor trust investments in our consolidated balance
sheet.
|
|
|
(2)
|
Amounts
include forward contracts outstanding in our consolidated balance
sheet.
|
Technitrol,
Inc. and Subsidiaries
Notes to Consolidated Financial
Statements, continued
|
(16)
|
Financial
Instruments, continued
|
We do not
currently have non-financial assets and non-financial liabilities that are
required to be measured at fair value on a recurring
basis. Management believes that there is no material risk of loss
from changes in inherent market rates or prices in our financial instruments due
to the materiality of our financial instruments in relation to our Consolidated
Balance Sheet.
Our
financial instruments, including cash and cash equivalents and long-term debt,
our financial assets, including accounts receivable and inventories, and our
financial liabilities, including accounts payable and accrued expenses, are
exposed to both interest rate risk and foreign currency risk. We have
policies relating to these financial instruments and their associated risks and
monitor compliance with these policies. All of our financial
instruments and financial assets approximate fair value, as presented on our
Consolidated Balance Sheets. Particularly, all the outstanding
borrowings under our current credit facilities have variable interest rates that
approximate their fair value. Also, the fair value of our convertible
senior notes approximates its carrying value as the notes were issued on
December 22, 2009, three days before our December 25, 2009 balance sheet
date.
|
(17)
|
Supplementary
Information
|
The
following amounts were charged directly to costs and expenses for our continuing
operations in the years ended December 25, 2009, December 26, 2008 and December
27, 2007 (in
thousands):
|
2009
|
2008
|
2007
|
||||||||||
|
Depreciation
|
$ | 14,891 | $ | 21,645 | $ | 22,091 | ||||||
|
Amortization
of intangible assets
|
$ | 3,563 | $ | 5,570 | $ | 5,296 | ||||||
|
Advertising
|
$ | 136 | $ | 325 | $ | 458 | ||||||
|
Repairs
and maintenance
|
$ | 8,879 | $ | 12,397 | $ | 12,950 | ||||||
|
Bad
debt expense
|
$ | 330 | $ | 335 | $ | 579 | ||||||
|
Cash
payments made:
|
||||||||||||
|
Income
taxes
|
$ | 7,256 | $ | 7,735 | $ | 5,824 | ||||||
|
Interest
|
$ | 1,989 | $ | 3,588 | $ | 2,000 | ||||||
A
reconciliation of our accumulated balances for each classification of other
comprehensive income for the years ended December 25, 2009, December 26, 2008
and December 28, 2007, respectively, is as follows (in thousands):
|
Defined
Benefit Plan
Adjustments
|
Currency
Translation
Adjustments
|
Unrealized
Holding Gains/(Losses) on
Securities
|
Total
|
|||||||||||||
|
Balance
at December 28, 2007
|
$ | 137 | $ | 48,653 | $ | 648 | $ | 49,438 | ||||||||
|
Current
year changes
|
(4,759 | ) | (68,912 | ) | (2,393 | ) | (76,064 | ) | ||||||||
|
Balance
at December 26, 2008
|
$ | (4,622 | ) | $ | (20,259 | ) | $ | (1,745 | ) | $ | (26,626 | ) | ||||
|
Current
year changes
|
4,696 | 48,444 | 1,790 | 54,930 | ||||||||||||
|
Balance
at December 25, 2009
|
$ | 74 | $ | 28,185 | $ | 45 | $ | 28,304 | ||||||||
Technitrol,
Inc. and Subsidiaries
Notes to Consolidated Financial
Statements, continued
|
(18)
|
Quarterly Financial
Data (Unaudited)
|
Quarterly
results of continuing operations (unaudited) for the years ended December 25,
2009 and December 26, 2008 are summarized as follows (in thousands, except per share
data):
|
Quarter Ended
|
||||||||||||||||
|
2009:
|
Mar. 27 (1)
|
June 26 (1)
|
Sept. 25
|
Dec. 25
|
||||||||||||
|
Net
sales
|
$ | 99,973 | $ | 92,071 | $ | 101,381 | $ | 105,378 | ||||||||
|
Gross
profit
|
22,469 | 23,424 | 27,227 | 27,648 | ||||||||||||
|
Net
(loss) earnings from continuing operations
|
$ | (73,495 | ) | $ | (4,893 | ) | $ | 2,274 | $ | 3,255 | ||||||
|
Net
loss from discontinued operations
|
(1,065 | ) | (103,100 | ) | (13,358 | ) | (2,455 | ) | ||||||||
|
Net
loss (earnings) attributable to non-controlling interest
|
12 | (111 | ) | (352 | ) | 76 | ||||||||||
|
Net
(loss) earnings attributable to Technitrol, Inc.
|
$ | (74,548 | ) | $ | (108,104 | ) | $ | (11,436 | ) | $ | 876 | |||||
|
Basic
(loss) earnings per share
|
$ | (1.83 | ) | $ | (2.65 | ) | $ | (0.28 | ) | $ | 0.02 | |||||
|
Diluted
(loss) earnings per share
|
$ | (1.83 | ) | $ | (2.65 | ) | $ | (0.28 | ) | $ | 0.02 | |||||
|
|
(1)
|
During
the first quarter of 2009, we recorded a $68.9 million goodwill
impairment. During the second quarter of 2009, we finalized our
impairment analysis and recoded an additional $2.1 million
charge. Refer to Note 5 of the Consolidated Financial
Statements for a description of the
impairment.
|
|
Quarter Ended
|
||||||||||||||||
|
2008:
|
Mar. 29
|
June 27
|
Sept. 26
|
Dec. 26 (2)
|
||||||||||||
|
Net
sales
|
$ | 158,452 | $ | 174,552 | $ | 168,974 | $ | 124,292 | ||||||||
|
Gross
profit
|
39,173 | 38,343 | 42,635 | 28,356 | ||||||||||||
|
Net
earnings (loss) from continuing operations
|
$ | 14,018 | $ | (2,638 | ) | $ | 9,678 | $ | (144,611 | ) | ||||||
|
Net
earnings (loss) from discontinued operations
|
800 | 2,427 | (4,123 | ) | (150,571 | ) | ||||||||||
|
Net
earnings attributable to non-controlling interest
|
(81 | ) | (313 | ) | (204 | ) | (140 | ) | ||||||||
|
Net
earnings (loss) attributable to Technitrol, Inc.
|
$ | 14,737 | $ | (524 | ) | $ | 5,351 | $ | (295,322 | ) | ||||||
|
Basic
earnings (loss) per share
|
$ | 0.36 | $ | (0.01 | ) | $ | 0.13 | $ | (7.24 | ) | ||||||
|
Diluted
earnings per (loss) share
|
$ | 0.36 | $ | (0.01 | ) | $ | 0.13 | $ | (7.24 | ) | ||||||
|
|
(2)
|
During
the fourth quarter of 2008, we recorded a $310.4 million goodwill and
intangible asset impairment, $170.3 million of which was related to a
discontinued operation. Refer to Note 5 of the Consolidated
Financial Statements for a description of the
impairment.
|
|
(19)
|
Segment and
Geographical Information
|
During
2009, we announced our intention to explore monetization alternatives with
respect to our Electrical segment and determined that Electrical met the
qualifications to be reported as a discontinued operation on our Consolidated
Statements of Operations. The assets and liabilities of Electrical
are considered held for sale on our Consolidated Balance Sheets. As a
result of reporting Electrical as a discontinued operation, we currently have
one reportable segment: our Electronic Components segment. We refer
to this segment as Electronics, however, it is known as Pulse in its primary
markets.
We design
and manufacture a wide variety of highly-customized electronic components and
modules in three primary product groups. Our wireless group produces wireless
antennas and antenna modules that capture communications signals in handsets,
other mobile and portable devices, automobiles and wireless-to-wireline access
points. Also, they produce receivers and speakers which capture and
convert communication signals into sound in handsets and a variety of other
mobile and portable devices. Our network group primarily produces
passive magnetics-based components that manage and regulate electronic signals
and power for use in a variety of devices by filtering out radio frequency
interference. Our passive magnetics-based products are often referred
to as chokes, inductors, filters and transformers. Our power group includes
power and signal transformers, automotive coils, military and aerospace and
other power magnetics products. We sell our products to
multinational original equipment manufacturers, original design manufacturers,
contract manufacturers and distributors. Through a majority-owned subsidiary,
which we refer to as FRE, we also supply a variety of electronic connectors,
modules, and other accessories.
Technitrol,
Inc. and Subsidiaries
Notes to Consolidated Financial
Statements, continued
|
(19)
|
Segment and
Geographical Information,
continued
|
For the
year ended December 25, 2009, there were immaterial amounts of intergroup
revenues eliminated in consolidation. We sell our products to
customers throughout the world. The following table summarizes our
sales to customers in geographic areas where our sales are
significant. Other countries in which our sales are not significant
are grouped into regions. We attribute customer sales to the country
addressed in the sales invoice, as the product is usually shipped to the same
country (in
thousands):
|
2009
|
2008
|
2007
|
||||||||||
|
Sales
to customers in:
|
||||||||||||
|
China
|
$ | 167,772 | $ | 234,276 | $ | 271,041 | ||||||
|
Asia,
other than China
|
77,464 | 118,844 | 79,073 | |||||||||
|
Europe,
other than Germany
|
60,567 | 107,785 | 147,019 | |||||||||
|
United
States
|
40,268 | 54,760 | 71,293 | |||||||||
|
Germany
|
32,295 | 72,230 | 67,031 | |||||||||
|
Other
|
20,437 | 38,375 | 36,112 | |||||||||
|
Total
|
$ | 398,803 | $ | 626,270 | $ | 671,569 | ||||||
The
following table includes net property, plant and equipment located in geographic
areas where our assets are significant. Other countries in which such
assets are not significant are grouped into regions. Property, plant
and equipment represent all of our relevant assets that have long useful lives
(in
thousands):
|
2009
|
2008
|
|||||||
|
Net
property, plant and equipment located in (1):
|
||||||||
|
China
|
$ | 30,918 | $ | 47,704 | ||||
|
United
States
|
4,572 | 8,023 | ||||||
|
North
Africa
|
2,562 | 5,301 | ||||||
|
Germany
|
1,036 | 23,803 | ||||||
|
Europe,
other than Germany and Denmark
|
721 | 9,395 | ||||||
|
Denmark
|
481 | 25,845 | ||||||
|
Other
|
114 | 3,845 | ||||||
|
Vietnam
|
-- | 28,815 | ||||||
|
Total
|
$ | 40,404 | $ | 152,731 | ||||
|
|
(1)
|
Property
plant and equipment at December 26, 2008 includes approximately $90.1
million related to our discontinued
operations.
|
|
(20)
|
Subsequent
Events
|
On
January 4, 2010, we sold certain net assets of Electrical’s North American
business for an amount immaterial to our Consolidated Financial
Statements. Electrical’s North American business has manufacturing
facilities in Export, Pennsylvania, Luquillo, Puerto Rico and Mexico City,
Mexico. The rivet production operations located in Mexico City were
not part of the sale agreement, as these operations are expected to be sold as
part of Electrical’s operations in Europe and Asia. We have applied
the net proceeds from the sale of the North American business to the outstanding
debt under our revolving credit facility.
On
February 22, 2010 we announced that our board of directors has named Daniel M.
Moloney our next chief executive officer, replacing James M. Papada, III, who is
retiring, pursuant to a plan announced to the board in 2008. Mr.
Moloney comes to Technitrol from Motorola, Inc., where he served most recently
as Executive Vice President and President of its Home and Network Mobility
business, a leading provider of integrated and customized end-to-end media
solutions for cable, wireline, and wireless service providers. He
played a leading role in expanding the breadth and global presence of this
business. Mr. Moloney served nearly 10 years in senior-level
capacities at Motorola and, previously, 16 years in managerial positions of
increasing responsibility at General Instrument Corporation before its
acquisition by Motorola early in 2000. He holds a bachelor's degree
in electrical engineering from the University of Michigan and a master of
business administration from the University of Chicago. Mr. Moloney
is expected to join Technitrol at the end of March 2010.
We have
evaluated from December 25, 2009, the date of these financial statements, to the
date the financial statements herein were issued, for subsequent events
requiring recognition or disclosure. The events included above are the only
material occurrences.
Technitrol,
Inc. and Subsidiaries
Financial
Statement Schedule II
Valuation
and Qualifying Accounts
In
thousands
|
Additions (Deductions)
|
||||||||||||||||||||
|
Description
|
Opening Balance
|
Discontinued Operations
|
Charged
to Costs and Expenses
|
Write-offs
and Payments
|
Ending Balance
|
|||||||||||||||
|
Year ended December 25,
2009:
|
||||||||||||||||||||
|
Provisions
for obsolete and slow-moving inventory
|
$ | 15,355 | $ | (8,079 | ) | $ | 4,260 | $ | (5,880 | ) | $ | 5,656 | ||||||||
|
Allowances
for doubtful accounts
|
$ | 2,456 | $ | (776 | ) | $ | 330 | $ | (633 | ) | $ | 1,377 | ||||||||
|
Year ended December 26,
2008:
|
||||||||||||||||||||
|
Provisions
for obsolete and slow-moving inventory
|
$ | 12,949 | $ | -- | $ | 15,883 | $ | (13,477 | ) | $ | 15,355 | |||||||||
|
Allowances
for doubtful accounts
|
$ | 2,385 | $ | -- | $ | 1,106 | $ | (1,035 | ) | $ | 2,456 | |||||||||
|
Year ended December 28,
2007:
|
||||||||||||||||||||
|
Provisions
for obsolete and slow-moving inventory
|
$ | 11,255 | $ | -- | $ | 9,122 | $ | (7,428 | ) | $ | 12,949 | |||||||||
|
Allowances
for doubtful accounts
|
$ | 1,833 | $ | -- | $ | 1,704 | $ | (1,152 | ) | $ | 2,385 | |||||||||
|
Exhibit Index
|
|
|
2.1
|
Share
Purchase Agreement dated June 2, 2009 between Pulse Denmark ApS and Xilco
A/S (incorporated by reference to Exhibit 2.1 to our Form 8-K dated June
2, 2009).
|
|
3.1
|
Amended
and Restated Articles of Incorporation (incorporated by reference to
Exhibit 3.1 to our Form 8-K dated December 3, 2009).
|
|
3.3
|
By-laws
(incorporated by reference to Exhibit 3.3 to our Form 8-K dated December
27, 2007).
|
|
4.1
|
Rights
Agreement, dated as of August 30, 1996, between Technitrol, Inc. and
Registrar and Transfer Company, as Rights Agent (incorporated by reference
to Exhibit 3 to our Registration Statement on Form 8-A dated October 24,
1996).
|
|
4.2
|
Amendment
No. 1 to the Rights Agreement, dated March 25, 1998, between Technitrol,
Inc. and Registrar and Transfer Company, as Rights Agent (incorporated by
reference to Exhibit 4 to our Registration Statement on Form 8-A/A dated
April 10, 1998).
|
|
4.3
|
Amendment
No. 2 to the Rights Agreement, dated June 15, 2000, between Technitrol,
Inc. and Registrar and Transfer Company, as Rights Agent (incorporated by
reference to Exhibit 5 to our Registration Statement on Form 8-A/A dated
July 5, 2000).
|
|
4.4
|
Amendment
No. 3 to the Rights Agreement, dated September 9, 2006, between
Technitrol, Inc. and Registrar and Transfer Company, as Rights
Agent (incorporated by reference to Exhibit 4.4 to our Form 10-Q for the
nine months ended September 26, 2008).
|
|
4.5
|
Amendment
No. 4 to the Rights Agreement, dated September 5, 2008, between
Technitrol, Inc. and Registrar and Transfer Company, as Rights Agent
(incorporated by reference to Exhibit 4.5 to our Form 10-Q for the nine
months ended September 26, 2008).
|
|
4.6
|
Indenture
between the Company and Wells Fargo Bank, National Association, dated as
of December 22, 2009 (incorporated by reference to Exhibit 4.1 to our Form
8-K dated December 22, 2009).
|
|
4.7
|
Form
of 7.00% Convertible Senior Note due 2014 (incorporated by reference to
Exhibit 4.2 to our Form 8-K dated December 22, 2009).
|
|
10.1
|
Technitrol,
Inc. 2001 Employee Stock Purchase Plan (incorporated by reference to
Exhibit 4.1 to our Registration Statement on Form S-8 dated June 28, 2001,
File Number 333-64060).
|
|
10.1(1)
|
Form
of Stock Option Agreement (incorporated by reference to Exhibit 10.1(1) to
our Form 10-Q for the nine months ended October 1,
2004).
|
|
10.2
|
Technitrol,
Inc. Restricted Stock Plan II, as amended and restated as of February 15,
2008 (incorporated by reference to Exhibit 10.2 to our Form 10-Q for the
three months ended March 28, 2008).
|
|
10.3
|
Technitrol,
Inc. 2001 Stock Option Plan (incorporated by reference to Exhibit 4.1 to
our Registration Statement on Form S-8 dated June 28, 2001, File Number
333-64068).
|
|
10.4
|
Technitrol,
Inc. Board of Directors Stock Plan, as amended (incorporated by reference
to Exhibit 10.4 to our Form 8-K dated May 15, 2008).
|
|
10.5
|
Credit
Agreement, amended and restated as of February 19, 2009, among Technitrol,
Inc. and certain of its subsidiaries, JPMorgan Chase Bank, N.A. as
administrative agent, swing line lender and a letter of credit issuer, and
other lenders party thereto (incorporated by reference to Exhibit 10.5 to
our Form 10-Q for the three months ended March 27,
2009).
|
|
10.5(1)
|
Amendment
No. 1 dated as of June 2, 2009 among Technitrol, Inc. and certain of its
subsidiaries, JPMorgan Chase Bank, N.A. and other lenders party thereto
(incorporated by reference to Exhibit 10.5(1) to our Form 8-K dated June
8, 2009).
|
|
10.5(2)
|
Waiver
dated as of June 10, 2009 among Technitrol, Inc., JPMorgan Chase Bank,
N.A. and other lenders party thereto (incorporated by reference to Exhibit
10.5(2) to our Form 8-K dated June 15, 2009).
|
|
10.5(3)
|
Amendment
No. 2 dated as of December 22, 2009 among Technitrol, Inc. and certain of
its subsidiaries, JPMorgan Chase Bank, N.A and other lenders party thereto
(incorporated by reference to Exhibit 10.1 to our Form 8-K dated December
22, 2009).
|
|
Exhibit Index,
continued
|
|
|
10.7
|
Incentive
Compensation Plan of Technitrol, Inc. (incorporated by reference to
Exhibit 10.7 to Amendment No. 1 our Registration Statement on Form S-3
filed on February 28, 2002, File Number 333-81286).
|
|
10.8(1)
|
Technitrol,
Inc. Grantor Trust Agreement dated July 5, 2006 between Technitrol, Inc.
and Wachovia Bank, National Association (incorporated by reference to
Exhibit 10.8(1) to our Form 8-K dated July 11, 2006).
|
|
10.8(2)
|
Technitrol,
Inc. Supplemental Retirement Plan amended and restated effective December
31, 2004 (incorporated by reference to Exhibit 10.8(2) to our Form 8-K
dated December 31, 2008).
|
|
10.8(3)
|
Agreement
dated September 24, 2009 (incorporated by reference to Exhibit 10.8(3) to
our Form 8-K dated September 24, 2009).
|
|
10.9
|
Agreement
between Technitrol, Inc. and James M. Papada, III, dated July 1, 1999, as
amended April 23, 2001, relating to the Technitrol, Inc. Supplemental
Retirement Plan (incorporated by reference to Exhibit 10.9 to Amendment
No. 1 to our Registration Statement on Form S-3 filed on February 28,
2002, File Number 333-81286).
|
|
10.10
|
Letter
Agreement between Technitrol, Inc. and James M. Papada, III, dated April
16, 1999, as amended October 18, 2000 (incorporated by reference to
Exhibit 10.10 to Amendment No. 1 to our Registration Statement on Form S-3
filed on February 28, 2002, File Number 333-81286).
|
|
10.10(1)
|
Letter
Agreement between Technitrol, Inc. and James M. Papada, III dated April
25, 2007 (incorporated by reference to Exhibit 10.10(1) to our Form 8-K
dated May 1, 2007).
|
|
10.10(2)
|
Modification
to Letter Agreement agreed to on February 15, 2008 (incorporated by
reference to Exhibit 10.10(2) to our Form 8-K dated February 22,
2008).
|
|
10.11
|
Form
of Indemnity Agreement (incorporated by reference to Exhibit 10.11 to our
Form 10-K for the year ended December 28, 2001).
|
|
10.12
|
Technitrol
Inc. Supplemental Savings Plan (incorporated by reference to Exhibit 10.15
to our Form 10-Q for the nine months ended September 26,
2003).
|
|
10.13
|
Technitrol,
Inc. 401(k) Retirement Savings Plan, as amended (incorporated by reference
to post-effective Amendment No. 1, to our Registration Statement on Form
S-8 filed on October 31, 2003, File Number 033-35334).
|
|
10.13(1)
|
Amendment
No. 1 to Technitrol, Inc. 401(k) Retirement Savings Plan, dated December
31, 2006 (incorporated by reference to Exhibit 10.13(1) to our Form 10-K
for the year ended December 29, 2006).
|
|
10.14
|
Pulse
Engineering, Inc. 401(k) Plan as amended (incorporated by reference to
post-effective Amendment No. 1, to our Registration Statement on Form S-8
filed on October 31, 2003, File Number 033-94073).
|
|
10.14(1)
|
Amendment
No. 1 to Pulse Engineering, Inc. 401(k) Plan, dated December 31, 2006
(incorporated by reference to Exhibit 10.14(1) to our Form 10-K for the
year ended December 29, 2006).
|
|
10.15
|
Amended
and Restated Short-Term Incentive Plan (incorporated by reference to
Exhibit 10.15 to our Form 10-K for the year ended December 31,
2005).
|
|
10.18(1.0)
|
Amended
and Restated Fee Consignment and/or Purchase of Silver Agreement dated
August 4, 2006 among The Bank of Nova Scotia, AMI Doduco, Inc., AMI Doduco
Espana, S.L. and AMI Doduco GmbH (incorporated by reference to Exhibit
10.18 to our Form 10-K for the year ended December 28,
2007).
|
|
10.18(1.1)
|
Letter
Amendment dated November 7, 2007
among The Bank of Nova Scotia, AMI Doduco, Inc.,
AMI Doduco Espana, S.L. and AMI Doduco GmbH (incorporated
by reference to Exhibit 10.18 (1) to our
Form 10-K for the year ended December 28,
2007).
|
|
Exhibit Index,
continued
|
|
|
10.18(1.2)
|
Letter Amendment dated
May 8, 2008 among The Bank of
Nova Scotia, AMI Doduco, Inc., AMI Doduco Espana, S.L.
and AMI Doduco GmbH (incorporated by
reference to Exhibit 10.18 (1.2) to our Form 10-Q for the six months ended
September 26, 2008).
|
|
10.18(1.3)
|
Amendment
dated March 19, 2009 among the Bank of Nova Scotia, AMI Doduco, Inc., AMI
Doduco Espana, S.L., AMI Doduco GmbH and AMI Doduco (Mexico) S. de R.L. de
C.V. (incorporated by reference to Exhibit 10.18(1.0) to our Form 10-Q for
the three months ended March 27, 2009).
|
|
10.18(2)
|
Guarantee
dated September 8, 2006 executed by Technitrol, Inc. in favor
of The Bank of Nova Scotia
(incorporated by reference to Exhibit 10.18(3) to our Form 10-K for the
year ended December 28, 2007).
|
|
10.19(1)
|
Consignment
Agreement dated September 24, 2005 between Mitsui &
Co. Precious Metals Inc., and AMI Doduco, Inc. (incorporated by
reference to Exhibit 10.19 to our Form 8-K dated March 28,
2006).
|
|
10.19(2)
|
Amendment
to Consignment Agreement dated April 2, 2009 among Mitsui & Co.
Precious Metals, Inc., AMI Doduco, Inc., AMI Doduco GmbH and AMI Doduco
Espana, S.L. (incorporated by reference to Exhibit 10.19(1) to our Form
10-Q for the three months ended March 27, 2009).
|
|
10.19(3)
|
Corporate
Guaranty dated November 1, 2004 by Technitrol, Inc. in favor of Mitsui
& Co. Precious Metals, Inc. (incorporated by reference to Exhibit
10.21 to our Form 10-Q for the nine months ended October 1,
2004).
|
|
10.20
|
Form
of Silver Consignment/Purchase Agreement dated April 20, 2009 between
Mitsubishi International Corporation and each of AMI Doduco Espana, S.L.,
AMI Doduco GmbH, AMI Doduco, Inc. and AMI Doduco (Mexico) S. de R.L. de
C.V. (incorporated by reference to Exhibit 10.20 to our Form 8-K dated May
11, 2009).
|
|
10.22
|
Amended
and Restated Fee Consignment and/or Purchase of Silver Agreement dated
February 12, 2008 among HSBC Bank USA, National Association, AMI Doduco,
Inc. and Technitrol, Inc. (incorporated by reference to Exhibit 10.22 to
our Form 8-K dated February 22, 2008).
|
|
10.25
|
CEO
Annual and Long-Term Equity Incentive Process (incorporated by reference
to Exhibit 10.25 to our Form 10-Q for the three months ended March 28,
2008).
|
|
10.26
|
Letter
Agreement between Technitrol, Inc. and Michael J. McGrath dated March 7,
2007 (incorporated by reference to Exhibit 10.2 to our Form 10-Q for the
nine months ended September 28, 2007).
|
|
10.27
|
Letter
Agreement between Technitrol, Inc. and Drew A. Moyer dated July 23, 2008
(incorporated by reference to Exhibit 10.27 to our Form 8-K dated July 29,
2008).
|
|
10.28
|
Letter
Agreement between Technitrol, Inc. and Toby Mannheimer dated August 11,
2008 (incorporated by reference to Exhibit 10.28 to our Form 10-Q for the
nine months ended September 26, 2008).
|
|
10.29
|
Letter
Agreement among Technitrol Inc., Pulse Engineering, Inc. and Alan H.
Benjamin dated July 22, 2009 (incorporated by reference to Exhibit 10.29
to our Form 8-K dated August 7, 2009).
|
|
10.30
|
Schedule
of Board of Director and Committee Fees (incorporated by reference to
Exhibit 10.30 to our Form 10-Q for the three months ended March 30,
2007).
|
|
Subsidiaries
of the Registrant
|
|
|
Consent
of Independent Registered Public Accounting Firm
|
|
|
Certification
of Principal Executive Officer pursuant to Section 302(a) of the
Sarbanes-Oxley Act of 2002.
|
|
Exhibit Index,
continued
|
|
|
Certification
of Principal Financial Officer pursuant to Section 302(a) of the
Sarbanes-Oxley Act of 2002.
|
|
|
Certification
of Principal Executive Officer pursuant to 18 U.S.C. Section 1350, as
adopted pursuant to Section 906 of the Sarbanes-Oxley Act of
2002.
|
|
|
Certification
of Principal Financial Officer pursuant to 18 U.S.C. Section 1350, as
adopted pursuant to Section 906 of the Sarbanes-Oxley Act of
2002.
|
Signatures
Pursuant
to the requirements of Section 13 or 15(d) of the Securities and Exchange Act of
1934, the registrant has duly caused this report to be signed on its behalf by
the undersigned, thereunto duly authorized.
TECHNITROL,
INC.
|
By
|
/s/James M. Papada, III
|
|
James
M. Papada, III
|
|
|
Chairman
and Chief Executive Officer
|
|
|
Date
|
February
24, 2010
|
Pursuant
to the requirements of the Securities Exchange Act of 1934, this report has been
signed below by the following persons on behalf of the registrant and in the
capacities and on the dates indicated.
|
By
|
/s/Alan E. Barton
|
By
|
/s/James M. Papada, III
|
|
|
Alan
E. Barton
|
James
M. Papada, III
|
|||
|
Director
|
Chairman
and Chief Executive Officer
|
|||
|
(Principal
Executive Officer)
|
||||
|
Date
|
February
24, 2010
|
|||
|
Date
|
February
24, 2010
|
|||
|
By
|
/s/John E. Burrows, Jr.
|
|||
|
John
E. Burrows, Jr.
|
By
|
/s/Drew A. Moyer
|
||
|
Director
|
Drew
A. Moyer
|
|||
|
Senior
Vice President
|
||||
|
Date
|
February
24, 2010
|
and
Chief Financial Officer
|
||
|
(Principal
Financial Officer)
|
||||
|
By
|
/s/David H. Hofmann
|
|||
|
David
H. Hofmann
|
Date
|
February
24, 2010
|
||
|
Director
|
||||
|
By
|
/s/Michael P. Ginnetti
|
|||
|
Date
|
February
24, 2010
|
Michael
P. Ginnetti
|
||
|
Corporate
Controller
|
||||
|
By
|
/s/Edward M. Mazze
|
and
Chief Accounting Officer
|
||
|
Edward
M. Mazze
|
(Principal
Accounting Officer)
|
|||
|
Director
|
||||
|
Date
|
February
24, 2010
|
|||
|
Date
|
February
24, 2010
|
|||
|
By
|
/s/C. Mark Melliar-Smith
|
|||
|
C.
Mark Melliar-Smith
|
||||
|
Director
|
||||
|
Date
|
February
24, 2010
|
|||
|
By
|
/s/Howard C. Deck
|
|||
|
Howard
C. Deck
|
||||
|
Director
|
||||
|
Date
|
February
24, 2010
|
79