Attached files
| file | filename |
|---|---|
| 8-K - FORM 8-K - ASHFORD HOSPITALITY TRUST INC | d410976d8k.htm |
 Exhibit 99.1 |
 Safe
Harbor 2
In keeping with the SEC’s “Safe Harbor” guidelines,
certain statements made during this presentation could be
considered forward-looking and subject to certain risks and
uncertainties that could cause results to differ materially from
those projected. When we use the words “will likely result,” “may,” “anticipate,” “estimate,”
“should,” “expect,” “believe,”
“intend,” or similar expressions, we intend to identify forward-looking statements.
Such forward-looking statements include, but are not limited to,
our business and investment strategy, our understanding of our
competition, current market trends and opportunities, projected operating results, and
projected capital expenditures.
These forward-looking statements are subject to known and unknown
risks and uncertainties, which could cause actual results to
differ materially from those anticipated including, without limitation: general volatility of the
capital markets and the market price of our common stock; changes in
our business or investment strategy; availability, terms and
deployment of capital; availability of qualified personnel; changes in our industry and the
market in which we operate, interest rates or the general economy, and
the degree and nature of our competition. These and other
risk factors are more fully discussed in the Company’s filings with the Securities and Exchange
Commission.
EBITDA is defined as net income before interest, taxes, depreciation
and amortization. EBITDA yield is defined as trailing twelve
month EBITDA divided by the purchase price. EBITDA, FFO, AFFO, CAD and other terms are
non-GAAP measures, reconciliations of which have been provided in
prior earnings releases and filings with the SEC.
This overview is for informational purposes only and is not an offer to
sell, or a solicitation of an offer to buy or sell, any
securities of Ashford Hospitality Trust, Inc. and may not be relied upon in connection with the purchase or
sale of any such security.
|
 Economic & Industry
Overview |
| Stock
Value
discussion
–
disclaimer
regarding
stock
price
projections
under
various
scenarios
–
it’s
all
math,
not
our
opinion of value |
 U.S.
Starting to Deleverage 4
Source:
U.S.
Federal
Reserve
&
Historical
Statistics
of
the
United
States:
-
Cambridge
0%
50%
100%
150%
200%
250%
300%
350%
400%
450%
Home Mortgage
Other Household Debt
State & Local Government
Federal Government
Total U.S. Debt as a % of GDP
Nonfinancial Business
Consumer Credit
Domestic Financial |
| -
Now before we dive into the specifics of our industry or our company, I’d like to discuss
briefly the macroeconomic backdrop we’re dealing with
-
The U.S. is currently experiencing deleveraging and positive, but sluggish, growth
-
GDP is a measure of how much we SPEND |
 Real
GDP Growth % 5
2011 Real GDP Growth: 1.7%
Source:
U.S.
Dept.
of
Commerce:
BEA&Historical
Statistics
of
the
United
States:
-
Cambridge |
| -
The U.S. left the gold standard in 1971
-
Most recessions are induced by the Fed through interest rate increases
-
Real growth has been in the 3-4% range
-
GDP is a measure of spending, not prosperity
-
Shocks, generally, have not caused recessions. These shocks include oil, war, financial,
etc. |
 Hotel Demand Driven by Economy
Source: Smith Travel Research & U.S. Dept. of Commerce: BEA
Hotel Demand Growth % vs. Real GDP Growth
6
R-squared = 0.61 |
| -
Demand for more hotel room nights matches growth in GDP fairly closely
-
I believe that because of our deleveraging, GDP, and therefore room night demand, will grow
fairly modestly over the next 5 to 7 years |
 U.S. Demand Will Outpace Supply
7
PKF Forecast
Source: Smith Travel Research & PKF |
 Real RevPAR is Cyclical
Source: Smith Travel Research & U.S. Dept. of Labor: BLS
Seasonally-Adjusted Real RevPAR
(2012$, Trailing 3-Mo Average)
8
$52
$54
$56
$58
$60
$62
$64
$66
$68
$70
$72
$74 |
 RevPAR Forecast -
PKF
Source: Smith Travel Research & PKF
9
5-Year RevPAR Growth CAGR: 5.8%
7.9%
6.1%
-2.0%
-16.7%
5.4%
8.2%
5.8%
6.6%
7.8%
5.9%
2.9%
-20.0%
-15.0%
-10.0%
-5.0%
0.0%
5.0%
10.0%
2006
2007
2008
2009
2010
2011
2012F
2013F
2014F
2015F
2016F
Historical RevPAR Growth
Forecasted RevPAR Growth |
| PKF’s 5-year RevPAR growth CAGR is about 5%, with PKF forecasting virtually
no growth in 2016 |
 Potential Industry EBITDA Growth Rates
10
With strong potential RevPAR gains, those companies with reasonable
flow-throughs could experience significant EBITDA growth
PKF estimates 5-year cumulative EBITDA growth of about 55%*
*Based
on
PKF
RevPAR/ADR/Occupancy
projections
and
EBITDA
growth
resulting
from
PKF
EBITDA
change
regression
equation |
| -
Given the strong potential 5-year RevPAR CAGRs, significant hotel EBITDA growth is possible
-
Also note how sensitive these EBITDA numbers are to flow-throughs – those companies
that achieve the best flow-throughs will have a real advantage in EBITDA growth -
Note that about 500 bps of increased flow at the same RevPAR growth rate equates to about the
same EBITDA growth as 50 bps of increased RevPAR growth at the same flow % -
According to PKF assumptions, hotel EBITDA should grow by approximately 40% over the next five
years; this is based on PKF’s EBITDA change regression equation, which is:
EBITDA change = -0.02 + 2.07*ADR change + 1.38*Occupancy change, R^2 = 0.97
-
If Ashford’s EBITDA grew by 40-80%, its stock price would be
$27-$46 |
 Advantages of Lodging REITs
11
Tax
benefits
High
-
quality
real estate
retains
value
Hard asset
Not a
financial
asset
Non
-
recourse
debt
Liquidity
Benefits
Inflation
hedge
Dividend
paying |
| -
Include double taxation issue as well as Bush tax cuts |
 |
 Attractive Dividend Yield & Coverage
13
Ashford has both a high dividend yield and strong dividend coverage
Source: Company filings, Bloomberg & First Call
|
| -
Ashford’s dividend yield AND dividend coverage exceed the peer average
-
Note that this TTM coverage will likely come down a bit due to the burning off of hedges, but
coverage will still remain strong |
 Total Shareholder Return
14
Peer
average
includes:
BEE,
CHSP,
CLDT,
DRH,
FCH,
HST,
HT,
LHO,
PEB,
SHO
Trailing Total Shareholder Returns as of 9/4/12
Source: Bloomberg |
| -
Ashford outperforms the peer index on a trailing basis for the past 2, 3, 4, 5, 6, 7 & 8
years -
On an IRR basis, the 3-year Ashford IRR is 27% vs the peer average of 23%, the 5-year
Ashford IRR is -2% vs the peer average IRR of - 13%; over 8 years, Ashford’s
IRR is 5% vs the peer average of -0.1% |
 Most Highly-Aligned Management
15
Insider ownership %
Source: Company Filings |
| -
Hersha’s insider ownership would be 4% when shares owned by a real estate company in
Argentina, attributed to one of their Board members, are excluded
-
EVERY employee at Ashford owns stock, and all the senior executives at REMINGTON, our property
manager affiliate, own material amounts of stock |
 Upcoming Maturities & Debt Yields
16
Upcoming maturities through 2014 include:
TTM June 2012 weighted average debt yields on these maturities are
13.6%
Aareal Torrey Pines /
Capital Hilton
$143.7M
Matures Aug 2013
13.5% TTM Debt Yield
Highland Cigna Loans
$101.4M
Matures Jan-Apr 2013
17.2% TTM Debt Yield
UBS Pool 1
$105.8M
Matures Dec 2014
10.5% TTM Debt Yield
GEMSA Manchester
Courtyard
$5.4M
Matures May 2014
9.2% TTM Debt Yield |
| -
Through 2014 Ashford has $378 million of debt coming due
-
With the exception of the Hilton El Conquistador, which has negative NOI, which we are
currently trying to sell, all of this debt is fully refinanceable today based on the TTM
debt yields -
Prudential, two hotels, $144.7 million, comes due in Aug 2013, TTM debt yield of 12.7%
-
Cigna, three hotels, $101.9 million (AHT share), comes due in the first quarter of 2013, TTM
debt yield of 16.1%
-
UBS 1 Pool is a securitized loan with 8 properties, $106.3 million, comes due in Dec 2014, TTM
debt yield of 10.2%
-
GEMSA, 1 hotel, $5.4 million, comes due in May 2014, TTM debt yield of 9.0%
-
Through 2014 our debt is clearly refinanceable today and the fundamentals are getting better
with our quarterly property level EBITDA improvement |
 Available Liquidity
17
Undrawn
$145m
credit
facility
$139m of
unrestricted
cash at end
of Q2 ‘12
Preferred
equity ATM
facility
Common
equity ATM
facility
Potential
refinancing
proceeds
Excess cash
flow
Available
Liquidity |
| -
We have many sources of liquidity should we need or choose to tap into
-
We currently have zero balance on our $145 million credit facility
-
We had $150 million in cash available to us at the end of the quarter
-
We have a preferred at the market facility currently in place. Last quarter we turned
this on and raised $9 million -
We also have in place a common at the market facility which we have not used, but could turn
on at any time -
We have potential excess refinancing proceeds for the 2013 and 2014 maturities that I walked
you through -
And we have excess cash flow. Last year we had $110 million of CAD or Cash Available for
Distribution. CAD is essentially our AFFO minus normal FF&E reserves.
And we only spent less than $35 million on dividends. Out of this we spend owner funded capex,
etc….but still have excess cash flow
-
All sources of available liquidity should we choose to tap into |
 Safety & Optionality
18
Portfolio A: Safety
•
Approximately 100-120% of equity value
•
~$2.0 billion of debt
•
Positive cash flow
•
Weighted average maturity of 3.6 years
•
All debt non-recourse
Portfolio B: Optionality & Upside
•
Approximately 0-(20)% of equity value
•
$1.0 to $1.2 billion of debt
•
Positive cash flow
•
Weighted average maturity of 4.5 years
•
All debt non-recourse |
| We have a very unique value proposition for investors.
You could think of Ashford as two investments.
Portfolio A encompasses the lionshare of our equity value, or approximately 100-120%
-
This portfolio has about $2.0 billion of our debt.
-
This portfolio has positive cash flow and a weighted average maturity of 3.6 years.
-
And all the debt is non-recourse
Relative to the outstanding debt we are in a good position. This portfolio reflects a
steady growth opportunity. Portfolio B accounts for about 0-(20)% of our equity
value. -
It has about $1.0 -
$1.2 billion of debt and also positive cash flow.
-
This portfolio has a longer weighted average maturity of 4.5 years
-
And all this debt is non-recourse as well.
This portfolio provides significant optionality for upside from faster EBITDA growth along
with a reasonably long runway with respect to the debt maturity to see our plans come
to fruition. |
 Highland Hospitality
Update |
 Highland Opportunities
20
•
Looking for opportunities to create long-term value and operational efficiency
through Remington management
•
Hilton Back Bay, Hyatt Windwatch, Courtyard Savannah & Residence Inn
Tampa •
Right-sizing the cost structure
•
Bringing best practices to operations
•
Rebuilding base business on the books
•
Stabilizing and growing RevPAR share
•
Several
of
the
properties
had
been
neglected
from
a
capital
perspective
•
Revenues should benefit from capex
Franchise
properties
Operating
flow
throughs
Revenues
Strategic
Capex |
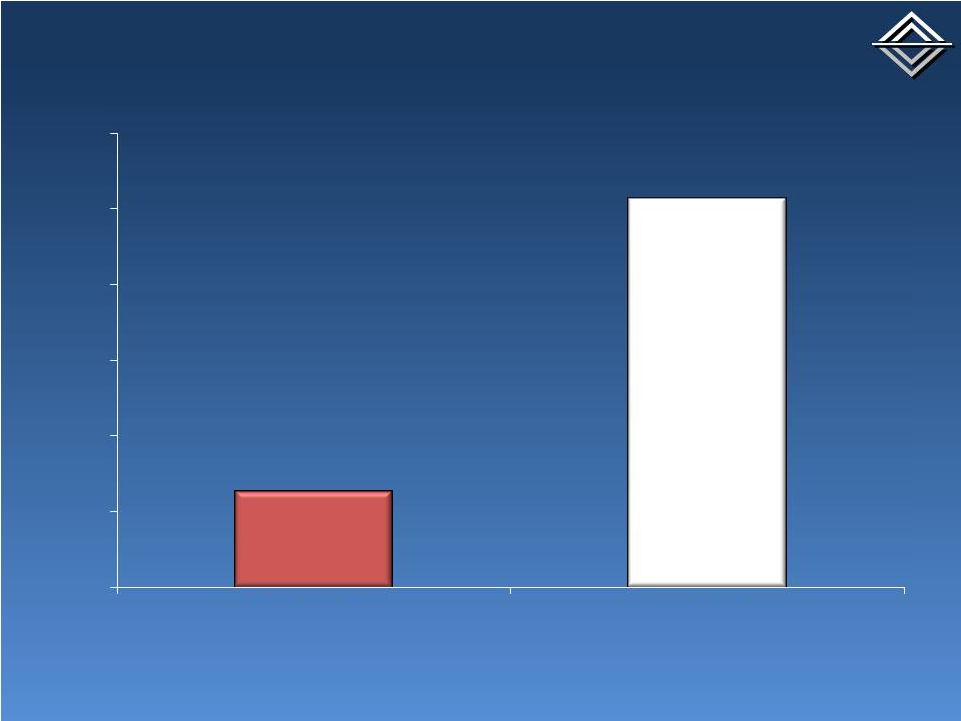 Highland Year One GOP Flows
21
0%
20%
40%
60%
80%
100%
120%
One Year Pre-Takeover
One Year Post-Takeover
25.20%
102.70% |
 Highland NOI Exceeds Underwriting
22
$72
$74
$76
$78
$80
$82
$84
$86
$88
$90
$92
Mar 2011 TTM
Jun 2011 TTM
Sep 2011 TTM
Dec 2011 TTM
Mar 2012 TTM
U/W for Mar 2012 |
 |
 Next Steps for Ashford
24
Allow portfolio to naturally
delever
Diligently work the capital
markets
Thorough research &
quantitative analysis
Scour market for acquisition
opportunities
Grow cash balance
Intense operational focus to
grow EBITDA
Must be long-term accretive to stock price
Franchised, full-service preferred
Domestic & global opportunities
Proactive refinancings
Push out maturities
Selectively access the capital markets
Highland & MIP portfolio cash flow
$30 million+ of annual debt amortization
Investigate & execute risk management strategies
Expertise in capital allocation
Focus on creating long-term shareholder value
Build cash balance in preparation for next downturn
Focus on growing Highland revenues
Growing EBITDA is best way to create shareholder value
|
| -
Spend time walking through the types of assets we’re looking at: full-service,
franchised properties, both US & Europe |
 |