Attached files
| file | filename |
|---|---|
| 8-K - AIR METHODS CORPORATION 8-K 9-10-2012 - AIR METHODS CORP | form8k.htm |
Exhibit 99.1
Air Methods Corporation NASDAQ: AIRM Corporate Presentation August 2012

* Forward Looking Statements/ Non-GAAP Financial Information Forward Looking Statements: This presentation includes certain forward-looking statements which are subject to various risks and uncertainties. Actual results could differ materially from those currently anticipated due to a number of factors, including but not limited to the size, structure and growth of the Company's air medical services and products markets; flight volume of community-based operations; collection rates for patient transports; the continuation and/or renewal of air medical service contracts; the acquisition of new and profitable Products Division contracts and other flight service operations; the successful expansion of the community-based operations, the ability of the Company to successfully integrate Omniflight, the timing of the Omniflight integration and the financial benefits associated with the acquisition of Omniflight; the Company’s ability to regain compliance with Nasdaq listing rules and other matters set forth in the Company’s public filings. Non-GAAP Financial Information: This presentation discusses EBITDA, which is not calculated in conformity with U.S. Generally Accepted Accounting Principles (GAAP). The Company defines EBITDA as earnings before interest, income taxes, depreciation, amortization and gain or loss on disposition of assets. A table is provided in this press release to reconcile such non-GAAP financial measure to net income, which is the most directly comparable financial measure prepared in accordance with GAAP. Management believes the additions and subtractions from net income used to calculate EBITDA reflect the measurements that its bank creditors and third party stock analysts use in evaluating the Company. These adjustments to the Company's GAAP results are made with the intent of providing both management and investors a more complete understanding of the Company's underlying operational results and trends and performance. Management uses this non-GAAP measure to evaluate the Company's financial results. The presentation of non-GAAP measures is not meant to be considered in isolation or as a substitute for or superior to financial results determined in accordance with GAAP.

* Air Methods’ Profile AIRM is the largest provider of air medical transportation services in the estimated $2.5 Billion U.S. market, transporting approximately 115,000 patients in 2011 (including Omniflight) and operating in 43 states.

* Two Service Delivery Models Community-Based Services (CBS) AIRM owns program and provides ALL services, including medical Hospital-Based Services (HBS) Hospital owns the program, while AIRM provides the aviation services to hospital as a vendor

* Differences of Service Delivery Models Community-Based Services (CBS) 73% of TTM Flight Revenues Typically no contract with third party Aviation services PLUS medical staffing, dispatch and communications, and billing and collections 100% variable revenue stream 215 Aircraft, 170 Bases Approx. $3.5 million of revenue and $873,000 of average net pre-tax divisional profit per base Growth primarily driven from outsourced hospital programs, new base expansion and increases in reimbursement Hospital-Based Services (HBS) 27% of TTM Flight Revenues Long term contract with hospital Aviation services only Approx. 78% fixed revenue stream 178 Aircraft, 132 Bases Approx. $1.6 million of revenue and $92,000 of average net pre-tax divisional profit per base Growth primarily driven from satellite expansion, new contracts and annual contractual prices

* Combined Flight Services Map

Key Growth Drivers
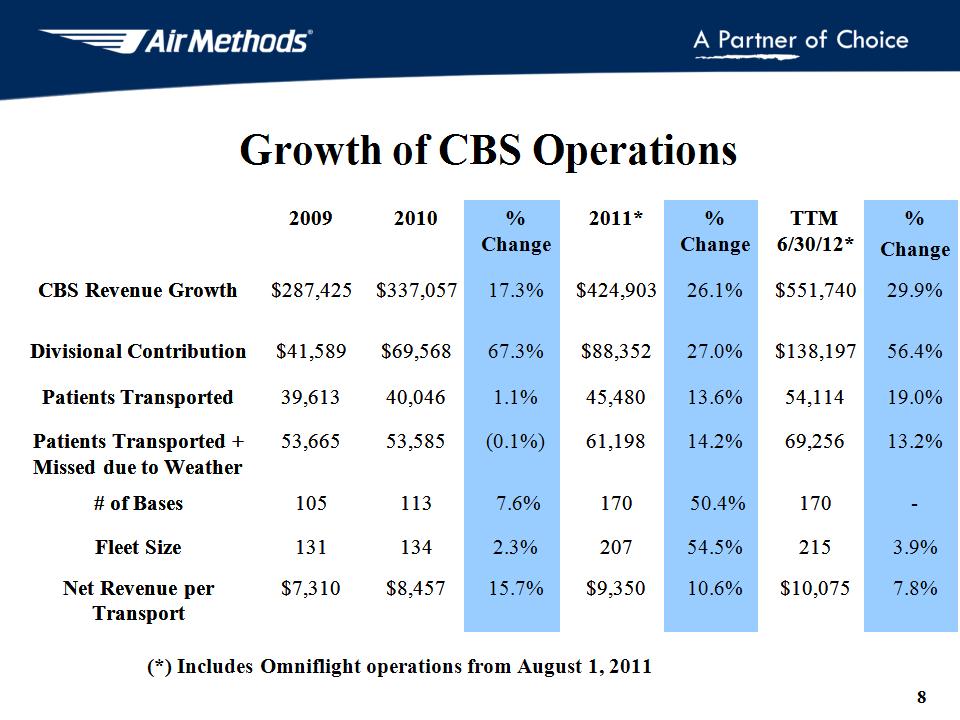
* Growth of CBS Operations 2009 2010 % Change 2011* % Change TTM 6/30/12* % Change CBS Revenue Growth $287,425 $337,057 17.3% $424,903 26.1% $551,740 29.9% Divisional Contribution $41,589 $69,568 67.3% $88,352 27.0% $138,197 56.4% Patients Transported 39,613 40,046 1.1% 45,480 13.6% 54,114 19.0% Patients Transported + Missed due to Weather 53,665 53,585 (0.1%) 61,198 14.2% 69,256 13.2% # of Bases 105 113 7.6% 170 50.4% 170 - Fleet Size 131 134 2.3% 207 54.5% 215 3.9% Net Revenue per Transport $7,310 $8,457 15.7% $9,350 10.6% $10,075 7.8% (*) Includes Omniflight operations from August 1, 2011

* Pricing power Net revenue per transport increased 11% and 8% in 2011 and ttm 6/30/2012, respectively despite slight deterioration in payer mix. Conversion of HBS bases to CBS bases 10 conversions since 1/10 have contributed $15.8 million of annualized contribution. CBS base additions 12 green field base expansions since 1/10 have contributed $13.2 million of annualized contribution. Community Health Systems Agreement (126 hospitals, approximately 15,000 transports) 30 hospitals converted to date - approximately 85% of transports completed by AIRM. 37 additional hospitals in the process of being converted. Ancillary revenue FEMA/Disaster Recovery contract renewed at favorable terms. No revenue the past three years. CBS Operational Growth Drivers

* CBS Patient Transports # of Transports 15,134

* CBS Net Revenue Per Transport (After Medicare/Medicaid Discount & Bad Debt Expense) $10,609 Key Variables Price Increases Payor Mix Collection Percentage by Payor Type 39.2% increase since 1/10 15.0% compounded annual increase during the last three years Includes Omniflight operations from August 1, 2011

* CBS Payor/Reimbursement Mix Patient Mix Reimbursement Rate by Payor (TTM 12/31/11) 13% 35% 31% (TTM 3/31/12) 21%

* Potential increase in EBITDA if return to 12/31/07 (pre-recession) payor mix - $57 million. Potential EBITDA impact of Health Care Reform: 1% shift from Uninsured to Medicaid = $0.9 million 1% shift from Uninsured to Medicare = $2.5 million 1% shift from Uninsured to Insured = $8.8 million Potential Growth Through Improved Payor/Reimbursement Mix

* Growth of HBS Operations 2009 2010 % Change 2011* % Change TTM 6/30/12* % Change HBS Revenue Growth (1) $181,996 $182,830 0.5% $191,860 4.9% $207,274 8.0% Divisional Contribution (1) $11,841 $12,044 1.7% $9,572 (20.5%) $10,892 13.8% # of Dedicated Bases 129 123 (4.7%) 131 6.5% 132 0.8% New Bases added during period 3 4 5 8 Outsourced Bases 3 4 6 4 Fleet Size 172 167 (2.9%) 184 10.2% 178 (3.3%) (*) Includes Omniflight operations from August 1, 2011 (1) -Excludes revenue and divisional contribution from bases converted to CBS operations

* AIRM Free Cash Flow Before Debt Service ($ Millions) FY 2009 FY 2010 FY 2011* TTM 6/30/12* EBITDA $122.8 $150.7 $170.9 $227.0 Interest $19.1 $18.8 $19.4 $21.3 Income Taxes $9.8 $19.6 $15.4 $15.7 Cap Ex, Excluding Asset Buyouts and Sales $11.0 $15.1 $21.5 $14.6 Excess Cash Flow $82.9 $97.2 $114.6 $175.4 (*) Includes Omniflight operations from August 1, 2011

* Uses of Free Cash Flow Continue to pay off aircraft leases Reduces depreciation and interest expense Reduces monthly capital lease payments Continue to pay down debt Continue M & A activity

* Competitors AIRM - $750M TTM (with full year of Omniflight) National Competitors (3) Air Medical Group Holdings (Air Evac/MedTrans)- est. TTM $360M PHI, Inc. - $185M Metro Aviation, Inc. - est. TTM $75M Regional Competitors (numerous) Hospitals and Other - est. $1.1B Based on Revenue

* Expert in design, engineering, manufacturing, installation and certification of aero medical and aerospace products Supports AIRM fleet ISO 9001 certified Includes two exclusive military contracts to retro fit Blackhawk helicopters and Medical Evacuation Vehicles (MEV), with anticipated significant future orders Good gross margins Significant backlog – over $20 million United Rotorcraft

* Summary of Opportunities & Positive Trends Integration of Omniflight operations into AIRM Continued pricing power for CBS transports Integration of Community Health Systems Potential for FEMA revenue in the future none in 2009 through 2011 Balance sheet strength and cash flow Outsourcing opportunities for HBS Division Potential for improved reimbursement payor mix shift and Health Care Reform

* Recent softness in demand for service due to the economy The economy and its impact on payor mix Health Care Reform uncertainties Retention of key hospital contractual relationships Industry accidents and their impact on regulatory environment, insurance costs and public confidence Potential increase in aircraft within the industry and the related increase in capacity Summary of Operational Challenges/Uncertainties

* Omniflight Acquisition Acquired effective August 1, 2011 Purchase price of approximately $243 million, includes $38 million of capital leases Revenue of approximately $172 million CBS revenue of $131 million HBS revenue of $41 million EBITDA of approximately $39 million Base Make-up 46 CBS Bases 29 HBS Bases 100 aircraft (comparable makes/models to AIRM) Financed with new $300 million credit facility

* Restatement of Financial Statements Virtually all aircraft operators account for their aircraft leases as operating leases versus capital leases. Omniflight was required to restate their financial statements to account for their aircraft leases as capital leases. AIRM consulted with the Securities and Exchange Commission and outside auditors – KPMG about the proper accounting of the aircraft leases. Decision was made to restate historical financial statements to reflect the aircraft leases as capital leases. EPS impact was $(0.03) and $(0.11) for nine months ended September 30, 2011 and year ended December 31, 2010, respectively Impact to 12/31/2010: Increase in EBITDA by $50 million Increase in Depreciation and Interest Expense by $39 million and $13 million, respectively Increase in Fixed Assets by $244 million Increase in Capital Lease Liabilities by $273 million

* Expansion Opportunities Sweden - Air Methods is looking at a company with operations in Sweden, Norway and Finland. Two of the company's three owners want to sell the business. Turkey - The government is looking to replace the incumbent provider (18 aircraft) with one that could procure a newer fleet. The effort would require a joint venture with a local company, and would follow the hospital-based model (should have higher margins than HBS but lower margins than CBS). Management would not be surprised if this happens later in the year. China - Management was approached by the Chinese government to explore offering air medical services in the country. India - While the government won't pay for these services, an opportunity exists to service individual communities of private wealthy citizens. Domestic Regional Provider - The company could look to acquire a regional provider with operations in California and Texas. Tourism - The higher-margin tourism business could also provide synergies, as pilots could satisfy their 2,000-hour flight requirement before joining Air Methods' air medical business (tourism pilots do not need to meet this minimum).