Attached files
| file | filename |
|---|---|
| 8-K - CURRENT REPORT ON FORM 8-K - DELTA AIR LINES, INC. | delta_8k-090612.htm |
Exhibit 99.1
Delta: Keep Climbing Deutsche Bank 2012 Aviation and Transportation Conference September 6, 2012
2 This presentation contains various projections and other forward - looking statements which represent Delta’s estimates or expectations regarding future events. All forward - looking statements involve a number of assumptions, risks and uncertainties, many of which are beyond Delta’s control, that could cause the actual results to differ materially from the projected results. Factors which could cause such differences include, without limitation, business, economic, competitive, industry, regulatory, market and financial uncertainties and contingencies, as well as the “Risk Factors” discussed in Delta’s SEC filings. Caution should be taken not to place undue reliance on Delta’s forward - looking statements, which represent Delta’s views only as of the date of this presentation, and which Delta has no current intention to update. In this presentation, we will discuss certain non - GAAP financial measures. You can find the reconciliations of those measures to comparable GAAP measures on our website at delta.com. Safe Harbor

3 Delta: Keep Climbing Continuing Financial Momentum Solid September Quarter Focused on the Future: Structural Initiatives Differentiate Delta Industry leading financial improvement driven by strong gains in revenue Solidly profitable September quarter despite rising jet fuel prices Structural initiatives further current momentum by leveraging Delta’s first mover advantage
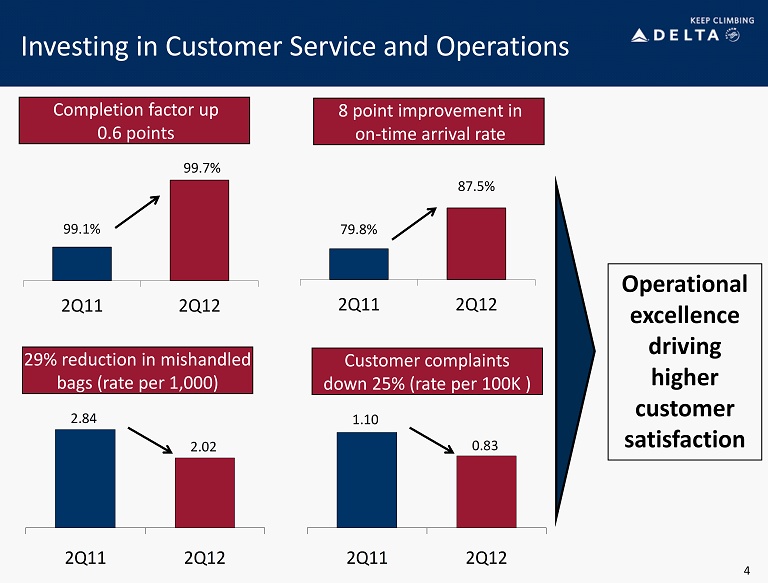
4 Investing in Customer Service and Operations Operational excellence driving higher customer satisfaction Completion factor up 0.6 points 99.1% 99.7% 2Q11 2Q12 79.8% 87.5% 2Q11 2Q12 2.84 2.02 2Q11 2Q12 8 point improvement in on - time arrival rate 29% reduction in mishandled bags (rate per 1,000 ) 1.10 0.83 2Q11 2Q12 Customer complaints down 25% (rate per 100K )
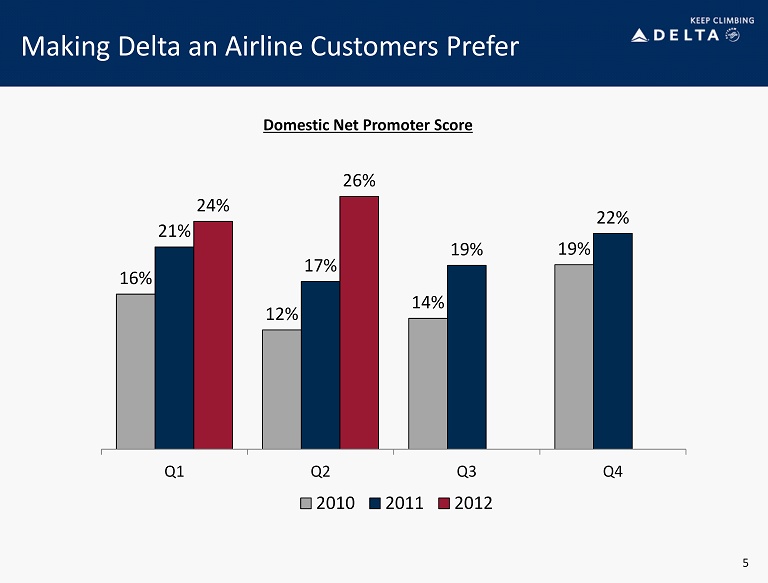
Making Delta an Airline Customers Prefer 5 Domestic Net Promoter Score 16% 12% 14% 19% 21% 17% 19% 22% 24% 26% Q1 Q2 Q3 Q4 2010 2011 2012
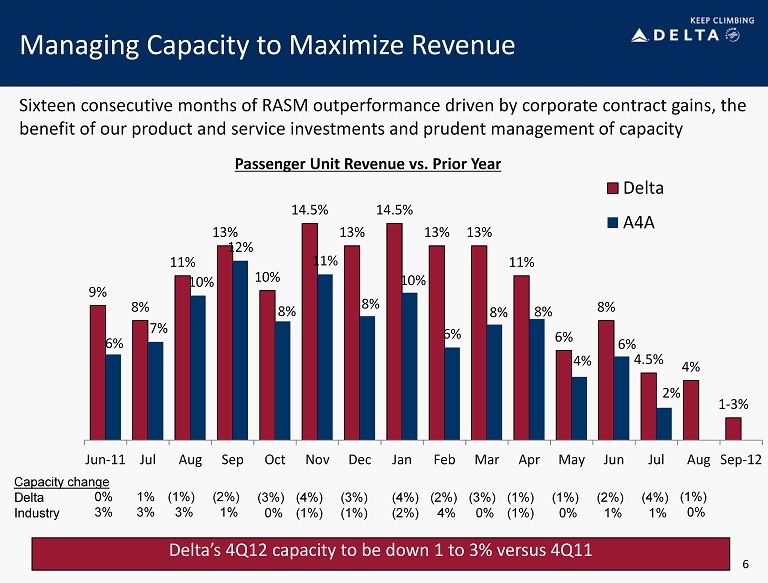
9% 8% 11% 13% 10% 14.5% 13% 14.5% 13% 13% 11% 6% 8% 4.5% 4% 1 - 3% 6% 7% 10% 12% 8% 11% 8% 10% 6% 8% 8% 4% 6% 2% Jun-11 Jul Aug Sep Oct Nov Dec Jan Feb Mar Apr May Jun Jul Aug Sep-12 Delta A4A Managing Capacity to Maximize Revenue Sixteen consecutive months of RASM outperformance driven by corporate contract gains, the benefit of our product and service investments and prudent management of capacity Passenger Unit Revenue vs. Prior Year Capacity change Delta Industry (2%) 1% (3%) 0% (4%) (1%) (3%) (1%) (4%) (2%) (2%) 4% (3%) 0% (1%) (1%) (1%) 0% (2%) 1% (4%) 1% (1%) 0% Delta’s 4Q12 capacity to be down 1 to 3% versus 4Q11 6 (1%) 3% 1% 3% 0% 3%
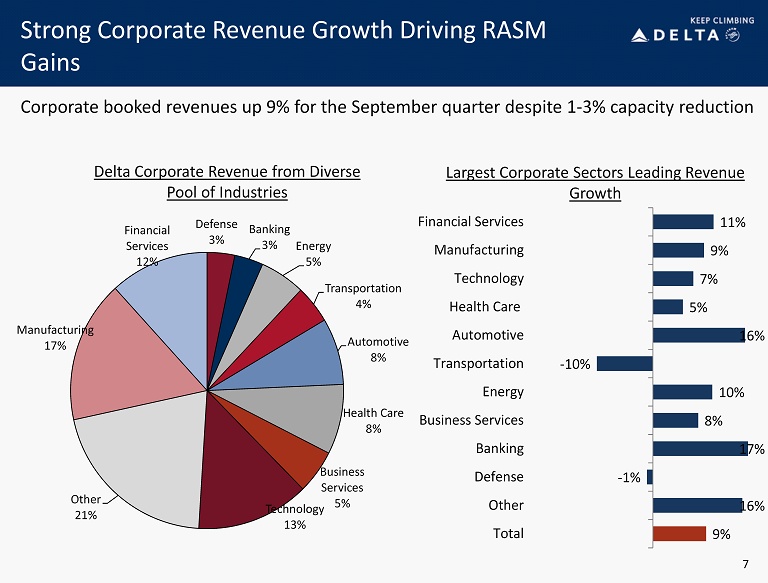
Strong Corporate Revenue Growth Driving RASM Gains Largest Corporate Sectors Leading Revenue Growth Corporate booked revenues up 9% for the September quarter despite 1 - 3% capacity reduction 7 Delta Corporate Revenue from Diverse Pool of Industries Defense 3% Banking 3% Energy 5% Transportation 4% Automotive 8% Health Care 8% Business Services 5% Technology 13% Other 21% Manufacturing 17% Financial Services 12% 9% 16% - 1% 17% 8% 10% - 10% 16% 5% 7% 9% 11% Total Other Defense Banking Business Services Energy Transportation Automotive Health Care Technology Manufacturing Financial Services
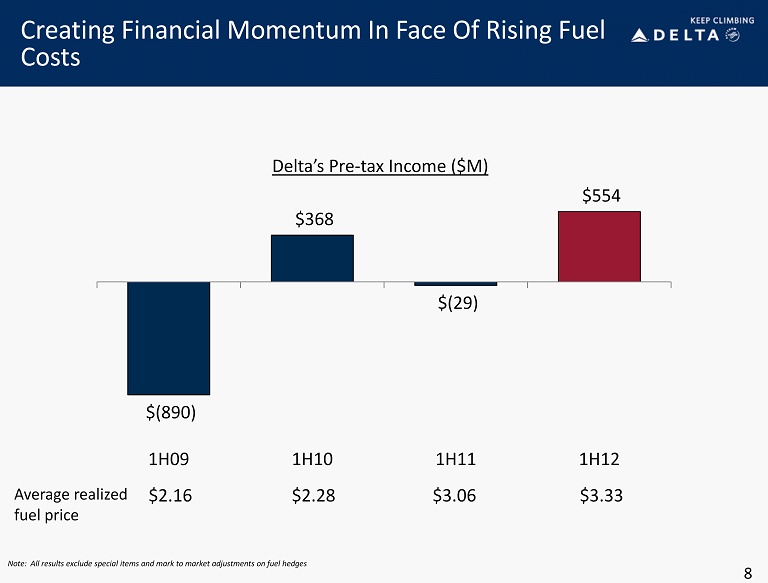
Creating Financial Momentum In Face Of Rising Fuel Costs 8 Note: All results exclude special items and mark to market adjustments on fuel hedges $(890) $368 $(29) $554 1H09 1H10 1H11 1H12 Delta’s Pre - tax Income ($M) Average realized fuel price $3.33 $3.06 $2.28 $2.16
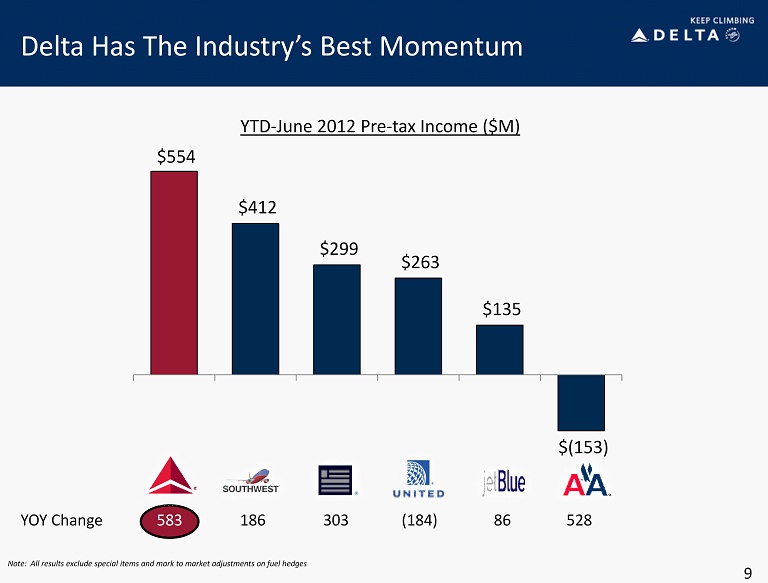
583 Delta Has The Industry’s Best Momentum 9 $554 $412 $299 $263 $135 $(153) YOY Change 528 86 (184) 303 186 YTD - June 2012 Pre - tax Income ($M) Note: All results exclude special items and mark to market adjustments on fuel hedges
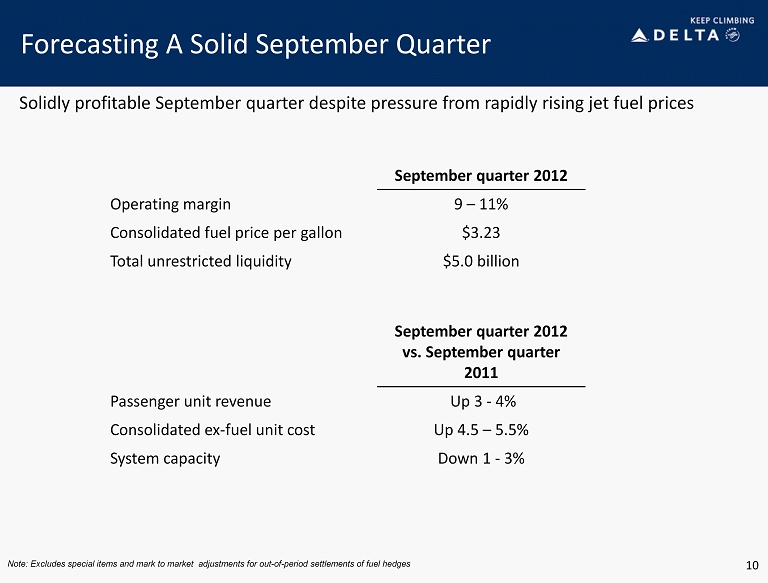
10 Forecasting A Solid September Quarter September quarter 2012 Operating margin 9 – 11% Consolidated fuel price per gallon $3.23 Total unrestricted liquidity $5.0 billion September quarter 2012 vs. September quarter 2011 Passenger unit revenue Up 3 - 4% Consolidated ex - fuel unit cost Up 4.5 – 5.5% System capacity Down 1 - 3% Note: Excludes special items and mark to market adjustments for out - of - period settlements of fuel hedges Solidly profitable September quarter despite pressure from rapidly rising jet fuel prices
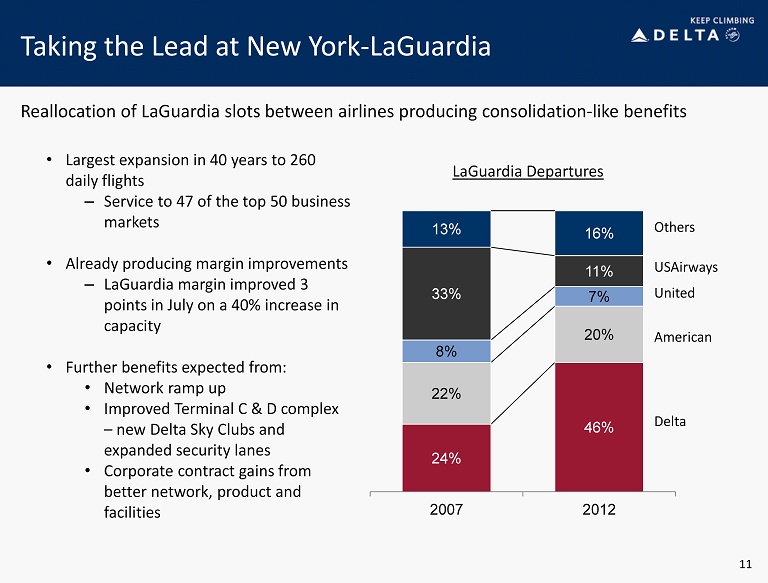
Taking the Lead at New York - LaGuardia 11 • Largest expansion in 40 years to 260 daily flights – Service to 47 of the top 50 business markets • Already producing margin improvements – LaGuardia margin improved 3 points in July on a 40% increase in capacity • Further benefits expected from: • Network ramp up • Improved Terminal C & D complex – new Delta Sky Clubs and expanded security lanes • Corporate contract gains from better network, product and facilities 24% 46% 22% 20% 8% 7% 33% 11% 13% 16% 2007 2012 LaGuardia Departures Delta American United USAirways Others Reallocation of LaGuardia slots between airlines producing consolidation - like benefits
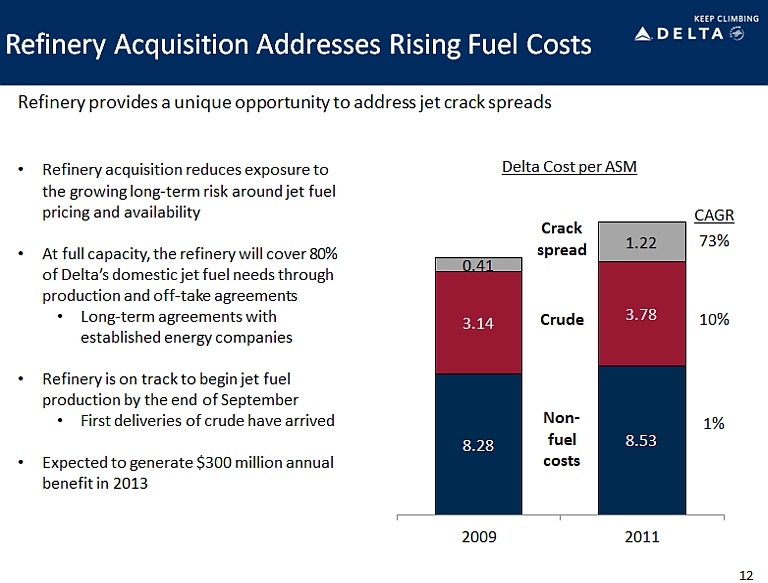
8.28 8.53 3.14 3.18 0.41 1.22 2009 2011 • Refinery acquisition reduces exposure to the growing long - term risk around jet fuel pricing and availability • At full capacity, the refinery will cover 80% of Delta’s domestic jet fuel needs through production and off - take agreements • Long - term agreements with established energy companies • Refinery is on track to begin jet fuel production by the end of September • First deliveries of crude have arrived • Expected to generate $300 million annual benefit in 2013 Refinery Acquisition Addresses Rising Fuel Costs Refinery provides a unique opportunity to address jet crack spreads 12 Delta Cost per ASM Non - fuel costs Crude Crack spread CAGR 73% 10% 1%
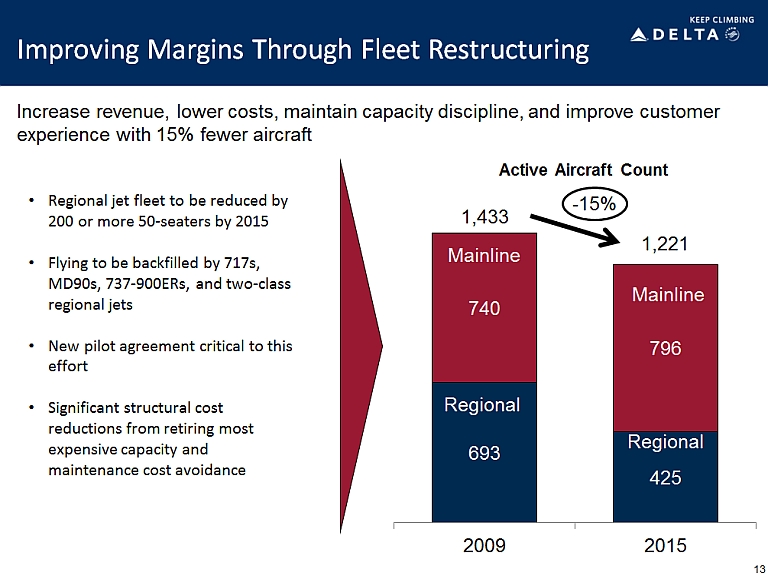
Improving Margins Through Fleet Restructuring • Regional jet fleet to be reduced by 200 or more 50 - seaters by 2015 • Flying to be backfilled by 717s, MD90s, 737 - 900ERs, and two - class regional jets • New pilot agreement critical to this effort • Significant structural cost reductions from retiring most expensive capacity and maintenance cost avoidance Active Aircraft Count Increas e revenue, lower costs, maintain capacity discipline, and improve customer experience with 15% fewer aircraft 693 425 740 796 2009 2015 Mainline Regional Mainline Regional 1,433 1,221 - 15% 13
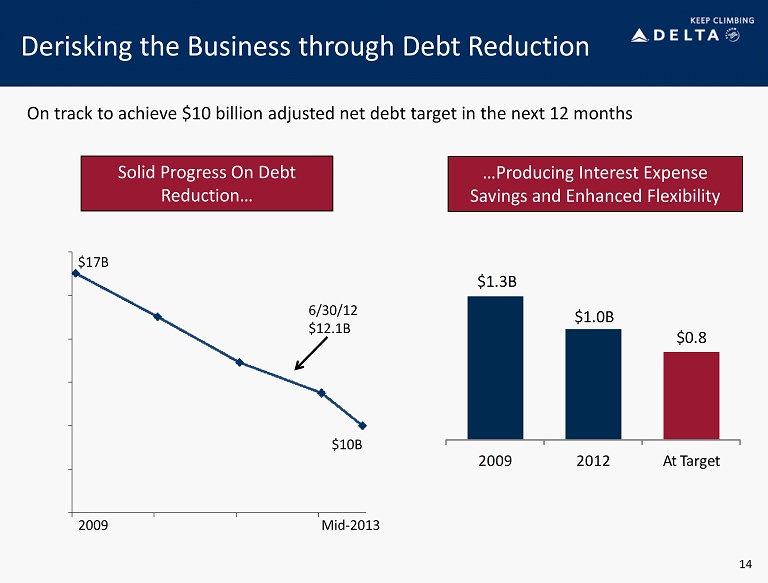
Derisking the Business through Debt Reduction Solid Progress On Debt Reduction… $17B 6 /30/12 $ 12.1B $10B 14 On track to achieve $10 billion adjusted net debt target in the next 12 months $1.3B $1.0 B $0.8 2009 2012 At Target …Producing Interest Expense Savings and Enhanced Flexibility 2009 Mid - 2013
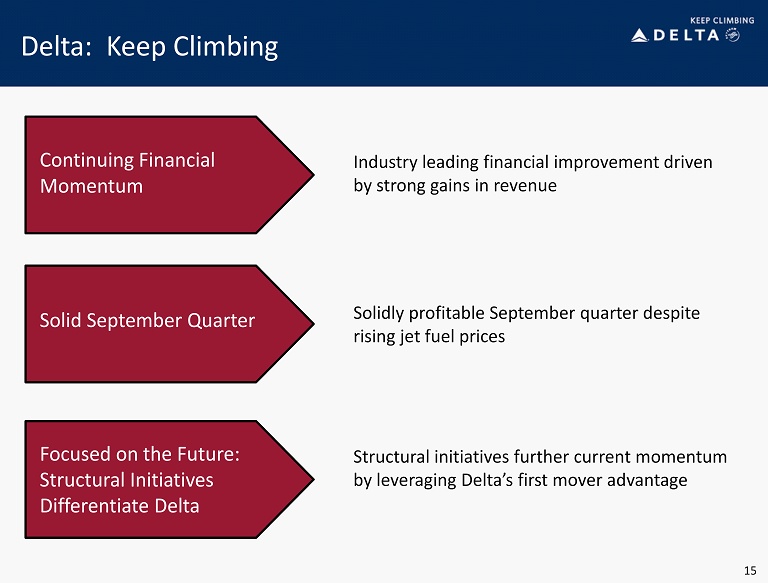
15 Delta: Keep Climbing Continuing Financial Momentum Solid September Quarter Focused on the Future: Structural Initiatives Differentiate Delta Industry leading financial improvement driven by strong gains in revenue Solidly profitable September quarter despite rising jet fuel prices Structural initiatives further current momentum by leveraging Delta’s first mover advantage
Non-GAAP Financial Measures
Delta sometimes uses information ("non-GAAP financial measures") that is derived from our Consolidated Financial Statements, but that is not presented in accordance with accounting principles generally accepted in the U.S. (“GAAP”). Under the U.S. Securities and Exchange Commission rules, non-GAAP financial measures may be considered in addition to results prepared in accordance with GAAP, but should not be considered a substitute for or superior to GAAP results.
Delta is unable to reconcile certain forward-looking projections to GAAP for future periods as the nature or amount of special items cannot be estimated at this time.
Delta excludes special items because management believes the exclusion of these items is helpful to investors to evaluate the company’s recurring core operational performance in the period shown.
Delta adjusts for mark-to-market (MTM) adjustments for fuel hedges recorded in periods other than the settlement period in order to evaluate the company's financial results in the period shown.
Delta presents consolidated CASM excluding fuel expense and related taxes because management believes the volatility in fuel prices impacts the comparability of year-over-year financial performance.
Consolidated CASM excludes ancillary businesses not related to the generation of a seat mile. These businesses include aircraft maintenance and staffing services Delta provides to third parties and Delta’s vacation wholesale operations.
Delta excludes profit sharing expense from consolidated CASM because management believes the exclusion of this item provides a more meaningful comparison of the company’s results to the airline industry and prior years' results.
Delta uses adjusted total debt, including aircraft rent, in addition to long-term adjusted debt and capital leases, to present estimated financial obligations. Delta reduces adjusted total debt by cash, cash equivalents and short-term investments, resulting in adjusted net debt, to present the amount of additional assets needed to satisfy the debt.
| 16 |
Pre-Tax Income
| 2012 | ||||||||||||||||||||
| Six Months Ended June 30 | vs. 2011 | |||||||||||||||||||
| (in millions) | 2009 | 2010 | 2011 | 2012 | Change | |||||||||||||||
| Pre-tax income (loss) | $ | (1,047 | ) | $ | 222 | $ | (195 | ) | $ | (37 | ) | |||||||||
| Items excluded: | ||||||||||||||||||||
| MTM adjustments | – | – | (18 | ) | 410 | |||||||||||||||
| Restructuring and other items | 157 | 136 | 151 | 181 | ||||||||||||||||
| Loss on extinguishment of debt | – | – | 33 | – | ||||||||||||||||
| Other | – | 10 | – | – | ||||||||||||||||
| Pre-tax income (loss) excluding special items | $ | (890 | ) | $ | 368 | $ | (29 | ) | $ | 554 | $ | 583 | ||||||||
| 17 |
Average Price Per Fuel Gallon
| Six Months Ended June 30 | ||||||||
| 2011 | 2012 | |||||||
| Average price per fuel gallon | $ | 3.05 | $ | 3.55 | ||||
| MTM adjustments | 0.01 | (0.22 | ) | |||||
| Average price per fuel gallon, adjusted | $ | 3.06 | $ | 3.33 | ||||
| 18 |
CASM-Ex
| Full Year | Full Year | ||||||||
| 2009 | 2011 | ||||||||
| CASM (Unit Cost) | 12.32 | ¢ | 14.12 | ¢ | |||||
| Items excluded: | |||||||||
| Ancillary businesses | (0.31 | ) | (0.37 | ) | |||||
| MTM adjustments | – | (0.01 | ) | ||||||
| Profit sharing | – | (0.11 | ) | ||||||
| Restructuring and other items | (0.18 | ) | (0.10 | ) | |||||
| CASM (Unit Cost excluding special items, profit sharing and ancillary businesses) | 11.83 | ¢ | 13.53 | ¢ | |||||
| Aircraft fuel and related taxes | (3.55 | ) | (5.00 | ) | |||||
| CASM-Ex (Non-Fuel Unit Cost excluding special items, profit sharing and ancillary businesses) | 8.28 | ¢ | 8.53 | ¢ | |||||
| 19 |
Adjusted Net Debt
| (in billions) | December 31, 2009 | June 30, 2012 | ||||||||||||||
| Debt and capital lease obligations | $ | 17.2 | $ | 13.0 | ||||||||||||
| Plus: unamortized discount, net from purchase accounting and fresh start reporting | 1.1 | 0.6 | ||||||||||||||
| Adjusted debt and capital lease obligations | $ | 18.3 | $ | 13.6 | ||||||||||||
| Plus: 7x last twelve months' aircraft rent | 3.4 | 2.0 | ||||||||||||||
| Adjusted total debt | 21.7 | 15.6 | ||||||||||||||
| Less: cash, cash equivalents and short-term investments | (4.7 | ) | (3.5 | ) | ||||||||||||
| Adjusted net debt | $ | 17.0 | $ | 12.1 | ||||||||||||
| 20 |