Attached files
| file | filename |
|---|---|
| 8-K - 8-K - NORTHSTAR REALTY FINANCE CORP. | a12-20321_18k.htm |
Exhibit 99.1
|
|
Corporate Presentation September 2012 ©2012 NorthStar Realty Finance Corp. |
|
|
2 Safe Harbor This presentation contains forward-looking statements, within the meaning of the Private Securities Litigation Reform Act of 1995, including statements about future results, projected yields, rates of return and performance, projected cash earned from investments, expected and weighted average return on equity, market and industry trends, investment opportunities, business conditions and other matters, including, among other things: the scalability of our investment platform; the size and timing of offerings or capital raises and actual management fee income derived from, our two non-listed REITs; the ability to opportunistically participate in commercial real estate refinancings; the projected returns on, and cash earned from, investments funded by drawings from our credit facilities and securities offerings. Forward-looking statements concern future circumstances and results and other statements that are not historical facts and are sometimes identified by the words “may,” “will,” “should,” “potential,” “intend,” “expect,” “seek,” “anticipate,” “estimate,” “believe,” “could,” “project,” “predict,” “continue” or other similar words or expressions. The forward-looking statements involve a number of significant risks and uncertainties. A number of factors, including those factors set forth under the section entitled “Risk Factors” in the Annual Report on Form 10-K for the year ended December 31, 2011 of NorthStar Realty Finance Corp. (the “Company”), could cause the Company’s actual results, performance, achievements or industry results to be materially different from any future results, performance and achievements expressed or implied by these forward-looking statements. Additional information concerning factors that could cause actual results to materially differ from those in the forward-looking statements is contained in the Securities and Exchange Commission filings of the Company. The Company does not guarantee that the assumptions underlying such forward-looking statements are free from errors. The Company undertakes no obligation to publicly update any information whether as a result of new information, future events, or otherwise, except as may be required by applicable securities laws. Unless otherwise stated, historical financial information and per share data is as of June 30, 2012. This presentation is for informational purposes only and does not constitute an offer to sell or a solicitation of an offer to buy any securities of the Company. |
|
|
3 Commercial real estate finance and asset management company (NYSE:NRF), organized as an internally managed REIT New York City headquarters with regional offices in Dallas, TX; Denver, CO; and Bethesda, MD $7 billion of commercial real estate assets under management Broad, scalable and sophisticated investment platform (over 100 professionals) Established origination team Experienced asset management team Sophisticated CMBS team Seasoned healthcare team Veteran net lease team Captive broker-dealer Broad accounting and skilled legal teams Diversified investments and cash flow streams Increased common dividend four consecutive quarters beginning in Q3 of 2011, representing an aggregate 60% increase over this period Company Overview |
|
|
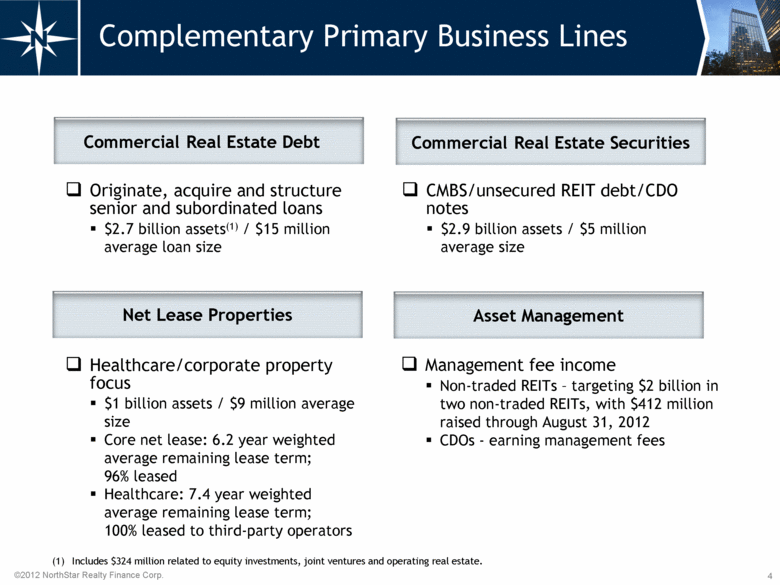
4 Complementary Primary Business Lines Includes $324 million related to equity investments, joint ventures and operating real estate. Commercial Real Estate Debt Commercial Real Estate Securities Net Lease Properties Originate, acquire and structure senior and subordinated loans $2.7 billion assets(1) / $15 million average loan size Asset Management CMBS/unsecured REIT debt/CDO notes $2.9 billion assets / $5 million average size Management fee income Non-traded REITs – targeting $2 billion in two non-traded REITs, with $412 million raised through August 31, 2012 CDOs - earning management fees Healthcare/corporate property focus $1 billion assets / $9 million average size Core net lease: 6.2 year weighted average remaining lease term; 96% leased Healthcare: 7.4 year weighted average remaining lease term; 100% leased to third-party operators |
|
|
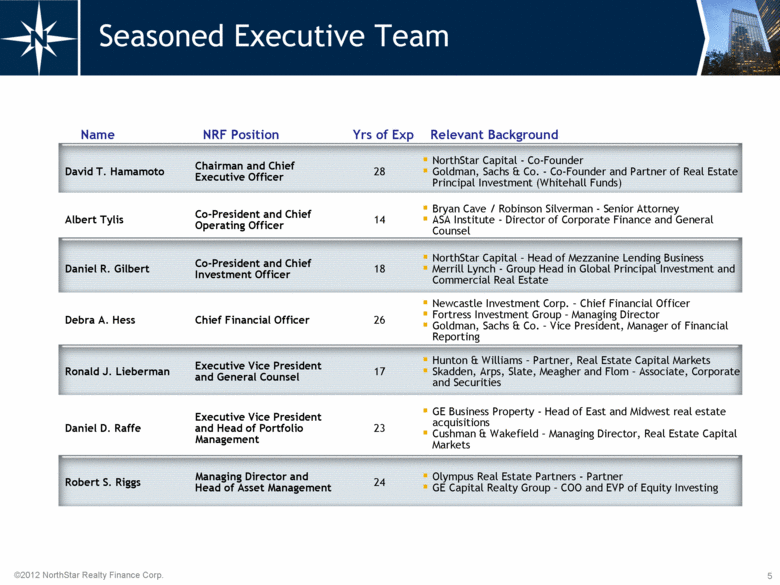
5 Seasoned Executive Team Name NRF Position Yrs of Exp Relevant Background David T. Hamamoto Chairman and Chief Executive Officer 28 NorthStar Capital - Co-Founder Goldman, Sachs & Co. - Co-Founder and Partner of Real Estate Principal Investment (Whitehall Funds) Albert Tylis Co-President and Chief Operating Officer 14 Bryan Cave / Robinson Silverman - Senior Attorney ASA Institute - Director of Corporate Finance and General Counsel Daniel R. Gilbert Co-President and Chief Investment Officer 18 NorthStar Capital – Head of Mezzanine Lending Business Merrill Lynch - Group Head in Global Principal Investment and Commercial Real Estate Debra A. Hess Chief Financial Officer 26 Newcastle Investment Corp. – Chief Financial Officer Fortress Investment Group – Managing Director Goldman, Sachs & Co. – Vice President, Manager of Financial Reporting Ronald J. Lieberman Executive Vice President and General Counsel 17 Hunton & Williams – Partner, Real Estate Capital Markets Skadden, Arps, Slate, Meagher and Flom – Associate, Corporate and Securities Daniel D. Raffe Executive Vice President and Head of Portfolio Management 23 GE Business Property - Head of East and Midwest real estate acquisitions Cushman & Wakefield – Managing Director, Real Estate Capital Markets Robert S. Riggs Managing Director and Head of Asset Management 24 Olympus Real Estate Partners - Partner GE Capital Realty Group – COO and EVP of Equity Investing |
|
|
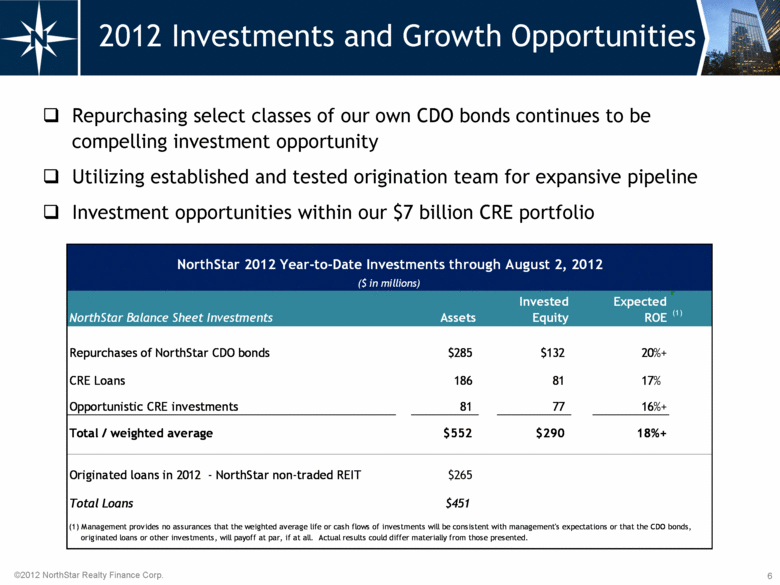
6 2012 Investments and Growth Opportunities Repurchasing select classes of our own CDO bonds continues to be compelling investment opportunity Utilizing established and tested origination team for expansive pipeline Investment opportunities within our $7 billion CRE portfolio NorthStar 2012 Year-to-Date Investments through August 2, 2012 ($ in millions) NorthStar Balance Sheet Investments Assets Invested Equity Expected ROE (1) Repurchases of NorthStar CDO bonds $285 $132 20%+ CRE Loans 186 81 17% Opportunistic CRE investments 81 77 16%+ Total / weighted average $552 $290 18%+ Originated loans in 2012 - NorthStar non-traded REIT $265 Total Loans $451 (1) Management provides no assurances that the weighted average life or cash flows of investments will be consistent with management's expectations or that the CDO bonds, originated loans or other investments, will payoff at par, if at all. Actual results could differ materially from those presented. |
|
|
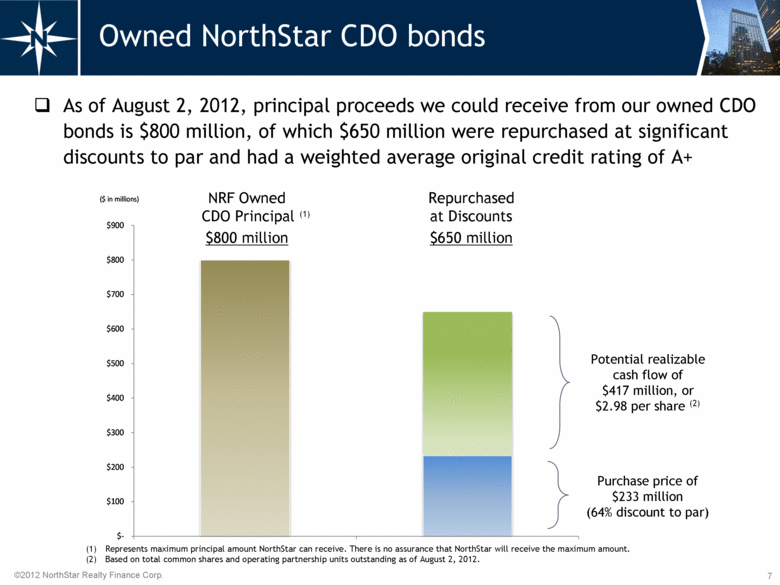
7 Owned NorthStar CDO bonds As of August 2, 2012, principal proceeds we could receive from our owned CDO bonds is $800 million, of which $650 million were repurchased at significant discounts to par and had a weighted average original credit rating of A+ Potential realizable cash flow of $417 million, or $2.98 per share (2) Purchase price of $233 million (64% discount to par) Represents maximum principal amount NorthStar can receive. There is no assurance that NorthStar will receive the maximum amount. Based on total common shares and operating partnership units outstanding as of August 2, 2012. NRF Owned CDO Principal (1) $800 million Repurchased at Discounts $650 million $- $100 $200 $300 $400 $500 $600 $700 $800 $900 ($ in millions) |
|
|
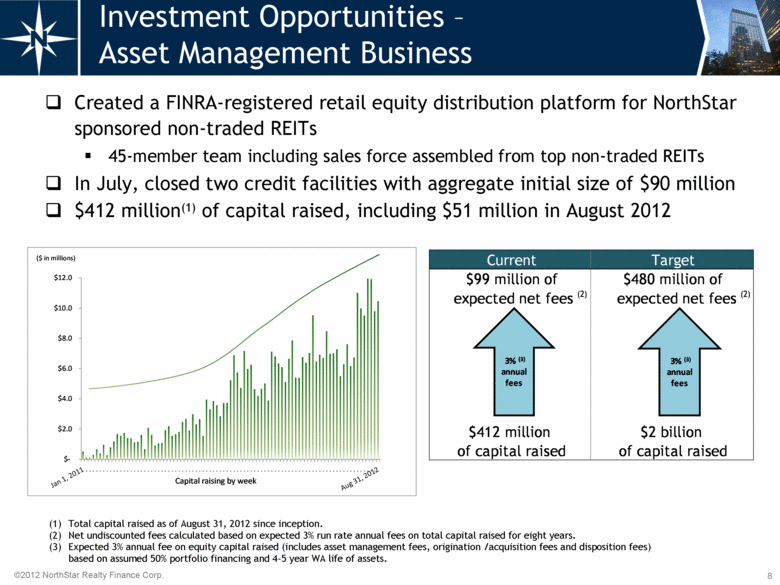
8 Investment Opportunities – Asset Management Business Created a FINRA-registered retail equity distribution platform for NorthStar sponsored non-traded REITs 45-member team including sales force assembled from top non-traded REITs In July, closed two credit facilities with aggregate initial size of $90 million $412 million(1) of capital raised, including $51 million in August 2012 Total capital raised as of August 31, 2012 since inception. Net undiscounted fees calculated based on expected 3% run rate annual fees on total capital raised for eight years. Expected 3% annual fee on equity capital raised (includes asset management fees, origination /acquisition fees and disposition fees) based on assumed 50% portfolio financing and 4-5 year WA life of assets. Current Target $99 million of $480 million of expected net fees (2) expected net fees (2) $412 million $2 billion of capital raised of capital raised 3% (3) annual fees 3% (3) annual fees |
|
|
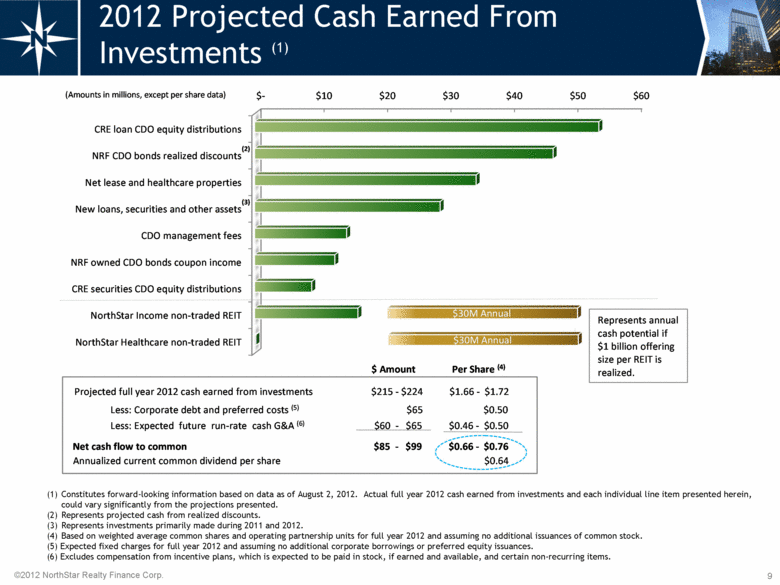
9 2012 Projected Cash Earned From Investments (1) Constitutes forward-looking information based on data as of August 2, 2012. Actual full year 2012 cash earned from investments and each individual line item presented herein, could vary significantly from the projections presented. Represents projected cash from realized discounts. Represents investments primarily made during 2011 and 2012. Based on weighted average common shares and operating partnership units for full year 2012 and assuming no additional issuances of common stock. (5) Expected fixed charges for full year 2012 and assuming no additional corporate borrowings or preferred equity issuances. (6) Excludes compensation from incentive plans, which is expected to be paid in stock, if earned and available, and certain non-recurring items. $- $10 $20 $30 $40 $50 $60 NorthStar Healthcare non-traded REIT NorthStar Income non-traded REIT CRE securities CDO equity distributions NRF owned CDO bonds coupon income CDO management fees New loans, securities and other assets Net lease and healthcare properties NRF CDO bonds realized discounts CRE loan CDO equity distributions $30M Annual $30M Annual Projected full year 2012 cash earned from investments $215 - $224 $1.66 - $1.72 Less: Corporate debt and preferred costs (5) $65 $0.50 Net cash flow to common $85 - $99 $ 0.66 - $0.76 (Amounts in millions, except per share data) Represents annual cash potential if $1 billion offering size per REIT is realized. $ Amount Per Share (4) (2) (3) Annualized current common dividend per share $0.64 Less: Expected future run - rate cash G&A (6) $60 - $65 $0.46 - $0.50 |
|
|
10 Disciplined and Opportunistic Approach NorthStar has been disciplined, yet opportunistic, in managing its assets and liabilities Historically maintained, and continues to maintain, significant liquidity Limited near-term recourse debt and repurchased a significant portion of our recourse debt at significant discounts to par during credit crisis Disciplined investment approach that was focused on direct origination and not pre-packaged, “top of the market” Wall Street investments Opportunistic investments such as deeply discounted CMBS purchases and acquiring $1 billion CRE CDO for $7 million As of June 30, 2012, only two NPLs with a $4 million carrying value Consistently paid regular quarterly common dividends since going public, including four consecutive quarterly increases beginning Q3 of 2011 representing an aggregate 60% increase over this period |
|
|
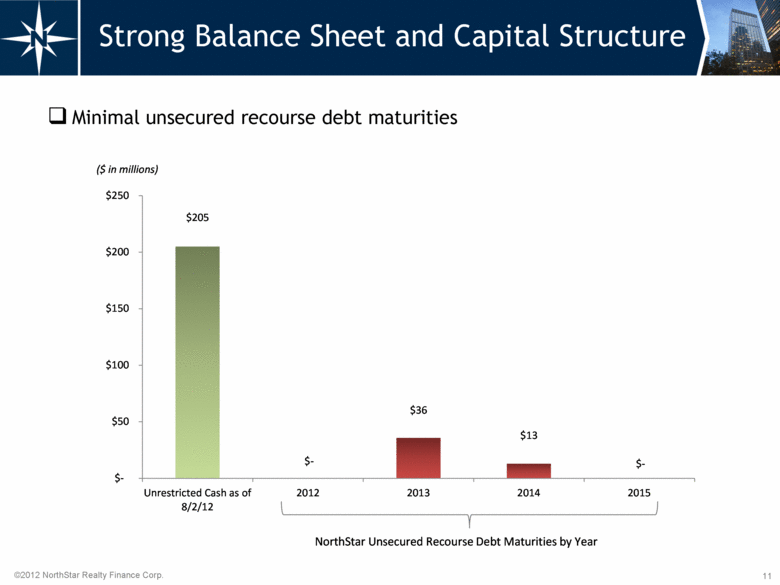
11 Strong Balance Sheet and Capital Structure Minimal unsecured recourse debt maturities $205 $- $36 $13 $- $- $50 $100 $150 $200 $250 Unrestricted Cash as of 8/2/12 2012 2013 2014 2015 NorthStar Unsecured Recourse Debt Maturities by Year ($ in millions) |
|
|
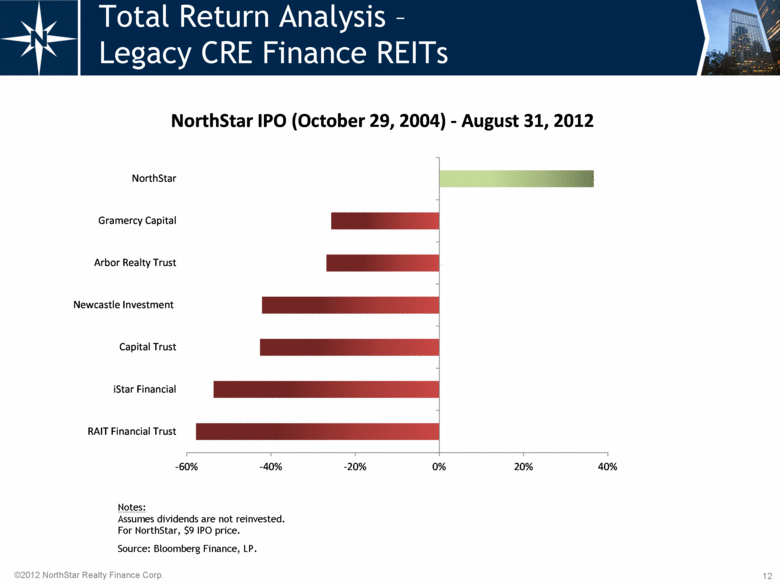
12 Total Return Analysis – Legacy CRE Finance REITs Notes: Assumes dividends are not reinvested. For NorthStar, $9 IPO price. Source: Bloomberg Finance, LP. -60% -40% -20% 0% 20% 40% RAIT Financial Trust iStar Financial Capital Trust Newcastle Investment Arbor Realty Trust Gramercy Capital NorthStar NorthStar IPO (October 29, 2004) - August 31, 2012 |
|
|
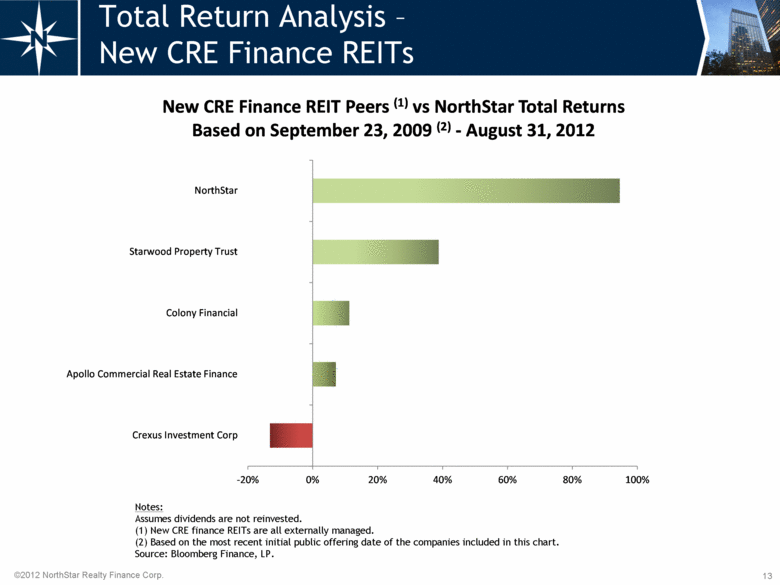
13 Total Return Analysis – New CRE Finance REITs Notes: Assumes dividends are not reinvested. (1) New CRE finance REITs are all externally managed. (2) Based on the most recent initial public offering date of the companies included in this chart. Source: Bloomberg Finance, LP. -20% 0% 20% 40% 60% 80% 100% Crexus Investment Corp Apollo Commercial Real Estate Finance Colony Financial Starwood Property Trust NorthStar New CRE Finance REIT Peers (1) vs NorthStar Total Returns Based on September 23, 2009 (2) - August 31, 2012 |
|
|
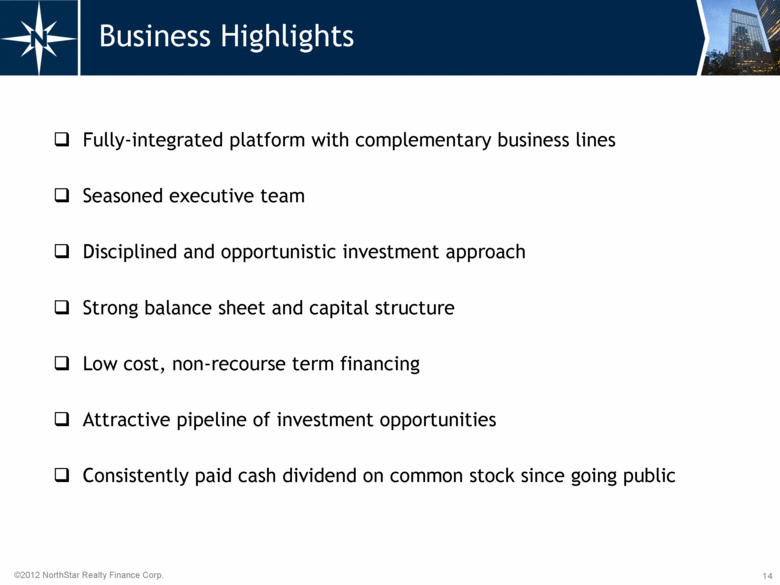
14 Business Highlights Fully-integrated platform with complementary business lines Seasoned executive team Disciplined and opportunistic investment approach Strong balance sheet and capital structure Low cost, non-recourse term financing Attractive pipeline of investment opportunities Consistently paid cash dividend on common stock since going public |
|
|
15 Appendix CRE Refinancing Opportunity Investments |
|
|
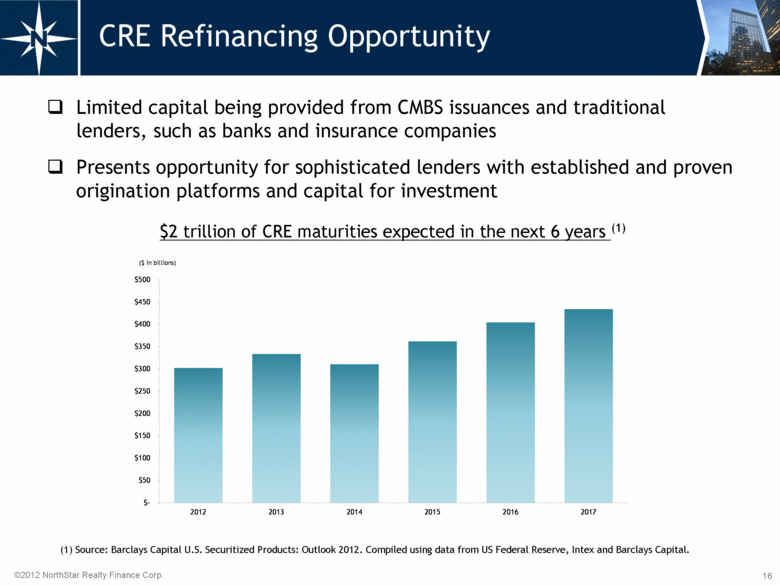
16 CRE Refinancing Opportunity Limited capital being provided from CMBS issuances and traditional lenders, such as banks and insurance companies Presents opportunity for sophisticated lenders with established and proven origination platforms and capital for investment $2 trillion of CRE maturities expected in the next 6 years (1) (1) Source: Barclays Capital U.S. Securitized Products: Outlook 2012. Compiled using data from US Federal Reserve, Intex and Barclays Capital. $- $50 $100 $150 $200 $250 $300 $350 $400 $450 $500 2012 2013 2014 2015 2016 2017 ($ in billions) |
|
|
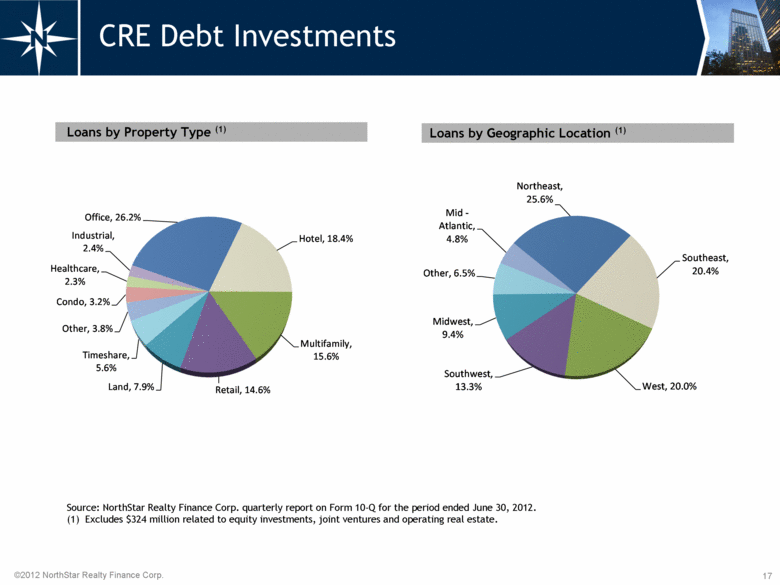
17 CRE Debt Investments Loans by Property Type (1) Loans by Geographic Location (1) Source: NorthStar Realty Finance Corp. quarterly report on Form 10-Q for the period ended June 30, 2012. (1) Excludes $324 million related to equity investments, joint ventures and operating real estate. Northeast, 25.6% Southeast, 20.4% West, 20.0% Southwest, 13.3% Midwest, 9.4% Other, 6.5% Mid - Atlantic, 4.8% Office, 26.2% Hotel, 18.4% Multifamily, 15.6% Retail, 14.6% Land, 7.9% Timeshare, 5.6% Other, 3.8% Condo, 3.2% Healthcare, 2.3% Industrial, 2.4% |
|
|
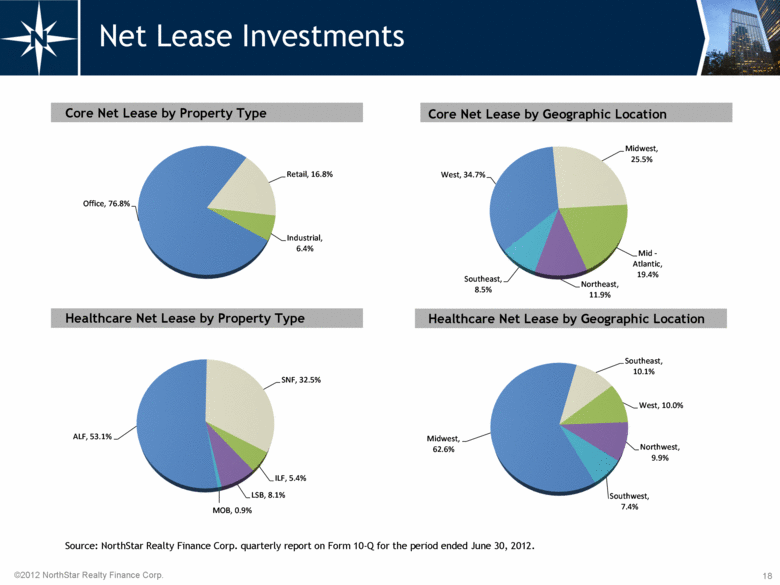
18 Net Lease Investments Healthcare Net Lease by Property Type Core Net Lease by Property Type Core Net Lease by Geographic Location Healthcare Net Lease by Geographic Location Source: NorthStar Realty Finance Corp. quarterly report on Form 10-Q for the period ended June 30, 2012. Midwest, 62.6% Southeast, 10.1% West, 10.0% Northwest, 9.9% Southwest, 7.4% ALF, 53.1% SNF, 32.5% ILF, 5.4% LSB, 8.1% MOB, 0.9% Office, 76.8% Retail, 16.8% Industrial, 6.4% West, 34.7% Southeast, 8.5% Midwest, 25.5% Northeast, 11.9% Mid - Atlantic, 19.4% |

