Attached files
| file | filename |
|---|---|
| 8-K - FORM 8-K - ModivCare Inc | d396068d8k.htm |
 2012
Annual Meeting August 16, 2012
Exhibit 99.1 |
 2
Cautionary Note about Forward-Looking Statements
This
presentation
contains
“forward-looking
statements”
within
the
meaning
of
the
Private Securities Litigation Reform Act of 1995. Words such as “believe,”
“demonstrate,”
“expect,”
“estimate,”
“forecast,”
“anticipate,”
“should”
and “likely”
and
similar expressions identify forward-looking statements. In addition, statements that
are not historical should also be considered forward-looking statements. Readers
are cautioned not to place undue reliance on those forward-looking statements,
which speak only as of the date the statement was made. Such forward-looking
statements are
based
on
current
expectations
that
involve
a
number
of
known
and
unknown
risks,
uncertainties
and
other
factors
which
may
cause
actual
events
to
be
materially
different
from those expressed or implied by such forward-looking statements. These factors
include, but are not limited to the global credit crisis, capital market conditions, the
implementation of the healthcare reform law, state budget changes and legislation and
other risks detailed in Providence’s filings with the Securities and Exchange
Commission. Providence is under no obligation to (and expressly disclaims any such
obligation to) update any of the information in this press release if any
forward-looking statement later turns out to be inaccurate whether as a result of
new information, future events or otherwise.
Forward-Looking Statements |
 PRSC Overview
Market Cap:
$143 million
Price (8/14/12):
$10.43
Range:
$8.35 -
$15.94
Diluted Shares Out:
13.4 million*
Avg. Volume
70,000
Cash Position:
$50.2 million*
Net LT Debt:
$95.3 million*
Revenue TTM:
$1,019 million*
Trailing 12M EPS:
$0.70
P/E (trailing):
14.9x
Price/Sales
0.14x
* Data as of 6/30/2012
3 |
 Leading provider of home and community based social
services and transportation services management
Clients are government beneficiaries eligible due to
income level and/or emotional/educational disabilities,
funded largely by Medicaid
Services are contracted primarily by state, city and
county levels of government and are delivered under
fee-for-service, cost-based, capitated and block
purchase arrangements
Deliver cost savings and improved effectiveness for
government social programs by reducing out of home
care and reducing transportation expense
4 |
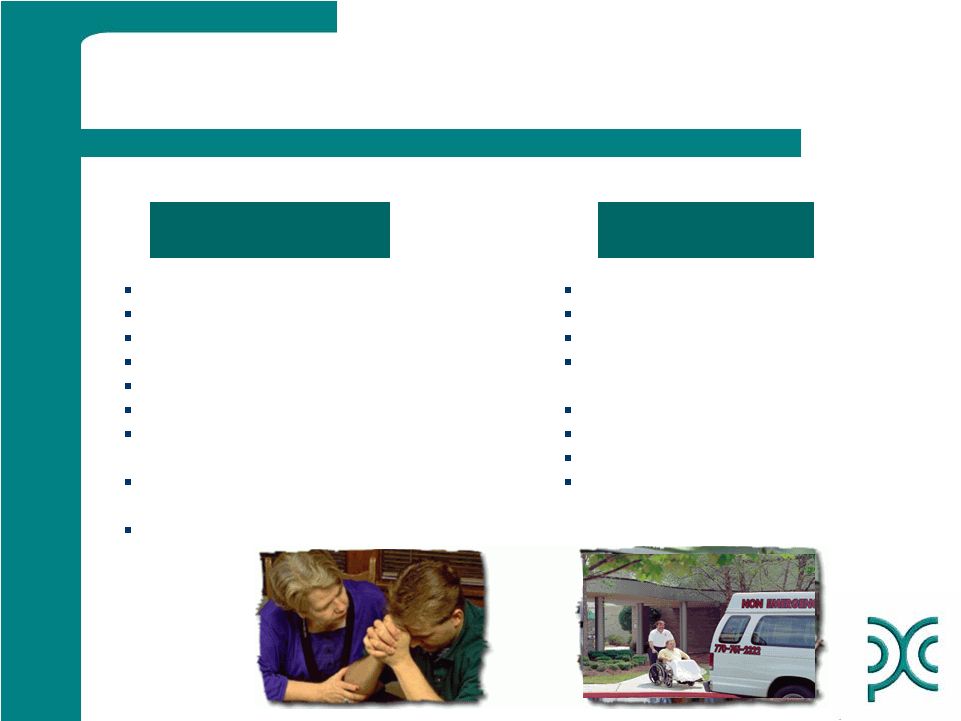 5
Home and Community
Based Counseling
Home based counseling
Intensive home based counseling
Substance abuse treatment services
School support services and tutoring
Correctional private parole services
Workforce development and job training
Therapeutic foster care, adoption
services
Developmentally disabled and autism
spectrum services
Mentoring
Point to point transportation
Customer, trip authorization
Call-center management
Utilization management and data
collection
Quality assurance
Billing and claims
Network credentialing
Case management
NET Services
Our Services |
 History of
Revenue Growth 6
$0
$200,000
$400,000
$600,000
$800,000
$1,000,000
2007
2008
2009
2010
2011
Social Services
NET |
 7
Revenue increased 7.2% to a record $943 million
–
NET services revenue up 8.1%
–
Social services revenue up 5.7%
Net Income of $16.9 million, $1.27 per diluted share
–
Includes non-cash charge of $2.5 million or $0.11 per share related
to write-off of unamortized deferred financing fees of the senior
credit facility
–
Includes gain of $2.7 million or $0.20 per share from a June 2011
acquisition
Generated $31.0 million cash from operations
Total debt reduction of approximately $31.8 million
Solid 2011 in the Face of a
Challenging Economic Environment |
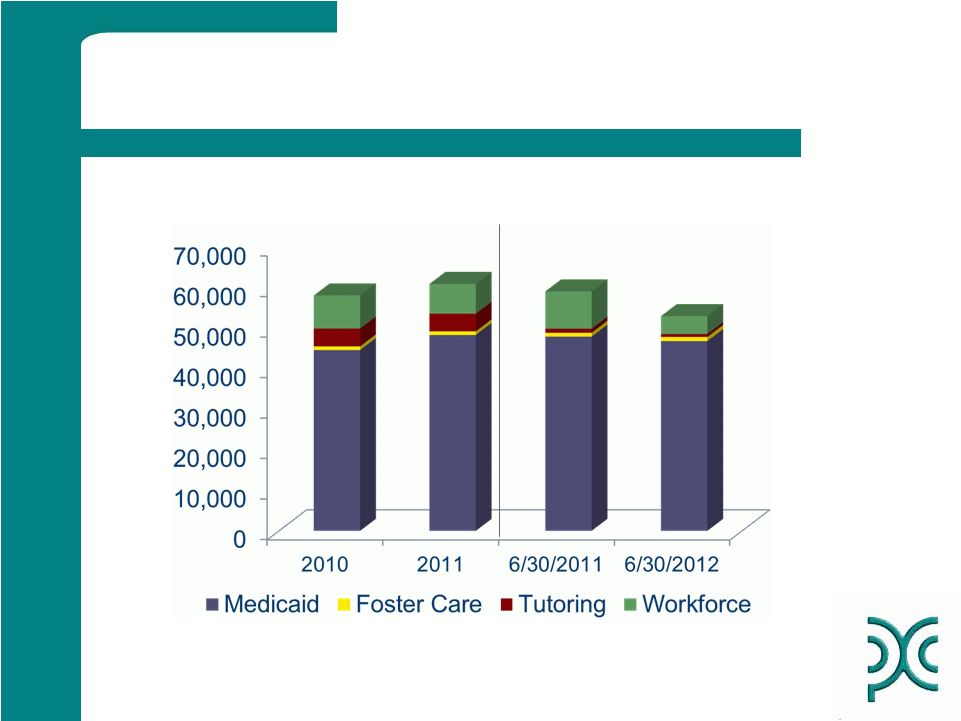 Social Service
Medicaid Client Base Remains Stable
8 |
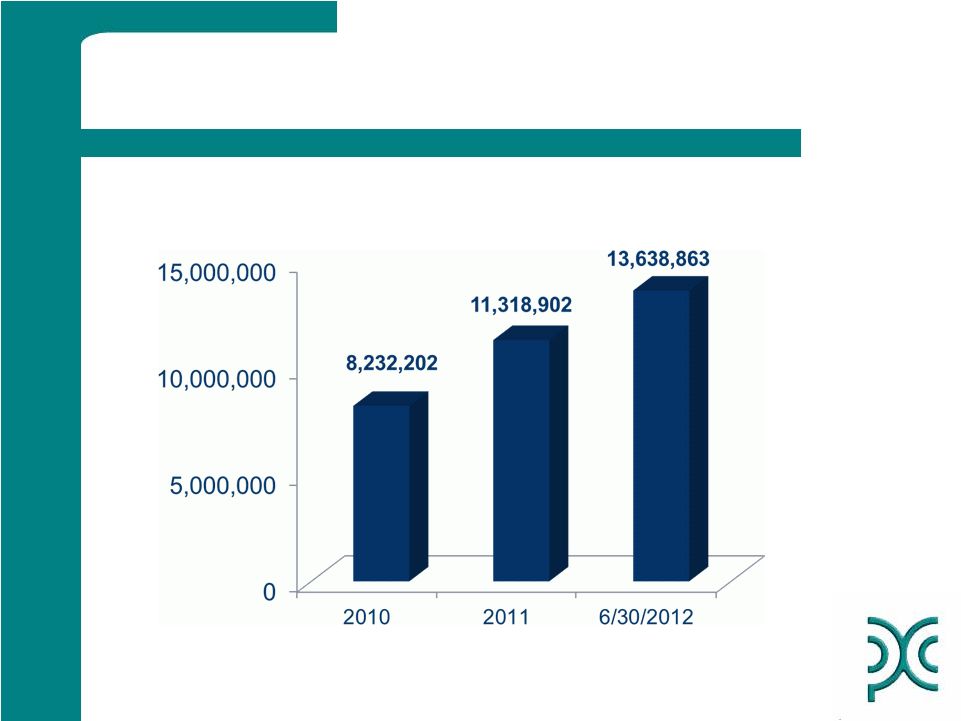 NET Membership
Driven by Contract Wins
9 |
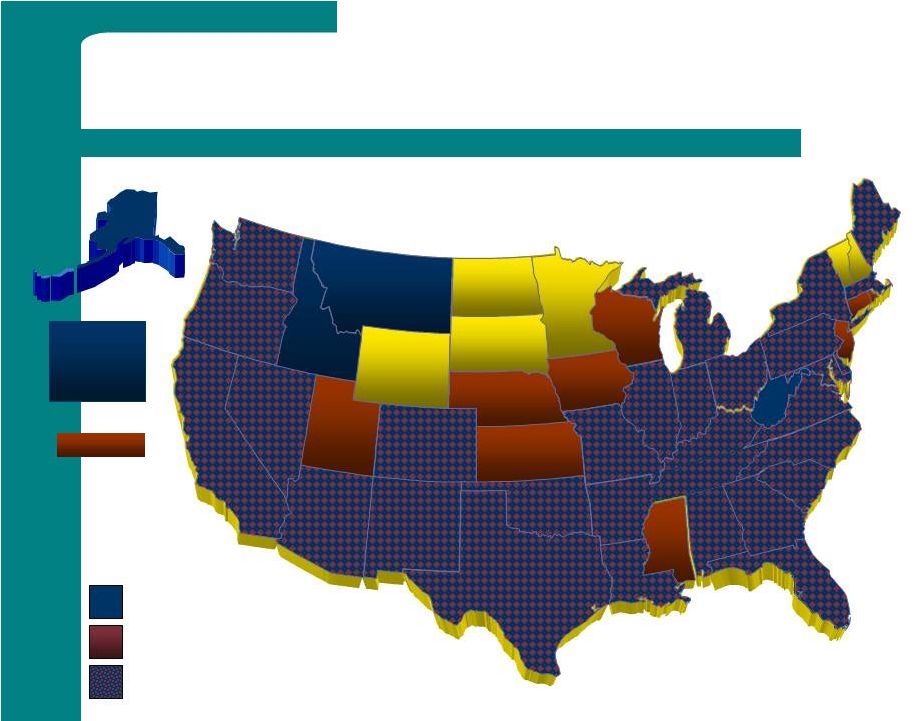 10
PRSC’s National Footprint
Social Services Only
NET Services Only
Both Social Services and NET Services
Canada
Hawaii
Locations
Employees: 7,977 Direct
(6/30/12)
3,265 Managed |
 Social
Services Segment Overview 550 contracts and over 53,000 clients (of 60
million eligibles) in 33
states,
the
District
of
Columbia,
British
Columbia
and
Alberta
*
Business built around steady organic growth and through
acquisitions
Pricing expected to be steady, substantially all contracts
renewed
Variable business model allows management to adjust to
challenges as necessary including state budget pressures and
system reforms that could challenge overall profit margin
11
* Data as of
6/30/2012 |
 NET Services
Segment Overview Leader in the $2.8 billion Medicaid NET benefit market with
79 contracts
in
38
states
and
over
13.6
million
covered
lives
*
Positive revenue trends as a result of recent bid success rate
-
Won 8 of 9 incumbent contracts up for rebid in 2011
•
Only loss Colorado (< $6M)
-
Won 5 of 5 new states in 2011
-
May service 40 states in 2012
12
* Data as of
6/30/2012 |
 NET Services
Segment Bid Results Retained Virginia, our second largest contract, as well
as contracts in Delaware, Arkansas, Nevada and Pennsylvania
Retained and expanded contracts in South Carolina and
Georgia
Also retained and expanded Connecticut after successful
protest, but new contract structure in 2013 will reduce
revenue recognition
Added Michigan and Wisconsin, Missouri was reinstated
Implemented new contract in Texas covering the Dallas
region
Completed implementation of two of the five phases of New
York City program
Contracted with managed care organizations in Florida,
Louisiana and Ohio for new Medicaid related programs
13 |
 14
NET
Margin Overview
Total start-up costs for 2012 are estimated at $3.5
million ($0.15 per share); $0.5 million remaining in
second half
3 states, which produced less than 25% of first half
2012 NET revenue, are not tracking to margin
targets
If not for operations in 3 of 38 states, NET would be
producing a margin of 6.5%, including start up costs, in
the first half of 2012
Rates are currently being renegotiated in these 3 states |
 Market
Trends are Generally Favorable
Medicaid enrollment currently expected to increase by 11 million
enrollees
in
2013
under
Healthcare
Reform
Legislation
1
States voluntary Medicaid enrollment increases will be fully
funded by the federal government. (only 8 states have opted out
thus far)
60%
of
Medicaid
dollars
still
spent
on
out-of-home
care
2
States now have federal financial incentives to increase home
and community based services and are redirecting clients away
from out-of-home care
A number of additional states are contemplating outsourcing their
transportation
1
Open Minds
2
CMS
15 |