Attached files
| file | filename |
|---|---|
| EXCEL - IDEA: XBRL DOCUMENT - ModivCare Inc | Financial_Report.xls |
| EX-31.1 - EXHIBIT 31.1 - ModivCare Inc | ex31-1.htm |
| EX-31.2 - EXHIBIT 31.2 - ModivCare Inc | ex31-2.htm |
| EX-12.1 - EXHIBIT 12.1 - ModivCare Inc | ex12-1.htm |
| EX-21.1 - EXHIBIT 21.1 - ModivCare Inc | ex21-1.htm |
| EX-32.2 - EXHIBIT 32.2 - ModivCare Inc | ex32-2.htm |
| EX-23.1 - EXHIBIT 23.1 - ModivCare Inc | ex23-1.htm |
| EX-32.1 - EXHIBIT 32.1 - ModivCare Inc | ex32-1.htm |
UNITED STATES
SECURITIES AND EXCHANGE COMMISSION
Washington, D.C. 20549
FORM 10-K
(Mark One)
|
☒ |
ANNUAL REPORT PURSUANT TO SECTION 13 OR 15(d) OF THE SECURITIES EXCHANGE ACT OF 1934 |
| For the fiscal year ended December 31, 2014 |
OR
|
☐ |
TRANSITION REPORT PURSUANT TO SECTION 13 OR 15(d) OF THE SECURITIES EXCHANGE ACT OF 1934 |
For the transition period from to
Commission file number 001-34221
The Providence Service Corporation
(Exact name of registrant as specified in its charter)
|
Delaware |
|
86-0845127 |
|
(State or other jurisdiction of incorporation or organization) |
|
(I.R.S. Employer Identification No.) |
|
64 East Broadway Blvd., Tucson, Arizona |
|
85701 |
|
(Address of principal executive offices) |
|
(Zip code) |
Registrant’s telephone number, including area code
(520) 747-6600
Securities registered pursuant to Section 12(b) of the Act:
|
Title of each Class |
|
Name of each exchange on which registered |
|
Common Stock, $0.001 par value per share |
|
The NASDAQ Global Select Market |
Securities registered pursuant to Section 12(g) of the Act:
None
Indicate by check mark if the registrant is a well-known seasoned issuer, as defined in Rule 405 of the Securities Act. ☐ Yes ☒ No
Indicate by check mark if the registrant is not required to file reports pursuant to Section 13 or Section 15(d) of the Act. ☐ Yes ☒ No
Indicate by check mark whether the registrant (1) has filed all reports required to be filed by Section 13 or 15(d) of the Securities Exchange Act of 1934 during the preceding 12 months (or for such shorter period that the registrant was required to file such reports), and (2) has been subject to such filing requirements for the past 90 days. ☒ Yes ☐ No
Indicate by check mark whether the registrant has submitted electronically and posted on its corporate Website, if any, every Interactive Data File required to be submitted and posted pursuant to Rule 405 of Regulation S-T (§ 232.405 of this chapter) during the preceding 12 months (or for such shorter period that the registrant was required to submit and post such files). ☒ Yes ☐ No
Indicate by check mark if disclosure of delinquent filers pursuant to Item 405 of Regulation S-K (§ 229.405 of this chapter) is not contained herein, and will not be contained, to the best of registrant’s knowledge, in definitive proxy or information statements incorporated by reference in Part III of this Form 10-K or any amendment to this Form 10-K. ☐
Indicate by check mark whether the registrant is a large accelerated filer, an accelerated filer, a non-accelerated filer, or a smaller reporting company. See the definitions of “large accelerated filer”, “accelerated filer” and “smaller reporting company” in Rule 12b-2 of the Exchange Act.
|
|
Large accelerated filer |
|
☐ |
|
Accelerated filer |
|
☒ | |
|
|
Non-accelerated filer |
|
☐ (Do not check if a smaller reporting company) |
|
Smaller reporting company |
|
☐ |
Indicate by check mark whether the registrant is a shell company (as defined in Rule 12b-2 of the Act). ☐ Yes ☒ No
The aggregate market value of the voting and non-voting common equity of the registrant held by non-affiliates based on the closing price for such common equity as reported on The NASDAQ Global Select Market on the last business day of the registrant’s most recently completed second fiscal quarter (June 30, 2014) was $423.9 million.
As of March 10, 2015, there were outstanding 15,902,354 shares (excluding treasury shares of 1,016,879) of the registrant’s Common Stock, $.001 par value per share, which is the only outstanding capital stock of the registrant.
DOCUMENTS INCORPORATED BY REFERENCE
All or a portion of items 10 through 14 in Part III of this Form 10-K are incorporated by reference to our definitive proxy statement on Schedule 14A for our 2015 stockholder meeting; provided that if such proxy statement is not filed on or before April 30, 2015, such information will be included in an amendment to this Report on Form 10-K filed on or before such date.
TABLE OF CONTENTS
|
|
|
Page No. |
|
PART I |
||
|
Item 1. |
Business |
4 |
|
Item 1A. |
Risk Factors |
19 |
|
Item 1B. |
Unresolved Staff Comments |
32 |
|
Item 2. |
Properties |
32 |
|
Item 3. |
Legal Proceedings |
33 |
|
Item 4. |
Mine Safety Disclosures |
33 |
|
PART II |
||
|
Item 5. |
Market for Registrant’s Common Equity, Related Stockholder Matters and Issuer Purchases of Equity Securities |
33 |
|
Item 6. |
Selected Financial Data |
36 |
|
Item 7. |
Management’s Discussion and Analysis of Financial Condition and Results of Operations |
39 |
|
Item 7A. |
Quantitative and Qualitative Disclosures About Market Risk |
68 |
|
Item 8. |
Financial Statements and Supplementary Data |
70 |
|
Item 9. |
Changes in and Disagreements With Accountants on Accounting and Financial Disclosure |
116 |
|
Item 9A. |
Controls and Procedures |
116 |
|
Item 9B. |
Other Information |
117 |
|
PART III |
||
|
Item 10. |
Directors, Executive Officers and Corporate Governance |
117 |
|
Item 11. |
Executive Compensation |
118 |
|
Item 12. |
Security Ownership of Certain Beneficial Owners and Management and Related Stockholder Matters |
118 |
|
Item 13. |
Certain Relationships and Related Transactions, and Director Independence |
118 |
|
Item 14. |
Principal Accounting Fees and Services |
118 |
|
PART IV |
||
|
Item 15. |
Exhibits, Financial Statement Schedules |
118 |
|
SIGNATURES |
124 | |
|
EXHIBIT INDEX |
||
PART I
Item 1. Business.
Background
The Providence Service Corporation (“Providence”, the “Company”, “we”, or “us”), which was formed in 1997, through its four business segments, provides and manages government sponsored non-emergency transportation (“NET”) services, human services, workforce development (“WD”) services and health assessment (“HA”) services. With respect to NET services, which operates under the Logisticare brand, we manage transportation networks and arrange for client transportation to health care related facilities and services for state or regional Medicaid agencies, managed care organizations (“MCOs”) and commercial insurers. With respect to our human services, our counselors, social workers and behavioral health professionals work with clients who are eligible for government assistance due to income level, disabilities or court order. With respect to our workforce development and justice services, provided primarily through Ingeus Proprietary Limited and its wholly and partly-owned subsidiaries and associates (collectively, “Ingeus”), which we acquired during the second quarter of 2014, we provide resume and job interview skills, networking and job placement services, and technical job training through internally staffed or outsourced resources. Additionally, with respect to our health assessment services, provided through CCHN Group Holdings, Inc. and its wholly-owned subsidiaries and affiliates (collectively, “Matrix”), which we acquired during the fourth quarter of 2014,we provide comprehensive health assessments (“CHAs”), for Medicare Advantage (“MA”) health plans, in members’ homes or nursing facilities.
Competitive Strengths
We believe the following competitive strengths uniquely position us to take advantage of the increase in the privatization of government sponsored services, as well as the home and community based delivery of behavioral health and other human services.
Leading market position and reputation
We believe we are the market leader in NET services, have a leading high-quality global workforce platform, are one of the largest for-profit providers of home and community based behavioral health services and, with the addition of Matrix, are the market leader in MA CHAs. We believe our market leadership and reputation for service quality in cost effective settings position us to benefit from the increased government outsourcing and the shift to home and community based care. Our broad footprint, as well as our local market density and knowledge, allows us to deliver a level of quality and responsiveness that smaller service providers are not always able to offer. This quality and responsiveness, coupled with our brand reputation and experienced management team, has allowed us to forge strong relationships with commercial business partners and national, state, and county government agencies.
Scalable operating platform
We believe the operational infrastructure within each of our business segments provides a competitive advantage. Unlike smaller competitors, we have developed a robust and scalable infrastructure, including functions such as quality assurance, compliance, risk management, information technology, and bidding and contract management. This infrastructure enables us to focus on efficiently delivering consistent, high-quality service and enables us to respond to the increasing compliance, regulatory and fiscal requirements of our customers. Our NET Services and WD Services segments utilize proprietary technology platforms to achieve efficiencies that are difficult for our competitors to match. These systems serve as the primary operating platforms for these businesses, and allow for the effective management of provider networks, enhanced reporting capabilities, and real-time detailed client tracking. We believe that the deployment of these technology platforms facilitate timely and accurate assessments of our business performance, and allow us to track and respond to identified trends efficiently. We believe that Matrix’s network of nurse practitioners (“NPs”) and a scalable operating platform, supported by proprietary technology, represents a key competitive advantage in the market for CHAs.
Diversified program and payer mix
Providence consists of four discrete business segments, characterized by decentralized management and location-specific service offerings. Our service offerings span NET, HA, and Human and WD services. Our payers include national, state, county and other government bodies as well as managed care organizations. Our business segments utilize various payment models including capitated, fee-for-service (“FFS”) and performance-based, which provide further revenue and cash flow diversification.
Ability to drive quality outcomes in low cost settings presents significant value proposition for payers and clients
Through our ability to design customized service plans that meet the unique needs of our clients in cost effective settings, we believe we offer a powerful value proposition to our payers and, ultimate clients. Rising costs are driving payers to shift away from costly facility based delivery and towards lower cost home, community and service center based delivery. For example, in the US, in order to save costs, Medicaid spending on long-term care has been shifting towards lower cost home and community based services. As a result, we estimate Medicaid home and community based services spending as a percent of total Medicaid long- term services and support expenditures has grown from 18% in 1995 to 50% in 2012, and is expected to continue growing. Internationally, there is a growing trend to shift the delivery of social services to the private sector with strict accountability for measurable results. We believe we are well positioned to benefit from these trends, as we provide a lower cost alternative for delivering social and medical care services, and drive high quality outcomes.
Positioned to benefit from emerging healthcare and social service trends
We believe we are well positioned to benefit from trends in healthcare, including the growth of Medicare, Medicaid and dual eligible (individuals eligible for both Medicaid and Medicare) populations, the growth in MA plan enrollment, development of integrated delivery models and increased focus on logistics management to improve patient access to preventative and health management services. Increasingly, individuals in need of our services are living longer lives, requiring additional care and in many cases outliving the ability to reside independently or with family caregivers. The Medicaid population is also expanding as a result of healthcare reform. We expect to continue to expand our service lines to meet these growing demands across all of our segments.
Business Strategy
Grow our volumes and expand our services in existing markets
We expect to leverage our market reputation and core competencies to capture growth opportunities embedded in our current business platforms. Our core competencies include managing provider networks, tailoring services to community needs, effective and efficient bidding and contracting processes, logistics management and designing service delivery models to achieve superior outcomes. By enhancing and leveraging these core competencies, we believe we can benefit from emerging trends in healthcare and human services.
Pursue opportunities in adjacent markets and complementary service lines
We have a proven track record of expanding both organically and through acquisitions into adjacent markets and we intend to leverage our core competencies and relationships with national, state, and county governmental entities, as well as commercial health plans to pursue additional expansion opportunities. We typically pursue organic and strategic expansion into markets that are contiguous to our existing markets or where we believe we can quickly establish a significant presence. In addition, we will continue to seek opportunities to cross-sell our services throughout our platform.
Increase returns on capital by enhancing our service offerings and improving performance
We believe we can continue to improve efficiencies and increase returns on capital by utilizing our expertise within our existing programs and by capitalizing on our increasing scale. In addition, we will invest in strong markets and premium products and programs while selectively exiting underperforming service lines, improving management systems, and improving bidding and contracting discipline.
Drive long-term intrinsic value embedded in our recent acquisitions
We believe that there is opportunity to increase the intrinsic value of our 2014 acquisitions of Ingeus and Matrix. Ingeus has a presence in ten countries outside the US, which substantially increases our international footprint. We intend to build upon Ingeus’s successful track record of delivering value added services, as well as utilizing its reputation to enter new international markets and service lines.
Additionally, we believe Matrix has multiple growth opportunities. We believe Matrix is well positioned to increase CHA volumes within its existing MA customer base and to add new MA customers. Matrix’s offerings are extensible across adjacent markets (Medicaid, dual eligible, and commercial), which, like the Medicare market, have a need to better assess, stratify, and mitigate risk.
Financial information about our segments
We operate in four segments, NET Services, Human Services, WD Services and HA Services. Financial information about segments and geographic areas, including revenues, net income and long-lived assets of each segment and from domestic and foreign operations for the Company as a whole is included in Note 19 of our consolidated financial statements presented elsewhere in this report and is incorporated herein by reference. Additionally, see Item 1A, Risk Factors, for a discussion of risks related to our foreign operations.
Business description
NET Services
Services offered. We are a provider of NET management services providing solutions to clients under 109 contracts in 39 states and the District of Columbia. We provide responsive and innovative solutions for a healthcare recipient’s covered transportation benefit through centralized call processing, development and management of transportation networks through the use of proprietary technologies. Our current payers include state Medicaid programs, local government agencies, hospital systems and MCOs providing Medicare, Medicaid and commercial products. For 2014, 2013 and 2012, our NET services accounted for 59.7%, 68.6% and 67.9%, respectively, of our consolidated revenue.
We provide services to a wide variety of people with varying needs. Our payers are primarily state Medicaid agencies and MCOs. Our clients are typically Medicaid or Medicare eligible members, as defined by our payers, most of whom are individuals with limited mobility, people with limited means of transportation and people with disabilities that prevent them from using conventional methods of transportation. The majority of our programs provide NET services to Medicaid members. Utilization rates and vehicle requirements differ depending on the individual’s condition, the location of the individual relative to the final destination, and available transportation systems.
As a transportation logistics manager, we match transportation services with the recipient’s needs. We employ a proprietary information technology platform and operational processes to manage the transportation services through a contracted network of transportation providers. As such, we typically do not provide direct transportation to end users. Rather, to fulfill requests under our contracts, we contract with local transportation providers, such as operators of multi-passenger and wheelchair equipped vans, taxi companies and ambulance companies. We receive transportation requests from members or their representatives, such as social workers, and arrange for the least costly and most effective transportation. We process transportation requests by assigning local transportation providers out of one of our 28 call and/or regional support centers. These decisions are aided by our proprietary logistics software. After we assign an appropriate transportation provider to the member, we carefully monitor the transportation service provided to ensure that the transport was completed before we pay the transportation vendor. We do not normally pay for services if the member does not show up for transport, or if the transport is not completed. A majority of the requests for transportation are standing orders, mostly for patients who require frequent, recurring services such as dialysis treatment. Most transportation requests are required to be scheduled with 48 to 72 hour advance notice, with a small number of requests scheduled on the same day, such as hospital discharges.
We contract with larger transportation companies as well as a number of diverse, small, local companies in order to provide superior coverage in both urban and rural areas. As part of this comprehensive provider network management, we provide access to third party screening and credentialing of drivers and transportation companies, provide program rule orientation, and monitor performance on an ongoing basis through field audits, performance reporting and other reviews. We typically use multiple transportation providers in each state, with an average provider fleet size of less than 10 vehicles. To ensure compliance and safety quality standards for all transportation providers, we perform a credentialing process for all of our network transportation providers who must meet minimum standards set by us and our payers. These standards include: (i) successful completion of criminal and driving record checks; (ii) required drug testing; (iii) required driver and program training on such topics as HIPAA, defensive driving, patient sensitivity, cultural diversity and first aid; (iv) both scheduled and random inspections of provider owned and/or leased vehicles and communication systems; and (v) insurance coverage that complies with contractual and statutory requirements. Our contracts with transportation providers are on a per completed trip basis and do not contain volume guarantees. They can be cancelled without cause with 60 days’ notice.
Revenue and payers. We contract primarily with state and local government entities and MCOs. Approximately 80.9% of our NET services revenue in 2014 was generated under capitated contracts where we assume the responsibility of meeting the covered transportation requirements of a specific geographic population. These contracts are generally structured with fixed per member, per month payment rates based on a defined scope of work and population to be served. Typical state payer contracts are for three to five years with renewal options and range in size from approximately $2 million to $150 million annually. Approximately 5.7% of our NET services revenue is derived from FFS contracts and approximately 8.5% is derived from flat fee contracts.
We generate a significant portion of our revenue from a few payers. We derived approximately 17.0%, 15.3% and 15.2% of our NET services revenue from our contract with the State of New Jersey for the years ended December 31, 2014, 2013 and 2012, respectively. Additionally, we derived approximately 8.2%, 9.2% and 9.6% of our NET services revenue from our contract with the State of Virginia’s Department of Medical Assistance Services for the years ended December 31, 2014, 2013 and 2012, respectively. Our next three largest payers in the aggregate comprised approximately 18.0%, 19.2% and 18.4% of our NET services revenue for the years ended December 31, 2014, 2013 and 2012, respectively.
Our contracted per member, per month fee is predicated on actual historical transportation data for a defined population and geographical region, future assumptions on key cost and program drivers, actuarial analysis performed in-house as well as by third party actuarial firms and actuarial analysis provided by our payers. Our contract pricing is regularly reevaluated and may be reset based on actual experience under the contract, with adjustments for membership fluctuations and inflation factors such as cost of labor, fuel, insurance and utilization increases and decreases stemming from program re-designs.
Seasonality. The quarterly operating income and cash flows of our NET Services segment normally fluctuate as a result of seasonal variations in the business, principally due to lower client demand for NET services during the holiday and winter seasons. Due to the fixed revenue stream and variable expense base structure of our NET Services operating segment, expenses typically vary with these changes and, as a result, such expenses fluctuate on a quarterly basis. We expect quarterly fluctuations in operating income and cash flows to continue as a result of the seasonal demand for NET services.
Competition. We compete with a variety of organizations that provide similar NET services to Medicaid eligible beneficiaries in local markets, such as American Medical Response, Inc., Medical Transportation Management Inc., and SoutheasTrans., as well as a host of local and regional transportation providers. Most local competitors may seek to win contracts for specific counties or small geographic territories whereas we and the larger competitors listed above seek to win contracts for an entire state or large regional area. Historically, we have been successful in competitively bidding our NET management services for state-wide or other large Medicaid population programs, as well as specialized NET benefits often offered to populations covered by MCOs. We compete based on our technical expertise and experience, which is delivered in a high service, competitive price environment, although we are not necessarily the lowest priced management service provider in many instances. We have experienced, and expect to continue to experience, competition from new entrants into our markets that may be willing to provide services at a lower cost. Regardless of how well we perform under our contracts (based on service or cost), we face competitive rebid situations from time to time. Increased competitive pressure could result in pricing pressures, loss of or failure to gain market share or loss of payers, any of which could harm our business.
Business development. With respect to our NET services sales and marketing strategy, we focus on providing information to key legislators and agency officials. We pursue potential opportunities through various methods including engaging lobbyists to assist in tracking legislation and funding that may impact NET programs, and monitoring state websites for upcoming requests for proposals (“RFPs”). In addition, we generate new business leads through trade shows and conferences, referrals, the Internet and direct marketing. The sales cycle usually takes between 6 to 24 months and there are various decision makers who provide input into the decision to outsource. By providing valuable information to key legislators and agency officials and creating a strong presence in the regions we serve, we are able to solidify the chance of renewal when contract terms expire. Additional payers are targeted within existing states in order to leverage pre-existing provider networks, technology, office and human resources investments. Furthermore, we target key commercial accounts which we define as accounts that are growing and located in multiple geographic areas.
In many of the states where we have regional contracts, we seek to expand to include additional regions in these states and in contiguous states. All decisions about which RFPs to consider are centralized and selectively targeted based on our goals and service capabilities. Medicaid NET Services contracts with state agencies and larger Medicaid MCOs represent the largest source of our NET Services revenue.
Human Services
Services offered. We primarily provide home and community based services and foster care services. The following describes these services:
Home and community based counseling
|
|
• |
Home based and intensive home based counseling. Our home based counselors are trained professionals or para-professionals providing counseling services in the client’s own home. These services average five hours per client per week and can include individual, group or family sessions. Topics are prescriptive to each client and can include family dynamics, peer relationships, anger management, substance abuse prevention, conflict resolution and parent effectiveness training. |
We also provide intensive home based counseling, which consists of up to 20 or more hours per client per week. Our intensive home based counselors are masters or Ph.D. level professional therapists or counselors. Intensive home based counseling is designed for clients struggling to cope with everyday situations. Our counselors are qualified to assist with marital and family issues, depression, drug or alcohol abuse, domestic violence, hyperactivity, criminal or anti-social behavior, sexual misbehavior, school expulsion or chronic truancy and other disruptive behaviors. In the absence of this type of counseling, many of these clients would be considered for 24-hour institutional care or incarceration.
|
|
• |
Substance abuse treatment services. Our substance abuse treatment counselors provide services in the office, home and counseling centers designed especially for clients with drug or alcohol abuse problems. Our counselors use peer contacts, treatment group process and a commitment to sobriety as treatment methods. Our professional counseling, peer counseling and group and family sessions are designed to introduce clients dependent upon drugs or alcohol to a sober lifestyle. |
|
|
• |
School support services. Our professional counselors are assigned to and stationed in public schools to assist in dealing with problematic and at-risk students. Our counselors provide support services such as teacher training, individual and group counseling, logical consequence training, anger management training, gang awareness and drug and alcohol abuse prevention techniques. In addition, we provide in-home educational tutoring in numerous markets where we contract with individual school districts to assist students who need assistance in learning. |
|
|
• |
Correctional services. We provide private probation supervision services, including monitoring and supervision of those sentenced to probation, rehabilitative services, and collection and disbursement of court-ordered fines, fees and restitution. |
|
|
• |
Workforce development. We assist individuals in obtaining and retaining meaningful employment through services that include vocational evaluation, job placement, skills training, and employment support. These services are offered in the United States (“US”) and Canada. |
For 2014, 2013 and 2012, our home and community based services represented approximately 21.6%, 27.2% and 28.0%, respectively, of our consolidated revenue.
Foster care
|
|
• |
Foster care. We recruit and train foster parents and license family foster homes to provide 24-hour care to children who have been removed from their homes due to physical or emotional abuse, abandonment, or the lack of appropriate living situations. We place individual children and, when possible, sibling groups, in a licensed home. Each child is provided 24-hour care and supervision by trained foster parents. Our professional staff and counselors match and supervise the child and foster family. We also provide tutoring and other services to the child and foster family. |
|
|
• |
Therapeutic foster care. We provide therapeutic foster care services. This is a 24-hour care service designed for children exhibiting serious emotional problems who may otherwise require institutional treatment. We recruit, license and train professional foster parents to care for foster children for up to a year of therapeutic intervention. Social, psychological and psychiatric services are provided on a prescriptive basis to each child and therapeutic foster care family by a team of licensed, professional staff. |
Revenue and payers. Substantially all of our revenue related to our Human Services operating segment is derived from contracts with state or local government agencies and government intermediaries.
Fee-for-service contracts
The majority of our contracts are negotiated FFS arrangements with payers. Home and community based services are generally payable by the hour depending on the type and intensity of the service. Foster care services are generally payable pursuant to a fixed monthly fee. Approximately 76.0%, 72.0% and 72.5% of our Human Services operating segment revenue for the fiscal years ended December 31, 2014, 2013 and 2012 were FFS arrangements. A significant number of our FFS contracts allow the payer to terminate the contract immediately for cause, such as for our failure to meet our contract obligations. Additionally, these contracts typically permit the payer to terminate the contract at any time prior to its stated expiration date without cause, at will and without penalty to the payer, either upon the expiration of a short notice period, typically 30 days, or immediately, in the event federal or state appropriations supporting the programs serviced by the contract are reduced or eliminated.
We generate a significant portion of our revenue from a few payers. Under our contract with the State of Virginia’s Department of Medical Assistance Services, we derived approximately 10.6%, 11.1% and 10.1% of our Human Services segment revenue for the years ended December 31, 2014, 2013 and 2012, respectively.
Cost-based service contracts
Revenues from our cost-based service contracts are generally recorded based on a combination of direct costs, indirect overhead allocations, and stated contractual margins on those incurred costs. These revenues are compared to annual contract budget limits and, depending on reporting requirements, reductions of revenue may be recorded for certain contingencies. This results in revenue from these contracts being recorded based on allowable costs incurred. The annual contract amount is based on projected costs to provide services under the contracts with adjustments for changes in the total contract amount. Annually, we submit projected costs for the coming year which assist the contracting payers in establishing the annual contract amount to be paid for services provided under the contracts. We submit monthly cost reports which are used by the contracting payers to determine the amount, if any, by which funds paid to us for services provided under the contracts were greater than the allowable costs to provide these services. Completion of this review process may range from one month to several years from the date we submit the cost report. In cases where funds paid to us exceed the allowable costs to provide services under contract, we may be required to pay back the excess funds.
Our cost reports are routinely audited by our contracted payers on an annual basis. We periodically review our provisional billing rates and allocation of costs and provide for estimated adjustments from the contracting payers. We believe that adequate provisions have been made in our consolidated financial statements for any adjustments that might result from the outcome of any cost report audits. Differences between the amounts provided and the settlement amounts are recorded in our consolidated statement of income in the year of settlement. Cost-based service contracts represented approximately 19.0%, 20.3% and 18.6% of our Human Services operating segment revenue for the years ended December 31, 2014, 2013 and 2012.
Block purchase (capitated) contract
We also provide certain services under an annual block purchase contract. We are required to provide or arrange for behavioral health services to eligible populations of beneficiaries as defined in the contract. We must provide a complete range of behavioral health services, including clinical, case management, therapeutic and administrative. We are obligated to provide services only to those clients with a demonstrated medical necessity. There is no contractual limit to the number of eligible beneficiaries that may be assigned to us, or a limit to the level of services that must be provided to these beneficiaries if the services are deemed to be medically necessary. Therefore, we are at-risk if the costs of providing necessary services exceed the associated reimbursement under the contractual arrangement. However, during the years ended December 31, 2014, 2013 and 2012, the eligible beneficiaries that were assigned to us did not exceed our budgeted expectations for those years. The terms of the contract typically are reviewed prospectively and amended as necessary to ensure adequate funding of our service offerings under the contract; however, no assurances can be made that such funding will adequately cover the costs of services previously provided. The annual block purchase contract represented 4.6%, 5.4% and 5.4% of our Human Services operating segment revenue for the years ended December 31, 2014, 2013 and 2012, respectively.
Seasonality. Our quarterly operating results and operating cash flows normally fluctuate as a result of seasonal variations in our Human Services operating segment, principally due to lower client demand for our home and community based services during the holiday and summer seasons. As our business has grown, our exposure to seasonal variations has also grown, and will continue to grow, particularly with respect to our school based, educational and tutoring services. Because the majority of our contracts are FFS, we experience lower home and community based services revenue when school is not in session. Our operating expenses, however, which are comprised largely of payroll and related costs, do not vary significantly with these changes. As a result, our Human Services operating segment experiences lower operating margins during the holiday and summer seasons. We expect quarterly fluctuations in operating results and operating cash flows to continue as a result of the seasonal demand for our home and community based services.
Competition. The human services industry is a highly fragmented industry. We compete for clients with a variety of organizations that offer similar services. Most of our competition consists of local human services organizations that compete with us for local contracts, such as agencies supported by the United Way, and faith-based agencies such as Catholic Social Services, Jewish Family and Children’s Services and the Salvation Army. Other competitors include local not-for-profit organizations and community based organizations. Historically, these types of organizations have been favored in our industry as incumbent providers of services to government entities. On a national level, there are very few organizations that compete for local, county and state contracts to provide the types of services we offer. We also compete with larger companies, such as Res-Care, Inc., which provides support services, training and educational programs predominantly to Medicaid eligible beneficiaries. National Mentor, Inc. is the country’s largest provider of foster care services and competes with us in certain markets for foster care services. Many institutional providers offer some type of community based care including such organizations as The GEO Group, Inc. and The Devereaux Foundation. While we believe that we compete on the basis of price and quality, many of our competitors have greater financial, technical, political and marketing resources, name recognition, and a larger number of clients and payers than we do. In addition, some of these organizations offer more services than we do. We have experienced, and expect to continue to experience, competition from new entrants into our markets. Increased competition may result in negative pricing pressures, loss of or failure to gain market share or loss of clients or payers.
Business development. Substantially all of our marketing is performed at the local and regional level. Through our local and regional managers, we have successfully developed and maintained extensive relationships with various payers. These relationships allow us to develop leads on new business, cross-sell our other services to existing payers and negotiate payer contracts. A significant portion of our business is procured in this manner. We also seek to market our services to payers in geographical areas contiguous to existing markets and in which we believe our reputation as a low cost quality service provider will enhance our ability to compete for and win business. From time to time we respond to RFPs. Additionally, we subscribe to a service that keeps us informed of and tracks on a national basis RFPs for privatization of human services. We selectively choose the RFPs to which we respond based upon whether our reputation enhances our ability to compete or if the RFP presents a unique opportunity to develop a new service offering.
WD Services
Services offered. Through Ingeus, we provide workforce development services that include resume and job interview skills, networking and job placement services, and technical job training through internally staffed or outsourced resources. Our end-user client base is broad, and includes long-term unemployed, disabled, and unskilled individuals, as well as individuals that cope with medical illnesses, are newly graduated from educational institutions, and those that have been released from incarceration for an extended length of time. As of December 31, 2014, our WD Services segment operates across ten countries, including Australia, France, Germany, Poland, Saudi Arabia, South Korea, Spain, Sweden, Switzerland and the United Kingdom.
Revenue, payers and clients. We contract primarily with national government entities that seek to reduce the unemployment rate generally, or for specific targeted cohorts. For the year ended December 31, 2014, approximately 77.6% and 9.4% of our WD Services revenue and consolidated revenue, respectively, was derived from operations in the United Kingdom. The nature of services offered by our WD Services segment may require significant upfront capital and operating cost outlays upon contract award, while revenues may be payable in large part only after incentive measures are achieved or the clients’ continued employment for a substantial period of time has been established. Further, the level of funding required is dependent upon the size and nature of the contract, and the timing of revenue recognition will vary based upon contract terms. Because of these two factors, there can be significant variability in our earnings from quarter to quarter, and from year to year. Our legacy workforce development services not related to Ingeus are included in the Human Services segment for the years ended December 31, 2014, 2013 and 2012.
Seasonality. While there has been period-to-period variability in the Ingeus earnings due to the factors set forth in Item 7 “Management’s Discussion and Analysis of Financial Condition and Results of Operations – How We Earn our Revenue – WD Services,”, there has not been a material seasonal effect on Ingeus’s results of operations.
Competition. The international workforce development market is comprised primarily of large multi-national corporations that provide a wide range of human resource, networking and job placement services, and smaller niche companies that generally provide services to an individual country or a small host of countries. Our larger competitors include Maximus, Manpower, Adecco, Randstad, G4S and Serco. We believe we have been successful bidding for large, nationwide contracts, and have also focused on significant contracts that cover smaller geographic regions within various countries. While our larger competitors also have deployed the same strategy, we believe we have been successful competing based on our reputation for past success, high level of professionalism and service delivery, and demonstrated expertise in our market space. While we are not always the lowest priced competitor in all situations, we do experience price pressure during the bid process, and sometimes post-bid when a contract is up for renewal. Increased competitive pressure could result in negative pricing pressures, loss of or failure to gain market share or loss of payers.
Business development. Our business development activities for our international workforce development business are performed at both the local country level as well as centrally in the WD Services segment headquarters in London. Through local and global networks and relationships, we become aware of new opportunities for which we develop bids through the RFP process. The nature of the RFP process varies from highly competitive to being one of a few, or the sole, service provider to bid on a contract. We market heavily on our past successes and performance, as well as competitive pricing. Our primary focus is building large, national contract bases, but we also have begun to expand into more regional markets within countries where we currently operate. Through local and international formal and informal lobbying efforts, we provide educational information to government officials regarding the economic efficiency of workforce development privatization. We perform extensive profitability and service delivery modeling before entering bids, and selectively choose which opportunities to pursue.
HA Services
Services offered. Through Matrix, we deliver CHAs and related services through a national network of approximately 800 NPs located in communities throughout 33 states. Matrix’s model of delivering services through an employed network of NPs affords greater control, uniformity, and consistency in managing and training providers to deliver high quality services for its customers and their members. The NPs also reside in the same geographic area as the beneficiaries they serve, considerably improving their knowledge and access to medical and community based services.
Matrix’s CHAs are conducted at the member’s home or residential facility. Unlike a typical 8 to 15 minute office visit with a physician or physician’s assistant, which is often singularly focused on a specific symptom or condition, Matrix NPs spend up to 60 minutes with each member and any of the member’s family members or caregivers he or she chooses. The CHA is comprehensive and is comprised of a number of distinct components. In addition to checking vital signs and performing a physical examination, Matrix NPs review the member’s health history and medical prescriptions, conduct a depression screening, evaluate the immediate residential setting for any physical safety issues, review recommended screening tests, and conduct a series of geriatric screens for fall risks, nutrition, and cognitive function. As the evaluation is intended to provide a complete clinical assessment, Matrix NPs are also trained to record all diagnoses of medical conditions.
The data collected during the CHA is captured electronically in real-time in a portable tablet that each NP brings to the member’s residence. The CHA process is also specifically designed to engage and coordinate with the member’s care network to facilitate follow-up care and treatment. Following each CHA, educational and clinical information is shared with the member, provider and MA plan to identify and close gaps in care. The CHA measures MA plan liability and assists in determining risk adjusted payments made by Medicare to the MA plan. In addition to identifying opportunities to improve and optimize care, Matrix’s service offering can deliver immediate impact on care outcomes.
Revenue, payers and clients. As of December 31, 2014, Matrix customers included approximately 34 MA plans, including for profit multi-state MA plans and non-profit MA plans that operate in only one state or several counties within one state. Matrix serves many of the largest and most prestigious health plans and health systems in the US. From October 23, 2014 to December 31, 2014, Matrix’s top five customers accounted for approximately 70.8% of its revenue, and its largest customer accounted for about 43.2% of its revenue. Matrix enters into annual or multi-annual contracts with its customers under which it is paid on a per assessment basis.
Seasonality. CHAs are typically provided as part of MA plan’s annual program and are conducted with an individual member once per year. Historically, Matrix has experienced higher CHA volume in the second half of the calendar year as a result of an accelerating demand towards year-end from its existing customers and Matrix’s growing customer base.
Competition. We believe that Matrix and CenseoHealth are the largest providers of CHAs to the MA market. There are many smaller volume competitors, including EMSI Healthcare Services, MedXM, and Inovalon, Inc. Some MA plans internally provide CHA services for their members. The foundation of Matrix’s CHA programs is a network of full-time, community-based NPs. Matrix believes that this network provides a competitive advantage versus alternative models that rely upon a subcontracted network of part-time staff. Matrix’s employed network of community-based NPs and supporting management and infrastructure results in consistency, quality, and compliance in the delivery of CHAs and care management. Matrix’s services are often priced at a premium relative to its competitors, and Matrix believes it will continue to maintain a pricing differential as result of: (i) Matrix’s national footprint across 33 states, (ii) Matrix’s sophisticated stratification techniques to identify gaps in data and care, (iii) Matrix’s multi-channel member engagement capabilities, (iv) the benefits of Matrix’s full-time, dedicated, community based NPs, (v) Matrix’s greater control, uniformity and consistency in delivering high quality services for beneficiaries, and (vi) Matrix’s ability to execute and deliver the assessment goals of its customers.
Business development. The Affordable Care Act (“ACA”) expansion is creating significant opportunities for growth as risk-bearing healthcare organizations have an increasing need to assess, stratify, and ultimately mitigate the risk of member populations. In particular, the rapidly evolving healthcare industry landscape is expanding the market opportunity for CHAs across the following populations:
• Medicaid Expansion. At least 24 states use a risk adjustment model to adjust Medicaid Managed Care payments to health plans. The prevalence of risk adjustment in Medicaid is expected to expand as states need to create equitable incentives for plans to serve high-risk individuals in managed care as well as drive improvements in care quality. According to Centers for Medicare & Medicaid Services (“CMS”), the number of Medicaid enrollees is projected to grow approximately 5% per year to 77 million by 2020, largely driven by the ACA.
• Commercial Individual and Small Group Markets. Risk adjustment is a key component of the ACA-driven commercial markets. The continued expansion of coverage across higher risk demographics and the potential for adverse selection on public exchanges will require risk adjustment and sophisticated risk management capabilities. Non-grandfathered plans in the individual and small group markets, both on and off exchange, are subject to risk adjustment that began in 2014. By 2020, the Congressional Budget Office estimates that the individual exchange market will grow to serve 25 million individuals, up from the CMS-reported 8 million that enrolled in the first open enrollment season.
• Dual Eligible Population. Dual eligible individuals are those who are eligible for both Medicare and Medicaid. Given the cost and complexity of the dual eligible population, new member navigation, clinical screenings, health assessments and ongoing member engagement are critical to driving quality outcomes at a lower cost. There are more than nine million dual eligible beneficiaries. That group represents approximately $300 billion, or 10% of total healthcare expenditures. Approximately 40% of duals suffer from both physical and mental diseases, and these co-morbid conditions further complicate and add to the cost of care. With the anticipated expansion of Medicaid, the dual eligible market is also expected to increase, creating a large opportunity for Matrix to assist managed care plans in managing this high-cost population.
Employees
As of December 31, 2014, we conducted our operations with approximately 13,700 clinical, client service representatives and administrative personnel.
We believe that our employee relations are good because we offer competitive compensation, including stock-based compensation to key employees, training, education assistance and career advancement opportunities. By offering competitive compensation and benefit packages to our employees, we believe we are able to consistently deliver high quality service, recruit qualified candidates and increase employee confidence, satisfaction and retention.
Regulatory Environment
Overview. We are subject to numerous federal, state and local laws and regulations. These laws and regulations significantly affect the way in which we operate various aspects of our business. We must also comply with state and local licensing requirements and requirements for participation in Medicare, Medicaid, federal block grant requirements, requirements of various state Children’s Health Insurance Programs (“CHIP”), requirements for contracting with MA plans, and contractual requirements imposed upon us by the state and local agencies with which we contract for such health care and human services. CHIP is a federal program providing benefits administered by states that submit plans for health benefits for children whose parents meet certain financial needs tests. Failure to follow the rules and requirements of these programs can significantly affect our ability to be paid for the services we provide.
In addition, our revenue is largely derived from contracts that are directly or indirectly paid or funded by government agencies, including Medicare and Medicaid. A significant decline in expenditures, or shift of expenditures or funding, could cause payers to reduce their expenditures under those contracts or not renew such contracts, either of which could have a negative impact on our future operating results. As funding for our contracts is dependent in part upon federal funding, such funding changes could have a significant effect on our business.
The healthcare industry is highly regulated and the federal and state laws that affect our business are significant. Federal law and regulations are based primarily upon the Medicare and Medicaid programs, each of which is financed, at least in part, with federal money. State jurisdiction is based upon a state’s authority to license certain categories of healthcare professionals and providers and the state’s interest in regulating the quality of healthcare in the state, regardless of the source of payment. The significant areas of federal and state regulatory laws that may affect our business, include, but are not limited to the following:
|
● |
false and other improper claims; |
|
● |
HIPAA and its privacy, security, breach notification and enforcement and code set regulations, along with evolving state laws protecting patient privacy and requiring notifications of unauthorized access to, or use of, patient medical information; |
|
● |
civil monetary penalties law; |
|
● |
anti-kickback laws; |
|
● |
the Stark Law and other self-referral and financial inducement laws; |
|
● |
CMS regulations pertaining to Medicare as well as CMS releases applicable to the operation of MA plans, such as reimbursement rates, risk adjustment methodologies, adjustments to quality management measurements and other relevant factors; and |
|
● |
state licensure laws. |
A violation of any laws could result in civil and criminal penalties, the refund of monies paid by government and/or private payers, our exclusion from participation in federal healthcare payer programs, and/or the loss of our license to conduct business within a particular state’s boundaries. Although we believe that we are able to maintain material compliance with all applicable laws, these laws are complex and a review of our practices by a court, or applicable law enforcement or regulatory authority, could result in an adverse determination that could harm our business. Furthermore, the laws applicable to our business are subject to change, interpretation and amendment, which could adversely affect our ability to conduct our business.
Federal Law. Federal healthcare laws apply in any case in which we are providing an item or service that is reimbursable by a federal healthcare payer program. The principal federal laws that affect our business include those that prohibit the filing of false or improper claims with federal healthcare payer programs and those that prohibit unlawful inducements for the referral of business reimbursable under federal healthcare payer programs.
False and Other Improper Claims. Under the federal False Claims Act (31 U.S.C. §§ 3729-3733) and similar state laws, the government may impose civil liability on us if we knowingly submit, or participate in submitting, any claims for payment to the federal or state government that are false or fraudulent, or that contain false or misleading information. Liability can be incurred not only for submitting false claims with actual knowledge, but also for doing so with reckless disregard or deliberate ignorance. In addition, knowingly making or using a false record or statement to receive payment from the federal government is also a violation. Recent amendments to the False Claims Act expand liability by eliminating any requirement that a false claim be submitted, or a false record or statement be made, directly to the government. The amendments also create new liability for “knowingly and improperly avoiding or decreasing an obligation to pay or transmit money or property to the government.” Consequently, a provider need not take an affirmative action to conceal or avoid an obligation to the government, but the mere retention of an overpayment from the government could lead to potential liability under the False Claims Act.
If we are ever found to have violated the False Claims Act, we could be required to make significant payments to the government (including damages and penalties in addition to the return of reimbursements previously collected) and could be excluded from participating in federal healthcare programs. Many states also have similar false claims statutes. In addition, healthcare fraud is a priority of the US Department of Justice, Office of Inspector General and the Federal Bureau of Investigation and state Attorneys General. These agencies have devoted a significant amount of resources to investigating healthcare fraud.
While the criminal statutes generally are reserved for instances evidencing fraudulent intent, the civil and administrative penalty statutes are being applied by the federal government in an increasingly broad range of circumstances. Examples of the types of activities giving rise to liability for filing false claims include billing for services not rendered, misrepresenting services rendered (i.e., mis-coding) and applications for duplicate reimbursement. Additionally, the federal government takes the position that a pattern of claiming reimbursement for unnecessary services violates these statutes if the claimant should have known that the services were unnecessary. The federal government also takes the position that claiming reimbursement for services that are substandard is a violation of these statutes if the claimant should have known that the care was substandard. Criminal penalties also are available in the case of claims filed with private insurers if the federal government shows that the claims constitute mail fraud or wire fraud or violate any of the federal criminal healthcare fraud statutes.
State Medicaid agencies and state Attorneys General also have authority to seek criminal or civil sanctions for fraud and abuse violations. In addition, private insurers may bring actions under state false claim laws. In certain circumstances, federal and state laws authorize private whistleblowers to bring false claim or “qui tam” suits on behalf of the government against providers and reward the whistleblower with a portion of any final recovery. In addition, the federal government has engaged a number of private audit organizations to assist it in tracking and recovering false claims for healthcare services.
Governmental investigations and whistleblower “qui tam” suits against healthcare companies have increased significantly in recent years, and have resulted in substantial penalties and fines. Although we monitor our billing practices for compliance with applicable laws, such laws are very complex, and we might not be able to detect all errors or interpret such laws in a manner consistent with a court or an agency’s interpretation.
Health information practices
Under HIPAA, the US Department of Health and Human Services, or DHHS, issued rules to define and implement standards for the electronic transactions and code sets for the submission of transactions such as claims, and privacy and security of individual health information in whatever manner it is maintained.
In February 2006, DHHS published its Final Rule on Enforcement of the HIPAA Administrative Simplification provisions, including the transaction standards, the security standards and the privacy rule. This enforcement rule addresses, among other issues, DHHS’s policies for determining violations and calculating civil monetary penalties, how DHHS will address the statutory limitations on the imposition of civil monetary penalties, and various procedural issues. The rule extends enforcement provisions currently applicable to the health care privacy regulations to other HIPAA standards, including security, transactions and the appropriate use of service code sets.
On February 17, 2009, the Health Information Technology for Economic and Clinical Health Act, (“HITECH”), was enacted as part of the American Recovery and Reinvestment Act of 2009 to, among other things, extend certain of HIPAA’s obligations to parties providing services to health care entities covered by HIPAA known as “business associates,” impose new notice of privacy breach reporting obligations, extend enforcement powers to state attorney generals and amend the HIPAA privacy and security laws to strengthen the civil and criminal enforcement of HIPAA, establishing four categories of violations that reflect increasing levels of culpability, four corresponding tiers of penalty amounts that significantly increase the minimum penalty amount for each violation, and a maximum penalty amount of $1.5 million for all violations of an identical provision. With the additional HIPAA enforcement power under HITECH, the Office of Civil Rights of the Department of Health and Human Services and states are increasing their investigations and enforcement of HIPAA compliance. We have taken steps to ensure compliance with HIPAA and we are monitoring compliance on an ongoing basis.
Lastly, on January 17, 2013, DHHS released the HITECH Final Rule. The HITECH Final Rule imposes various new requirements on covered entities and business associates, and also expands the definition of “business associates.” The various requirements of the HITECH Final Rule must be implemented before certain transition period deadlines. The final deadline in the transition period was September 24, 2014. We will continue to assess our compliance obligations as regulations under HIPAA as modified by HITECH, continue to become effective as more guidance becomes available from DHHS and other federal agencies. The evolving privacy and security requirements, however, may require substantial operational and systems changes, associate education and resources and there is no guarantee that we will be able to implement them adequately or prior to their effective date. Given HIPAA’s complexity and the evolving regulations, which may be subject to changing and perhaps conflicting interpretation, our ongoing ability to comply with all of the HIPAA requirements is uncertain, which may expose us to the criminal and increased civil penalties provided under HITECH and may require us to incur significant costs in order to seek to comply with its requirements.
Federal and state anti-kickback laws
Federal law commonly known as the “Anti-Kickback Statute” prohibits the knowing and willful offer, solicitation, payment or receipt of anything of value (direct or indirect, overt or covert, in cash or in kind) which is intended to induce: the referral of an individual for a service for which payment may be made by Medicare, Medicaid or certain other federal healthcare programs; or the ordering, purchasing, leasing, or arranging for, or recommending the purchase, lease or order of, any service or item for which payment may be made by Medicare, Medicaid or certain other federal healthcare programs.
Interpretations of the Anti-Kickback Statute have been very broad and under current law, courts and federal regulatory authorities have stated that this law is violated if even one purpose (as opposed to the sole or primary purpose) of the arrangement is to induce referrals. Even bona fide investment interests in a healthcare provider may be questioned under the Anti-Kickback Statute if the government concludes that the opportunity to invest was offered as an inducement for referrals.
This act is subject to numerous statutory and regulatory “safe harbors.” The safe harbor regulations, however, do not cover all lawful relationships between healthcare providers and referral sources. Failure of an arrangement to satisfy all of the requirements of a particular safe harbor does not mean that the arrangement is unlawful. However, it may mean that such an arrangement will be subject to scrutiny by the regulatory authorities.
While we believe that our operations are in compliance with applicable Medicare and Medicaid fraud and abuse laws, there can be no guarantee. We seek to structure all applicable arrangements to comply with applicable safe harbors where reasonably possible. There is a risk however, that the federal government might investigate such arrangements and conclude they violate the Anti-Kickback Statute. If our arrangements are found to violate the Anti-Kickback Statute, we, along with our clients would be subject to civil and criminal penalties, which may include exclusion from participation in government reimbursement programs, and our arrangements would not be legally enforceable, which could materially and adversely affect our business.
Many states, including some where we do business, have adopted anti-kickback laws that are similar to the federal Anti-Kickback Statute. Some of these state laws are very closely patterned on the federal Anti-Kickback Statute; others, however, are broader and reach reimbursement by private payers. If our activities were deemed to be inconsistent with state anti-kickback or illegal remuneration laws, we could face civil and criminal penalties or be barred from such activities, any of which could harm our business.
Federal and State Self-Referral Prohibitions
We may be subject to federal and state statutes banning payments for referrals of patients and referrals by physicians to healthcare providers with whom the physicians have a financial relationship. Section 1877 of the Social Security Act, also known as the “Stark Law”, prohibits physicians from making a “referral” for “designated health services” for Medicare (and in many cases Medicaid) patients from entities or facilities in which such physicians directly or indirectly hold a “financial relationship”.
A financial relationship can take the form of a direct or indirect ownership, investment or compensation arrangement. A referral includes the request by a physician for, or ordering of, or the certifying or recertifying the need for, any designated health services.
Certain services that we provide may be identified as “designated health services” for purposes of the Stark Law. We cannot provide assurance that future regulatory changes will not result in other services we provide becoming subject to the Stark Law’s ownership, investment or compensation prohibitions in the future.
Many states, including some states where we do business, have adopted similar or broader prohibitions against payments that are intended to induce referrals of clients. Moreover, many states where we operate have laws similar to the Stark Law prohibiting physician self-referrals. We contract with a significant number of human services providers and practitioners, including therapists, physicians and psychiatrists, and arrange for these individuals or entities to provide services to our clients. While we believe that these contracts are in compliance with the Stark Law, no assurance can be made that such contracts will not be considered in violation of the Stark Law.
Healthcare Reform. On March 23, 2010, the President of the United States signed into law comprehensive health reform through the Patient Protection and Affordable Care Act (Pub. L. 11-148) (“PPACA” or “ACA”). On March 30, 2010, the President signed a reconciliation budget bill that included amendments to the PPACA (Pub. L. 11-152). These laws in combination form the “Health Care Reform Act” referred to herein. The changes to various aspects of the healthcare system in the Health Care Reform Act are far-reaching and include, among many others, substantial adjustments to Medicare reimbursement, establishment of individual mandates for healthcare coverage, extension of coverage to certain populations, expansion of Medicaid and CHIP, restrictions on physician-owned hospitals, and increased efficiency and oversight provisions.
Some of the provisions of the Health Care Reform Act took effect immediately, while others will take effect later or will be phased in over time, ranging from a few months following approval to ten (10) years. Due to the complexity of the Health Care Reform Act, it is likely that additional legislation will be considered and enacted. The Health Care Reform Act requires the promulgation of regulations that will likely have significant effects on the health care industry and third party payers. Thus, the healthcare industry and our operations may be subjected to significant new statutory and regulatory requirements and contractual terms and conditions, and consequently to structural and operational changes and challenges.
The Health Care Reform Act also implements significant changes to healthcare fraud and abuse laws that will intensify the risks and consequences of enforcement actions. These include expansion of the False Claims Act by: (a) narrowing the public disclosure bar; and (b) explicitly stating that violations of the Anti-Kickback Statute trigger false claims liability. In addition, the Health Care Reform Act lessens the intent requirements under the Anti-Kickback Statute to provide that a person may violate the statute without knowledge or specific intent. The Health Care Reform Act also provides new funding and expanded powers to investigate fraud, including through expansion of the Medicare Recovery Audit Contractor (RAC) program to Medicare Parts C and D and Medicaid and authorizing the suspension of Medicare and Medicaid payments to a provider of services pending an investigation of a credible allegation of fraud. Finally, the legislation creates enhanced penalties for noncompliance, including increased criminal penalties and expansion of administrative penalties under Medicare and Medicaid. Collectively, such changes could have a material adverse impact on our operations.
Surveys and audits
Our programs are subject to periodic surveys by government authorities and/or their contractors to ensure compliance with various requirements. Regulators conducting periodic surveys often provide reports containing statements of deficiencies for alleged failures to comply with various regulatory requirements. In most cases, if a deficiency finding is made by a reviewing agency, we will work with the reviewing agency to agree upon the steps to be taken to bring our program into compliance with applicable regulatory requirements. In some cases, however, an agency may take a number of adverse actions against a program, including:
|
|
• |
the imposition of fines or penalties; |
|
|
• |
temporary suspension of admission of new clients to our program’s service; |
|
|
• |
in extreme circumstances, exclusion from participation in Medicaid or other programs; |
|
|
• |
revocation of our license; or |
|
|
• |
contract termination. |
While we believe that our programs are in compliance with Medicaid and other program certification requirements and state licensure requirements, failure to comply with these requirements could have a material adverse impact on our business and our ability to enter into contracts with other agencies to provide services.
Billing/claims reviews and audits
Agencies and other payers periodically conduct pre-payment or post-payment medical reviews or other audits of our claims. In order to conduct these reviews, payers request documentation from us and then review that documentation to determine compliance with applicable rules and regulations, including the eligibility of clients to receive benefits, the appropriateness of the care provided to those clients, and the documentation of that care.
For-profit ownership
Certain of the agencies for which we provide services restrict our ability to contract directly as a for-profit organization. Instead, these agencies contract directly with a not-for-profit organization and in certain cases we negotiate to provide administrative and management services to the not-for-profit providers. The extent to which other agencies impose such requirements may affect our ability to continue to provide the full range of services that we provide or limit the organizations with which we can contract directly to provide services.
Corporate practice of medicine and fee splitting
Some states in which we operate prohibit general business entities, such as we are, from “practicing medicine,” which definition varies from state to state and can include employing physicians, professional therapists and other mental health professionals, as well as engaging in fee-splitting arrangements with these health care providers. Among other things, we currently contract with professional therapists to provide intensive home based counseling and with NPs to perform CHAs. We believe that we have structured our operations appropriately, however, we could be alleged or found to be in violation of some or all of these laws. If a state determines that some portion of our business violates these laws, it may seek to have us discontinue those portions or subject us to penalties, fines, certain license requirements or other measures. Any determination that we have acted improperly in this regard may result in liability to us. In addition, agreements between the corporation and the professional may be considered void and unenforceable.
Professional licensure and other requirements
Many of our employees are subject to federal and state laws and regulations governing the ethics and practice of their professions. In addition, professionals who are eligible to participate in Medicare and Medicaid as individual providers must not have been excluded from participation in government programs at any time. Our ability to provide services depends upon the ability of our personnel to meet individual licensure and other requirements.
International Regulation of WD Services segment
As a provider of WD services in multiple international jurisdictions, we are subject to numerous national and local laws and regulations. These laws and regulations significantly affect the way in which we operate various aspects of our business. We must also comply with contract-specific technical and infrastructure requirements. Failure to follow the rules and requirements of these programs can significantly affect our ability to be paid for the services we provide. In addition, our revenue is primarily derived from contracts that are funded by national governments that are seeking to reduce the overall unemployment rate, or improve job placement success for targeted cohorts. Further, the revenue we receive from these contracts is typically tied to milestones that are largely uncontrolled by us. Such milestones include the job placement success of clients, duration and tenure of clients in jobs once they are placed, and various other market and industry factors including the overall unemployment rate. A significant decline in national and local government initiatives to provide funding for employment programs, or shift of expenditures or funding, could cause government sponsors to reduce their expenditures under those contracts or not renew such contracts, either of which could have a negative impact on our future operating results.
Additional information
Our website is www.provcorp.com. We make available, free of charge at this website, our annual report on Form 10-K, quarterly reports on Form 10-Q, current reports on Form 8-K, and amendments to those reports filed or furnished pursuant to Section 13(a) or 15(d) of the Securities Exchange Act of 1934, as soon as reasonably practicable after we electronically file such material with, or furnish it to, the United States Securities and Exchange Commission. The information on the website listed above is not and should not be considered part of this annual report on Form 10-K and is not incorporated by reference in this document. In addition, we will provide, at no cost, paper or electronic copies of our Forms 10-K, 10-Q and 8-K and amendments to those reports filed with or furnished to the Securities and Exchange Commission. Requests for such filings should be directed to James Lindstrom, Chief Financial Officer, telephone number: (520) 747-6600.
Item 1A. Risk Factors.
The following risks should be read in conjunction with other information contained, or incorporated by reference, in this report, including the “Management’s Discussion and Analysis of Financial Condition and Results of Operations” section and our consolidated financial statements and related notes. If any of the following risks actually occurs, our business, financial condition and operating results could be adversely affected.
General Risks
Our annual operating results and stock price may be volatile or may decline regardless of our operating performance.
Our annual operating results and the market price for our common stock may fluctuate significantly in response to a number of factors, most of which we cannot control, including:
|
• |
changes in rates by payers; |
|
• |
changes in Medicare or Medicaid rules or regulations, or applicable foreign regulations; |
|
• |
the development of increased competition; |
|
• |
price and volume fluctuations in the overall stock market; |
|
• |
changes in the competitive landscape of the market for our services, including new entrants to the market; |
|
• |
market conditions or trends in our industry or the economy as a whole; |
|
• |
increased competition in any of our segments, including through insourcing of services by our clients; |
|
• |
other events or factors, including those resulting from war, incidents of terrorism, natural disasters or responses to these events; and |
|
• |
changes in accounting principles. |
In addition, the stock markets, and in particular the NASDAQ Global Market, have experienced considerable price and volume fluctuations that have affected and continue to affect the market prices of equity securities of many companies. In the past, stockholders have instituted securities class action litigation following periods of market volatility. If we were involved in securities litigation, we could incur substantial costs, and our resources and the attention of management could be diverted from our business.
We obtain a significant portion of our business through responses to government requests for proposals and we may not be awarded contracts through this process in the future, or contracts we are awarded may not be profitable.
We obtain, and will continue to seek to obtain, a significant portion of our business from state or local government entities. To obtain business from government entities, we are often required to respond to RFPs. To propose effectively, we must accurately estimate our cost structure for servicing a proposed contract, the time required to establish operations and the terms of the proposals submitted by competitors. We must also assemble and submit a large volume of information within rigid and often short timetables. Our ability to respond successfully to RFPs will greatly impact our business. We may not be awarded contracts through the RFP process, and our proposals may not result in profitable contracts.
If we fail to establish and maintain important relationships with officials of government entities and agencies, we may not be able to successfully procure or retain government-sponsored contracts, which could negatively impact our revenues.
To facilitate our ability to procure or retain government-sponsored contracts, we rely in part on establishing and maintaining relationships with officials of various government entities and agencies. These relationships enable us to provide informal input and advice to the government entities and agencies prior to the development of an RFP or program for privatization of human services and enhance our chances of procuring contracts with these payers. The effectiveness of our relationships may be reduced or eliminated with changes in the personnel holding various government offices or staff positions. We also may lose key personnel who have these relationships. We may be unable to successfully manage our relationships with government entities and agencies and with elected officials and appointees. Any failure to establish, maintain or manage relationships with government and agency personnel may hinder our ability to procure or retain government-sponsored contracts.
Government unions may oppose privatizing government programs to outside vendors such as us, which could limit our market opportunities.
Our success depends in part on our ability to win contracts to administer and manage programs traditionally administered by government employees. Many government employees, however, belong to labor unions with considerable financial resources and lobbying networks. These unions could apply opposing political pressure on legislators and other officials seeking to privatize government programs. Union opposition could result in our losing government contracts or being precluded from providing services under government contracts, or maintaining or renewing existing contracts. The ability to renew and obtain new contracts is critical to our financial success. If we could not renew certain contracts, or obtain new contracts, due to opposition political actions, it could have a material adverse impact on our operating results.
Inaccurate, misleading or negative media coverage could damage our reputation and harm our ability to procure government sponsored contracts.
The media sometimes provides news coverage about our contracts and the services we or our competitors provide to clients in our sectors. This media coverage, if negative, could influence government officials to slow the pace of privatizing or retendering government services. Moreover, inaccurate, misleading or negative media coverage about us could harm our reputation and, accordingly, our ability to obtain government sponsored contracts.
Our business is subject to risks of litigation.
The services we provide across our four segments are subject to lawsuits and claims. A substantial award could have a material adverse impact on our operations and cash flows, and could adversely impact our ability to continue to purchase appropriate liability insurance. We can be subject to claims for negligence or intentional misconduct (in addition to professional liability type claims) by an employee or a third party we engage to assist with the provision of services, including but not limited to claims arising out of accidents involving vehicle collisions, workforce development placements or CHAs and various claims that could result from employees or contracted third parties driving to or from interactions with clients and while providing direct client services. We are also subject to claims alleging we did not properly treat an individual or failed to properly diagnose, supervise and/or care for a client. We can be subject to employee related claims such as wrongful discharge or discrimination or a violation of equal employment laws and permitting issues. While we are insured for these types of claims, damages exceeding our insurance limits or outside our insurance coverage, such as a claim for fraud, certain wage and hour violations or punitive damages, could adversely affect our cash flow and financial condition.
We face substantial competition in attracting and retaining experienced professionals, and we may be unable to sustain or grow our business if we cannot attract and retain qualified employees.
Our success depends to a significant degree on our ability to attract and retain highly qualified and experienced professionals who possess the skills and experience necessary to deliver high quality services to our clients. Our objective of providing the highest quality of service to our clients is a significant consideration when we evaluate education, experience and qualifications of potential candidates for employment as direct care and administrative staff. To that end, we attempt to hire professionals and others with requisite educational backgrounds and professional certifications. These employees are in great demand and are likely to remain a limited resource for the foreseeable future. We must quickly hire project leaders and case management personnel after a contract is awarded to us. Contract provisions and client needs determine the number, education and experience levels of social services professionals we hire. We continually evaluate client census, case loads and client eligibility to determine our staffing needs under each contract.
The performance in each of our business segments also depends on the talents and efforts of our highly skilled intellectual technology professionals. Competition for skilled intellectual technology professionals can be intense. Our success depends on our ability to recruit, retain and motivate these individuals.
Our ability to attract and retain employees with the requisite experience and skills depends on several factors including, but not limited to, our ability to offer competitive wages, benefits and professional growth opportunities. Some of the companies with which we compete for experienced personnel have greater financial, technical, political and marketing resources, name recognition and a larger number of clients and payers than we do. The inability to attract and retain experienced personnel could have a material adverse effect on our business.
Our success depends on our ability to manage growing and changing operations.
Since 1996, our business has grown significantly in size and complexity, most recently with the acquisitions of Ingeus and Matrix in 2014. This growth has placed, and is expected to continue to place, significant demands on our management, systems, internal controls and financial and physical resources. In addition, we expect that we will need to further develop our financial and managerial controls and reporting systems to accommodate future growth. This could require us to incur significant expense for, among other things, hiring additional qualified personnel, retaining professionals to assist in developing the appropriate control systems and expanding our information technology infrastructure. The nature of our business is such that qualified management personnel can be difficult to find. Our inability to manage growth effectively could have a material adverse effect on our financial results.
Our success depends on our ability to compete effectively in the marketplace.
We compete for clients and for contracts with a variety of organizations that offer similar services across all of our segments. Many organizations of varying sizes compete with us, including local human services organizations, local not-for-profit organizations and community based organizations, larger companies and institutional providers that offer community based care services, organizations that provide similar NET management services to Medicaid eligible beneficiaries in local markets, large multi-national corporations that provide WD services and CHA providers. Some of these companies have greater financial, technical, political, marketing, name recognition and other resources and a larger number of clients or payers than we do. In addition, some of these companies offer more services than we do. We have experienced, and expect to continue to experience, competition from new entrants into the markets in which we operate. Increased competition may result in pricing pressures, loss of or failure to gain market share or loss of clients or payers, any of which could have a material adverse effect on our operating results.
Our business could be subject to security breaches and attacks.
We provide services to individuals, including services that require us to maintain sensitive and personal client information, including information relating to their health, social security numbers and other identifying data. Therefore, our information technology systems store client information protected by numerous federal, state and foreign regulations. Further, our systems include interfaces to third-party stakeholders, often connected via the Internet. As a result of the data we maintain and third-party access, we are subject to increasing cyber security risks. The nature of our business, where services are often performed outside a secured location, adds additional risk. While we have implemented measures to detect and prevent security breaches and cyber-attacks, our measures may not be effective. Criminals are constantly devising schemes to circumvent information technology security safeguards, and other companies have recently suffered serious data security breaches. If unauthorized parties gain access to our networks or databases, they may be able to steal, publish, delete or modify our private and sensitive third-party information, including personal identification information. In addition, employees may intentionally or inadvertently cause data or security breaches that result in the unauthorized release of personal or confidential information.
Our WD Services segment has operations in many countries in Europe and these operations have access to significant amounts of sensitive personal information about individuals. In Europe, these operations are subject to European and national data privacy legislation, which imposes significant obligations on data processors and controllers with respect to such personal information. In addition, our contractual obligations with customers can require additional, stringent commitments in the handling of such information, which are subject to client audit procedures and other checks, often with severe contractual penalties in the case of breach.
As a result of any security breach, or loss or mishandling of data, we could incur liability, regulatory actions, fines, contractual deductions or litigation, which could increase our costs and have a material adverse effect on our operating results. Further, any such breach, or loss or mishandling of data could impact our business reputation and could result in the loss of contractual relationships or make it more difficult to obtain new contracts, having an adverse effect on our business and financial performance.
Regulatory Risks
We conduct business in a heavily regulated healthcare industry. Compliance with existing regulations is costly, and changes in regulations or violations of regulations may result in increased costs or sanctions that could reduce our revenue and profitability.
The healthcare industry is subject to extensive federal and state regulation relating to, among other things:
|
● |
professional licensure; |
|
● |
conduct of operations; |
|
● |
addition of facilities, equipment and services, including certificates of need; |
|
● |
coding and billing for services; and |
|
● |
payment for services. |
Both federal and state government agencies have increased coordinated civil and criminal enforcement efforts related to the healthcare industry. Regulations related to the healthcare industry are extremely complex and, in many instances, the industry does not have the benefit of significant regulatory or judicial interpretation of those laws. The Patient Protection and Affordable Care Act has also introduced some degree of regulatory uncertainty as the industry does not know how the changes it introduces will affect many aspects of the industry. Medicare and Medicaid anti-fraud and abuse laws prohibit certain business practices and relationships related to items and services reimbursable under Medicare, Medicaid and other governmental healthcare programs, including the payment or receipt of remuneration to induce or arrange for referral of patients or recommendation for the provision of items or services covered by Medicare or Medicaid or any other federal or state healthcare program. Federal and state laws prohibit the submission of false or fraudulent claims, including claims to obtain reimbursement under Medicare and Medicaid. We have implemented compliance policies to help assure our compliance with these regulations as they become effective; however, different interpretations or enforcement of these laws and regulations in the future could subject our practices to allegations of impropriety or illegality or could require us to make changes in our facilities, equipment, personnel, services or the manner in which we conduct our business.
Our HA Services segment operates in a heavily regulated healthcare industry, and changes to the regulatory landscape could have a material adverse effect on our results of operations and financial condition.
The CHA services industry is primarily regulated by federal and state healthcare laws and the requirements of participation and reimbursement of the MA Program established by CMS. From time to time, CMS considers changes to regulatory guidelines with respect to prospective CHAs. CMS could adopt new guidelines that may, for example, increase the costs associated with CHAs or limit the opportunities available to administer CHAs. Implementation of additional regulations on the CHA industry by CMS or other regulatory bodies could have a material adverse impact on our HA Services segment’s revenues and margins, which could have a material adverse impact on our consolidated results of operations.
In our WD Services segment, we conduct business in several countries, each with its own system of regulation. Compliance with existing regulations is costly, and changes in regulations or violations of regulations may result in increased costs or sanctions that could reduce our revenue and profitability.
In 2014, Ingeus operated in 10 countries outside the US. Each of these countries has its own national and municipal laws and regulations, and some countries such as Australia, Germany and Switzerland, have both federal and state regulations. These laws can differ significantly from country to country. In addition, in Europe, countries (including the United Kingdom) are subject to European Union laws and rules. We have implemented compliance policies to help assure our compliance with these laws and regulations as they become effective; however, different interpretations or enforcement of these laws and regulations in the future could subject our practices to allegations of impropriety or illegality or could require us to make changes in our facilities, equipment, personnel, services or the manner in which we conduct our business.
We could be subject to actions for false claims if we do not comply with government coding and billing rules, which could have a material adverse impact on our operating results.
If we fail to comply with federal and state documentation, coding and billing rules, we could be subject to criminal and/or civil penalties, loss of licenses and exclusion from the Medicare and Medicaid programs, which could have a material adverse impact on our operating results. In billing for our services to third-party payers, we must follow complex documentation, coding and billing rules. These rules are based on federal and state laws, rules and regulations, various government pronouncements, and on industry practice. Failure to follow these rules could result in potential criminal or civil liability under the federal False Claims Act, under which extensive financial penalties can be imposed and/or under various state statutes which prohibit the submission of false claims for services covered. Compliance failure could further result in criminal liability under various federal and state criminal or civil statutes.
In the WD Services segment, particularly in Europe, our contracts are subject to stringent claims and invoice processing regimes which vary depending on the customer and nature of the payment mechanism. Under European procurement legislation which has been implemented in each European Union member state, any conviction for fraud can result in a permanent, mandatory ban from participating in public procurement tenders. This could significantly affect our business given that most of our customers in Europe are governmental organizations. Any such breaches or deficiencies in paperwork associated with billing may also be subject to contractual claw back regimes and penalties, which can be enforced many years after the revenue has been paid by the relevant authority.
While we plan to carefully and regularly review our documentation, coding and billing practices, the rules are frequently vague and confusing and we cannot assure that governmental investigators, private insurers or private whistleblowers will not challenge our practices. Such a challenge could result in a material adverse effect on our financial position and results of operations.
If we fail to comply with the federal Anti-kickback Statute, we could be subject to criminal and civil penalties, loss of licenses and exclusion from the Medicare and Medicaid programs, all of which could have a material adverse impact on our operating results.
The federal Anti-kickback Statute prohibits the offer, payment, solicitation or receipt of any form of remuneration in return for referring, ordering, leasing, purchasing or arranging for or recommending the ordering, purchasing or leasing of items or services payable by a federally funded healthcare program. Any of our financial relationships with healthcare providers will be potentially implicated by this statute to the extent Medicare or Medicaid referrals are implicated. Violations of the Anti-kickback Statute could result in substantial civil or criminal penalties, including criminal fines of up to $25,000 per violation, imprisonment of up to five years, civil penalties under the Civil Monetary Penalties Law (42 U.S.C. 1320a-7a) of up to $50,000 per violation, plus three times the remuneration involved, civil penalties under the False Claims Act of up to $11,000 for each claim submitted, plus three times the amounts paid for such claims and exclusion from participation in the Medicare and Medicaid programs. Any such penalties could have a significant negative effect on our operations. Furthermore, the exclusion, if applied to us, could result in significant reductions in our revenues, which could materially and adversely affect our business, financial condition and results of our operations. In addition, many states have adopted laws similar to the federal Anti-kickback Statute with similar penalties.
If we fail to comply with physician self-referral laws, to the extent applicable to our operations, we could experience a significant loss of reimbursement revenue.
We may be subject to federal and state statutes and regulations banning payments for referrals of patients and referrals by physicians to healthcare providers with whom the physicians have a financial relationship and billing for services provided pursuant to such referrals if any occur. Violation of these federal and state laws and regulations, to the extent applicable to our operations, may result in prohibition of payment for services rendered, loss of licenses, fines, criminal penalties and exclusion from Medicare and Medicaid programs. To the extent we do maintain such financial relationships with physicians, we rely on certain exceptions to self-referral laws that we believe will be applicable to such arrangements. Any failure to comply with such exceptions could result in the penalties discussed above.
Our WD Services segment operates internationally, which exposes the group to risks of bribery, corruption and collusive tendering practices with respect to public officials and tenders.
As an international business whose customers are largely in the public sector, the WD Services segment generally wins work through public tender processes. Various statutes, such as the UK’s Bribery Act and the Foreign Corrupt Practices Act in the US, prohibit us from providing anything of value to foreign officials for the purposes of influencing official decisions or obtaining or retaining business or otherwise obtaining favorable treatment. These statutes require us to maintain adequate record-keeping and internal accounting practices to accurately reflect our transactions. In addition, many countries in which we operate have antitrust or competition regulations which prohibit collusive tendering or bid-rigging behavior. Policies and procedures we implement to prevent bribery, corruption and anti-competitive conduct may not effectively prevent us from violating these regulations in every transaction in which we may engage, and such a violation could adversely affect our reputation, business, financial condition and results of operations. Any breach of such laws could also expose our operations in Europe to mandatory, permanent bans from public procurement processes.
We are subject to regulations relating to privacy and security of patient information. Failure to comply with privacy regulations could result in a material adverse impact on our operating results.
There are numerous federal and state regulations addressing patient information privacy and security concerns. In particular, the federal regulations issued under the Health Insurance Portability and Accountability Act of 1996 (“HIPAA”) contain provisions that:
|
● |
protect individual privacy by limiting the uses and disclosures of patient information; |
|
● |
require the implementation of security safeguards to ensure the confidentiality, integrity and availability of individually identifiable health information in electronic form; and |
|
● |
prescribe specific transaction formats and data code sets for certain electronic healthcare transactions. |
Compliance with state and federal laws and regulations is costly and requires our management to expend substantial time and resources. Further, the HIPAA regulations and state privacy laws expose us to increased regulatory risk, as the penalties associated with a failure to comply, even if unintentional, could have a material adverse effect on our results of operations.
We have an internal committee to maintain our privacy and security policies regarding client information in compliance with HIPAA. This committee is responsible for training our employees, including our regional and local managers and staff, to comply with HIPAA and monitoring compliance with the policy. The costs associated with our ongoing compliance could be substantial, which could negatively impact our results of operations.
Our WD Services segment has operations in many countries in Europe and these operations have access to significant amounts of sensitive personal information about individuals. In Europe, these operations are subject to European and national data privacy legislation which imposes significant obligations on data processors and controllers with respect to such personal information. Some countries, such as France and Germany, have particularly strong privacy laws which impose even greater obligations on people handling personal information. There are proposed amendments being suggested to European data privacy legislation which could significantly increase the fines for any breaches. In addition to fining powers, information privacy regulators in Europe have significant powers to require organizations that breach regulations to put in place measures to ensure that such breaches do not occur again, and require businesses to stop processing personal information until the required measures are in place. Such orders could significantly impact our business given we are required to handle personal information as part of our service delivery model.
As a government contractor, we are subject to an increased risk of litigation and other legal actions and liabilities.
As a government contractor, we are subject to an increased risk of investigation, criminal prosecution, civil fraud, whistleblower lawsuits and other legal actions and liabilities that are not as frequently experienced by companies that do not provide government sponsored services. Companies providing government sponsored services can also become involved in public inquiries which can lead to negative media speculation or potential cancellation or termination of contracts. In our WD Services segment in Europe, European procurement regulations in force in each European Union member state require public procurement authorities to impose a permanent, mandatory ban for participation in public procurement where companies are found guilty of fraud or certain other criminal offenses. Authorities can also exercise their discretion to blacklist companies where they believe they have been involved in acts of gross misconduct. The occurrence of any of these actions, regardless of the outcome, could disrupt our operations and result in increased costs, and could limit our ability to obtain additional contracts in other jurisdictions.
The US federal government may refuse to grant consents or waivers necessary to permit for-profit entities to perform certain elements of government programs.
Under current law, in order to privatize certain functions of government programs, the federal government must grant a consent or waiver to the petitioning state or local agency. If the federal government does not grant a necessary consent or waiver or withdraws approval of any granted waiver, the state or local agency will be unable to contract with a for-profit entity, such as us, to provide service. Failure by state or local agencies to obtain consents or waivers could adversely affect our continued business operations and future growth.
Our business could be adversely affected by future legislative changes that hinder or reverse the privatization of human services, NET services or WD services.
The market for certain of our services depends largely on government sponsored programs. These programs can be modified or amended at any time. Moreover, part of our growth strategy includes aggressively pursuing opportunities created by government initiatives to privatize the delivery of human services, NET services and WD services. However, there are opponents to the privatization of these services and, as a result, future privatization is uncertain. If additional privatization initiatives are not proposed or enacted, or if previously enacted privatization initiatives are challenged, repealed or invalidated, there could be a material adverse impact on our operating results.
Our business is subject to licensing regulations and other regulatory provisions, including regulatory provisions governing surveys and audits. Changes to, or violations of, these regulations could negatively impact our revenues.
In many of the locations where we operate, we are required by local laws (both US and foreign) to obtain and maintain licenses. The applicable state and local licensing requirements govern the services we provide, the credentials of staff, record keeping, treatment planning, client monitoring and supervision of staff. The failure to maintain these licenses or the loss of a license could have a material adverse impact on our business and could prevent us from providing services to clients in a given jurisdiction. Most of our contracts are subject to surveys or audit by our payers. We are also subject to regulations that restrict our ability to contract directly with a government agency in certain situations. Such restrictions could affect our ability to contract with certain payers, and could have a material adverse impact on our results of operations.
Financial Risks
Changes in budgetary priorities of the government entities that fund the services we provide could result in our loss of contracts or a decrease in amounts payable to us under our contracts.
Our revenue is largely derived from contracts that are directly or indirectly paid or funded by government agencies. All of these contracts are subject to legislative appropriations and state or national budget approval. The availability of funding under our contracts with state governments is dependent in part upon federal funding to states. Changes in Medicaid methodology may further reduce the availability of federal funds to states in which we provide services. Among the alternative Medicaid funding approaches that states have explored are provider assessments as tools for leveraging increased Medicaid federal matching funds. Provider assessment plans generate additional federal matching funds to the states for Medicaid reimbursement purposes, and implementation of a provider assessment plan requires approval by the Centers for Medicare and Medicaid Services in order to qualify for federal matching funds. These plans usually take the form of a bed tax or a quality assessment fee, which were historically required to be imposed uniformly across classes of providers within the state, except that such taxes only applied to Medicaid health plans.
However, the Deficit Reduction Act of 2005, or Deficit Reduction Act, requires states that desire to impose provider taxes to impose taxes on all MCOs, not just Medicaid MCOs. This uniformity requirement as it relates to taxing all MCOs may make states more reluctant to use provider assessments as a vehicle for raising matching funds and, thus, reduce the amount of funding that the states receive and have available. Moreover, under the Deficit Reduction Act, states may be allowed to reduce the benefits provided to certain Medicaid enrollees, which could affect the services that states contract for with us. We cannot make any assurances that these Medicaid changes will not negatively affect the funding under our contracts. As funding under our contracts is dependent in part upon federal funding, such funding changes could have a significant effect upon our business.
Currently, many of the US states and overseas countries in which we operate are facing budgetary shortfalls or changes in budgetary priorities. In addition, in some states eligibility requirements for human services clients have been tightened to stabilize the number of eligible clients and in certain instances states have implemented or are considering implementing a single point of access to care or a managed care model, which reduces the size of our potential market in those states. While many of these states are dealing with budgetary concerns by shifting costs from institutional care to home and community based care such as we provide, there is no assurance that this trend will continue.
Likewise, in many of the overseas countries addressed by our WD Services segment, a continued focus on austerity measures following the global financial crisis to reduce national and local budget deficits could lead to further spending cuts or changes to welfare arrangements. This may make availability of funding for outsourcing of such services more difficult to obtain from relevant government departments, which may lead to more challenging terms and conditions including pressure on prices or volumes of services provided.
Consequently, a significant decline in government expenditures, shift of expenditures or funding away from programs that call for the types of services that we provide, or change in government contracting or funding policies could cause payers to terminate their contracts with us or reduce their expenditures under those contracts, either of which could have a negative impact on our operating results.
We derive a significant amount of our revenues from a few payers, which puts us at risk. Any changes in the funding, financial viability or our relationships with these payers could have a material adverse impact on our results of operations.
We generate a significant amount of our revenues in our segments from a few payers under a small number of contracts. For example, for the years ended December 31, 2014, 2013 and 2012, we generated approximately 48.2%, 48.0% and 48.5%, respectively, of our total revenue from our top ten payers. Additionally, our top five payers related to our NET Services operating segment represent, in the aggregate, approximately 43.2%, 43.6% and 43.2%, respectively, of our NET Services operating segment revenue for the years ended December 31, 2014, 2013 and 2012. The top five payers related to our Human Services operating segment represent, in the aggregate, approximately 37.0%, 38.0% and 38.5%, respectively, of our Human Services operating segment revenue for the years ended December 31, 2014, 2013 and 2012. The top payer related to our WD Services operating segment represented 68.0% of our WD Services operating segment revenue for the period from May 31, 2014 to December 31, 2014. Additionally, the top payer related to our HA Services operating segment represented 43.2% of our HA Services operating segment revenue for the period from October 23, 2014 to December 31, 2014. The loss of, reduction in amounts generated by, or changes in methods or regulations governing payments for our services under these contracts could have a material adverse impact on our revenue and results of operations.
Changes to the fee structure in our workforce development contracts with the UK Department of Work & Pension could have a material effect on our operating results.
Approximately 68.0% of Ingeus’s revenues for the period from May 31, 2014 to December 31, 2014 are derived from seven standardized regional contracts with the Department of Work & Pension (“DWP”) under the Work Programme, whereby services are provided to long-term unemployed individuals to place them into jobs. Under the terms of the contracts with DWP, effective July 1, 2014, the fee structure has changed, eliminating certain upfront payments and discounting certain other fees. As a result, going forward, Ingeus will receive the majority of its revenue under these contracts only upon demonstrating the client’s continued employment for a substantial period of time and upon achievement of incentive measures over the defined measurement periods. However, a substantial portion of the total cost of providing services to clients is incurred in the period between referral and job placement. The loss of, continued reduction in amounts generated by, or changes in methods or regulations governing payments for our services under these contracts with DWP could have a material adverse impact on our WD Services segment’s revenue and margins, which could have a material adverse impact on our consolidated results of operations.
Our contracts in certain of our segments are in many instances short-term in nature, and can also be terminated prior to expiration, without cause and without penalty to the payers. There can be no assurance that they will survive until the end of their stated terms, or that upon their expiration these contracts will be renewed or extended. Disruptions to our contracts could have a material adverse impact on our results of operations.
Most of our Human Services contracts contain base periods of only one year. While some of them also contain options for renewal, usually successive six month or one year terms, payers are not required to extend their contracts into these option periods. In addition, a significant number of our Human Services contracts not only allow the payer to terminate the contract immediately for cause (such as for our failure to meet our contract obligations) but also permit the payer to terminate the contract at any time prior to its stated expiration date. In most cases the payer may terminate the Human Services or NET Services contracts without cause, at will and without penalty to the payer, either immediately or upon the expiration of a short notice period in the event government appropriations supporting the programs serviced by the contract are reduced or eliminated. The failure of payers to renew or extend significant contracts or their early termination of significant contracts could adversely affect our financial performance. We cannot anticipate if, when or to what extent a payer might terminate its contract with us prior to its expiration or fail to renew or extend its contract with us.
Our contracts are subject to audit and modification by the payers with whom we contract, at their sole discretion.
Our business depends on our ability to successfully perform under various government funded contracts. Under the terms of these contracts, payers can review our performance, as well as our records and general business practices at any time, and may, in their discretion:
|
|
• |
suspend or prevent us from receiving new contracts or extending existing contracts because of violations or suspected violations of procurement laws or regulations; |
|
|
• |
terminate or modify our existing contracts; |
|
|
• |
reduce the amount we are paid under our existing contracts; and/or |
|
|
• |
audit and object to our contract related fees. |
If payers have significant audit findings, or if they make material modifications to our contracts, it could have a material adverse impact on our results of operations.
A loss of our status as a licensed provider in any jurisdiction where we operate could result in the termination of a number of our contracts, which could negatively impact our revenues.
Our status as a licensed provider of health services is subject to periodic renewal, review and examination by various federal, state, local and other governmental agencies. If we lost our status as a licensed provider in any jurisdiction, the contracts under which we provide services in that jurisdiction could be subject to termination. Moreover, such an event could constitute a violation of provisions of our contracts in other jurisdictions, resulting in further contract terminations.
If we fail to satisfy our contractual obligations, we could be liable for damages and financial penalties, and it could harm our ability to keep our existing contracts or obtain new contracts.
Our failure to comply with our contract obligations could, in addition to providing grounds for immediate termination of the contract for cause, negatively impact our financial performance and damage our reputation, which, in turn, could have a material adverse effect on our ability to maintain current contracts or obtain new ones. Our failure to meet contractual obligations could also result in substantial actual and consequential financial damages. The termination of a contract for cause could, for instance, subject us to liabilities for excess costs incurred by a payer in obtaining similar services from another source. In addition, our contracts require us to indemnify payers for our failure to meet standards of care, and some of them contain liquidated damages provisions and financial penalties that we must pay if we breach these contracts.
If we fail to estimate accurately the cost of performing certain contracts, we may experience reduced or negative margins.
Under our FFS contracts, we receive fees based on our interactions with government sponsored clients. To earn a profit on these contracts, we must accurately estimate costs incurred in providing services. Our risk on these contracts is that our client population is not large enough to cover our fixed costs, such as rent and overhead. Our FFS contracts are not reimbursed on a cost basis and therefore, if we fail to estimate our costs accurately, we may experience reduced margins, or even losses on these contracts.
Additionally, approximately 84.1%, 83.4% and 83.3% of our NET services revenue during 2014, 2013 and 2012, respectively, was generated under capitated contracts with the remainder generated through FFS and flat fee contracts. Under most of our capitated contracts, we assume the responsibility of managing the needs of a specific geographic population by contracting out transportation services to local van, cab and ambulance companies on a per ride or per mile basis. We use a “pricing model” to determine applicable contract rates, which takes into account factors, such as estimated utilization, state specific data, previous experience in the state and/or with similar services, estimated volume and availability of mass transit. The amount of the fixed per member, per month fee is determined in the bidding process, but predicated on actual historical transportation data for the subject geographic region (provided by the payer), actuarial work performed in-house as well as by third party actuarial firms and actuarial analyses provided by the payer. If the utilization of our services is more than we estimated, the contract may be less profitable than anticipated, or may not be profitable at all.
We record revenue from cost-based service contracts based on a combination of direct costs, indirect overhead allocations, and stated contractual margins on those costs. We may be required to subsequently refund a portion of the excess funds, if any.
Our cost-based service contracts require us to account for contingencies such as excess cost per service over the allowable contract rate and/or an insufficient number of encounters. In cases where funds paid to us exceed the allowable costs to provide services under the contracts, we may be required to pay back the excess funds. While we believe we have adequately reserved for potential refund amounts, the final settlement of certain contract reimbursements can sometimes occur at a significantly later date than the period services were provided. It is possible that we are unaware of certain potential refunds until they occur which could have a material adverse impact on our operating results. Approximately 19.0%, 20.3% and 18.6% of our Human Services segment revenues or approximately 4.8%, 6.4% and 6.0% of our consolidated revenues for the years ended December 31, 2014, 2013 and 2012, respectively, were derived from cost-based service contracts.
Our results of operations will continue to fluctuate due to seasonality.
Our quarterly operating results and operating cash flows normally fluctuate as a result of seasonal variations in our business. In our Human Services operating segment, lower client demand for our home and community based services during the holiday and summer seasons generally results in lower revenue during those periods; however, our expenses related to the Human Services operating segment do not vary significantly with these changes. As a result, our Human Services operating segment typically experiences lower operating margins during the holiday and summer seasons. Our NET Services operating segment experiences fluctuations in demand for our NET services during the summer, winter and holiday seasons. Due to higher demand in the summer months and lower demand in the winter and holiday seasons, coupled with a fixed revenue stream based on a per member per month based structure, our NET Services operating segment typically experiences lower operating margins in the summer season and higher operating margins in the winter and holiday seasons. Our HA Services operating segment generally experiences higher CHA volume in the second half of the calendar year as demand accelerates for annual CHAs toward year-end. We expect quarterly fluctuations in operating results and operating cash flows to continue as a result of the seasonal demand for all of these services. As we enter new markets and expand our business, we could be subject to additional seasonal variations.
Our reported financial results could suffer if there is an impairment of goodwill or other intangible assets.
Goodwill may be impaired if the estimated fair value of one or more of our reporting units is less than the carrying value of the respective reporting unit. Because we have grown in part through acquisitions, goodwill and other intangible assets represent a significant portion of our assets. We perform an analysis on our goodwill balances to test for impairment on an annual basis. Similarly, interim impairment tests may also be required in advance of our annual impairment test if events occur or circumstances change that would more likely than not reduce the fair value, including goodwill, of one or more of our reporting units below the reporting unit’s carrying value. Such circumstances could include but are not limited to: (1) loss of significant contracts, (2) a significant adverse change in legal factors or in the climate of our business, (3) unanticipated competition, (4) an adverse action or assessment by a regulator, or (5) a significant decline in our stock price. If events occur or circumstances change, we may be required to record an impairment adjustment to our goodwill or other intangible assets which could have a material adverse impact on our results of operations and financial position.
We may incur costs before receiving related revenues, which could result in cash shortfalls.
When we are awarded a contract to provide services, we may incur expenses before we receive any contract payments. These expenses include leasing office space, purchasing office equipment and hiring personnel. As a result, in certain large contracts where the government does not fund program start-up costs, we may be required to invest significant sums of money before receiving related contract payments. In addition, payments due to us from payers may be delayed due to billing cycles or as a result of failures to approve government budgets in a timely manner. Moreover, especially under FFS arrangements, any resulting cash shortfall could be exacerbated if we fail to either invoice the payer or to collect our fee in a timely manner. This could have a material adverse impact on our ongoing operations and our financial position.
We have a substantial amount of debt, which could impair our financial condition.
We have a significant amount of indebtedness. As of December 31, 2014, we had approximately $575.2 million of total indebtedness and approximately $30.3 million of available letter of credit and borrowing capacity under our credit facilities. Our substantial level of indebtedness increases the risk that we may be unable to generate cash sufficient to pay amounts due in respect of our indebtedness. Our substantial indebtedness could have other important consequences on our business. For example, it could:
|
|
• |
make it more difficult for us to satisfy our obligations; |
|
|
• |
limit our ability to borrow additional amounts to fund working capital, capital expenditures, debt service requirements, execution of our business strategy or acquisitions and other purposes; |
|
|
• |
require us to dedicate a substantial portion of our cash flow from operations to pay principal and interest on our debt, which would reduce the funds available to us for other purposes; |
|
|
• |
make us more vulnerable to adverse changes in general economic, industry and competitive conditions, as well as in government regulation and to our business; |
|
|
• |
expose us to risks inherent in interest rate fluctuations because some of our borrowings are at variable rates of interest, which could result in higher interest expenses in the event of increases in interest rates; and |
|
|
• |
make it more difficult to satisfy our financial obligations. |
Our ability to satisfy and manage our debt obligations depends on our ability to generate cash flow and on overall financial market conditions. To some extent, this is subject to prevailing economic and competitive conditions and to certain financial, business and other factors, many of which are beyond our control. Our business may not generate sufficient cash flow from operations to permit us to pay principal, premium, if any, or interest on our debt obligations. If we are unable to generate sufficient cash flow from operations to service our debt obligations and meet our other cash needs, we may be forced to reduce or delay capital expenditures, sell or curtail assets or operations, seek additional capital, or seek to restructure or refinance our indebtedness. If we must sell or curtail our assets or operations, it may negatively affect our ability to generate revenue.
In addition, on February 11, 2015 and March 12, 2015, we issued $65.5 million and $15.8 million, respectively, of convertible preferred stock. The terms of the convertible preferred stock require us to pay mandatory quarterly dividends, either in cash or through an increase in the stated value of such stock. Our ability to satisfy and manage our obligations under our outstanding preferred stock depends, in part, on our ability to generate cash flow and on overall financial market conditions and the other factors discussed above.
We may not be able to generate sufficient cash to service all of our indebtedness and may be forced to take other actions to satisfy our obligations under our indebtedness, which may not be successful.
Our ability to make scheduled payments on or to refinance our debt obligations depends on our financial condition and operating performance, which are subject to prevailing economic and competitive conditions and to certain financial, business, legislative, regulatory and other factors beyond our control. We may be unable to maintain a level of cash flows from operating activities sufficient to permit us to fund our day-to-day operations or to pay the principal, premium, if any, and interest on our indebtedness.
If our cash flows and capital resources are insufficient to fund our debt service obligations, we could face substantial liquidity problems and could be forced to reduce or delay investments and capital expenditures or to sell assets or operations, seek additional capital or restructure or refinance our indebtedness. We may not be able to effect any such alternative measures, if necessary, on commercially reasonable terms or at all and, even if successful, such alternative actions may not allow us to meet our scheduled debt service obligations.
Our credit facility restricts our ability to dispose of assets and use the proceeds from any such dispositions and may also restrict our ability to raise debt or equity capital to be used to repay other indebtedness when it becomes due. We may not be able to consummate those dispositions or to obtain proceeds in an amount sufficient to meet any debt service obligations then due.
Our variable-rate indebtedness exposes us to interest rate risk, which could cause our debt service obligations
to increase significantly.
Borrowings under our credit facility are subject to variable rates of interest and expose us to interest rate risk. If interest rates increase, our debt service obligations on our variable-rate indebtedness would increase and our net income would decrease, even though the amount borrowed under the facilities remained the same. As of December 31, 2014, we had $510.6 million outstanding variable-rate borrowings under our credit facility. Borrowings under our credit facilities accrue interest at LIBOR plus 3.0% per annum as of December 31, 2014. An increase of 1% in the LIBOR rate would cause an increase in interest expense of up to $17.0 million over the remaining term of the Amended and Restated Credit Agreement, which matures in 2018.
Restrictive covenants in our credit facility may limit our current and future operations, particularly our ability to respond to changes in our business or to pursue our business strategies.
The terms contained in the agreements that govern certain of our indebtedness, and the agreements that govern any future indebtedness of ours may include, a number of restrictive covenants that impose significant operating and financial restrictions, including restrictions on our ability to take actions that we believe may be in our best interest. These agreements, among other things, limit our ability to:
• incur additional debt;
• provide guarantees in respect of obligations of other persons;
• issue redeemable stock and preferred stock;
• pay dividends or distributions or redeem or repurchase capital stock;
• make loans, investments and capital expenditures;
• enter into transactions with affiliates;
• create or incur liens;
• make distributions from our subsidiaries;
• sell assets and capital stock of our subsidiaries;
• make acquisitions; and
• consolidate or merge with or into, or sell substantially all of our assets to, another person.
A breach of the covenants or restrictions could result in a default under the applicable indebtedness. Such default may allow the creditors to accelerate the related debt and may result in the acceleration of any other debt to which a cross acceleration or cross-default provision applies. In the event our lenders and note holders accelerate the repayment of our borrowings, we cannot assure that we and our subsidiaries would have sufficient assets to repay such indebtedness.
Our use of a reinsurance program to cover certain claims for losses suffered and costs or expenses incurred could negatively impact our business.
We are reinsured with regard to a substantial portion of our automobile, general liability, professional liability and workers’ compensation insurance. We also reinsure the general liability, professional liability, workers’ compensation insurance, automobile liability and automobile physical damage of various members of the network of subcontracted transportation providers and independent third parties over various policy years under reinsurance programs through our two wholly-owned captive insurance subsidiaries. Although, effective February 15, 2011, we did not renew our reinsurance agreement and will not assume liabilities for policies that cover the general liability, automobile liability, and automobile physical damage coverage of our independent third party transportation providers after that date, we will continue to administer existing policies for the foreseeable future and resolve remaining and future claims related to these policies. In the event that actual reinsured losses increase unexpectedly or exceed actuarially determined estimated reinsured losses under the program, the aggregate of such losses could materially increase our liability and adversely affect our financial condition, liquidity, cash flows and results of operations. In addition, as the availability to us of certain traditional insurance coverage diminishes or increases in cost, we will continue to evaluate the levels and types of insurance we include in our self-insurance program. Any increase to this program increases our risk exposure and therefore increases the risk of a possible material adverse effect on our financial condition, liquidity, cash flows and results of operations.
Any acquisition that we undertake could be difficult to integrate, disrupt our business, dilute stockholder value or have a material adverse impact on our operating results.
We have made, and anticipate that we will continue making, strategic acquisitions as part of our growth strategy. We have made a number of acquisitions since our inception. The success of these and other acquisitions depends in part on our ability to integrate acquired companies into our business operations. There can be no assurance that the companies acquired will continue to generate income at the historical levels on which we based our acquisition decisions, that we will be able to maintain or renew the acquired companies’ contracts, that we will be able to realize operating and economic efficiencies upon integration of acquired companies, or that the acquisitions will not adversely affect our results of operations or financial condition.
We continually review opportunities to acquire other businesses that would complement our current services, expand our markets or otherwise offer prospects for growth. In connection with our acquisition strategy, we could issue stock that would dilute existing stockholders’ percentage ownership, or we could incur or assume substantial debt or contingent liabilities. Acquisitions involve numerous risks, including, but not limited to, the following:
• challenges assimilating the acquired operations;
• unanticipated costs and known and unknown legal or financial liabilities associated with an acquisition;
• diversion of management’s attention from our core businesses;
• adverse effects on existing business relationships with customers;
• entering markets in which we have limited or no experience;
• potential loss of key employees of purchased organizations;
• the incurrence of excessive leverage in financing an acquisition;
• failure to maintain and renew contracts of the acquired business;
• unanticipated operating, accounting or management difficulties in connection with an acquisition; and
• dilution to our earnings per share.
We cannot assure you that we will be successful in overcoming problems encountered in connection with any acquisition and our inability to do so could disrupt our operations and adversely affect our business.
International Risks
There are risks associated with our international operations that are different from the risks associated with our operations in the US, and our exposure to the risks of a global market could hinder our ability to maintain and expand international operations.
We have operation centers in Australia, Canada, France, Germany, Poland, Saudi Arabia, South Korea, Spain, Sweden, Switzerland, the United Kingdom and the US. In implementing our international strategy, we may face barriers to entry and competition from local companies and other companies that already have established global businesses, as well as the risks generally associated with conducting business internationally. The success and profitability of international operations are subject to numerous risks and uncertainties, many of which are outside of our control, such as:
• political or economic instability;
• changes in governmental regulation or taxation;
• currency exchange fluctuations;
• difficulties and costs of staffing and managing operations in certain foreign countries;
• work stoppages or other changes in labor conditions; and
• taxes and other restrictions on repatriating foreign profits back to the US
In addition, changes in policies and/or laws of the US or foreign governments resulting in, among other changes, higher taxation, tariffs or similar protectionist laws could reduce the anticipated benefits of international operations and could have a material adverse effect on our results of operations and financial condition. We have currency exposure arising from both sales and purchases denominated in foreign currencies, including intercompany transactions outside the US, and we currently do not conduct hedging activities. We cannot predict with precision the effect of future exchange-rate fluctuations on our business and operating results, and significant rate fluctuations could have a material adverse effect on results of operations and financial condition.
We operate and are in a taxable income position in multiple tax jurisdictions, and face the risk of double taxation if one jurisdiction does not acquiesce to the tax claims of another jurisdiction.
We currently operate in the US and eleven foreign countries and are subject to income taxes in those countries and the specific states and/or provinces where we operate. In the event one taxing jurisdiction disagrees with another taxing jurisdiction, we could experience temporary or permanent double taxation and increased professional fees to resolve taxation matters.
Item 1B. Unresolved Staff Comments.
None.
Item 2. Properties.
We lease our approximately 11,000 square foot corporate office building in Tucson, Arizona under a five-year lease, with two additional three year renewal options. The lease is currently in its fifth year. The monthly base rental payment under this lease as of December 31, 2014 in the amount of approximately $18,000 is subject to an annual Consumer Price Index adjustment increase over the initial term of the lease. We also lease office space for other administrative services in Tucson. The lease terms vary and are in line with market rates. In connection with the performance of our contracts, our NET Services segment leases approximately 40 offices, our Human Services segment leases approximately 280 offices, our WD Services segment leases approximately 170 offices and our HA Services segment leases approximately three offices. The lease terms vary and are generally at market rates.
In the Human Services segment, we acquired a 5,760 square foot office building in Pottsville, Pennsylvania in connection with the acquisition of Providence Community Services, Inc. (formerly known as Pottsville Behavioral Counseling Group, Inc.), which is free of any mortgage. Additionally, with the acquisition of The ReDCo Group, Inc. (“ReDCo”) we acquired approximately 40 buildings in Pennsylvania which are free from any mortgages.
In 2010, we purchased land and a 46,188 square foot four-story shell building adjacent to our corporate office for cash. We utilize the building for certain information technology operations, and sublease or have sold other space within the building. We believe that our properties are adequate for our current business needs, and believe that we can obtain adequate space, if needed, to meet our foreseeable business needs.
|
Item 3. |
Legal Proceedings. |
Although we believe we are not currently a party to any material litigation, we may from time to time become involved in litigation relating to claims arising from our ordinary course of business. These claims, even if not meritorious, could result in the expenditure of significant financial and managerial resources.
|
Item 4. |
Mine Safety Disclosures |
Not applicable.
PART II
|
Item 5. |
Market for Registrant’s Common Equity, Related Stockholder Matters and Issuer Purchases of Equity Securities. |
Market for our common stock
Our common stock, $0.001 par value per share, our only class of common equity, has been quoted on NASDAQ under the symbol “PRSC” since August 19, 2003. Prior to that time there was no public market for our common stock. As of March 10, 2015, there were 52 holders of record of our common stock. The following table sets forth the high and low sales prices per share of our common stock for the period indicated, as reported on NASDAQ Global Select Market:
|
High |
Low |
|||||||
|
2014 |
||||||||
|
Fourth Quarter |
$ | 48.70 | $ | 34.03 | ||||
|
Third Quarter |
$ | 49.41 | $ | 35.70 | ||||
|
Second Quarter |
$ | 43.35 | $ | 28.07 | ||||
|
First Quarter |
$ | 29.00 | $ | 23.91 | ||||
|
2013 |
||||||||
|
Fourth Quarter |
$ | 30.50 | $ | 24.34 | ||||
|
Third Quarter |
$ | 31.31 | $ | 26.41 | ||||
|
Second Quarter |
$ | 29.52 | $ | 16.58 | ||||
|
First Quarter |
$ | 20.09 | $ | 15.86 | ||||
Stock Performance Graph
The following graph shows a comparison of the cumulative total return for our common stock, NASDAQ Health Index and Russell 2000 Index assuming an investment of $100 in each on December 31, 2009.
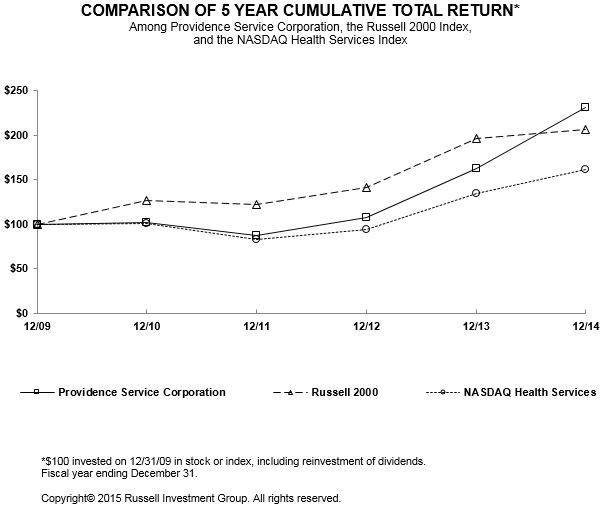
Dividends
We have not paid any cash dividends on our common stock and do not plan to pay dividends on our common stock in the foreseeable future. In addition, our ability to pay dividends is prohibited by the terms of our credit agreement. The payment of future cash dividends, if any, will be reviewed periodically by the Board and will depend upon, among other things, our financial condition, funds from operations, the level of our capital and development expenditures, any restrictions imposed by present or future debt instruments and changes in federal tax policies, if any.
Issuer Purchases of Equity Securities
|
Total Number of Shares of
Common Stock |
Average Price Paid per |
Total Number of Shares of Common Stock Purchased as Part of Publicly Announced |
Maximum Number of Shares of Common Stock
that May Yet Be Purchased |
|||||||||||||
|
Period |
Purchased (1) |
Share |
Program (2) |
Under the Program (2) |
||||||||||||
|
Fourth quarter: |
||||||||||||||||
|
October 1, 2014 to October 31, 2014 |
- | $ | - | - | 243,900 | |||||||||||
|
November 1, 2014 to November 30, 2014 |
157 | $ | 44.39 | - | 243,900 | |||||||||||
|
December 1, 2014 to December 31, 2014 |
432 | $ | 36.92 | - | 243,900 | |||||||||||
|
Total |
589 | $ | 38.91 | - | 243,900 | |||||||||||
_______________________
|
(1) |
The shares repurchased were acquired from employees in connection with the settlement of income tax and related benefit withholding obligations arising from vesting in restricted stock awards. |
|
(2) |
Our board of directors approved a stock repurchase program in February 2007 for up to one million shares of our common stock. As of December 31, 2014, we have spent approximately $14.4 million to purchase 756,100 shares of our common stock on the open market under this program. |
Equity Compensation Plan Information
The following table provides certain information as of December 31, 2014 with respect to our equity based compensation plans.
|
Plan category |
(a) Number of securities to be issued upon exercise of outstanding options, warrants and rights |
(b) Weighted-average exercise price of outstanding options, warrants and rights |
(c) Number of securities remaining available for future issuance under equity compensation plans (excluding securities reflected in column (a)) |
|||||||||
|
Equity compensation plans approved by security holders(1)(2) |
813,622 | 30.77 | 1,061,252 | |||||||||
|
Equity compensation plans not approved by security holders |
— | — | — | |||||||||
|
Total |
813,622 | 30.77 | 1,061,252 | |||||||||
|
(1) |
Columns (a) and (b) include 813,622 shares issuable upon exercise of outstanding stock options. |
|
(2) |
The number of shares shown in column (c) represents the number of shares available for issuance pursuant to stock options and other stock-based awards that could be granted in the future under the 2006 Long-Term Incentive Plan, as amended. |
|
Item 6. |
Selected Financial Data. |
The following table sets forth selected consolidated financial data, other financial data and other operating data. The selected consolidated financial data for the years ended December 31, 2014, 2013 and 2012 and as of December 31, 2014 and 2013 are derived from our audited consolidated financial statements included elsewhere in this report. The selected consolidated financial data for the years ended December 31, 2011 and 2010 and as of December 31, 2012, 2011 and 2010 are derived from our audited consolidated financial statements that are not included in this report. This information should be read in conjunction with our consolidated financial statements and the related notes, and Item 7 “Management’s Discussion and Analysis of Financial Condition and Results of Operations,” all of which are included elsewhere in this report.
|
Year Ended December 31, |
||||||||||||||||||||
|
2014 (1)(2)(3) |
2013 (3)(4)(5) |
2012 (3)(6) |
2011 (7)(8) |
2010 (7) |
||||||||||||||||
|
(dollars and shares in thousands, except per share data) |
||||||||||||||||||||
|
Statement of operations data: |
||||||||||||||||||||
|
Service revenue |
$ | 1,481,171 | $ | 1,122,682 | $ | 1,105,889 | $ | 942,980 | $ | 879,697 | ||||||||||
|
Operating expenses: |
||||||||||||||||||||
|
Service expense |
1,338,793 | 1,020,051 | 1,010,776 | 843,824 | 763,281 | |||||||||||||||
|
General and administrative expense |
63,635 | 48,633 | 53,383 | 48,861 | 46,461 | |||||||||||||||
|
Depreciation and amortization |
29,488 | 14,872 | 15,023 | 13,656 | 12,652 | |||||||||||||||
|
Asset impairment charges |
6,915 | 492 | 2,506 | - | - | |||||||||||||||
|
Total operating expenses |
1,438,831 | 1,084,048 | 1,081,688 | 906,341 | 822,394 | |||||||||||||||
|
Operating income |
42,340 | 38,634 | 24,201 | 36,639 | 57,303 | |||||||||||||||
|
Non-operating (income) expenses |
||||||||||||||||||||
|
Interest expense, net |
14,600 | 6,894 | 7,508 | 10,002 | 16,011 | |||||||||||||||
|
Loss on extinguishment of debt |
- | 525 | - | 2,463 | - | |||||||||||||||
|
(Gain) on foreign currency translation |
(37 | ) | - | - | - | - | ||||||||||||||
|
(Gain) on bargain purchase |
- | - | - | (2,711 | ) | - | ||||||||||||||
|
Income before income taxes |
27,777 | 31,215 | 16,693 | 26,885 | 41,292 | |||||||||||||||
|
Provision for income taxes |
7,502 | 11,777 | 8,211 | 9,945 | 17,665 | |||||||||||||||
|
Net income |
$ | 20,275 | $ | 19,438 | $ | 8,482 | $ | 16,940 | $ | 23,627 | ||||||||||
|
Net earnings per share data: |
||||||||||||||||||||
|
Diluted |
$ | 1.35 | $ | 1.41 | $ | 0.64 | $ | 1.27 | $ | 1.78 | ||||||||||
|
Weighted average shares outstanding: |
||||||||||||||||||||
|
Diluted |
15,019 | 13,810 | 13,355 | 13,322 | 14,965 | |||||||||||||||
|
Year Ended December 31, |
||||||||||||||||||||
|
2014 (1) |
2013 |
2012 |
2011 |
2010 |
||||||||||||||||
|
Other data (9) (unaudited): |
||||||||||||||||||||
|
States served: |
||||||||||||||||||||
|
NET Services |
39 | 40 | 38 | 34 | 38 | |||||||||||||||
|
Human Services |
24 | 24 | 27 | 33 | 32 | |||||||||||||||
|
HA Services |
33 | - | - | - | - | |||||||||||||||
|
Countries served: |
||||||||||||||||||||
|
WD Services |
10 | - | - | - | - | |||||||||||||||
|
Locations: |
` |
|||||||||||||||||||
|
NET Services |
40 | 35 | 36 | 33 | 34 | |||||||||||||||
|
Human Services |
326 | 347 | 358 | 359 | 273 | |||||||||||||||
|
WD Services |
173 | - | - | - | - | |||||||||||||||
|
HA Services |
3 | - | - | - | - | |||||||||||||||
|
Employees: |
||||||||||||||||||||
|
NET Services |
2,971 | 2,253 | 1,990 | 1,476 | 1,430 | |||||||||||||||
|
Human Services |
6,859 | 6,294 | 6,403 | 6,120 | 5,553 | |||||||||||||||
|
WD Services |
2,569 | - | - | - | - | |||||||||||||||
|
HA Services |
1,298 | - | - | - | - | |||||||||||||||
|
Contracts: |
||||||||||||||||||||
|
NET Services |
109 | 83 | 84 | 76 | 66 | |||||||||||||||
|
Human Services |
491 | 504 | 556 | 633 | 638 | |||||||||||||||
|
WD Services |
390 | - | - | - | - | |||||||||||||||
|
HA Services |
67 | - | - | - | - | |||||||||||||||
|
Clients: |
||||||||||||||||||||
|
NET Services (10) |
21,504,243 | 15,842,051 | 15,084,571 | 11,318,902 | 8,232,202 | |||||||||||||||
|
Human Services |
63,112 | 56,320 | 51,584 | 60,956 | 58,088 | |||||||||||||||
|
WD Services |
185,581 | - | - | - | - | |||||||||||||||
|
As of December 31, |
||||||||||||||||||||
|
2014 (1)(2) |
2013 (3)(4) |
2012 (3) |
2011 (8) |
2010 |
||||||||||||||||
|
(dollars in thousands) |
||||||||||||||||||||
|
Balance sheet data: |
||||||||||||||||||||
|
Cash and cash equivalents |
$ | 160,406 | $ | 98,995 | $ | 55,863 | $ | 43,184 | $ | 61,261 | ||||||||||
|
Total assets |
1,165,245 | 424,758 | 391,737 | 379,053 | 386,933 | |||||||||||||||
|
Long-term obligations, including current portion |
575,213 | 123,500 | 130,000 | 150,493 | 182,304 | |||||||||||||||
|
Other liabilities |
368,618 | 150,621 | 143,050 | 119,537 | 115,880 | |||||||||||||||
|
Total stockholders' equity |
221,414 | 150,637 | 118,687 | 109,023 | 88,749 | |||||||||||||||
|
(1) |
Two significant acquisitions were completed during 2014. We acquired Ingeus effective May 30, 2014 and we acquired Matrix effective October 23, 2014. These acquisitions resulted in the creation of two new segments in 2014, WD Services and HA Services. These acquisitions affected the comparability of the information reflected in the selected financial data. See the year on year analysis included in Item 7 “Management’s Discussion and Analysis of Financial Condition and Results of Operations” of this report for more information. | |
|
(2) |
On May 28, 2014 we entered into the first amendment to our credit facility which increased the aggregate amount of the revolving credit facility from $165.0 million to $240.0 million, then, on October 23, 2014, we entered into the second amendment to our credit facility which added an additional term loan in the amount of $250.0 million. Additionally, on October 23, 2014, we entered into a 14.0% unsecured subordinated note in the aggregate principal amount of $65.5 million with a related party. The increases in our debt balances resulted in an increase in interest expense in 2014 over 2013. Additionally, 2014 includes approximately $4.5 million of financing fees that were deferred and fully expensed in the fourth quarter of 2014 in relation to bridge financing commitments and approximately $3.0 million of third party financing fees that are included in general and administrative expense. | |
|
(3) |
As a result of changes in British Columbia, we initiated intangible asset impairment valuations of our Canadian business and, based on the results, we recorded impairment charges totaling approximately $2.5 million related to our intangible assets other than goodwill for the year ended December 31, 2012. During 2013, the not-for-profit entities managed by Rio Grande Management Company, L.L.C. (“Rio”), our wholly-owned subsidiary, were notified of the termination of funding for certain of their services. Due to this change in funding, the not-for-profit entities Rio serves were not able to maintain the level of business they historically experienced, which is expected to result in the decrease or elimination of services provided by Rio. Based on these factors, we recorded a goodwill impairment charge of approximately $0.5 million for the year ended December 31, 2013. During 2014, we recorded impairment charges related to three Human Services segment reporting units totaling $6.9 million as further discussed in Item 7 “Management’s Discussion and Analysis of Financial Condition and Results of Operations”. | |
|
(4) |
On August 2, 2013, we executed a new credit facility and paid all amounts due under the existing credit facility with proceeds from the new credit facility. In conjunction with the termination of the previous credit facility, we recorded a loss on extinguishment of debt in 2013 of approximately $0.5 million. | |
|
(5) |
We incurred expense (net of benefit of forfeiture of stock-based compensation) of approximately $1.3 million in 2013 for severance payments related to two of our executive officers and a key employee. | |
|
(6) |
We incurred expense (net of benefit of forfeiture of stock-based compensation) of approximately $1.3 million in 2012 for payments related to the retirement of two of our executive officers in 2012. | |
|
(7) |
As a result of our acquisition of ReDCo on June 1, 2011, we began consolidating the financial results of this entity, which resulted in a decrease in management fees of approximately $1.1 million for 2011 as compared to 2010. Additionally, this acquired entity contributed $20.3 million of home and community based service revenue during 2011. | |
|
(8) |
On March 11, 2011, we executed a new credit facility and paid all amounts due under the existing credit facility with cash in the amount of $12.3 million and proceeds from the new credit facility. In conjunction with the termination of the previous credit facility, we recorded a loss on extinguishment of debt in 2011 of approximately $2.5 million. | |
|
(9) |
“States served,” “Locations,” “Employees” and “Contracts” data are as of the end of the period for owned entities. “Clients” data represents the number of clients served during the last month of the period presented for owned entities. “States served” excludes the District of Columbia and Canada. | |
|
(10) |
NET services clients represent the number of individuals eligible to receive NET services. | |
|
Item 7. |
Management’s Discussion and Analysis of Financial Condition and Results of Operations. | |
The following discussion and analysis of our financial condition and results of operations should be read in conjunction with Item 6, “Selected Financial Data” and our consolidated financial statements and related notes included in Item 8 of this report. This discussion and analysis contains forward-looking statements that involve risks, uncertainties and assumptions. Certain risks, uncertainties and other factors, including but not limited to those set forth in Item 1A, entitled, “Risk Factors” and elsewhere in this report may cause actual results to differ materially from those projected in the forward-looking statements.
Overview of Our Business
We arrange for and manage non-emergency transportation (“NET”) services, and provide behavioral health and other human services, workforce development (“WD”) services and health assessment (“HA”) services. In response to the large and growing population of eligible beneficiaries of government sponsored services, increasing pressure on governments to control costs and increasing acceptance of privatized human services and managed care solutions, we have grown both organically and through strategic acquisitions, including the acquisitions of Ingeus and Matrix during the second and fourth quarters, respectively, of 2014.
As of December 31, 2014, we had approximately 21.5 million individuals eligible to receive services under our NET business segment, and provide services directly to approximately 63,100 clients under our Human Services segment. Additionally, we have provided services to nearly 185,600 clients under our WD Services segment, and provided comprehensive health assessment (“CHA”) services across the US during 2014. Our NET Services segment provided services from approximately 40 locations in 39 states and the District of Columbia as of December 31, 2014. Our Human Services segment provided services from nearly 330 locations in 24 states, the District of Columbia, and three provinces in Canada as of December 31, 2014. Our WD Services segment provided services from over 170 locations in Australia, France, Germany, Poland, Saudi Arabia, South Korea, Spain, Sweden, Switzerland and the United Kingdom as of December 31, 2014. Our HA Services segment provided services is 33 states with approximately 800 nurse practitioners as of December 31, 2014.
How We Grow our Business and Evaluate our Performance
Our business has grown internally through organic expansion into new markets and existing markets, increases in the number of clients served under contracts that we or the entities we manage are awarded, and through strategic acquisitions. With respect to our Human Services and WD Services business segments, we typically pursue organic expansion into markets that are contiguous to our existing markets or where we believe we can quickly establish a significant presence. When we expand organically into new markets, we typically have no clients or perform no management services in those markets historically, and are required to incur start-up costs including building or lease costs, required permits and costs to attract and train initial personnel. These costs are typically expensed as incurred, and our new offices often expect to incur losses for a period of time until we adequately grow our revenue from clients. These initial losses are built in to our bid models and forecasts, and are typically expected to be recouped on average over the life of the operation.
We continue to selectively identify and pursue strategic acquisitions of attractive businesses that are complementary to our business strategies and current services and businesses in markets where we see opportunities for our existing services but where we lack the contacts or market knowledge to make a successful organic entry.
In managing our business, we focus on several key performance indicators that are specific to the markets that we operate in. Specifically, we focus on the number of clients served and the average rates we receive for our services, as those particular metrics are the key drivers of our revenue performance. We also focus on our employee costs and number of employees, outsourced transportation costs by contract, and cost per job placement as these items are our most significant operating costs and the key to controlling our operating margins. In addition, we monitor EBITDA and Adjusted EBITDA as key performance indicators of our financial performance. We intend to continue to focus on these and additional measures going forward, and make changes in our cost structure where necessary to achieve our financial and operational goals. We will also leverage our technology platforms where possible, and expand our shared services capability.
How We Earn our Revenue
NET Services
We provide NET management services under contracts with state Medicaid and local agencies, hospital systems or private managed care organizations (“MCOs”). Most of our contracts for NET management services are capitated. This means that we are paid on a per member, per month basis for each eligible member. We do not direct bill for services under capitated contracts as revenue is based on the number of eligible members.
Human Services
Our Human Services revenue is primarily derived from provider contracts with state and local government agencies and government intermediaries, health maintenance organizations (“HMOs”) and to a lesser extent, commercial insurers. The government entities that pay for our services include welfare, child welfare and justice departments, public schools and state Medicaid programs. For the majority of the contracts where we provide human services directly, we are paid on a fee for service (“FFS”) basis. In other such arrangements, we receive a set monthly amount or we are paid amounts equal to the costs we incur to provide agreed upon services.
WD Services
With the acquisition of Ingeus in May, 2014, we now provide workforce development services on a global basis that include resume and job interview skills, networking and job placement services and technical job training through internally staffed resources. Our client base for workforce development services is broad and includes long-term unemployed, disabled, and unskilled individuals, as well as individuals that cope with medical illnesses, are newly graduated from educational institutions, and those that have been released from incarceration after an extended length of time. We contract primarily with government entities that seek to reduce the unemployment rate generally, or for targeted population cohorts. We are paid largely based on job placement and job sustainment success, but are also paid attachment fees based on the admission of clients into our programs, as well as incentive fees that are usually paid at the end of defined measurement periods based on direct and indirect variables. We bill according to contractual terms, typically after proof of services have been achieved.
Approximately 68.0% of Ingeus’s revenues from May 30, 2014 to December 31, 2014 were derived from seven standardized regional contracts with the Department of Work and Pension (“DWP”) under the Work Programme, whereby services are provided to long-term unemployed individuals to place them into jobs. Under these contracts, which commenced on April 2011 and continue through March 2016 with an additional two-year service period, Ingeus has historically been paid a fixed amount for each referred client as follows:
• Attachment fees, which ceased on July 1, 2014, which were typically upfront payments that were payable when a client was referred and entered the system;
• Job placement fees, which are typically payable when a client is employed, or job outcome fees, which are typically payable when a client is employed, and remains employed for a specified period of time;
• Sustainment fees, which are typically payable upon certain employment tenure milestones (for example, demonstrated continuing employment for up to 24 months); and
• Incentive payments, which are based on the achievement of certain global measures over four annual measurement periods commencing April 1, 2014.
As noted above, attachment fees are no longer payable under the DWP contracts. As a result, going forward, Ingeus will receive the majority of its revenue under these contracts only upon demonstrating the clients’ continued employment for a substantial period of time and upon achievement of incentive measures over the defined measurements periods. However, a substantial portion of the total cost of providing services to clients is incurred in the period between initial referral and job placement. In general, under the DWP contract and most of its other current contracts, Ingeus invests significant sums of money in personnel, leased office space, purchased or developed technology and other costs prior to commencing services. It is expected that future contacts will be structured in a similar fashion. In addition, Ingeus does and may in the future incur service delivery costs for significant periods of time before they receive payments under those contracts, leading to variability in Ingeus financial performance between quarters and for comparative periods.
HA Services
With the acquisition of Matrix in October, 2014, we contract with health plans to provide CHA for their Medicare Advantage (“MA”) members that meet certain pre-determined criteria as defined by the providers. A comprehensive health assessment is a comprehensive physical examination of an individual performed by one of our physicians or nurse practitioners (“NPs”). The health plans use the assessment reports created from the CHA examinations to impact care management of the MA member, and to accurately report the cost of care of those members.
We have also introduced new product lines, including in-home screenings, Medication Therapy Management (“MTM”), and analytic and physician services. Additionally, we contract directly with health plans and offer care management and quality measure software for customer use.
Critical Accounting Policies and Estimates
General
In preparing our financial statements in accordance with accounting principles generally accepted in the United States (“GAAP”) we are required to make estimates and judgments that affect the amounts reflected in our financial statements. We base our estimates on historical experience and on various other assumptions we believe to be reasonable under the circumstances. However, actual results may differ from these estimates under different assumptions or conditions.
Critical accounting policies are those policies most important to the portrayal of our financial condition and results of operations. These policies require our most difficult, subjective or complex judgments, often employing the use of estimates about the effect of matters inherently uncertain. Our most critical accounting policies pertain to revenue recognition, accounts receivable and allowance for doubtful accounts, accounting for business combinations, goodwill and other intangible assets, accrued transportation costs, loss reserves for certain reinsurance and self-funded insurance programs, stock-based compensation and income taxes.
Revenue Recognition
NET Services segment
Capitation contracts. The majority of our NET services revenue is generated under capitated contracts where we assume the responsibility of meeting the covered transportation requirements of a specific geographic population for a fixed amount per period. Revenues under capitation contracts with our payers are based on per-member monthly fees for an estimated number of participants in the payer’s program.
FFS contracts. Revenues earned under FFS contracts are recognized when the service is provided. Revenue under these types of contracts is based upon contractually established billing rates, less allowance for contractual adjustments. Estimates of contractual adjustments are based upon payment terms specified in the related agreements.
Flat fee contracts. Revenues earned under flat fee contracts are recognized ratably over the covered service period. Revenues under these types of contracts are based upon contractually established monthly flat fees that do not fluctuate with any changes in the membership population that can receive our services.
Human Services segment
FFS contracts. Revenue related to services provided under FFS contracts is recognized at the time services are rendered. Such services are provided at established billing rates.
As services are rendered, contract-specific documentation is prepared describing each service, time spent, and billing code to determine and support the value of each service provided and billed. The timing and amount of collection are dependent upon compliance with the billing requirements specified by each payer. Failure to comply with these requirements could delay the collection of amounts due to us under a contract or result in adjustments to amounts billed.
The performance of our contracts is subject to the condition that sufficient funds are appropriated, authorized and allocated by each state, city or other local government. If sufficient appropriations, authorizations and allocations are not provided by the respective state, city or other local government, we are at risk for uncollectible amounts or immediate termination or renegotiation of the financial terms of our contracts.
Cost-based service contracts. Revenues from our cost-based service contracts are recorded based on a combination of allowable direct costs, indirect overhead allocations, and stated allowable margins on those incurred costs. These revenues are compared to annual contract budget limits and, depending on reporting requirements, reductions of revenue may be recorded for certain contingencies. We annually submit projected costs for the coming year, which assist the contracting payers in establishing the annual contract amount to be paid for services provided under the contracts. We submit monthly cost reports which are used by the payers to determine the need for any payment adjustments. Completion of the cost report review process may range from one month to several years. In cases where funds paid to us exceed the allowable costs to provide services under contract, we may be required to repay amounts previously received.
Our cost reports are generally audited by payers annually. We periodically review our provisional billing rates and allocation of costs and provide for estimated payment adjustments. We believe that adequate provisions have been made in our consolidated financial statements for any material adjustments that might result from the outcome of any cost report audits. Differences between the amounts provided and the settlement amounts are recorded in our consolidated statement of income in the year of settlement. Such settlements have historically not been material.
Annual block purchase contract. Our annual block purchase contract requires us to provide or arrange for behavioral health services to eligible populations of beneficiaries as defined in the contract. We must provide a complete range of behavioral health clinical, case management, therapeutic and administrative services. We are obligated to provide services only to those clients with a demonstrated medical necessity. Our annual funding allocation amount may be increased when our patient service encounters exceed the contract amount; however, such increases are subject to government appropriation. There is no contractual limit to the number of eligible beneficiaries that may be assigned to us, or a specified limit to the level of services that may be provided to these beneficiaries if the services are deemed to be medically necessary. Therefore, we are at-risk if the costs of providing necessary services exceed the associated reimbursement.
The terms of the contract may be reviewed prospectively and amended as necessary to ensure adequate funding of our contractual obligations; however, there is no assurance that amendments will be approved or that funding will be adequate.
Workforce Development Services Segment
Revenues from our workforce development services are generated from providing resume and job interview skills, networking and job placement services, and technical job training through internally staffed or outsourced resources.
Our revenue is largely based on successful job placement and sustainment outcomes. While the specific terms vary by contract and country, we generally receive four types of revenue streams under our contracts with government entities: attachment fees, job placement/job outcome fees, sustainment fees and incentive fees. Attachment fees are typically upfront payments that are payable when a client enters the program. Job placement fees are typically payable when a client is employed, and job outcome fees are typically payable when a client is employed and remains employed for a specified period of time. Sustainment fees are typically payable upon certain employment tenure milestones, such as monthly payments for sustained employment past a specified time period. Finally, incentive fees are typically based upon a calculation that includes a variety of factors and inputs, such as average sustainment rates and client referral rates, and is often cumulative in nature.
Revenue generally is recognized ratably over the period from attachment to when services are provided, as is the case for attachment fees, or when certain milestones are achieved, as is the case with job placement/job outcome fees, and sustainment fees. Incentive fees are generally recognized when the revenue is fixed and determinable, frequently at the end of the cumulative calculation period, unless the contractual terms allow for earned payments on a fixed or ratable basis.
Health Assessment Services Segment
The HA Services segment contracts with health plans to provide clinical assessments for their MA members that meet certain pre-determined criteria as defined by the providers. Revenue is recognized in the period in which the services are rendered.
Deferred Revenue
At times we may receive funding for certain services in advance of services being rendered, or the revenue being realizable. These amounts are reflected in the accompanying consolidated balance sheets as deferred revenue until the services are rendered, or the revenue is realizable.
Accounts Receivable and Allowance for Doubtful Accounts
Clients are referred to us primarily through governmental programs and by commercial insurance companies, and we only provide services at the direction of a payer under a contractual arrangement. These circumstances have historically minimized any uncollectible amounts for services rendered. However, not all amounts recorded as accounts receivable will ultimately be collected.
We record all accounts receivable amounts at their contracted amount, less an allowance for doubtful accounts. We maintain an allowance for doubtful accounts at an amount we estimate to be sufficient to cover the risk that an account will not be collected. We regularly evaluate our accounts receivable, especially receivables that are past due, and reassess our allowance for doubtful accounts based on specific client collection issues. In circumstances where we are aware of a specific payer’s inability to meet its financial obligation, we record a specific addition to our allowance for doubtful accounts to reduce the net recognized receivable to the amount we reasonably expect to collect.
Our write-off experience for 2014, 2013 and 2012 was less than 1.0% of revenue.
Accounting for Business Combinations, Goodwill and Other Intangible Assets
When we consummate an acquisition we separately value all acquired identifiable intangible assets apart from goodwill in accordance with Accounting Standards Codification, or ASC, Topic 805 - Business Combinations. We analyze the carrying value of goodwill at the end of each fiscal year through an impairment analysis performed in the first quarter of the following year. When analyzing goodwill for impairment we first assess qualitative factors to determine whether it is necessary to perform the two-step quantitative goodwill impairment test described below. If we determine, based on a qualitative assessment, that it is more likely than not that the fair value of a reporting unit is less than its carrying amount, then we would calculate the fair value of the reporting unit and perform the two-step quantitative goodwill impairment test. In connection with our year-end asset impairment test, we reconcile the aggregate fair value of our reporting units to our market capitalization including a reasonable control premium. As part of this annual impairment test, we also compare the fair value of each reporting unit with its carrying value, including goodwill. If the carrying amount of a reporting unit exceeds its fair value, there is an indication of impairment. If an indication of impairment is identified, the impairment loss, if any, is measured by comparing the implied fair value of the reporting unit’s goodwill with its carrying value. In calculating the implied fair value of the reporting unit goodwill, the fair value of the reporting unit is allocated to all of the other assets and liabilities of that unit based on their fair values. The excess of the fair value of a reporting unit over the amount assigned to its other identifiable assets and liabilities is the implied fair value of goodwill. An impairment loss would be recognized when the carrying value of goodwill exceeds its implied fair value.
Similarly conducted interim impairment tests may also be required in advance of our annual impairment test if events occur or circumstances change that would more likely than not reduce the fair value, including goodwill, of one or more of our reporting units below the reporting unit’s carrying value. Such circumstances could include but are not limited to: (1) loss of significant contracts, (2) a significant adverse change in regulations applicable to our business or in the climate of our business, (3) unanticipated competition, (4) an adverse action or assessment by a regulator, or (5) a significant decline in our stock price.
In determining whether or not we had goodwill impairment to report for the years ended December 31, 2014, 2013 and 2012, we considered both a market-based valuation approach and an income-based valuation approach when estimating the fair values of our reporting units with goodwill balances as of such dates. The valuation methodology applied in 2014 was consistent with our methodology in 2013 and 2012. Under the market approach, the fair value of the reporting unit is determined using one or more methods based on current values in the market for similar businesses. Under the income approach, the fair value of the reporting unit is based on the cash flow streams expected to be generated by the reporting unit over an appropriate period and then discounting the cash flows to present value using an appropriate discount rate. The income approach is dependent on a number of significant management assumptions, including estimates of future revenue and expenses, growth rates and discount rates. Inherent in such fair value determinations are certain judgments and estimates relating to future cash flows, including our interpretation of current economic indicators and market valuations, and assumptions about our strategic plans with regard to our operations. To the extent additional information arises, market conditions change or our strategies change, it is possible that our conclusion regarding whether existing goodwill is impaired could change and result in a material adverse effect on our consolidated financial position or results of operations.
In conjunction with our annual review of goodwill impairment as of December 31, 2014, we performed the two-step impairment analysis and determined that goodwill was impaired for two of our Human Services segment reporting units. The goodwill impairment in the Maple Star reporting unit was attributable to declines in forecasted referrals, leading to a decline in projected future cash flows of the entity. We recorded an impairment charge of $3.8 million related to the Maple Star reporting unit. The impairment for the second reporting unit was attributable to lower than expected performance during 2014 in the Providence of Idaho reporting unit, as well as a lower than expected projections in future years. An impairment charge of $2.8 million was recorded related to the Providence of Idaho reporting unit.
Additionally, based on a triggering event for one of our other Human Services segment reporting units, we recorded a goodwill impairment charge of approximately $0.3 million prior to conducting our annual asset impairment test.
Also in conjunction with its annual review of goodwill impairment as of December 31, 2014, the Company performed the two-step analysis of its Ingeus reporting unit. After completing step one, the Company concluded the fair value of the reporting unit was less than its carrying value, requiring the Company to proceed to the second step of the two-step goodwill impairment test. As part of the Step 2 analysis, the Company analyzed its long-term assets, including property, plant and equipment, and its intangible assets. Based on this review, it was determined that the undiscounted cash flows from the reporting unit exceeded its carrying value. However, in determining the implied fair value of goodwill for the Ingeus reporting unit, the assigned fair value of the Ingeus reporting unit’s intangible assets as of December 31, 2014 was $13.7 million less than the carrying value. In accordance with ASC 350, the assignment of fair value to the assets and liabilities of the reporting unit is solely for the purpose of testing goodwill for impairment, the assets and liabilities of the reporting unit are not written up or down as a result of the allocation process. Based on the two-step analysis described above, the Company concluded the implied fair value of the Ingeus reporting unit goodwill exceeded its carrying value by $18.5 million. Accordingly, the Company concluded there was no impairment in its Ingeus reporting unit goodwill, and did not recognize any charges related to goodwill impairment as of December 31, 2014.
The Company believes the assumptions used in our discounted cash flow analysis are appropriate and result in reasonable estimates of the implied fair value of each reporting unit. We further believe the most significant assumptions used in our analysis are the expected revenue growth, margins and overall profitability of its reporting units. However, we may not meet our revenue growth and profitability targets, working capital needs and capital expenditures may be higher than forecast, changes in credit or equity markets may result in changes to our discount rate and general business conditions may result in changes to our terminal value assumptions for our reporting units. The amount of goodwill associated with Ingeus was $32.9 million at December 31, 2014.
As of December 31, 2014, other than the Human Services segment reporting units discuss above, the fair values of our reporting units subject to quantitative testing substantially exceeded their carrying values.
Based on our annual asset impairment test completed as of December 31, 2013 and 2012 we determined that no goodwill was impaired as of such dates. However, in 2013, we recorded a goodwill impairment charge of approximately $0.5 million as of June 30, 2013.
In connection with our acquisitions, we calculate the fair value of any management contracts, customer relationships, restrictive covenants, trademarks and trade names, software licenses and developed technology. We assess whether any relevant factors limit the period over which acquired assets are expected to contribute directly or indirectly to future cash flows for amortization purposes and determine an appropriate useful life for acquired customer relationships based on the expected period of time we will provide services to the payer. While we use discounted cash flows to value intangible assets, we have elected to use the straight-line method of amortization to determine amortization expense. If applicable, we assess the recoverability of the unamortized balance of our long-lived assets based on undiscounted expected future cash flows. If the review indicates that the carrying value is not fully recoverable, the excess of the carrying value over the fair value of any long-lived asset is recognized as an impairment loss.
As of December 31, 2014 and 2013, we determined that there was no impairment of intangible assets.
Accrued Transportation Costs
Transportation costs are estimated and accrued in the month the services are rendered by contracted transportation providers, and are determined using gross reservations for transportation services less cancellations, and average costs per transportation service by customer contract. Average costs per contract are determined by historical cost trends. Actual costs relating to a specific accounting period are monitored and compared to estimated accruals. Adjustments to those accruals are made based on reconciliations with actual costs incurred.
Loss Reserves for Certain Reinsurance and Self-Funded Insurance Programs
We reinsure a substantial portion of our NET Services’ and Human Services’ automobile, general and professional liability and workers’ compensation costs under reinsurance programs through our wholly-owned subsidiary Social Services Providers Captive Insurance Company (“SPCIC”). SPCIC is a licensed captive insurance company domiciled in the State of Arizona. SPCIC maintains reserves for obligations related to our reinsurance programs for our automobile, general and professional liability and workers’ compensation coverage.
As of December 31, 2014 and 2013, SPCIC had reserves of approximately $12.8 million and $10.6 million, respectively, for the automobile, general and professional liability and workers’ compensation programs.
In addition, we own Provado Insurance Services, Inc. (“Provado”), a licensed captive insurance company domiciled in the State of South Carolina. Provado historically provided reinsurance for policies written by a third party insurer for general liability, automobile liability, and automobile physical damage coverage to various members of the network of subcontracted transportation providers and independent third parties within our NET Services operating segment. Effective February 15, 2011, Provado has not renewed its reinsurance agreement and will not assume additional liabilities for policies commencing thereafter. It continues to administer existing policies for the foreseeable future and to resolve remaining and future claims related to these policies.
Provado maintains reserves for obligations related to the reinsurance programs for general liability, automobile liability, and automobile physical damage coverage. As of December 31, 2014 and 2013, Provado had reserves of approximately $1.4 million and $1.9 million, respectively.
We utilize analyses prepared by third party administrators and independent actuaries based on historical claims information with respect to the general and professional liability coverage, workers’ compensation coverage, automobile liability, and automobile physical damage to determine the amount of required reserves.
We also maintain a self-funded health insurance program provided to our NET Services’ and Human Services’ employees. With respect to this program, we consider historical and projected medical utilization data when estimating our health insurance program liability and related expense as well as using services of a third party administrator. As of December 31, 2014 and 2013, we had approximately $2.0 million and $1.9 million, respectively, in reserve for our self-funded health insurance programs.
We regularly analyze our reserves for incurred but not reported claims, and for reported but not paid claims related to our reinsurance and self-funded insurance programs. We believe our reserves are adequate. However, significant judgment is involved in assessing these reserves such as assessing historical paid claims, average lags between the claims’ incurred date, reported dates and paid dates, and the frequency and severity of claims. There may be differences between actual settlement amounts and recorded reserves and any resulting adjustments are included in expense once a probable amount is known. There were no significant prior period adjustments recorded in the periods covered by this report.
Stock-Based Compensation
We follow the fair value recognition provisions of ASC Topic 718 - Compensation-Stock Compensation (“ASC 718”), which requires companies to measure and recognize compensation expense for all share based payments at fair value. With respect to stock option awards, the fair value is estimated on the date of grant using the Black-Scholes option-pricing formula and amortized over the option’s vesting periods. The Black-Scholes option-pricing formula requires us to make assumptions for the expected dividend yield, stock price volatility, life of options and risk-free interest rate.
We follow the short-cut method prescribed by ASC 718 to calculate our pool of excess tax benefits available to absorb tax deficiencies recognized subsequent to the adoption of ASC 718 (“APIC pool”). There was no effect on our financial results for 2014, 2013 or 2012 related to the application of the short-cut method to determine our APIC pool balance.
Income Taxes
Deferred income taxes are determined by the liability method in accordance with ASC Topic 740 - Income Taxes. Under this method, deferred tax assets and liabilities are determined based on differences between the carrying amounts of assets and liabilities for financial reporting purposes and the amounts used for income tax purposes and are measured using the enacted tax rates and laws that will be in effect when the differences are expected to reverse. We record a valuation allowance which includes amounts for net operating loss and tax credit carryforwards for which we have concluded that it is more likely than not that these net operating loss and tax credit carryforwards will not be realized in the ordinary course of operations. We recognize interest and penalties related to income taxes as a component of income tax expense.
Foreign currency translation
Local currencies generally are considered the functional currencies outside the US. Assets and liabilities for operations in local-currency environments are translated at month-end exchange rates of the period reported. Income and expense items are translated at the average exchange rate for each applicable month. Cumulative translation adjustments are recorded as a component of accumulated other comprehensive income (loss) in stockholders’ equity.
Results of operations
Segment reporting. Our financial operating results are organized and reviewed by our chief operating decision maker along our service lines in four reportable segments: NET Services, Human Services, WD Services and HA Services. We operate these reportable segments as separate divisions and differentiate the segments based on the nature of the services they offer.
Consolidated Results
The following table sets forth the percentage of consolidated total revenues represented by items in our consolidated statements of income for the periods presented:
|
Year Ended December 31, |
||||||||||||
|
2014 |
2013 |
2012 |
||||||||||
|
Revenues: |
||||||||||||
|
Non-emergency transportation services |
59.7 | % | 68.6 | % | 67.9 | % | ||||||
|
Human services |
25.3 | 31.4 | 32.1 | |||||||||
|
Workforce development services |
12.1 | - | - | |||||||||
|
Health assessment services |
2.9 | - | - | |||||||||
|
Total revenues |
100.0 | 100.0 | 100.0 | |||||||||
|
Operating expenses: |
||||||||||||
|
Cost of non-emergency transportation services |
54.0 | 63.3 | 63.9 | |||||||||
|
Client service expense |
23.2 | 27.6 | 27.5 | |||||||||
|
Workforce development service expense |
10.8 | - | - | |||||||||
|
Health assessment service expense |
2.4 | - | - | |||||||||
|
General and administrative expense |
4.3 | 4.3 | 4.8 | |||||||||
|
Depreciation and amortization |
2.0 | 1.3 | 1.4 | |||||||||
|
Asset impairment charge |
0.4 | - | 0.2 | |||||||||
|
Total operating expenses |
97.1 | 96.5 | 97.8 | |||||||||
|
Operating income |
2.9 | 3.5 | 2.2 | |||||||||
|
Non-operating expense: |
||||||||||||
|
Interest expense, net |
1.0 | 0.6 | 0.7 | |||||||||
|
Loss on foreign currency translation |
- | - | - | |||||||||
|
Loss on extinguishment of debt |
- | 0.1 | - | |||||||||
|
Income before income taxes |
1.9 | 2.8 | 1.5 | |||||||||
|
Provision for income taxes |
0.5 | 1.1 | 0.7 | |||||||||
|
Net income |
1.4 | % | 1.7 | % | 0.8 | % | ||||||
Overview of trends of our results of operations for 2014
Our NET Services revenues for 2014 as compared to 2013 were favorably impacted by new contracts and expansion in certain markets. The results of operations for 2014 as compared to 2013 included an increase in revenue of 14.8% due primarily to new business, while the cost of transportation as a percentage of non-emergency transportation services revenue decreased to 90.5% during 2014 as compared to 92.2% during 2013, due primarily to lower utilization of transportation services than historical trends.
Our Human Services revenues for 2014 as compared to 2013 increased 6.2% and were favorably impacted by contracts that began in 2013 and were fully implemented in 2014. Client service payroll and related costs also increased in 2014 from 2013 by 7.4%. However, we experienced a 44.0% increase in client service purchased services costs in 2014 compared to 2013. This increase in client services purchased service costs was due to higher than expected foster care expenses in our Texas contract, which was terminated during the third quarter of 2014.
Our WD Services revenues for 2014 were $179.3 million. Workforce development service expenses comprised 89.3% of workforce development services revenue. We expect this ratio will fluctuate from period to period based upon contract milestones and start-up costs of most workforce development contracts. Our WD Services results include the time period of May 30, 2014 to December 31, 2014.
Our HA Services revenues for 2014 were $43.3 million. Health assessment service expenses comprised 81.2% of health assessment services revenue. Our HA Services results include the time period of October 23, 2014 to December 31, 2014.
We also experienced increases in general and administrative expenses, depreciation and amortization, and interest expense as a result of our acquisitions of Ingeus and Matrix during the year and the related debt incurred to fund the acquisitions. In addition, we experienced a reduction of expenses related to an adjustment in the estimated fair value of contingent consideration related to the Ingeus acquisition as of December 31, 2014.
Year ended December 31, 2014 compared to year ended December 31, 2013
Revenues
Service revenue is comprised of the following (in thousands):
|
Year Ended December 31, |
Dollar |
Percent |
||||||||||||||
|
2014 |
2013 |
change |
change |
|||||||||||||
|
Non-emergency transportation services |
$ | 884,287 | $ | 770,246 | $ | 114,041 | 14.8 | % | ||||||||
|
Human services |
374,245 | 352,436 | 21,809 | 6.2 | % | |||||||||||
|
Workforce deveopment services |
179,308 | - | 179,308 | |||||||||||||
|
Health assessment services |
43,331 | - | 43,331 | |||||||||||||
|
Total Services revenue |
$ | 1,481,171 | $ | 1,122,682 | $ | 358,489 | 31.9 | % | ||||||||
Non-emergency transportation services. Non-emergency transportation services revenues were as follows (in thousands):
|
Year Ended December 31, |
Dollar |
Percent |
||||||||||||
|
2014 |
2013 |
change |
change |
|||||||||||
| $ | 884,287 | $ | 770,246 | $ | 114,041 | 14.8 | % | |||||||
The major drivers of the increase in NET Services revenues in 2014 include increased membership under our New Jersey contract, a new contract with the state of Rhode Island, additional lives added under both new and expanded contracts in Michigan, implementation of various new managed care contracts across the country, and expansion of our contract with the states of Maine and Texas. Additional membership increases were experienced in a number of other states such as Delaware, Georgia, Nevada and South Carolina. This revenue growth was partially offset by the elimination of our contracts in Wisconsin, Mississippi, and Hartford, Connecticut.
A significant portion of this revenue was generated under capitated contracts where we assumed the responsibility of meeting the covered transportation requirements of beneficiaries residing in a specific geographic region for fixed payment amounts per beneficiary. Due to the fixed revenue stream and variable expense structure of our NET Services operating segment, expenses related to this segment vary with seasonal fluctuations. We expect our operating results will continue to fluctuate on a quarterly basis.
Human services. Human services revenues are comprised of the following (in thousands):
|
Year Ended December 31, |
Dollar |
Percent |
||||||||||||||
|
2014 |
2013 |
change |
change |
|||||||||||||
|
Home and community based services |
$ | 319,473 | $ | 305,616 | $ | 13,857 | 4.5 | % | ||||||||
|
Foster care services |
53,295 | 38,490 | 14,805 | 38.5 | % | |||||||||||
|
Management fees |
1,477 | 8,330 | (6,853 | ) | -82.3 | % | ||||||||||
|
Total human services revenues |
$ | 374,245 | $ | 352,436 | $ | 21,809 | 6.2 | % | ||||||||
Home and community based services. Home and community based services revenue increased in 2014 from 2013 primarily due to revenue derived from an acquired entity in Idaho of approximately $6.3 million and an acquired entity in Massachusetts of approximately $2.3 million. Additionally, significant growth in Maine and Delaware have had a favorable impact on revenue.
Foster care services. Our foster care services revenues increased in 2014 from 2013 primarily as a result of our foster care contract in Texas that began in 2013. Although we generated increased foster care service revenue under this contract, costs under the contract were higher than expected, and as such, we exited the contract in 2014. We expect to see a decline in foster care services revenue in 2015 as compared to 2014.
Management fees. The exit of, and changes to, certain management service agreements resulted in decreased management fees in 2014 as compared to 2013. We do not expect management fee revenue to be a significant portion of our business going forward.
Workforce development services. WD Services revenue was as follows (in thousands):
|
Year Ended December 31, |
Dollar |
|||||||||
|
2014 |
2013 |
change |
||||||||
| $ | 179,308 | $ | - | $ | 179,308 | |||||
WD services revenue represents revenue attributable to Ingeus, which we acquired on May 30, 2014. The 2014 revenue includes seven months of revenue derived from providing international outsourced employability programs.
Health assessment services. HA Services revenue was as follows (in thousands):
|
Year Ended December 31, |
Dollar |
|||||||||
|
2014 |
2013 |
change |
||||||||
| $ | 43,331 | $ | - | $ | 43,331 | |||||
HA services revenue represents revenue attributable to Matrix, which we acquired on October 23, 2014. The 2014 revenue includes revenue from October 23, 2014 to December 31, 2014 primarily derived from providing CHAs.
Operating expenses
Service Expense.
Service expense is comprised of the following (in thousands):
|
Year Ended December 31, |
Dollar |
Percent |
||||||||||||||
|
2014 |
2013 |
change |
change |
|||||||||||||
|
Cost of non-emergency transportation services |
$ | 800,155 | $ | 710,428 | $ | 89,727 | 12.6 | % | ||||||||
|
Human service expense |
343,253 | 309,623 | 33,630 | 10.9 | % | |||||||||||
|
Workforce development service expense |
160,200 | - | 160,200 | |||||||||||||
|
Health assessment service expense |
35,185 | - | 35,185 | |||||||||||||
|
Total Service expense |
$ | 1,338,793 | $ | 1,020,051 | $ | 318,742 | 31.2 | % | ||||||||
Cost of non-emergency transportation services. Non-emergency transportation services expenses included the following for 2014 and 2013 (in thousands):
|
Year Ended December 31, |
Dollar |
Percent |
||||||||||||||
|
2014 |
2013 |
change |
change |
|||||||||||||
|
Purchased services |
$ | 657,680 | $ | 591,538 | $ | 66,142 | 11.2 | % | ||||||||
|
Payroll and related costs |
111,212 | 92,549 | 18,663 | 20.2 | % | |||||||||||
|
Other operating expenses |
30,676 | 25,261 | 5,415 | 21.4 | % | |||||||||||
|
Stock-based compensation |
587 | 1,080 | (493 | ) | -45.6 | % | ||||||||||
|
Total cost of non-emergency transportation services |
$ | 800,155 | $ | 710,428 | $ | 89,727 | 12.6 | % | ||||||||
Purchased services. We subcontract with third party transportation providers to provide non-emergency transportation services to our clients. The increase in purchased services for 2014 compared to 2013 is attributable to additional purchased service costs for our expanded business and new contracts covering Hawaii, Kansas, Louisiana, Maine, Michigan, New Mexico, Ohio, Texas, Rhode Island, New York, and Utah, as well as further expansion in the California commercial and managed care markets. These increases were partially offset by decreases related to the termination of a contract with the City of Hartford, several managed care contracts, our Wisconsin contracts, and the State of Mississippi Medicaid and End Stage Renal contracts. Additional decreases in purchase services costs were caused by the transition to an administrative services only contract in Connecticut and reduced transportation utilization due to inclement weather. As a percentage of NET Services revenue, purchased services decreased to approximately 74.4% for 2014, from 76.8% for 2013. This decline in purchased service expense as a percent of NET Services revenue is due to the membership expansion in existing contracts with lower utilization levels than the historical trend.
Payroll and related costs. The increase in payroll and related costs of our NET Services segment for 2014 as compared to 2013 was due to the hiring of additional staff for new contracts in Maine, Texas and Utah, expansion efforts across several other markets, and additional staffing needed for expansion of the California ambulance commercial and managed care lines of business. Additional hiring of staff is also reflected in the last quarter of 2014 in implementing contracts that have gone live in first quarter of 2015. Payroll and related costs, as a percentage of NET Services revenue, increased to 12.6% for 2014 from 12.0% for 2013, due to the addition of call center staff to ensure our compliance with administrative and intake response time requirements of some of our new contracts, as well as the transition of the Connecticut contract from a full risk contract to administrative services only contract. All of these activities resulted in higher payroll and related costs as a percentage of consolidated revenue.
Other operating expenses. Other operating expenses increased for 2014 as compared to 2013 primarily due to additional business taxes in expanding markets, travel and implementation cost related to new business as well as costs related to the deployment of our new centralized reservation system. During 2014, the NET Services segment undertook a redesign of its reservation system architecture transitioning from individual market switches to one centralized hub offering greater efficiencies as well as standard consistency throughout our segment. This involved a deployment schedule of over nine months which commenced in July 2014 and contributed to higher travel and implementation cost for the segment. Other operating expenses as a percentage of NET Services revenues were 3.5% for 2014 and 3.3% for 2013.
Stock-based compensation. Stock-based compensation expense was approximately $0.6 million and $1.1 million for 2014 and 2013, respectively. This item was primarily comprised of the amortization of the fair value of stock options and restricted stock awarded to employees of our NET Services segment under our 2006 Plan, as well as benefits and costs related to performance restricted stock units granted to an executive officer and a key employee.
Human service expense. Human service expense included the following for the years ended December 31, 2014 and 2013 (in thousands):
|
Year Ended December 31, |
Dollar |
Percent |
||||||||||||||
|
2014 |
2013 |
change |
change |
|||||||||||||
|
Payroll and related costs |
$ | 246,445 | $ | 229,452 | $ | 16,993 | 7.4 | % | ||||||||
|
Purchased services |
39,965 | 27,748 | 12,217 | 44.0 | % | |||||||||||
|
Other operating expenses |
56,837 | 51,792 | 5,045 | 9.7 | % | |||||||||||
|
Stock-based compensation |
6 | 631 | (625 | ) | -99.0 | % | ||||||||||
|
Total client service expense |
$ | 343,253 | $ | 309,623 | $ | 33,630 | 10.9 | % | ||||||||
Payroll and related costs. Approximately $7.2 million of the increase in payroll and related costs is attributable to two human services businesses acquired during 2014. The remaining increase in payroll and related costs from 2013 to 2014 is primarily due to costs related to the termination of an executive officer and increased headcount in certain markets, including North Carolina, Maine, Virginia and Delaware. Payroll and related costs as a percentage of revenue of our Human Services segment were 65.9% for 2014 and 65.1% for 2013.
Purchased services. We incur a variety of support service expenses in the normal course of our domestic business, including foster parent payments, pharmacy payments and out-of-home placements. In addition, we subcontract with a network of providers for a portion of the legacy workforce development services we provide. In 2014, we experienced an increase in foster parent payments of approximately $15.6 million. This increase was primarily related to our contract in Texas that began in 2013 and was terminated in the third quarter of 2014. We additionally incurred approximately $1.4 million less in expenses for out-of-home placements in 2014, primarily due to decreased utilization in Arizona. Expenses related to workforce development also decreased approximately $1.3 million from 2013 due primarily to the reclassification of certain cost reimbursements to other operating expenses. Purchased services, as a percentage of our Human Services segment revenues increased to 10.7% for 2014, up from 7.9% for 2013 due to the impact of foster parent payments relative to the level of related revenue.
Other operating expenses. Other operating expenses, as a percentage of revenue of our Human Services segment, increased to 15.2% for 2014 from 14.7% for 2013.
Stock-based compensation. Stock-based compensation for 2014 includes a benefit from the forfeiture of stock related awards for a terminated executive officer. For both periods, this item includes the amortization of the fair value of stock options and restricted stock awarded to key employees under our 2006 Plan, as well as benefits and costs related to performance restricted stock units.
Workforce development service expense. Workforce development service expense, for our WD Services segment, was as follows (in thousands):
|
Year Ended December 31, |
Dollar |
|||||||||||
|
2014 |
2013 |
change |
||||||||||
|
Payroll and related costs |
$ | 90,229 | $ | - | $ | 90,229 | ||||||
|
Purchased services |
46,939 | - | 46,939 | |||||||||
|
Other operating expenses |
19,600 | - | 19,600 | |||||||||
|
Stock-based compensation |
3,432 | - | 3,432 | |||||||||
|
Total workforce development service expense |
$ | 160,200 | $ | - | $ | 160,200 | ||||||
Payroll and related costs. The payroll and related costs of Ingeus totaled $90.2 million. Payroll and related costs of our WD Services segment as a percentage of WD Services segment revenue, were 50.3% for 2014.
Purchased services. We subcontract with a network of providers for a portion of the workforce development services we provide. Our 2014 results include $46.9 million of purchased services expense related to Ingeus. Purchased services of our WD Service segment, as a percentage of our WD Services segment revenue, was 26.2% for 2014.
Other operating expenses. Other operating expenses of our WD Services segment, as a percentage of WD Services segment revenue, were 10.9% for 2014. Other operating expenses include, among other things, administrative, travel, information technology and client related expenses.
Stock-based compensation. Stock-based compensation was approximately $3.4 million for 2014. This item primarily includes the expense related to the amortization of the fair value of restricted stock awards issued in connection with the acquisition of Ingeus.
Health assessment service expense. Health assessment service expense, for our HA Services segment, was as follows (in thousands):
|
Year Ended December 31, |
Dollar |
|||||||||||
|
2014 |
2013 |
change |
||||||||||
|
Payroll and related costs |
$ | 27,571 | $ | - | $ | 27,571 | ||||||
|
Purchased services |
356 | - | 356 | |||||||||
|
Other operating expenses |
7,258 | - | 7,258 | |||||||||
|
Total health assessment service expense |
$ | 35,185 | $ | - | $ | 35,185 | ||||||
Payroll and related costs. The payroll and related costs of Matrix totaled $27.6 million. Payroll and related costs of our HA Services segment as a percentage of HA Services segment revenue, were 63.6% for 2014.
Purchased services. Purchased services of our HA Service segment, as a percentage of our HA Services segment revenue, was 0.8% for 2014.
Other operating expenses. Other operating expenses of our HA Services segment, as a percentage of HA Services segment revenue, were 16.8% for 2014. Other operating expenses include, among other things, administrative, travel, information technology and contract implementation expenses.
General and administrative expense. General and administrative expenses were as follows (in thousands):
|
Year Ended December 31, |
Dollar |
Percent |
||||||||||||
|
2014 |
2013 |
change |
change |
|||||||||||
| $ | 63,635 | $ | 48,633 | $ | 15,002 | 30.8% | ||||||||
The increase in general and administrative expenses for 2014 as compared to 2013 was primarily a result of approximately $11.8 million in acquisition related costs, $3.0 million in third party fees related to our debt financing and $0.8 million in integration and restructuring costs incurred during 2014. Additionally, there was an increase in stock based compensation expense of approximately $2.2 million and $1.5 million related to stock options and stock appreciation rights, respectively, primarily due to awards granted to an executive officer, key employees and a director for efforts made in connection with the Ingeus and Matrix acquisitions during the third quarter of 2014, one-third of which vested upon grant. In addition, we incurred approximately $12.2 million in facility costs related to Ingeus, $0.4 million in facilities costs related to Matrix, and an increase of approximately $2.2 million in other facility costs during 2014, which are included in general and administrative expense. These increases were partially offset by an adjustment in the estimated fair value of contingent consideration related to the Ingeus acquisition of approximately $16.1 million. Additionally, there was a decrease in payroll and related costs of approximately $3.4 million, primarily attributable to changes in management service agreements. General and administrative expense, as a percentage of revenue, remained constant at 4.3% in 2014 and 2013.
Depreciation and amortization. Depreciation and amortization were as follows (in thousands):
|
Year Ended December 31, |
Dollar |
Percent |
||||||||||||
|
2014 |
2013 |
change |
change |
|||||||||||
| $ | 29,488 | $ | 14,872 | $ | 14,616 | 98.3% | ||||||||
As a percentage of revenues, depreciation and amortization was approximately 2.0% and 1.3% for 2014 and 2013, respectively. The increase in depreciation and amortization in 2014 as compared to 2013 was primarily due to the amortization of intangible assets acquired through acquisitions in 2014 totaling approximately $9.0 million for 2014. Additionally, Ingeus incurred depreciation expense of $4.0 million in 2014 and Matrix incurred depreciation expense of $0.6 million in 2014.
Asset impairment charge. Asset impairment charges were as follows (in thousands):
|
Year Ended December 31, |
Dollar |
Percent |
||||||||||||
|
2014 |
2013 |
change |
change |
|||||||||||
| $ | 6,915 | $ | 492 | $ | 6,423 | 1305.5% | ||||||||
At the end of 2014, prior to our annual impairment testing, we determined we would not seek to renew one of our management agreements that ends in June 2016. Due to this triggering event, we initiated an analysis of the fair value of goodwill and determined that goodwill related to one of our Human Services segment reporting units was impaired. Based on this determination, we recorded a non-cash charge of approximately $0.3 million as of December 31, 2014 to reduce the carrying value of the related goodwill to zero. Additionally, based on the results of our annual impairment test, we recorded an asset impairment charge of approximately $6.6 million for two of our Human Services segment reporting units.
In connection with preparing our quarterly financial statements for the period ended June 30, 2013, we initiated an analysis of the fair value of goodwill and determined that goodwill related to Rio Grande Management Company, L.L.C., a wholly-owned subsidiary of the Company, was impaired. Based on this determination, we recorded a non-cash charge of approximately $0.5 million in the Human Services segment during the year ended December 31, 2013 to reduce the carrying value of the related goodwill to zero.
Non-operating expense
Interest expense, net. Interest expense, net charges were as follows (in thousands):
Year Ended December 31, Dollar Percent 2014 2013 change change
$
14,600
$
6,894
$
7,706
111.8%
Our current and long-term debt obligations have increased to approximately $575.2 million at December 31, 2014, from $123.5 million at December 31, 2013. The increase in our interest expense for 2014 as compared to 2013 primarily resulted from the increase in outstanding debt, as well as approximately $4.5 million of financing fees that were deferred and fully expensed in the fourth quarter of 2014 in relation to bridge financing commitments.
(Gain) on foreign currency. (Gain) on foreign currency of approximately $37,000 for 2014 resulted primarily from translation adjustments on intercompany transactions with our foreign subsidiaries.
Loss on extinguishment of debt. Loss on extinguishment of debt of approximately $0.5 million for 2013 resulted from the write-off of deferred financing fees related to our credit facility that was repaid in full in August 2013 with proceeds from our amended and restated credit facility. As current and previous credit facilities were loan syndications, and a number of lenders participated in both credit facilities, the Company evaluated the accounting for financing fees on a lender by lender basis and recorded a charge accordingly.
Provision for income taxes
Our effective tax rate for 2014 and 2013 was 27.0% and 37.7% respectively. Our effective tax rate was lower than the US federal statutory rate of 35.0% for 2014 due primarily to the impact of the non-taxable nature of a favorable contingent consideration adjustment related to the Ingeus acquisition. Our effective tax rate was higher than the US federal statutory rate for 2013 due primarily to state taxes as well as various non-deductible expenses.
Adjusted EBITDA
After adjusting for the items noted in the table below, Adjusted EBITDA was $84.0 million for 2014 as compared to $55.3 million for 2013.
EBITDA and Adjusted EBITDA are non-GAAP measurements. We utilize these non-GAAP measurements as a means to measure overall operating performance and to better compare current operating results with other companies within our industry. Details of the excluded items and a reconciliation of the non-GAAP financial measures to the most comparable GAAP financial measure are presented in the table below. The non-GAAP measures do not replace the presentation of our GAAP financial results. We have provided this supplemental non-GAAP information because we believe it provides meaningful comparisons of the results of our operations for the periods presented. The non-GAAP measures are not in accordance with, or an alternative for, GAAP and may be different from non-GAAP measures used by some other companies.
|
(in thousands) |
||||||||
|
Year ended December 31, |
||||||||
|
2014 |
2013 |
|||||||
|
Net income |
$ | 20,275 | $ | 19,438 | ||||
|
Interest expense, net |
14,600 | 6,894 | ||||||
|
Provision for income taxes |
7,502 | 11,777 | ||||||
|
Depreciation and amortization |
29,488 | 14,872 | ||||||
|
EBITDA |
71,865 | 52,981 | ||||||
|
Acquisition costs |
11,838 | - | ||||||
|
Integration and restructuring charges |
2,785 | - | ||||||
|
General and administrative financing costs |
2,971 | - | ||||||
|
Ingeus acquisition related equity compensation |
3,426 | - | ||||||
|
(Gain) on foreign currency translation |
(37 | ) | - | |||||
|
Contingent consideration adjustments |
(16,314 | ) | - | |||||
|
Asset impairment charge (a) |
6,915 | 492 | ||||||
|
Payments related to retirement of executive officers, net (b) |
511 | 1,277 | ||||||
|
Loss on extinguishment of debt (c) |
- | 525 | ||||||
|
Adjusted EBITDA |
$ | 83,960 | $ | 55,275 | ||||
|
a) |
Impairment charges taken in 2014 and 2013 related to three Human Services reporting units in 2014 and one Human Services reporting unit in 2013. |
|
b) |
Represents payments related to the retirement or termination of certain executives and a key employee, net of benefit of forfeiture of stock based compensation upon their departure. |
|
c) |
Represents a loss on extinguishment of debt resulting from the write-off of deferred financing fees related to our credit facility that was refinanced in full in August 2013. |
Year ended December 31, 2013 compared to year ended December 31, 2012
Revenues
Service revenue is comprised of the following (in thousands):
|
Year Ended December 31, |
Dollar |
Percent |
||||||||||||||
|
2013 |
2012 |
change |
change |
|||||||||||||
|
Non-emergency transportation services |
$ | 770,246 | $ | 750,658 | $ | 19,588 | 2.6 | % | ||||||||
|
Human services |
352,436 | 355,231 | (2,795 | ) | -0.8 | % | ||||||||||
|
Total Services revenue |
$ | 1,122,682 | $ | 1,105,889 | $ | 16,793 | 1.5 | % | ||||||||
Non-emergency transportation services. Non-emergency transportation services revenues were as follows (in thousands):
|
Year Ended December 31, |
Dollar |
Percent |
||||||||||||
|
2013 |
2012 |
change |
change |
|||||||||||
| $ | 770,246 | $ | 750,658 | $ | 19,588 | 2.6 | % | |||||||
NET Services revenues were favorably impacted in 2013 by:
|
● |
full year results from the expansion of two additional regions in South Carolina in February 2012; |
|
● |
full year results from the expansion of two additional regions in Georgia in April and July 2012; |
|
● |
full year results from the addition of our Dallas, Texas Medicaid contract in April 2012; |
|
● |
the multi-phased implementation of the New York City administrative services contract which began in May 2012 and was completed in the first quarter of 2013; |
|
● |
implementation of various MCO contracts in Louisiana, Hawaii and Kansas; |
|
● |
continued expansion of our California ambulance commercial and managed care lines of business; and |
|
● |
rate adjustments matching historical utilization in a number of our contracts, as well as new rates for several renewed and awarded contracts. |
These factors noted above were partially offset by a decrease in revenue resulting from the elimination and transition of the Connecticut “at-risk” contract to a new “administrative services only” contract implemented in February 2013, as well as the elimination of both the State and Southeast Region Medicaid contracts in Wisconsin, and the contract in Arkansas.
Human services. Human services revenues are comprised of the following (in thousands):
|
Year Ended December 31, |
Dollar |
Percent |
||||||||||||||
|
2013 |
2012 |
change |
change |
|||||||||||||
|
Home and community based services |
$ | 305,616 | $ | 309,300 | $ | (3,684 | ) | -1.2 | % | |||||||
|
Foster care services |
38,490 | 33,534 | 4,956 | 14.8 | % | |||||||||||
|
Management fees |
8,330 | 12,397 | (4,067 | ) | -32.8 | % | ||||||||||
|
Total human services revenues |
$ | 352,436 | $ | 355,231 | $ | (2,795 | ) | -0.8 | % | |||||||
Home and community based services. Contract terminations in Florida and Canada, as well as the impact of waivers granted under the NCLB, led to a decrease in home and community based services revenues for 2013 as compared to 2012. Decreases in revenue also occurred due to reforms in managed care and a decrease in services provided in certain regions due to other contract losses and inclement weather. The decrease in revenue was partially offset by revenues derived from our new workforce development program in Wisconsin that began during 2013, as well as the impact of rate increases in certain programs during 2013 and the implementation of other new programs in various markets.
Foster care services. Our foster care services revenues increased in 2013 from 2012 primarily as a result of expanding services into rural areas in Tennessee and a new contract in Texas.
Management fees. The termination of, and changes to, certain management service agreements resulted in decreased management fees in 2013 as compared to 2012.
Operating expenses
Service Expense.
Service expense is comprised of the following (in thousands):
|
Year Ended December 31, |
Dollar |
Percent |
||||||||||||||
|
2013 |
2012 |
change |
change |
|||||||||||||
|
Cost of non-emergency transportation services |
$ | 710,428 | $ | 706,692 | $ | 3,736 | 0.5 | % | ||||||||
|
Human service expense |
309,623 | 304,084 | 5,539 | 1.8 | % | |||||||||||
|
Total Service expense |
$ | 1,020,051 | $ | 1,010,776 | $ | 9,275 | 0.9 | % | ||||||||
Cost of non-emergency transportation services. Non-emergency transportation services expenses included the following for 2013 and 2012 (in thousands):
|
Year Ended December 31, |
Dollar |
Percent |
||||||||||||||
|
2013 |
2012 |
change |
change |
|||||||||||||
|
Payroll and related costs |
$ | 92,549 | $ | 79,048 | $ | 13,501 | 17.1 | % | ||||||||
|
Purchased services |
591,538 | 600,494 | (8,956 | ) | -1.5 | % | ||||||||||
|
Other operating expenses |
25,261 | 25,713 | (452 | ) | -1.8 | % | ||||||||||
|
Stock-based compensation |
1,080 | 1,437 | (357 | ) | -24.8 | % | ||||||||||
|
Total cost of non-emergency transportation services |
$ | 710,428 | $ | 706,692 | $ | 3,736 | 0.5 | % | ||||||||
Payroll and related costs. The increase in payroll and related costs of our NET Services segment for 2013 as compared to 2012 was due to additional staff hired for new contracts and contract expansions in Georgia, Texas, South Carolina and New York, along with additional staffing needed for expansion of the California ambulance commercial and managed care lines of business. Payroll and related costs, as a percentage of NET Services revenue, increased to 12.0% for 2013 from 10.5% for 2012, as we have added additional call center staff to ensure our compliance with the more demanding service authorization process and intake response time requirements of some of our new contracts, as well as transitioning the Connecticut contract and various New York managed care contracts from full risk contracts to administrative services only contracts. All of these activities resulted in higher payroll and related costs as a percentage of consolidated revenue.
Purchased services. We subcontract with third party transportation providers to provide non-emergency transportation services to our clients. The termination of our Arkansas and Wisconsin contracts, and the transition to an administrative services only contract in Connecticut, whereby we are only responsible for the authorization process, not the payment to transportation providers, has led to a decrease in purchased services. However, this decrease was partially offset by additional purchased service costs for our expanded business in Georgia, Texas, South Carolina and California for 2013 as compared to 2012. As a percentage of NET Services revenue, purchased services decreased to approximately 76.8% for 2013, from 80.0% for 2012.
Other operating expenses. Other operating expenses decreased for 2013 as compared to 2012 due primarily to efficiencies gained as we optimized most of our call center and management infrastructure, as well as a reduction in new contract implementation costs. Other operating expenses as a percentage of NET Services revenues were 3.3% for 2013 and 3.4% for 2012.
Stock-based compensation. Stock-based compensation expense was approximately $1.1 million and $1.4 million for 2013 and 2012, respectively. This item was primarily comprised of the amortization of the fair value of stock options and restricted stock awarded to employees of our NET Services segment under our 2006 Plan, as well as costs related to performance restricted stock units granted to an executive officer and a key employee.
Client service expense. Client service expense included the following for the years ended December 31, 2013 and 2012 (in thousands):
|
Year Ended December 31, |
Dollar |
Percent |
||||||||||||||
|
2013 |
2012 |
change |
change |
|||||||||||||
|
Payroll and related costs |
$ | 229,452 | $ | 228,782 | $ | 670 | 0.3 | % | ||||||||
|
Purchased services |
27,748 | 26,000 | 1,748 | 6.7 | % | |||||||||||
|
Other operating expenses |
51,792 | 48,408 | 3,384 | 7.0 | % | |||||||||||
|
Stock-based compensation |
631 | 894 | (263 | ) | -29.4 | % | ||||||||||
|
Total client service expense |
$ | 309,623 | $ | 304,084 | $ | 5,539 | 1.8 | % | ||||||||
Payroll and related costs. Our payroll and related costs increased in 2013 from 2012 primarily due to costs associated with a workforce development contract in Wisconsin that began in 2013, a new foster care program in Texas, 2013 bonus accruals and additional information technology staff added during 2013. These increases were partially offset by decreases in payroll in Florida and Canada and in our nationwide tutoring business, primarily as the result of contract terminations and the impact of waivers granted under the NCLB. Payroll and related costs as a percentage of revenue of our Human Services segment were 65.1% for 2013 and 64.4% for 2012.
Purchased services. We incur a variety of other support service expenses in the normal course of our domestic business, including foster parent payments, pharmacy payments and out-of-home placements. In addition, we subcontract with a network of providers for a portion of the workforce development services we provide throughout British Columbia, Canada. In 2013, we experienced an increase in foster parent payments of approximately $2.7 million, which corresponds to the increase in foster care revenue. This increase in purchased services was partially offset by decreased costs resulting from contract terminations in Canada of approximately $1.7 million as compared to 2012. Purchased services, as a percentage of our Human Services segment revenues increased to 7.9% for 2013, up from 7.3% for 2012 due to the impact of foster parent payments relative to the level of related revenue.
Other operating expenses. Other operating expenses increased by approximately $0.7 million for 2013 as compared to 2012 due to an increase in incurred but not reported automobile, general liability and workers’ compensation claims. Additionally, other operating expenses increased by approximately $1.0 million for client related costs including client mileage and transportation, primarily related to new program expenses. Program start-up costs for our new Texas contract have also resulted in an increase in expense year over year. Other operating expenses, as a percentage of revenue of our Human Services segment, increased to 14.7% for 2013 from 13.6% for 2012.
Stock-based compensation. Stock-based compensation expense was approximately $0.6 million and $0.9 million for 2013 and 2012, respectively. This item was primarily comprised of the amortization of the fair value of stock options and restricted stock awarded to key employees under our 2006 Plan, as well as costs related to performance restricted stock units granted to an executive officer.
General and administrative expense. General and administrative expenses were as follows (in thousands):
|
Year Ended December 31, |
Dollar |
Percent |
||||||||||||
|
2013 |
2012 |
change |
change |
|||||||||||
| $ | 48,633 | $ | 53,383 | $ | (4,750 | ) | -8.9% | |||||||
The decrease in administrative expenses for 2013 as compared to 2012 was primarily a result of a net decrease in payroll and related costs of approximately $3.6 million. This net decrease included decreased costs attributable to changes in management service agreements and decreased severance costs, offset by an increase in accrued bonuses for 2013. Additionally, charitable contribution expense declined by approximately $1.7 million as compared to 2012. These items were partially offset by an increase in facilities costs of approximately $0.7 million related to our NET Services segment growth and the opening of new operating locations. General and administrative expense, as a percentage of revenue, decreased to 4.3% in 2013 from 4.8% in 2012, primarily due to the decreases in general and administrative expenses discussed above, as well as a total revenue increase of approximately 1.5% that did not significantly impact general and administrative expenses.
Depreciation and amortization. Depreciation and amortization were as follows (in thousands):
|
Year Ended December 31, |
Dollar |
Percent |
||||||||||||
|
2013 |
2012 |
change |
change |
|||||||||||
| $ | 14,872 | $ | 15,023 | $ | (151 | ) | -1.0% | |||||||
As a percentage of revenues, depreciation and amortization was approximately 1.3% and 1.4% for 2013 and 2012, respectively.
Asset impairment charge. Asset impairment charges were as follows (in thousands):
|
Year Ended December 31, |
Dollar |
Percent |
||||||||||||
|
2013 |
2012 |
change |
change |
|||||||||||
| $ | 492 | $ | 2,506 | $ | (2,014 | ) | -80.4% | |||||||
During the second quarter of 2013, the not-for-profit entities managed by Rio, our wholly-owned subsidiary, were notified of the termination of funding for certain of their services. We expected that, due to this change in funding, the not-for-profit entities Rio serves will not be able to maintain the level of business they historically experienced, which was expected to result in the decrease or elimination of services provided by Rio. Based on these factors, in connection with preparing our quarterly financial statements for the period ended June 30, 2013, we initiated an analysis of the fair value of goodwill and determined that goodwill related to Rio was impaired. Based on this determination, we recorded a non-cash charge of approximately $0.5 million as of June 30, 2013 to reduce the carrying value of the related goodwill to zero.
During 2012, WCG experienced a decline in its business due to the impact of a reorganization of the service delivery system in British Columbia. As part of this reorganization, all of the contracts for services in this market expired and new contracts were put up for bid. Due to an increased level of competition in British Columbia and a decrease in the number of services funded, WCG was unable to regain the level of business it experienced prior to the reorganization. The impact of this system reorganization was not fully realized until the conclusion of the transition to the new system in the third quarter of 2012 and contributed to a decrease in the financial results of operations of WCG for 2012. Due to these factors, we initiated an analysis of the fair value of goodwill and other intangible assets, and determined that customer relationships of WCG which comprise other intangible assets were impaired. Based on this determination, we recorded a non-cash charge of approximately $2.5 million to reduce the carrying value of customer relationship intangible assets based on their estimated fair values as of September 30, 2012.
Non-operating (income) expense
Interest expense, net. Our current and long-term debt obligations have decreased to approximately $123.5 million at December 31, 2013, from $130.0 million at December 31, 2012. The decrease in our interest expense for 2013 as compared to 2012 primarily resulted from the decrease in outstanding debt, as well as a decrease in the interest rate from LIBOR plus 2.25% - 3.00% to LIBOR plus 1.75% - 2.50% under our credit facility as a result of the refinancing of our long-term debt in August 2013.
Loss on extinguishment of debt. Loss on extinguishment of debt of approximately $0.5 million for 2013 resulted from the write-off of deferred financing fees related to our credit facility that was refinanced in full in August 2013 with proceeds of our amended and restated credit facility. We accounted for the unamortized deferred financing fees related to the previous credit facility under ASC 470-50 – Debt Modifications and Extinguishments. As current and previous credit facilities were loan syndications, and a number of lenders participated in both credit facilities, the Company evaluated the accounting for financing fees on a lender by lender basis and recorded a charge accordingly.
Provision for income taxes
Our effective tax rate for 2013 and 2012 was 37.7% and 49.2%, respectively. Our effective tax rate was higher than the US federal statutory rate of 35.0% for 2013 and 2012 due primarily to state taxes as well as various non-deductible expenses. The 2013 effective tax rate was favorably impacted primarily by disqualifying dispositions of incentive stock options. The 2012 rate was favorably impacted by the final determination of the tax benefits related to certain liabilities assumed as a result of a 2011 acquisition, but was unfavorably impacted by lower projected income before income taxes, which was primarily due to the $2.5 million intangible impairment charge recorded in the quarter ended September 30, 2012.
Adjusted EBITDA
After adjusting for the items noted in the table below, Adjusted EBITDA was $55.3 million for 2013 as compared to $43.6 million for 2012.
EBITDA and Adjusted EBITDA are non-GAAP measurements. We utilize these non-GAAP measurements as a means to measure overall operating performance and to better compare current operating results with other companies within our industry. Details of the excluded items and a reconciliation of the non-GAAP financial measures to the most comparable GAAP financial measure are presented in the table below. The non-GAAP measures do not replace the presentation of our GAAP financial results. We have provided this supplemental non-GAAP information because we believe it provides meaningful comparisons of the results of our operations for the periods presented. The non-GAAP measures are not in accordance with, or an alternative for, GAAP and may be different from non-GAAP measures used by some other companies.
|
(in thousands) |
||||||||
|
Year ended December 31, |
||||||||
|
2013 |
2012 |
|||||||
|
Net income |
$ | 19,438 | $ | 8,482 | ||||
|
Interest expense, net |
6,894 | 7,508 | ||||||
|
Provision for income taxes |
11,777 | 8,211 | ||||||
|
Depreciation and amortization |
14,872 | 15,023 | ||||||
|
EBITDA |
52,981 | 39,224 | ||||||
|
Asset impairment charge (a) |
492 | 2,506 | ||||||
|
Payments related to retirement of executive officers, net (b) |
1,277 | 1,293 | ||||||
|
Strategic alternatives costs (c) |
- | 593 | ||||||
|
Loss on extinguishment of debt (d) |
525 | - | ||||||
|
Adjusted EBITDA |
$ | 55,275 | $ | 43,616 | ||||
|
a) |
Impairment charges taken in 2013 related to Rio and in 2012 related to WCG. |
|
b) |
Represents payments related to the retirement or termination of certain executives and a key employee, net of benefit of forfeiture of stock based compensation upon their departure. |
|
c) |
Represents costs incurred related to our review of strategic alternatives arising from unsolicited proposals to take our company private. We terminated this review in June 2012 upon determining that a continued focus on our operations was the best alternative to maximize shareholder value. |
|
d) |
Represents a loss on extinguishment of debt resulting from the write-off of deferred financing fees related to our credit facility that was refinanced in full in August 2013. |
Seasonality
Our quarterly operating results and operating cash flows normally fluctuate as a result of seasonal variations in our business. Our NET Services operating segment experiences fluctuations in demand for its non-emergency transportation services during the summer, winter and holiday seasons. Due to higher demand in the summer months and lower demand in the winter and holiday seasons, coupled with a primarily fixed revenue stream based on a per member, per month payment structure, our NET Services operating segment normally experiences lower operating margins in the summer season and higher operating margins in the winter and holiday seasons.
In our Human Services operating segment, lower client demand for its home and community based services during the holiday and summer seasons generally results in lower revenue during those periods. However, our operating expenses related to the Human Services operating segment do not vary significantly with these changes. As a result, our Human Services operating segment typically experiences lower operating margins during the holiday and summer seasons.
In our HA Services operating segment, CHAs are typically provided as part of MA plan’s annual program and are conducted with an individual member once per year. Historically, there has been higher CHA volume in the second half of the calendar year as a result of an accelerating demand towards year-end.
Liquidity and capital resources
Short-term capital requirements consist primarily of recurring operating expenses and debt service requirements. We expect to meet these requirements through available cash on hand, the generation of cash from our operating segments and from our revolving credit facility.
Cash flow from financing activities was our primary source of cash in 2014. Our balance of cash and cash equivalents was approximately $160.4 million and $99.0 million at December 31, 2014 and 2013, respectively. Approximately $42.7 million of cash was held in foreign countries at December 31, 2014, and is not available to fund domestic operations unless the funds are repatriated. The repatriation of funds would be subject to certain taxes and fees that are prohibitive, and as such, we do not currently intend to repatriate funds held internationally. We had restricted cash of approximately $18.6 million and $15.7 million at December 31, 2014 and 2013, respectively, related to contractual obligations and activities of our captive insurance subsidiaries and other subsidiaries. At December 31, 2014 and 2013, our total debt was approximately $575.2 million and $123.5 million, respectively.
We may access capital markets to raise equity financing for various business reasons, including required debt payments and acquisitions. The timing, term, size, and pricing of any such financing will depend on investor interest and market conditions, and there can be no assurance that we will be able to obtain any such financing. In addition, with respect to required debt payments, our credit agreement requires us, subject to certain exceptions as set forth in the credit agreement, to prepay the outstanding loans in an aggregate amount equal to 100% of the net cash proceeds received from certain asset dispositions, debt issuances, insurance and casualty awards and other extraordinary receipts.
Year ended December 31, 2014
Cash flows
Operating activities. We generated net cash flows from operating activities of approximately $55.2 million for 2014. These cash flows included net income of approximately $20.3 million, and net non-cash items including depreciation, amortization, amortization of deferred financing costs and debt discount, provision for doubtful accounts, stock-based compensation, deferred income taxes and other items of approximately $44.3 million. The balance of the cash provided by operating activities is primarily due to the net effect of changes in other working capital items, including the following significant items:
|
● |
approximately $17.2 million due to the increase in accounts receivable primarily due to an increase in Human Services’ accounts receivable of approximately $10.9 million and an increase in NET Services’ accounts receivable of approximately $11.0 million; and |
|
● |
approximately $28.5 million due to the increase in accounts payable and accrued expenses primarily attributable to the timing of payments related to non-emergency transportation contract reimbursements and the accrual of contingent consideration liabilities. |
Investing activities. Net cash used in investing activities totaled approximately $443.4 million for 2014. Approximately $352.1 million of cash was paid in the acquisition of Matrix, approximately $55.1 million, net of cash acquired, was paid in the acquisition of Ingeus and approximately $9.8 million of cash was paid for two human services businesses acquired through asset purchase agreements in May and October, 2014. Additionally, approximately $23.2 million was used to purchase property and equipment to support the growth of our operations.
Financing activities. Net cash provided by financing activities totaled approximately $453.1 million for 2014. Under the Second Amendment to our credit facility, we borrowed $250.0 million under a term loan. Additionally, we borrowed $185.7 million from our revolving credit facility, and borrowed $65.5 million on an unsecured subordinated bridge note due to a related party. We also paid financing fees associated with the refinancing of our long-term debt of approximately $12.8 million. Cash provided by financing activities also included $11.0 million of cash received from employee stock option exercises.
Year ended December 31, 2013
Cash flows
Operating activities. We generated net cash flows from operating activities of approximately $55.2 million for 2013. These cash flows included net income of approximately $19.4 million, and net non-cash items including depreciation, amortization, amortization of deferred financing costs, loss on extinguishment of debt, provision for doubtful accounts, stock-based compensation, deferred income taxes, asset impairment charge and other items of approximately $19.1 million. The balance of the cash provided by operating activities is primarily due to the net effect of changes in other working capital items, including the following significant items:
|
● |
approximately $18.9 million due to the increase in accounts payable and accrued expenses primarily attributable to the timing of payments related to non-emergency transportation contract reimbursements; and |
|
● |
approximately $6.4 million related to the decrease in accrued purchased transportation primarily due to the termination of the two Wisconsin NET Services contracts effective July 31, 2013 and the transition to an administrative services only contract in Connecticut. |
Investing activities. Net cash used in investing activities totaled approximately $13.8 million for 2013. Approximately $10.2 million was used to purchase property and equipment to support the growth of our operations. Additionally, approximately $2.8 million of this amount related to an increase in restricted cash, which was primarily due to the annual insurance policy renewals and the opening of a trust account for our wholly-owned captive insurance subsidiary.
Financing activities. Net cash provided by financing activities totaled approximately $2.1 million for 2013. Under the amended and restated credit facility we entered into in August 2013, we borrowed $60.0 million under a term loan and $16.0 million from our revolving credit facility, and repaid approximately $82.5 million of existing long-term debt. We also paid financing fees associated with the refinancing of our long-term debt, of which approximately $0.3 million were expensed and approximately $1.8 million were deferred and are being amortized over the life of the credit facility. Cash provided by financing activities also included $11.2 million of cash received from employee stock option exercises and the related excess tax benefits.
Obligations and commitments
Convertible senior subordinated notes. On November 13, 2007, we issued $70.0 million in principal amount of Senior Notes, the proceeds of which were used to partially fund the cash portion of the purchase price paid by us to acquire Charter LCI Corporation and its subsidiaries, referred to as LogistiCare.
We paid interest at a rate of 6.5% per annum on the Senior Notes in cash semiannually in arrears on May 15 and November 15 of each year. The Senior Notes matured on May 15, 2014, and we repaid the balance of $47.5 million with cash on hand.
Credit facility. On August 2, 2013, we entered into an Amended and Restated Credit Agreement with Bank of America, N.A., as administrative agent, swing line lender and letter of credit issuer, SunTrust Bank, as syndication agent, Merrill Lynch, Pierce, Fenner & Smith Incorporated and SunTrust Robinson Humphrey, Inc., as joint lead arrangers and joint book managers and other lenders party thereto. The Amended and Restated Credit Agreement provided us with a senior secured credit facility, or the Credit Facility, in aggregate principal amount of $225.0 million, comprised of a $60.0 million term loan facility and a $165.0 million revolving credit facility. The Credit Facility includes sublimits for swingline loans and letters of credit in amounts of up to $10.0 million and $25.0 million, respectively. On August 2, 2013, we borrowed the entire amount available under the term loan facility and $16.0 million under our revolving credit facility and used the proceeds thereof to refinance certain of our existing indebtedness.
Under the Credit Facility we have an option to request an increase in the amount of the revolving credit facility and/or the term loan facility from time to time (on substantially the same terms as apply to the existing facilities) in an aggregate amount of up to $75.0 million with either additional commitments from lenders under the Amended and Restated Credit Agreement at such time or new commitments from financial institutions acceptable to the administrative agent in its reasonable discretion, so long as no default or event of default exists at the time of any such increase. We may not be able to access additional funds under this increase option as no lender is obligated to participate in any such increase under the Credit Facility.
The Credit Facility matures on August 2, 2018. We may prepay the Credit Facility in whole or in part, at any time without premium or penalty, subject to reimbursement of the lenders’ breakage and redeployment costs in connection with prepayments of London Interbank Offering Rate, or LIBOR, loans. The unutilized portion of the commitments under the Credit Facility may be irrevocably reduced or terminated by us at any time without penalty.
Our obligations under the Credit Facility are guaranteed by all of our present and future domestic subsidiaries, excluding certain domestic subsidiaries, which include our insurance captives and not-for-profit subsidiaries. Our obligations under, and each guarantor’s obligations under its guaranty of, the Credit Facility are secured by a first priority lien on substantially all of our respective assets, including a pledge of 100% of the issued and outstanding stock of our domestic subsidiaries and 65% of the issued and outstanding stock of our first tier foreign subsidiaries.
On May 28, 2014 we entered into the first amendment (the “First Amendment”) to our Credit Facility. The First Amendment provided for, among other things, an increase in the aggregate amount of the revolving credit facility from $165.0 million to $240.0 million and other modifications in connection with the consummation of the acquisition of Ingeus.
On October 23, 2014, we entered into the Second Amendment to the Amended and Restated Credit and Guaranty Agreement and Consent (the “Second Amendment”) to amend the Credit Facility to (i) add a new term loan tranche in aggregate principal amount of up to $250.0 million to partly finance the acquisition of Matrix, (ii) provide the consent of the required lenders to consummate the acquisition of Matrix, (iii) permit incurrence of additional debt (including the Note, described below) to fund the acquisition of Matrix, (iv) add an excess cash flow mandatory prepayment provision and (v) such other amendments which are beneficial to us and provide greater flexibility for our future operations.
Interest on the outstanding principal amount of the loans accrues, at our election, at a per annum rate equal to LIBOR, plus an applicable margin or the base rate plus an applicable margin. The applicable margin ranges from 2.25% to 3.25% in the case of LIBOR loans and 1.25% to 2.25% in the case of the base rate loans, in each case, based on our consolidated leverage ratio as defined in the Amended and Restated Credit Agreement. Interest on the loans is payable quarterly in arrears. The interest rate applied to our term loan at December 31, 2014 was 3.16%. In addition, we are obligated to pay a quarterly commitment fee based on a percentage of the unused portion of each lender’s commitment under the revolving credit facility and quarterly letter of credit fees based on a percentage of the maximum amount available to be drawn under each outstanding letter of credit. The commitment fee and letter of credit fee ranges from 0.25% to 0.50% and 2.25% to 3.25%, respectively, in each case, based on our consolidated leverage ratio.
The $60.0 million term loan is subject to quarterly amortization payments, commencing on December 31, 2014, so that the following percentages of the term loan outstanding on the closing date plus the principal amount of any term loans funded pursuant to the increase option are repaid as follows: 7.5% between December 31, 2014 and September 30, 2015, 10.0% between December 31, 2015 and September 30, 2016, 12.5% between December 31, 2016 and September 30, 2017, 11.25% between December 31, 2017 and June 30, 2018 and the remaining balance at maturity.
The $250.0 million term loan is subject to quarterly amortization payments, commencing on March 31, 2015, so that the following percentages of the term loan outstanding on the closing date plus the principal amount of any term loans funded pursuant to the increase option are repaid as follows: 5.625% between March 31, 2015 and September 30, 2015, 10.0% between December 31, 2015 and September 30, 2016, 12.5% between December 31, 2016 and September 30, 2017, 11.25% between December 31, 2017 and June 30, 2018 and the remaining balance at maturity.
The Credit Facility also requires us (subject to certain exceptions as set forth in the Amended and Restated Credit Agreement) to prepay the outstanding loans in an aggregate amount equal to 100% of the net cash proceeds received from certain asset dispositions, debt issuances, insurance and casualty awards and other extraordinary receipts.
The Amended and Restated Credit Agreement contains customary affirmative and negative covenants and events of default. The negative covenants include restrictions on our ability to, among other things, incur additional indebtedness, create liens, make investments, give guarantees, pay dividends, sell assets and merge and consolidate. We are subject to financial covenants, including consolidated net leverage and consolidated fixed charge covenants. We were in compliance with all covenants as of December 31, 2014.
We had $201.7 million of borrowings outstanding under the revolving credit facility as of December 31, 2014. $25.0 million of the revolving credit facility is available to collateralize certain letters of credit. As of December 31, 2014, there were seven letters of credit in the amount of approximately $8.0 million collateralized under the revolving credit facility. At December 31, 2014, our available credit under the revolving credit facility was $30.3 million.
We incurred fees of approximately $12.7 million to refinance our long-term debt during 2014. We have accounted for fees related to the refinancing of our long-term debt, as well as unamortized deferred financing fees related to the Senior Credit Facility, under ASC 470-50 – Debt Modifications and Extinguishments. As both credit facilities were loan syndications, and a number of lenders participated in both credit facilities, we evaluated the accounting for financing fees on a lender by lender basis. Of the total amount of fees incurred for the refinancing of debt, approximately $5.2 million was deferred as deferred financing fees or debt discount, and will be amortized over the life of the loans, approximately $4.5 million was deferred and fully expensed in the fourth quarter of 2014 in relation to bridge financing commitments and approximately $3.0 million was immediately expensed in 2014.
Unsecured subordinated bridge note. On October 23, 2014, we issued to Coliseum Capital Management, LLC and certain of its affiliates (“Coliseum”), a related party, a 14.0% Unsecured Subordinated Note in aggregate principal amount of $65.5 million (the “Note”). Interest from the issuance date to, but excluding, the 120th day after the issuance date, was paid in cash in the amount of $3.0 million on the issuance of the Note. Coliseum held approximately 15% of our outstanding common stock as of October 23, 2014 and is our largest shareholder. Additionally, Christopher Shackelton, who serves as our Chairman of the board of directors, is also a Managing Partner at Coliseum Capital Management, LLC.
The Note was repaid in full on February 11, 2015, with the proceeds from a registered Rights Offering (“Rights Offering”) and related standby purchase commitment described below, which allowed all of the Company’s existing common stock holders the non-transferrable right to purchase their pro rata share of $65.5 million of convertible preferred stock at a price of $100.00 per share, as further described below. As such, the Note was classified as a current liability at December 31, 2014.
Rights offering. We completed a Rights Offering, on February 5, 2015, allowing all of the Company’s existing common stock holders the non-transferrable right to purchase their pro rata share of $65.5 million of convertible preferred stock at a price equal to $100.00 per share. The convertible preferred stock is convertible into shares of our common stock at a conversion price equal to $39.88, which was the closing price of our common stock on the NASDAQ Global Select Market on October 22, 2014.
Stockholders exercised subscription rights to purchase 130,884 shares of the Company's convertible preferred stock. Pursuant to the terms and conditions of the Standby Purchase Agreement between Coliseum Capital Partners, L.P., Coliseum Capital Partners II, L.P., Coliseum Capital Co-Invest, L.P. and Blackwell Partners, LLC (collectively, the "Standby Purchasers") and the Company, the remaining 524,116 shares the Company's preferred stock was purchased by Standby Purchasers at the $100.00 per share subscription price. The Standby Purchasers beneficially own approximately 94% of our outstanding convertible preferred stock after giving effect to the Rights Offering and the Standby Purchase Agreement. The Company received $65.5 million in aggregate gross proceeds from the consummation of the Rights Offering and Standby Purchase Agreement, which it used to repay the related party unsecured subordinated bridge note discussed above.
Additionally, on March 12, 2015, the Standby Purchasers exercised their right to purchase an additional 150,000 shares of the Company’s convertible preferred stock.
We may pay a noncumulative cash dividend on each share of convertible preferred stock, when, as and if declared by our board of directors, at the rate of five and one-half percent (5.5%) per annum on the liquidation preference then in effect. Following the issue date of the convertible preferred stock, on or before the third business day immediately preceding each fiscal quarter, we will determine our intention whether or not to pay a cash dividend with respect to that ensuing quarter and will give notice of our intention to each holder of convertible preferred stock as soon as practicable thereafter.
In the event we do not declare and pay a cash dividend, the liquidation preference will be increased to an amount equal to the liquidation preference in effect at the start of the applicable dividend period, plus an amount equal to such then applicable liquidation preference multiplied by eight and one-half percent (8.5%) per annum, computed on the basis of a 365-day year and the actual number of days elapsed from the start of the applicable dividend period to the applicable date of determination.
Cash dividends will be payable quarterly in arrears on January 1, April 1, July 1 and October 1 of each year, commencing on the first calendar day of the first January, April, July or October following the date of original issuance of the convertible preferred stock, and, if declared, will begin to accrue on the first day of the applicable dividend period. Paid in kind (“PIK”) dividends, if applicable, will accrue and be cumulative on the same schedule as set forth above for cash dividends and will also be compounded at the applicable annual rate on each applicable subsequent dividend date. PIK dividends are paid upon the occurrence of a liquidation event, conversion or redemption in accordance with the terms of the convertible preferred stock.
Contingent obligations. Under The Providence Service Corporation Deferred Compensation Plan, as amended, or Deferred Compensation Plan, eligible employees and independent contractors of a participating employer (as defined in the Deferred Compensation Plan) may defer all or a portion of their base salary, service bonus, performance-based compensation earned in a period of 12 months or more, commissions and, in the case of independent contractors, compensation reportable on Form 1099. The Deferred Compensation Plan is unfunded and benefits are paid from our general assets. We also maintain a 409(A) Deferred Compensation Rabbi Trust Plan for highly compensated employees of our NET Services operating segment. Benefits are paid from our general assets under this plan.
Reinsurance and Self-Funded Insurance Programs
Reinsurance
We reinsure a substantial portion of our NET Services’ and Human Services’ automobile, general and professional liability and workers’ compensation costs under reinsurance programs through Social Services Providers Captive Insurance Company (“SPCIC”), a wholly owned subsidiary of the Company. Historically, we also provided reinsurance for policies written by a third party insurer for general liability, automobile liability, and automobile physical damage coverage to certain members of the network of subcontracted transportation providers and independent third parties under our NET Services operating segment through Provado. While Provado did not renew its insurance agreement in February 2011 and no longer assumes liabilities for new policies, it will continue to administer existing policies for the foreseeable future and resolve remaining and future claims related to those policies. Provado is a licensed captive insurance company domiciled in the State of South Carolina. The decision to reinsure our risks and provide a self-funded health insurance program to our employees was made based on current conditions in the insurance marketplace that have led to increasingly higher levels of self-insurance retentions, increasing number of coverage limitations, and fluctuating insurance premium rates.
SPCIC:
SPCIC, which is a licensed captive insurance company domiciled in the State of Arizona, reinsures third-party insurers for general and professional liability exposures for the first dollar of each and every loss up to $1.0 million per loss and $5.0 million in the aggregate. At December 31, 2014, the cumulative reserve for expected losses since inception in 2005 of this reinsurance program was approximately $2.8 million. The excess premium over our expected losses may be used to fund SPCIC’s operating expenses, fund any deficit arising in automobile and workers’ compensation liability coverage, provide for surplus reserves, and fund any other risk management activities.
SPCIC reinsures a third-party insurer for worker’s compensation insurance for the first dollar of each and every loss up to $0.5 million per occurrence with a $13.7 million annual policy aggregate limit. The cumulative reserve for expected losses since inception in 2005 of this reinsurance program at December 31, 2014 was approximately $9.1 million.
SPCIC also reinsures a third-party insurer for automobile liability exposures for approximately $250 thousand per claim. The cumulative reserve for expected losses since inception in 2013 of this reinsurance program at December 31, 2014 was approximately $0.9 million.
Based on an independent actuarial report, our expected losses related to workers’ compensation, automobile and general and professional liability in excess of our liability under our associated reinsurance programs at December 31, 2014 was approximately $5.5 million. We recorded a corresponding receivable from third-party insurers and liability at December 31, 2014 for these expected losses, which would be paid by third-party insurers to the extent losses are incurred. We have an umbrella liability insurance policy providing additional coverage in the amount of $25.0 million in the aggregate in excess of the policy limits of the general and professional liability insurance policy and automobile liability insurance policy.
SPCIC had restricted cash of approximately $17.5 million and $13.9 million at December 31, 2014 and 2013, respectively, which was restricted to secure the reinsured claims losses of SPCIC under the automobile, general and professional liability and workers’ compensation reinsurance programs. The full extent of claims may not be fully determined for years. Therefore, the estimates of potential obligations are based on recommendations of an independent actuary using historical data, industry data, and our claims experience.
Provado:
Under a reinsurance agreement with a third party insurer, Provado reinsures the third party insurer for the first $250 thousand of each loss for each line of coverage, subject to an annual aggregate equal to 107.7% of gross written premium, and certain claims in excess of $250 thousand to an additional aggregate limit of $1.1 million. The cumulative reserve for expected losses of this reinsurance program at December 31, 2014 was approximately $1.4 million. As noted above, effective February 15, 2011, Provado did not renew its reinsurance agreement and will not assume liabilities for policies after that date. It will continue to administer existing policies for the foreseeable future and resolve remaining and future claims related to these policies.
The liabilities for expected losses and loss adjustment expenses are based primarily on individual case estimates for losses reported by claimants. An estimate is provided for losses and loss adjustment expenses incurred but not reported on the basis of our claims experience and claims experience of the industry. These estimates are reviewed at least annually by independent consulting actuaries. As experience develops and new information becomes known, the estimates are adjusted.
Providence Liability Insurance Coverages
The decision to reinsure our risks and provide a self-funded health insurance program to our employees was made based on current conditions in the insurance marketplace that have led to increasingly higher levels of self-insurance retentions, increasing number of coverage limitations, and fluctuating insurance premium rates. Certain changes are made periodically to our insurance coverage which we believe balances our costs and risks in an appropriate manner. While we are insured for the types of claims discussed above, damages exceeding our insurance limits or outside our insurance coverage, such as a claim for fraud or punitive damages, could adversely affect our cash flow and financial condition.
Health Insurance
We offer our NET Services’ and Human Services’ employees an option to participate in a self-funded health insurance program. As of December 31, 2014, health claims were self-funded with a stop-loss umbrella policy with a third party insurer to limit the maximum potential liability for individual claims to $275 thousand per person and for a maximum potential claim liability based on member enrollment.
Health insurance claims are paid as they are submitted to the plan administrator. We maintain accruals for claims that have been incurred but not yet reported to the plan administrator, and therefore, have not been paid. The incurred but not reported reserve is based on an established cap and current payment trends of health insurance claims. The liability for the self-funded health plan of approximately $2.0 million and $1.9 million as of December 31, 2014 and 2013, respectively, was recorded in “Reinsurance liability reserve” in our consolidated balance sheets.
We charge our employees a portion of the costs of our self-funded group health insurance programs. We determine this charge at the beginning of each plan year based upon historical and projected medical utilization data. Any difference between our projections and our actual experience is borne by us. We estimate potential obligations for liabilities under this program to reserve what we believe to be a sufficient amount to cover liabilities based on our past experience. Any significant increase in the number of claims or costs associated with claims made under this program above what we reserve could have a material adverse effect on our financial results.
Contractual cash obligations.
The following is a summary of our future contractual cash obligations as of December 31, 2014:
|
At December 31, 2014 |
||||||||||||||||||||
|
Less than |
1-3 | 3-5 |
After 5 |
|||||||||||||||||
|
Contractual cash obligations (000's) |
Total |
1 Year |
Years |
Years |
Years |
|||||||||||||||
|
Debt |
$ | 576,675 | $ | 90,688 | $ | 74,225 | $ | 411,762 | $ | - | ||||||||||
|
Interest (1) |
55,317 | 16,480 | 30,007 | 8,830 | - | |||||||||||||||
|
Purchased services commitments |
82 | 74 | 8 | - | - | |||||||||||||||
|
Operating Leases |
84,564 | 28,628 | 35,407 | 13,016 | 7,513 | |||||||||||||||
|
Total |
$ | 716,638 | $ | 135,870 | $ | 139,647 | $ | 433,608 | $ | 7,513 | ||||||||||
|
(1) |
Future interest payments have been calculated at the current rates as of December 31, 2014. |
Stock repurchase program
In 2012, we spent approximately $3.5 million to repurchase 293,600 shares of our common stock in the open market under a stock repurchase program approved by our board of directors on February 1, 2007. Under this stock repurchase program we may repurchase up to one million shares of our common stock from time to time on the open market or in privately negotiated transactions, depending on market conditions and our capital requirements. Since inception, we have spent approximately $14.4 million to purchase 756,100 shares of our common stock on the open market. We did not purchase shares of our common stock during the period 2008 through 2011 or during 2013 and 2014 under this plan.
Off-balance sheet arrangements
As of December 31, 2014 and 2013, we did not have any relationships with unconsolidated entities or financial partnerships, such as entities referred to as structured finance or special purpose entities, which would have been established for the purpose of facilitating off-balance sheet arrangements or other contractually narrow or limited purposes.
New Accounting Pronouncements
In April 2014, the FASB issued Accounting Standards Update (“ASU”) No. 2014-08, Presentation of Financial Statements (Topic 2015) and Property, Plant, and Equipment (Topic 360): Reporting Discontinued Operations and Disclosures of Disposals of Components of an Entity (“ASU 2014-08”). ASU 2014-08 changes the requirements for reporting discontinued operations. Under the ASU discontinued operations is defined as either a:
|
● |
Component of an entity, or group of components that |
|
o |
has been disposed of, meets the criteria to be classified as held-for-sale, or has been abandoned/spun-off; and |
|
o |
represents a strategic shift that has (or will have a major effect on an entity’s operations and financial results), or |
|
● |
Business or nonprofit activity that, on acquisition, meets the criteria to be classified as held-for-sale. |
This ASU is effective for publicly held companies prospectively for all disposals (or classifications as held for sale) of components of an entity that occur within annual periods beginning on or after December 15, 2014, and interim periods within those years, and all businesses that, on acquisition, are classified as held for sale that occur within annual periods beginning on or after December 15, 2014, and interim periods within those years. We will prospectively apply this accounting literature in 2015. We do not believe the adoption of ASU 2014-08 will have a material impact on our consolidated financial statements.
In May 2014, the FASB issued ASU No. 2014-09, Revenue from Contracts with Customers: Topic 606 (“ASU 2014-09”). This ASU will supersede the revenue recognition requirements in Topic 605, Revenue Recognition, and most industry-specific guidance. The core principle of the guidance is that an entity should recognize revenue to depict the transfer of promised goods or services to customers in an amount that reflects the consideration to which the entity expects to be entitled in exchange for those goods or services. To achieve that core principle, an entity should apply the following steps:
|
|
● |
Step 1: Identify the contract(s) with a customer. |
||||
|
|
● |
Step 2: Identify the performance obligations in the contract. |
||||
|
|
● |
Step 3: Determine the transaction price. |
||||
|
|
● |
Step 4: Allocate the transaction price to the performance obligations in the contract. |
||||
|
|
● |
Step 5: Recognize revenue when (or as) the entity satisfies a performance obligation. | ||||
For a publicly held entity, this ASU is effective for annual reporting periods beginning after December 15, 2016, including interim periods within that reporting period. Early application is not permitted. We are currently evaluating the impact ASU 2014-09 will have on our consolidated financial statements.
Forward-Looking Statements
Certain statements contained in this report on Form 10-K, such as any statements about our confidence or strategies or our expectations about revenues, liabilities, results of operations, cash flows, ability to fund operations, profitability, ability to meet financial covenants, contracts or market opportunities, constitute forward-looking statements within the meaning of section 27A of the Securities Act of 1933 and section 21E of the Securities Exchange Act of 1934. These forward-looking statements are based on our current expectations, assumptions, estimates and projections about our business and our industry. You can identify forward-looking statements by the use of words such as “may,” “should,” “will,” “could,” “estimates,” “predicts,” “potential,” “continue,” “anticipates,” “believes,” “plans,” “expects,” “future,” and “intends” and similar expressions which are intended to identify forward-looking statements.
The forward-looking statements contained herein are not guarantees of our future performance and are subject to a number of known and unknown risks, uncertainties and other factors, some of which are beyond our control and difficult to predict and could cause our actual results or achievements to differ materially from those expressed, implied or forecasted in the forward-looking statements. These risks and uncertainties include, but are not limited to the risks described under Part I Item 1A of this report.
All forward-looking statements attributable to us or persons acting on our behalf are expressly qualified in their entirety by the cautionary statements contained above and throughout this report. You are cautioned not to place undue reliance on these forward-looking statements, which speak only as of the date the statement was made. We do not intend to update publicly any forward-looking statements, whether as a result of new information, future events or otherwise.
|
Item 7A. |
Quantitative and Qualitative Disclosures About Market Risk. |
Foreign currency risk
As of December 31, 2014, we conducted business in 11 countries outside the US. As such, our cash flows and earnings are subject to fluctuations from changes in foreign currency exchange rates. We do not currently hedge against the possible impact of currency fluctuations. For 2014, we used 11 functional currencies and generated approximately $190.5 million of our net operating revenues from operations outside the US. As we expand further into international markets, we expect the risk from foreign currency exchange rates to increase.
A 10% adverse change in the foreign currency exchange rate from Great British Pounds to US Dollars would have a $13.9 million impact on revenue, but would not significantly impact net income. A 10% adverse change in other foreign currency exchange rates would not have a significant impact on the Company.
Interest rate and market risk
As of December 31, 2014, we had borrowings under our term loans of $308.9 million and borrowings under our revolving line of credit of $201.7 million. Borrowings under the Credit Agreement accrued interest at LIBOR plus 3.00% per annum as of December 31, 2014. An increase of 1% in the LIBOR rate would cause an increase in interest expense of up to $17.0 million over the remaining term of the Amended and Restated Credit Agreement, which expires in 2018.
We assess the significance of interest rate market risk on a periodic basis and may implement strategies to manage such risk as we deem appropriate.
|
Item 8. |
Financial Statements and Supplementary Data. |
INDEX TO CONSOLIDATED FINANCIAL STATEMENTS
|
Management’s Report on Internal Control Over Financial Reporting |
71 |
|
Reports of Independent Registered Public Accounting Firm |
73 |
|
Consolidated Balance Sheets at December 31, 2014 and 2013 |
76 |
|
For the years ended December 31, 2014, 2013 and 2012: |
|
|
Consolidated Statements of Income |
77 |
|
Consolidated Statements of Comprehensive Income |
78 |
|
Consolidated Statements of Stockholders’ Equity |
79 |
|
Consolidated Statements of Cash Flows |
80 |
|
Notes to Consolidated Financial Statements |
82 |
Management’s Report on Internal Control Over Financial Reporting
Our management has the responsibility for establishing and maintaining adequate internal control over financial reporting for the registrant, as such term is defined in the Securities Exchange Act of 1934 Rule 13a-15(f). Under the supervision and with the participation of our principal executive officer and principal financial officer, we conducted an assessment, as of December 31, 2014, of the effectiveness of our internal control over financial reporting based on the criteria set forth by the Committee of Sponsoring Organizations of the Treadway Commission in Internal Control–Integrated Framework (1992).
We designed our internal control over financial reporting to provide reasonable assurance regarding the reliability of financial reporting and the preparation of financial statements for external purposes in accordance with generally accepted accounting principles. Our internal control over financial reporting includes those policies and procedures that (1) pertain to the maintenance of records that, in reasonable detail, accurately and fairly reflect the transactions and dispositions of the assets of the company; (2) provide reasonable assurance that transactions are recorded as necessary to permit preparation of financial statements in accordance with generally accepted accounting principles, and that receipts and expenditures of the company are being made only in accordance with authorizations of management and directors of the company; and (3) provide reasonable assurance regarding prevention or timely detection of unauthorized acquisition, use, or disposition of the company’s assets that could have a material effect on the financial statements.
All internal control systems, no matter how well designed, have inherent limitations. Therefore, even those systems determined to be effective can provide only reasonable assurance with respect to financial statement preparation and presentation. Also, projections of any evaluation of effectiveness to future periods are subject to the risk that controls may become inadequate because of changes in conditions, or that the degree of compliance with the policies or procedures may deteriorate.
We completed the following acquisitions in 2014, which we excluded from the evaluation of the effectiveness of our internal control over financial reporting.
|
|
||
|
Acquired entity |
|
Date of acquisition |
| Ingeus Limited | May 30, 2014 | |
| CCHN Group Holdings, Inc. | October 23, 2014 |
The following table highlights the significance of the acquisitions completed in 2014 to our consolidated financial statements at December 31, 2014 (in thousands):
|
Period from date of acquisition to December 31, 2014 |
|||||||||
|
Assets |
Revenue |
||||||||
|
Ingeus Limited |
$ | 84,089 | $ | 179,307 | |||||
|
CCHN Group Holdings, Inc. |
53,204 | 43,331 | |||||||
|
Total of all acquisitions completed in 2014 excluded from the evaluation of the effectiveness of internal control over financial reporting |
$ | 137,293 | $ | 222,638 | |||||
|
The Providence Service Corporation (“PRSC”) |
$ | 1,165,245 | $ | 1,481,171 | |||||
|
Percentage of PRSC |
11.8 | % | 15.0 | % | |||||
We are currently integrating these acquisitions into our internal control over financial reporting processes. In executing this integration, we are analyzing, evaluating and, where necessary, making changes in controls and procedures related to these acquisitions, which we expect to be completed in fiscal year 2015. We have excluded these acquisitions from our assessment of internal control over financial reporting as of December 31, 2014, as permitted by guidance provided by the staff of the SEC. Other than the changes described above, there were no changes in our internal control over financial reporting during the fiscal quarter ending December 31, 2014 that have materially affected, or are reasonably likely to materially affect, our internal control over financial reporting.
Based on our assessment, we concluded our internal control over financial reporting is effective as of December 31, 2014.
KPMG LLP, an independent registered public accounting firm, which audited our consolidated financial statements included in this report on Form 10-K has issued an audit report on the effectiveness of our internal control over financial reporting. KPMG LLP’s audit report is also included in this report on Form 10-K.
Report of Independent Registered Public Accounting Firm
The Board of Directors and Stockholders
The Providence Service Corporation:
We have audited The Providence Service Corporation’s (the Company) internal control over financial reporting as of December 31, 2014, based on criteria established in Internal Control – Integrated Framework (1992) issued by the Committee of Sponsoring Organizations of the Treadway Commission (COSO). The Company’s management is responsible for maintaining effective internal control over financial reporting and for its assessment of the effectiveness of internal control over financial reporting, included in the accompanying Management’s Annual Report on Internal Control over Financial Reporting. Our responsibility is to express an opinion on the Company’s internal control over financial reporting based on our audit.
We conducted our audit in accordance with the standards of the Public Company Accounting Oversight Board (United States). Those standards require that we plan and perform the audit to obtain reasonable assurance about whether effective internal control over financial reporting was maintained in all material respects. Our audit included obtaining an understanding of internal control over financial reporting, assessing the risk that a material weakness exists, and testing and evaluating the design and operating effectiveness of internal control based on the assessed risk. Our audit also included performing such other procedures as we considered necessary in the circumstances. We believe that our audit provides a reasonable basis for our opinion.
A company’s internal control over financial reporting is a process designed to provide reasonable assurance regarding the reliability of financial reporting and the preparation of financial statements for external purposes in accordance with generally accepted accounting principles. A company’s internal control over financial reporting includes those policies and procedures that (1) pertain to the maintenance of records that, in reasonable detail, accurately and fairly reflect the transactions and dispositions of the assets of the company; (2) provide reasonable assurance that transactions are recorded as necessary to permit preparation of financial statements in accordance with generally accepted accounting principles, and that receipts and expenditures of the company are being made only in accordance with authorizations of management and directors of the company; and (3) provide reasonable assurance regarding prevention or timely detection of unauthorized acquisition, use, or disposition of the company’s assets that could have a material effect on the financial statements.
Because of its inherent limitations, internal control over financial reporting may not prevent or detect misstatements. Also, projections of any evaluation of effectiveness to future periods are subject to the risk that controls may become inadequate because of changes in conditions, or that the degree of compliance with the policies or procedures may deteriorate.
In our opinion, The Providence Service Corporation maintained, in all material respects, effective internal control over financial reporting as of December 31, 2014, based on criteria established in Internal Control – Integrated Framework (1992) issued by COSO.
The Company acquired Ingeus Limited and subsidiaries (Ingeus) and CCHN Group Holdings, Inc. and subsidiaries (Matrix) during 2014 and management excluded from its assessment of the effectiveness of the Company’s internal control over financial reporting as of December 31, 2014, Ingeus’ internal control over financial reporting associated with total assets of $84.1 million and total revenues of $179.3 million and Matrix’s internal control over financial reporting associated with total assets of $53.2 million and total revenues of $43.3 million included in the consolidated financial statements of The Providence Service Corporation and subsidiaries as of and for the year ended December 31, 2014. Our audit of internal control over financial reporting of The Providence Service Corporation also excluded an evaluation of the internal control over financial reporting of Ingeus and Matrix.
We also have audited, in accordance with the standards of the Public Company Accounting Oversight Board (United States), the consolidated balance sheets of The Providence Service Corporation and subsidiaries as of December 31, 2014 and 2013, and the related consolidated statements of income, comprehensive income, stockholders’ equity, and cash flows for each of the years in the three-year period ended December 31, 2014, and the related financial statement schedule, and our report dated March 16, 2015 expressed an unqualified opinion on those consolidated financial statements.
/s/ KPMG LLP
Phoenix, Arizona
March 16, 2015
Report of Independent Registered Public Accounting Firm
The Board of Directors and Stockholders
The Providence Service Corporation:
We have audited the accompanying consolidated balance sheets of The Providence Service Corporation and subsidiaries (the Company) as of December 31, 2014 and 2013, and the related consolidated statements of income, comprehensive income, stockholders’ equity, and cash flows for each of the years in the three-year period ended December 31, 2014. In connection with our audits of the consolidated financial statements, we also have audited the financial statement schedule in Item 15(a)(2). These consolidated financial statements and the financial statement schedule are the responsibility of the Company’s management. Our responsibility is to express an opinion on these consolidated financial statements and financial statement schedule based on our audits.
We conducted our audits in accordance with the standards of the Public Company Accounting Oversight Board (United States). Those standards require that we plan and perform the audit to obtain reasonable assurance about whether the financial statements are free of material misstatement. An audit includes examining, on a test basis, evidence supporting the amounts and disclosures in the financial statements. An audit also includes assessing the accounting principles used and significant estimates made by management, as well as evaluating the overall financial statement presentation. We believe that our audits provide a reasonable basis for our opinion.
In our opinion, the consolidated financial statements referred to above present fairly, in all material respects, the financial position of The Providence Service Corporation and subsidiaries as of December 31, 2014 and 2013, and the results of their operations and their cash flows for each of the years in the three-year period ended December 31, 2014, in conformity with U.S. generally accepted accounting principles. Also in our opinion, the related financial statement schedule, when considered in relation to the basic consolidated financial statements taken as a whole, presents fairly, in all material respects, the information set forth therein.
We also have audited, in accordance with the standards of the Public Company Accounting Oversight Board (United States), the Company’s internal control over financial reporting as of December 31, 2014, based on criteria established in Internal Control – Integrated Framework (1992) issued by the Committee of Sponsoring Organizations of the Treadway Commission (COSO), and our report dated March 16, 2015 expressed an unqualified opinion on the effectiveness of the Company’s internal control over financial reporting.
/s/ KPMG LLP
Phoenix, Arizona
March 16, 2015
The Providence Service Corporation
Consolidated Balance Sheets
(in thousands except share and per share data)
|
December 31, |
||||||||
|
2014 |
2013 |
|||||||
|
Assets |
||||||||
|
Current assets: |
||||||||
|
Cash and cash equivalents |
$ | 160,406 | $ | 98,995 | ||||
|
Accounts receivable, net of allowance of $6,034 in 2014 and $4,218 in 2013 |
151,344 | 88,315 | ||||||
|
Other receivables |
6,866 | 6,607 | ||||||
|
Prepaid expenses and other |
46,157 | 11,831 | ||||||
|
Restricted cash |
3,807 | 3,772 | ||||||
|
Deferred tax assets |
6,066 | 2,152 | ||||||
|
Total current assets |
374,646 | 211,672 | ||||||
|
Property and equipment, net |
57,148 | 32,709 | ||||||
|
Goodwill |
355,641 | 113,263 | ||||||
|
Intangible assets, net |
340,673 | 43,476 | ||||||
|
Other assets |
22,373 | 11,681 | ||||||
|
Restricted cash, less current portion |
14,764 | 11,957 | ||||||
|
Total assets |
$ | 1,165,245 | $ | 424,758 | ||||
|
Liabilities and stockholders' equity |
||||||||
|
Current liabilities: |
||||||||
|
Current portion of long-term obligations |
$ | 25,188 | $ | 48,250 | ||||
|
Note payable to related party |
65,500 | - | ||||||
|
Accounts payable |
48,061 | 3,904 | ||||||
|
Accrued expenses |
121,857 | 52,484 | ||||||
|
Accrued transportation costs |
55,492 | 54,962 | ||||||
|
Deferred revenue |
12,245 | 3,687 | ||||||
|
Reinsurance liability reserve |
11,115 | 10,778 | ||||||
|
Total current liabilities |
339,458 | 174,065 | ||||||
|
Long-term obligations, less current portion |
484,525 | 75,250 | ||||||
|
Other long-term liabilities |
26,609 | 15,359 | ||||||
|
Deferred tax liabilities |
93,239 | 9,447 | ||||||
|
Total liabilities |
943,831 | 274,121 | ||||||
|
Commitments and contingencies (Notes 13 and 16) |
||||||||
|
Stockholders' equity |
||||||||
|
Preferred stock: Authorized 10,000,000 shares; $0.001 par value; none issued and outstanding |
- | - | ||||||
|
Common stock: authorized 40,000,000 shares; $0.001 par value; 16,870,285 and 14,477,312 issued and outstanding (including treasury shares) |
17 | 14 | ||||||
|
Additional paid-in capital |
261,155 | 194,363 | ||||||
|
Accumulated deficit |
(13,366 | ) | (33,641 | ) | ||||
|
Accumulated other comprehensive loss, net of tax |
(8,756 | ) | (1,419 | ) | ||||
|
Treasury shares, at cost, 1,014,108 and 956,442 shares |
(17,686 | ) | (15,641 | ) | ||||
|
Total Providence stockholders' equity |
221,364 | 143,676 | ||||||
|
Non-controlling interest |
50 | 6,961 | ||||||
|
Total stockholders' equity |
221,414 | 150,637 | ||||||
| Total liabilities and stockholders' equity | $ | 1,165,245 | $ | 424,758 | ||||
See accompanying notes to the consolidated financial statements
The Providence Service Corporation
Consolidated Statements of Income
(in thousands except share and per share data)
|
Year ended December 31, |
||||||||||||
|
2014 |
2013 |
2012 |
||||||||||
|
Service revenue |
$ | 1,481,171 | $ | 1,122,682 | $ | 1,105,889 | ||||||
|
Operating expenses: |
||||||||||||
|
Service expense |
1,338,793 | 1,020,051 | 1,010,776 | |||||||||
|
General and administrative expense |
63,635 | 48,633 | 53,383 | |||||||||
|
Depreciation and amortization |
29,488 | 14,872 | 15,023 | |||||||||
|
Asset impairment charge |
6,915 | 492 | 2,506 | |||||||||
|
Total operating expenses |
1,438,831 | 1,084,048 | 1,081,688 | |||||||||
|
Operating income |
42,340 | 38,634 | 24,201 | |||||||||
|
Other expense: |
||||||||||||
|
Interest expense, net |
14,600 | 6,894 | 7,508 | |||||||||
|
Loss on extinguishment of debt |
- | 525 | - | |||||||||
|
Gain on foreign currency translation |
(37 | ) | - | - | ||||||||
|
Income before income taxes |
27,777 | 31,215 | 16,693 | |||||||||
|
Provision for income taxes |
7,502 | 11,777 | 8,211 | |||||||||
|
Net income |
$ | 20,275 | $ | 19,438 | $ | 8,482 | ||||||
|
Earnings per common share: |
||||||||||||
|
Basic |
$ | 1.37 | $ | 1.44 | $ | 0.64 | ||||||
|
Diluted |
$ | 1.35 | $ | 1.41 | $ | 0.64 | ||||||
|
Weighted-average number of common shares outstanding: |
||||||||||||
|
Basic |
14,765,303 | 13,499,885 | 13,225,448 | |||||||||
|
Diluted |
15,018,561 | 13,809,874 | 13,354,613 | |||||||||
See accompanying notes to the consolidated financial statements
The Providence Service Corporation
Consolidated Statements of Comprehensive Income
(in thousands)
|
Year ended December 31, |
||||||||||||
|
2014 |
2013 |
2012 |
||||||||||
|
Net income |
$ | 20,275 | $ | 19,438 | $ | 8,482 | ||||||
|
Other comprehensive income (loss): |
||||||||||||
|
Foreign currency translation adjustments, net of tax |
(7,337 | ) | (526 | ) | 235 | |||||||
|
Other comprehensive income (loss) |
(7,337 | ) | (526 | ) | 235 | |||||||
|
Comprehensive income |
$ | 12,938 | $ | 18,912 | $ | 8,717 | ||||||
See accompanying notes to the consolidated financial statements
The Providence Service Corporation
Consolidated Statements of Stockholders' Equity
(in thousands except share data)
|
Common Stock |
Additional Paid-In |
Accumulated |
Accumulated Other Comprehensive Income |
Treasury Stock |
Non- Controlling |
|||||||||||||||||||||||||||||||
|
Shares |
Amount |
Capital |
Deficit |
(Loss) |
Shares |
Amount |
Interest |
Total |
||||||||||||||||||||||||||||
|
Balance at December 31, 2011 |
13,621,951 | 14 | 176,172 | (61,561 | ) | (1,128 | ) | 623,576 | (11,435 | ) | 6,961 | 109,023 | ||||||||||||||||||||||||
|
Stock-based compensation |
- | - | 3,873 | - | - | - | - | - | 3,873 | |||||||||||||||||||||||||||
|
Exercise of employee stock options, including net tax shortfall of $215 |
90,915 | - | 733 | - | - | - | - | - | 733 | |||||||||||||||||||||||||||
|
Restricted stock issued |
73,081 | - | - | - | - | 11,302 | (169 | ) | - | (169 | ) | |||||||||||||||||||||||||
|
Stock repurchase |
- | - | - | - | - | 293,600 | (3,490 | ) | - | (3,490 | ) | |||||||||||||||||||||||||
|
Foreign currency translation adjustments |
- | - | - | - | 235 | - | - | - | 235 | |||||||||||||||||||||||||||
|
Net income |
- | - | - | 8,482 | - | - | - | - | 8,482 | |||||||||||||||||||||||||||
|
Balance at December 31, 2012 |
13,785,947 | 14 | 180,778 | (53,079 | ) | (893 | ) | 928,478 | (15,094 | ) | 6,961 | 118,687 | ||||||||||||||||||||||||
|
Stock-based compensation |
- | - | 3,079 | - | - | - | - | - | 3,079 | |||||||||||||||||||||||||||
|
Exercise of employee stock options, including net tax benefit of $437 |
592,126 | - | 10,506 | - | - | - | - | - | 10,506 | |||||||||||||||||||||||||||
|
Restricted stock issued |
99,239 | - | - | - | 27,964 | (547 | ) | - | (547 | ) | ||||||||||||||||||||||||||
|
Foreign currency translation adjustments |
- | - | - | - | (526 | ) | - | - | - | (526 | ) | |||||||||||||||||||||||||
|
Net income |
- | - | - | 19,438 | - | - | - | - | 19,438 | |||||||||||||||||||||||||||
|
Balance at December 31, 2013 |
14,477,312 | 14 | 194,363 | (33,641 | ) | (1,419 | ) | 956,442 | (15,641 | ) | 6,961 | 150,637 | ||||||||||||||||||||||||
|
Stock-based compensation |
- | - | 7,562 | - | - | - | - | - | 7,562 | |||||||||||||||||||||||||||
|
Exercise of employee stock options, including net tax benefit of $2,683 |
512,927 | - | 13,702 | - | - | - | - | - | 13,702 | |||||||||||||||||||||||||||
|
Restricted stock issued |
74,714 | - | - | - | - | 18,504 | (524 | ) | - | (524 | ) | |||||||||||||||||||||||||
|
PSC of Canada Exchange Corp. shares exchanged |
261,694 | 1 | 6,960 | - | - | 39,162 | (1,521 | ) | (6,961 | ) | (1,521 | ) | ||||||||||||||||||||||||
|
Restricted shares issued related to Ingeus acquisition, unvested |
596,915 | 1 | (1 | ) | - | - | - | - | - | - | ||||||||||||||||||||||||||
|
Restricted shares issued related to Matrix acquisition, unvested |
946,723 | 1 | 38,569 | - | - | - | - | - | 38,570 | |||||||||||||||||||||||||||
|
Other |
- | - | - | - | - | - | - | 50 | 50 | |||||||||||||||||||||||||||
|
Foreign currency translation adjustments |
- | - | - | - | (7,337 | ) | - | - | - | (7,337 | ) | |||||||||||||||||||||||||
|
Net income |
- | - | - | 20,275 | - | - | - | - | 20,275 | |||||||||||||||||||||||||||
|
Balance at December 31, 2014 |
16,870,285 | 17 | 261,155 | (13,366 | ) | (8,756 | ) | 1,014,108 | (17,686 | ) | 50 | 221,414 | ||||||||||||||||||||||||
See accompanying notes to the consolidated financial statements
The Providence Service Corporation
Consolidated Statements of Cash Flows
(in thousands)
|
Year ended December 31, |
||||||||||||
|
2014 |
2013 |
2012 |
||||||||||
|
Operating activities |
||||||||||||
|
Net income |
$ | 20,275 | $ | 19,438 | $ | 8,482 | ||||||
|
Adjustments to reconcile net income to net cash provided by operating activities: |
||||||||||||
|
Depreciation |
14,051 | 7,738 | 7,537 | |||||||||
|
Amortization |
15,437 | 7,134 | 7,486 | |||||||||
|
Provision for doubtful accounts |
2,589 | 3,245 | 2,305 | |||||||||
|
Stock based compensation |
7,562 | 3,079 | 3,873 | |||||||||
|
Deferred income taxes |
(5,208 | ) | (3,282 | ) | (816 | ) | ||||||
|
Amortization of deferred financing costs and debt discount |
5,561 | 960 | 1,138 | |||||||||
|
Loss on extinguishment of debt |
- | 525 | - | |||||||||
|
Excess tax benefit upon exercise of stock options |
(2,722 | ) | (1,120 | ) | (91 | ) | ||||||
|
Gains on remeasurement of contingent consideration |
(16,314 | ) | - | - | ||||||||
|
Asset impairment charge |
6,915 | 492 | 2,506 | |||||||||
|
Other non-cash charges |
3,088 | 364 | 158 | |||||||||
|
Changes in operating assets and liabilities, net of effects of acquisitions: |
||||||||||||
|
Accounts receivable |
(17,208 | ) | 7,186 | (16,589 | ) | |||||||
|
Other receivables |
327 | 1,199 | 556 | |||||||||
|
Restricted cash |
266 | (141 | ) | 163 | ||||||||
|
Prepaid expenses and other |
(7,954 | ) | (856 | ) | 256 | |||||||
|
Reinsurance liability reserve |
3,761 | (19 | ) | 1,034 | ||||||||
|
Accounts payable and accrued expenses |
28,483 | 18,863 | 2,412 | |||||||||
|
Accrued transportation costs |
530 | (6,354 | ) | 13,660 | ||||||||
|
Deferred revenue |
(3,454 | ) | (3,366 | ) | 4,862 | |||||||
|
Other long-term liabilities |
(790 | ) | 152 | 3,556 | ||||||||
|
Net cash provided by operating activities |
55,195 | 55,237 | 42,488 | |||||||||
|
Investing activities |
||||||||||||
|
Purchase of property and equipment |
(23,242 | ) | (10,183 | ) | (9,522 | ) | ||||||
|
Net increase (decrease) in short-term investments |
(19 | ) | 177 | 444 | ||||||||
|
Acquisitions, net of cash acquired |
(416,986 | ) | (989 | ) | (190 | ) | ||||||
|
Restricted cash for reinsured claims losses |
(3,108 | ) | (2,848 | ) | 2,633 | |||||||
|
Net cash used in investing activities |
(443,355 | ) | (13,843 | ) | (6,635 | ) | ||||||
|
Financing activities |
||||||||||||
|
Repurchase of common stock, for treasury |
(524 | ) | (547 | ) | (3,658 | ) | ||||||
|
Proceeds from common stock issued pursuant to stock option exercise |
11,019 | 10,069 | 949 | |||||||||
|
Excess tax benefit upon exercise of stock options |
2,722 | 1,120 | 91 | |||||||||
|
Proceeds from long-term debt |
501,200 | 76,000 | - | |||||||||
|
Repayment of long-term debt |
(48,625 | ) | (82,500 | ) | (20,493 | ) | ||||||
|
Debt financing costs |
(12,769 | ) | (2,082 | ) | (65 | ) | ||||||
|
Capital lease payments and other |
73 | (9 | ) | (23 | ) | |||||||
|
Net cash provided by (used in) financing activities |
453,096 | 2,051 | (23,199 | ) | ||||||||
|
Effect of exchange rate changes on cash |
(3,525 | ) | (313 | ) | 25 | |||||||
|
Net change in cash |
61,411 | 43,132 | 12,679 | |||||||||
|
Cash at beginning of period |
98,995 | 55,863 | 43,184 | |||||||||
|
Cash at end of period |
$ | 160,406 | $ | 98,995 | $ | 55,863 | ||||||
See accompanying notes to the consolidated financial statements
The Providence Service Corporation
Supplemental Cash Flow Information
(in thousands)
|
Year ended December 31, |
||||||||||||
|
Supplemental cash flow information |
2014 |
2013 |
2012 |
|||||||||
|
Cash paid for interest |
$ | 10,726 | $ | 5,839 | $ | 6,505 | ||||||
|
Cash paid for income taxes |
$ | 18,389 | $ | 13,395 | $ | 8,877 | ||||||
|
PSC of Canada Exchange Corp. shares exchanged |
$ | 6,961 | $ | - | $ | - | ||||||
|
PSC of Canada Exchange Corp. shares converted to treasury shares for fulfillment of obligation by sellers of WCG related to dispute with British Columbia |
$ | 1,521 | $ | - | $ | - | ||||||
|
Acquisitions: |
||||||||||||
|
Purchase price |
$ | 525,596 | $ | 989 | $ | 190 | ||||||
|
Less: |
||||||||||||
|
Cash acquired |
37,159 | - | - | |||||||||
|
Common stock issued for acquistions of business |
38,570 | - | - | |||||||||
|
Contingent consideration |
30,095 | - | - | |||||||||
|
Note payable to former shareholder |
600 | - | - | |||||||||
|
Amount due to former shareholder |
2,186 | - | - | |||||||||
|
Acquisitions, net of cash acquired |
$ | 416,986 | $ | 989 | $ | 190 | ||||||
See accompanying notes to the consolidated financial statements
The Providence Service Corporation
Notes to Consolidated Financial Statements
December 31, 2014
(in thousands except years, share and per share data)
1. Basis of Presentation, Description of Business, Significant Accounting Policies, Critical Accounting Estimates and Recent Accounting Pronouncements
Basis of Presentation
The Providence Service Corporation (the “Company”) follows accounting standards set by the Financial Accounting Standards Board (“FASB”). The FASB establishes accounting principles generally accepted in the United States (“GAAP”). Rules and interpretive releases of the Securities and Exchange Commission (“SEC”) under authority of federal securities laws are also sources of authoritative GAAP for SEC registrants, which the Company is required to follow. References to GAAP issued by the FASB in these footnotes are to the FASB Accounting Standards Codification (“ASC”), which serves as a single source of authoritative non-SEC accounting and reporting standards to be applied by non-governmental entities. All amounts are presented in US dollars, unless otherwise noted. In order to conform to the current year presentation, prior year amounts have been reclassified to show service revenue as one line item, services expense as one line item, and interest expense and interest income as interest expense, net. Additionally, prior year management fee receivables have been included in other receivables for comparable presentation purposes.
Description of Business
The Company provides and manages primarily government sponsored non-emergency transportation, human services, workforce development services and health assessment services. At December 31, 2014, the Company operated in four segments, Non-Emergency Transportation Services (“NET Services”), Human Services, Workforce Development Services (“WD Services”) and Health Assessment Services (“HA Services”). The NET Services segment manages transportation networks and arranges for client transportation to health care related facilities and services for state or regional Medicaid agencies, managed care organizations (“MCOs”) and commercial insurers. In the Human Services segment, counselors, social workers and behavioral health professionals work with clients, primarily in the client’s home or community, who are eligible for government assistance due to income level, disabilities or court order. The WD Services segment provides outsourced employability services primarily to the eligible participants in government sponsored programs. The HA Services segment provides comprehensive health assessments (“CHAs”), for members enrolled in Medicare Advantage (“MA”) health plans, in patient’s homes or nursing facilities. As of December 31, 2014, the Company operated in 42 states and the District of Columbia in the United States (“US”), and in 11 other countries.
Seasonality
The Company’s quarterly operating results and operating cash flows normally fluctuate as a result of seasonal variations in its business. The NET Services operating segment experiences fluctuations in demand for its non-emergency transportation services during the summer, winter and holiday seasons. Due to higher demand in the summer months and lower demand in the winter and holiday seasons, coupled with a primarily fixed revenue stream based on a per member, per month payment structure, the NET Services operating segment normally experiences lower operating margins in the summer season and higher operating margins in the winter and holiday seasons.
The Human Services operating segment experiences lower client demand for its home and community based services during the holiday and summer seasons which generally results in lower revenue during those periods. However, operating expenses in the Human Services operating segment do not vary significantly with these changes. As a result, the Human Services operating segment typically experiences lower operating margins during the holiday and summer seasons.
In the HA Services operating segment, CHAs are typically provided as part of a MA plan’s annual program and are conducted with each individual member once per year. Historically, there has been higher CHA volume in the second half of the calendar year as a result of an accelerating demand towards year-end.
Principles of Consolidation
The consolidated financial statements include the accounts of the Company and all of its subsidiaries, including Ingeus Limited and its wholly-owned subsidiaries (collectively, “Ingeus”) which were acquired on May 30, 2014, and CCHN Group Holdings, Inc. and its wholly-owned subsidiaries (collectively, “Matrix”) which were acquired on October 23, 2014. All intercompany accounts and transactions have been eliminated in consolidation.
Significant Accounting Policies
Cash and Cash Equivalents
Cash and cash equivalents include all cash balances and highly liquid investments with an initial maturity of three months or less. Investments in cash equivalents are carried at cost, which approximates fair value. The Company places its temporary cash investments with high credit quality financial institutions. At times, such investments may be in excess of the federally insured limits.
At December 31, 2014 and 2013, approximately $42,651 and $4,607, respectively, of cash was held in foreign countries and may not be freely transferable without unfavorable tax consequences.
Restricted Cash
The Company had approximately $18,571 and $15,729 of restricted cash at December 31, 2014 and 2013 as follows:
|
December 31, |
||||||||
|
2014 |
2013 |
|||||||
|
Collateral for letters of credit - Contractual obligations |
$ | - | $ | 243 | ||||
|
Contractual obligations |
573 | 839 | ||||||
|
Subtotal restricted cash for contractual obligations |
573 | 1,082 | ||||||
|
Collateral for letters of credit - Reinsured claims losses |
3,033 | 3,033 | ||||||
|
Escrow/Trust - Reinsured claims losses |
14,965 | 11,614 | ||||||
|
Subtotal restricted cash for reinsured claims losses |
17,998 | 14,647 | ||||||
|
Total restricted cash |
18,571 | 15,729 | ||||||
|
Less current portion |
3,807 | 3,772 | ||||||
| $ | 14,764 | $ | 11,957 | |||||
Of the restricted cash amount at December 31, 2014 and 2013:
|
● |
$243 in 2013 served as collateral for irrevocable standby letters of credit that provide financial assurance that the Company will fulfill certain contractual obligations; |
|
● |
approximately $573 and $839, respectively, was held to fund the Company’s obligations under arrangements with various governmental agencies through the Company’s correctional services business; |
|
● |
approximately $3,033 in both periods served as collateral for irrevocable standby letters of credit to secure any reinsured claims losses under the Company’s reinsurance program; |
|
● |
of the remaining $14,965 and $11,614: |
|
o |
approximately $2,800 and $3,070, respectively, was restricted and held in a trust for historical reinsurance claims losses under the Company’s general and professional liability reinsurance program; |
|
o |
approximately $493 and $732, respectively, was restricted under the historical auto liability program; and |
|
o |
approximately $11,672 and $7,812, respectively, was restricted and held in a trust for reinsurance claims losses under the Company’s workers’ compensation, general and professional liability and auto liability reinsurance programs. |
Short-Term Investments
As part of its cash management program, the Company from time to time maintains short-term investments. These investments have a term to earliest maturity of less than one year and are comprised of certificates of deposit. These investments are carried at cost, which approximates market value, and are classified as “Prepaid expenses and other” in the consolidated balance sheets.
Fair Value of Financial Instruments
The carrying amounts of cash and cash equivalents, restricted cash, accounts receivable and accounts payable approximate their fair value because of the relatively short-term maturity of these instruments. The fair value of the Company’s long-term obligations is estimated based on interest rates for the same or similar debt offered to the Company having the same or similar remaining maturities and collateral requirements. The carrying amount of the long-term obligations approximates its fair value.
Accounts Receivable and Allowance for Doubtful Accounts
The Company records all accounts receivable amounts at their contracted amount, less an allowance for doubtful accounts. The Company maintains an allowance for doubtful accounts at an amount it estimates to be sufficient to cover the risk that an account will not be collected. The Company regularly evaluates its accounts receivable, especially receivables that are past due, and reassesses its allowance for doubtful accounts based on specific client collection issues. In circumstances where the Company is aware of a specific payer’s inability to meet its financial obligation, the Company records a specific allowance for doubtful accounts to reduce the net recognized receivable to the amount the Company reasonably expects to collect.
The Company’s write-off experience for each of the years ended December 31, 2014, 2013 and 2012 was less than 1% of the Company’s revenue. The Company’s provision for doubtful accounts expense for the years ended December 31, 2014, 2013 and 2012 was $2,589, $3,245 and $2,305, respectively.
Property and Equipment
Property and equipment are stated at historical cost, net of accumulated depreciation, or at fair value if the assets were initially recorded as the result of a business combination. Depreciation is calculated using the straight-line method over the estimated useful life of the asset. Maintenance and repairs are expensed as incurred. Gains and losses resulting from the disposition of an asset are reflected in operating expense.
Impairment of Long-Lived Assets
Goodwill
The Company analyzes the carrying value of goodwill at the end of each fiscal year, and more frequently if events occur or circumstances change that would more likely than not reduce the fair value of a reporting unit below its carrying value. Such circumstances could include, but are not limited to: (1) the loss or modification of significant contracts, (2) a significant adverse change in legal factors or in business climate, (3) unanticipated competition, (4) an adverse action or assessment by a regulator, or (5) a significant decline in the Company’s stock price. When analyzing goodwill for impairment the Company first assesses qualitative factors to determine whether it is necessary to perform the two-step quantitative goodwill impairment test described below. If the Company determines, based on a qualitative assessment, that it is more likely than not that the fair value of a reporting unit is less than its carrying amount, then the Company would calculate the fair value of the reporting unit and perform a two-step quantitative goodwill impairment test. In connection with its analysis of the carrying value of goodwill, the Company reconciles the aggregate fair value of its reporting units to the Company’s market capitalization including a control premium that is reasonable within the context of industry data on premiums paid. When determining whether goodwill is impaired, the Company compares the fair value of the reporting unit to which the goodwill is assigned to the reporting unit’s carrying amount, including goodwill. If the carrying amount of a reporting unit exceeds its fair value, then the Company must proceed to a second step, and the amount of the impairment loss must be measured. The impairment loss would be calculated by comparing the implied fair value of the reporting unit goodwill to its carrying amount. In calculating the implied fair value of the reporting unit goodwill, the fair value of the reporting unit is allocated to all of the other assets and liabilities of that unit based on their fair values. The excess of the fair value of a reporting unit over the amount assigned to its other assets and liabilities is the implied fair value of goodwill. An impairment loss would be recognized when the carrying amount of goodwill exceeds its implied fair value.
Intangible assets subject to amortization
The Company separately values all acquired and internally developed identifiable intangible assets apart from goodwill. The Company has historically allocated a portion of the purchase consideration to customer relationships, developed technology, management contracts, trademarks and trade names, and restrictive covenants acquired through business combinations based on the expected direct or indirect contribution to future cash flows on a discounted cash flow basis over the useful life of the assets.
The Company assesses whether any relevant factors limit the period over which acquired assets are expected to contribute directly or indirectly to future cash flows for amortization purposes. While the Company uses discounted cash flows to value the acquisition of intangible assets, the Company has elected to use the straight-line method of amortization to determine amortization expense each period. If applicable, the Company assesses the recoverability of the unamortized balance of its long-lived assets based on undiscounted expected future cash flows. Should this analysis indicate that the carrying value is not fully recoverable, the excess of the carrying value over the fair value of any intangible asset is recognized as an impairment loss.
Accrued Transportation Costs
Transportation costs are estimated and accrued in the month the services are rendered by contracted transportation providers, and are determined using gross reservations for transportation services less cancellations, and average costs per transportation service by customer contract. Average costs per contract are determined by historical cost trends. Actual costs relating to a specific accounting period are monitored and compared to estimated accruals. Adjustments to those accruals are made based on reconciliations with actual costs incurred. Accrued transportation costs were $55,492 and $54,962 at December 31, 2014 and 2013, respectively.
Deferred Financing Costs and Debt Discounts
The Company capitalizes direct expenses incurred in connection with its credit facilities and other borrowings, and amortizes such expenses over the life of the respective credit facility or other borrowing. Fees charged by third parties are recorded as deferred financing costs and fees charged by lenders are recorded as a debt discount. Deferred financing costs, net of amortization, totaling approximately $5,284 and $2,509 at December 31, 2014 and 2013, respectively, are included in “Other assets” in the consolidated balance sheets. Debt discount, net of amortization, totaling approximately $1,462 at December 31, 2014 is included in “Long-term obligations, less current portion” in the consolidated balance sheet.
Revenue Recognition
NET Services segment
Capitation contracts. The majority of the Company’s NET services revenue is generated under capitated contracts with payers where the Company assumes the responsibility of meeting the covered transportation requirements of a specific geographic population for a fixed amount per period based on per-member per-month fees for an estimated number of participants in the payer’s program.
Fee for service contracts. Revenues earned under fee for service (“FFS”) contracts are recognized when the service is provided. Revenue under these types of contracts is based upon contractually established billing rates, less allowance for contractual adjustments. Estimates of contractual adjustments are based upon payment terms specified in the related agreements.
Flat fee contracts. Revenues earned under flat fee contracts are recognized ratably over the covered service period based upon contractually established monthly flat fees that do not fluctuate with any changes in the membership population that can receive the Company’s services.
Human Services segment
FFS contracts. Revenue related to services provided under FFS contracts is recognized at the time services are rendered and collection is determined to be probable. Such services are provided at established billing rates. As services are rendered, contract-specific documentation is prepared describing each service, time spent, and billing code to determine and support the value of each service provided and billed. The timing and amount of collection are dependent upon compliance with the billing requirements specified by each payer. Failure to comply with these requirements could delay the collection of amounts due to the Company under a contract or result in adjustments to amounts billed.
The performance of the Company’s contracts is subject to the condition that sufficient funds are appropriated, authorized and allocated by each state, city or other local government. If sufficient appropriations, authorizations and allocations are not provided by the respective state, city or other local government, the Company is at risk for uncollectible amounts or immediate termination or renegotiation of the financial terms of the Company’s contracts.
Cost-based service contracts. Revenues from the Company’s cost-based service contracts are recorded based on a combination of allowable direct costs, indirect overhead allocations, and stated allowable margins on those incurred costs. These revenues are compared to annual contract budget limits and, depending on reporting requirements, reductions of revenue may be recorded for certain contingencies. The Company annually submits projected costs for the coming year, which assist the contracting payers in establishing the annual contract amount to be paid for services provided under the contracts. The Company submits monthly cost reports which are used by the payers to determine the need for any payment adjustments. Completion of the cost report review process may range from one month to several years. In cases where funds paid to the Company exceed the allowable costs to provide services under contract, the Company may be required to repay amounts previously received.
The Company’s cost reports are generally audited by payers annually. The Company periodically reviews its provisional billing rates and allocation of costs and provides for estimated payment adjustments. The Company believes that adequate provisions have been made in its consolidated financial statements for any material adjustments that might result from the outcome of any cost report audits. Differences between the amounts provided and the settlement amounts are recorded in the Company’s consolidated statement of income in the year of settlement. Such settlements have historically not been material.
Annual block purchase contract. The Company’s annual block purchase contract requires the Company to provide or arrange for behavioral health services to eligible populations of beneficiaries as defined in the contract. The Company must provide a complete range of behavioral health clinical, case management, therapeutic and administrative services. The Company is obligated to provide services only to those clients with a demonstrated medical necessity. The Company’s annual funding allocation amount may be increased when its patient service encounters exceed the contract amount; however, such increases are subject to government appropriation. There is no contractual limit to the number of eligible beneficiaries that may be assigned to the Company, or a specified limit to the level of services that may be provided to these beneficiaries if the services are deemed to be medically necessary. Therefore, the Company is at-risk if the costs of providing necessary services exceed the associated reimbursement.
The terms of the contract may be reviewed prospectively and amended as necessary to ensure adequate funding of the Company’s contractual obligations; however, there is no assurance that amendments will be approved or that funding will be adequate.
Workforce Development Services segment
Workforce Development Services revenues are generated from providing resume and job interview skills, networking and job placement services, and technical job training through internally staffed or outsourced resources. The Company’s revenue is largely based on successful job placement and sustainment outcomes. While the specific terms vary by contract and country, the Company generally receives four types of revenue streams under contracts with government entities: attachment fees, job placement/job outcome fees, sustainment fees and incentive fees. Attachment fees are typically upfront payments that are payable when a client enters the system. Job placement fees are typically payable when a client is employed, whereas job outcome fees are typically payable when a client is employed, and remains employed for a specified period of time. Sustainment fees are typically payable upon certain employment tenure milestones. Finally, incentive fees vary greatly by contract, and are usually based upon a calculation that includes a variety of factors and inputs, such as average sustainment rates and client referral rates.
Revenue is recognized ratably over the period from initial contact with a client to the average period services are provided, as is the case for attachment fees, or when certain milestones are achieved, as is the case with job placement/job outcome fees and sustainment fees. Incentive fees are generally recognized when the revenue is fixed and determinable, frequently at the end of the cumulative calculation period, unless the contractual terms allow for earned payments on a fixed or ratable basis.
Health Assessment Services segment
The HA Services segment contracts with health plans to provide clinical assessments for their MA members that meet certain pre-determined criteria as defined by the providers. An assessment is a comprehensive physical examination of an individual performed by one of the Company’s physicians or nurse practitioners. The MA clients for whom the Company performs these examinations use the assessment reports to impact care management of the MA member and properly report the cost of care of those members. Revenue is recognized in the period in which the services are rendered.
Deferred Revenue
At times the Company may receive funding for certain services in advance of services being rendered. These amounts are reflected in the consolidated balance sheets as deferred revenue until the services are rendered.
Stock-Based Compensation
The Company follows the fair value recognition provisions of ASC Topic 718 - Compensation-Stock Compensation (“ASC 718”), which requires companies to measure and recognize compensation expense for all share based payments at fair value.
Income Taxes
Deferred income taxes are determined by the liability method in accordance with ASC Topic 740 - Income Taxes (“ASC 740”). Under this method, deferred tax assets and liabilities are determined based on differences between the carrying amounts of assets and liabilities for financial reporting purposes and the amounts used for income tax purposes and are measured using the enacted tax rates and laws that will be in effect when the differences are expected to reverse. The Company records a valuation allowance which includes amounts for net operating loss and tax credit carryforwards, as more fully described in Note 15 below, for which the Company has concluded that it is more likely than not that these net operating loss and tax credit carryforwards will not be realized in the ordinary course of operations. The Company recognizes interest and penalties related to income taxes as a component of income tax expense.
Foreign currency translation
Local currencies generally are considered the functional currencies outside the US. Assets and liabilities for operations in local-currency environments are translated at month-end exchange rates of the period reported. Income and expense items are translated at the average exchange rate for each applicable month. Cumulative translation adjustments are recorded as a component of accumulated other comprehensive income (loss) in stockholders’ equity.
Loss Reserves for Certain Reinsurance and Self-funded Insurance Programs
The Company reinsures a substantial portion of its automobile, general and professional liability and workers’ compensation costs under reinsurance programs through the Company’s wholly-owned subsidiary Social Services Providers Captive Insurance Company (“SPCIC”), a licensed captive insurance company domiciled in the State of Arizona. SPCIC maintains reserves for obligations related to the Company’s reinsurance programs for its automobile, general and professional liability and workers’ compensation coverage.
SPCIC reinsures third-party insurers for general and professional liability exposures for the first dollar of each and every loss up to $1,000 per loss and $5,000 in the aggregate. SPCIC also reinsures third-party insurers for automobile liability exposures for $250 per claim. Additionally, SPCIC reinsures a third-party insurer for worker’s compensation insurance for the first dollar of each and every loss up to $500 per occurrence with a $13,700 annual policy aggregate limit. As of December 31, 2014 and 2013, the Company had reserves of approximately $12,750 and $10,635, respectively, for the automobile, general and professional liability and workers’ compensation programs (net of expected losses in excess of the Company’s liability which would be paid by third-party insurers to the extent losses are incurred). The reserves are classified as “Reinsurance liability reserve” and “Other long-term liabilities” in the consolidated balance sheets.
Based on an independent actuarial report, the Company’s expected losses related to workers’ compensation, automobile and general and professional liability in excess of its liability under its associated reinsurance programs at December 31, 2014 and 2013 was approximately $5,525 and $3,540, respectively. The Company recorded a corresponding receivable from third-party insurers and liability at December 31, 2014 and 2013 for these expected losses, which would be paid by third-party insurers to the extent losses are incurred.
In addition, the Company’s wholly-owned subsidiary, Provado Insurance Services, Inc. (“Provado”), is a licensed captive insurance company domiciled in the State of South Carolina. Provado has historically provided reinsurance for policies written by a third party insurer for general liability, automobile liability, and automobile physical damage coverage to various members of the network of subcontracted transportation providers and independent third parties within the Company’s NET Services operating segment. Effective February 15, 2011, Provado did not renew its reinsurance agreement and will not assume liabilities for policies after that date. It will continue to administer existing policies for the foreseeable future and resolve remaining and future claims related to these policies.
Under a reinsurance agreement with a third party insurer, Provado reinsures the third party insurer for the first $250 of each loss for each line of coverage, subject to an annual aggregate equal to 107.7% of gross written premium, and certain claims in excess of $250 to an additional aggregate limit of $1,100. Provado maintains reserves for obligations related to the reinsurance programs for general liability, automobile liability, and automobile physical damage coverage. As of December 31, 2014 and 2013, Provado recorded reserves of approximately $1,434 and $1,880, respectively. The reserves are classified as “Reinsurance liability reserve” in the consolidated balance sheets.
The Company utilizes analyses prepared by third party administrators and independent actuaries based on historical claims information with respect to the general and professional liability coverage, workers’ compensation coverage, automobile liability, automobile physical damage, and health insurance coverage to determine the amount of required reserves.
The Company also maintains a self-funded health insurance program with a stop-loss umbrella policy with a third party insurer to limit the maximum potential liability for individual claims to $275 per person and for a maximum potential claim liability based on member enrollment. With respect to this program, the Company considers historical and projected medical utilization data when estimating its health insurance program liability and related expense. As of December 31, 2014 and 2013, the Company had approximately $1,973 and $1,870, respectively, in reserve for its self-funded health insurance programs. The reserves are classified as “Reinsurance liability reserve” in the consolidated balance sheets.
The Company regularly analyzes its reserves for incurred but not reported claims, and for reported but not paid claims related to its reinsurance and self-funded insurance programs. The Company believes its reserves are adequate. However, significant judgment is involved in assessing these reserves such as assessing historical paid claims, average lags between the claims’ incurred date, reported dates and paid dates, and the frequency and severity of claims. There may be differences between actual settlement amounts and recorded reserves and any resulting adjustments are included in expense once a probable amount is known. There were no significant adjustments recorded in the periods covered by this report.
Critical Accounting Estimates
The Company has made a number of estimates relating to the reporting of assets and liabilities, revenues and expenses and the disclosure of contingent assets and liabilities to prepare the consolidated financial statements in conformity with GAAP. The Company based its estimates on historical experience and on various other assumptions the Company believes to be reasonable under the circumstances. However, actual results may differ from these estimates under different assumptions or conditions. Some of the more significant estimates impact revenue recognition, accounts receivable and allowance for doubtful accounts, accounting for business combinations, goodwill and other intangible assets, accrued transportation costs, loss reserves for reinsurance and self-funded insurance programs, stock-based compensation and income taxes.
Recent Accounting Pronouncements
In April 2014, the FASB issued Accounting Standards Update (“ASU”) No. 2014-08, Presentation of Financial Statements (Topic 2015) and Property, Plant, and Equipment (Topic 360): Reporting Discontinued Operations and Disclosures of Disposals of Components of an Entity (“ASU 2014-08”). ASU 2014-08 changes the requirements for reporting discontinued operations. Under the ASU discontinued operations is defined as either a:
|
● |
Component of an entity, or group of components that |
|
o |
has been disposed of, meets the criteria to be classified as held-for-sale, or has been abandoned/spun-off; and |
|
o |
represents a strategic shift that has (or will have a major effect on an entity’s operations and financial results), or |
|
● |
Business or nonprofit activity that, on acquisition, meets the criteria to be classified as held-for-sale. |
This ASU is effective for publicly held companies prospectively for all disposals (or classifications as held for sale) of components of an entity that occur within annual periods beginning on or after December 15, 2014, and interim periods within those years, and all businesses that, on acquisition, are classified as held for sale that occur within annual periods beginning on or after December 15, 2014, and interim periods within those years. The Company will prospectively apply this accounting literature in 2015.
In May 2014, the FASB issued ASU No. 2014-09, Revenue from Contracts with Customers: Topic 606 (“ASU 2014-09”). This ASU will supersede the revenue recognition requirements in Topic 605, Revenue Recognition, and most industry-specific guidance. The core principle of the guidance is that an entity should recognize revenue to depict the transfer of promised goods or services to customers in an amount that reflects the consideration to which the entity expects to be entitled in exchange for those goods or services. To achieve that core principle, an entity should apply the following steps:
|
|
● |
Step 1: Identify the contract(s) with a customer. |
||||
|
|
● |
Step 2: Identify the performance obligations in the contract. |
||||
|
|
● |
Step 3: Determine the transaction price. |
||||
|
|
● |
Step 4: Allocate the transaction price to the performance obligations in the contract. |
||||
|
|
● |
Step 5: Recognize revenue when (or as) the entity satisfies a performance obligation. | ||||
For a publicly held entity, this ASU is effective for annual reporting periods beginning after December 15, 2016, including interim periods within that reporting period. Early application is not permitted. The Company is currently evaluating the impact ASU 2014-09 will have on its consolidated financial statements.
2. Concentration of Credit Risk
Contracts with domestic governmental agencies and other domestic entities that contract with governmental agencies accounted for approximately 73.0%, 80.0% and 81.1% of the Company’s domestic revenue for the years ended December 31, 2014, 2013 and 2012, respectively. Contracts with foreign governmental agencies and other foreign entities that contract with governmental agencies accounted for approximately 94.6% of the Company’s foreign revenue for the year ended December 31, 2014. In years past, the Company’s international presence was not material. The governmental contracts are subject to possible statutory and regulatory changes, rate adjustments, administrative rulings, rate freezes and funding reductions. Reductions in amounts paid under these contracts for the Company’s services or changes in methods or regulations governing payments for the Company’s services could materially adversely affect its revenue and profitability. Additionally, approximately 68.0% of our Workforce Development Services revenue for the year ended December 31, 2014 was generated from one foreign payer.
At December 31, 2014, approximately $40,213, or 18.2%, of the Company’s net assets were located in countries outside of the US.
3. Prepaid Expenses and Other
Prepaid expenses and other were comprised of the following:
|
December 31, |
||||||||
|
2014 |
2013 |
|||||||
|
Prepaid income taxes |
13,865 | 1,427 | ||||||
|
Prepaid insurance |
5,496 | 4,409 | ||||||
|
Prepaid taxes and licenses |
4,752 | 66 | ||||||
|
Prepaid rent |
3,441 | 1,685 | ||||||
|
Deposits held for leased premises & bonds |
3,249 | - | ||||||
|
Preferred share backstop fee paid to related party |
2,947 | - | ||||||
|
Other |
12,407 | 4,244 | ||||||
|
Total prepaid expenses and other |
$ | 46,157 | $ | 11,831 | ||||
4. Property and Equipment
Property and equipment consisted of the following:
|
Estimated |
||||||||||||
|
Useful Life |
December 31, |
|||||||||||
|
(in years) |
2014 |
2013 |
||||||||||
|
Land |
-- | $ | 1,911 | $ | 1,911 | |||||||
|
Building |
39 | 11,877 | 11,629 | |||||||||
|
Computer and telecom equipment |
3-5 | 36,696 | 25,138 | |||||||||
|
Software |
3-5 | 17,820 | 12,333 | |||||||||
|
Leasehold improvements |
Shorter of 7 years or lease term |
15,692 | 6,528 | |||||||||
|
Furniture and fixtures |
5-10 | 7,724 | 3,963 | |||||||||
|
Automobiles |
5 | 4,643 | 2,732 | |||||||||
|
Construction in progress |
-- | 3,065 | 1,816 | |||||||||
| 99,428 | 66,050 | |||||||||||
|
Less accumulated depreciation |
42,280 | 33,341 | ||||||||||
|
Total property and equipment, net |
$ | 57,148 | $ | 32,709 | ||||||||
Depreciation expense was approximately $14,051, $7,738 and $7,537 for the years ended December 31, 2014, 2013 and 2012, respectively.
5. Goodwill and Intangibles
Goodwill
Changes in goodwill were as follows:
|
NET |
Human |
WD |
HA |
Consolidated |
||||||||||||||||
|
Services |
Services |
Services |
Services |
Total |
||||||||||||||||
| Balance at December 31, 2012 | $ | 95,215 | $ | 18,700 | $ | - | $ | - | $ | 113,915 | ||||||||||
|
Foreign currency translation adjustment |
- | (160 | ) | - | - | (160 | ) | |||||||||||||
|
Impairment charge |
- | (492 | ) | - | - | (492 | ) | |||||||||||||
|
Balances at December 31, 2013 |
||||||||||||||||||||
|
Goodwill |
191,215 | 79,241 | - | - | 270,456 | |||||||||||||||
|
Accumulated impairment losses |
(96,000 | ) | (61,193 | ) | - | - | (157,193 | ) | ||||||||||||
| 95,215 | 18,048 | - | - | 113,263 | ||||||||||||||||
|
Ingeus acquisition |
- | - | 35,484 | - | 35,484 | |||||||||||||||
|
Matrix acquisition |
- | - | - | 210,576 | 210,576 | |||||||||||||||
|
Other acquisitions |
- | 5,971 | - | - | 5,971 | |||||||||||||||
|
Foreign currency translation adjustment |
- | (177 | ) | (2,561 | ) | - | (2,738 | ) | ||||||||||||
|
Impairment charge |
- | (6,915 | ) | - | - | (6,915 | ) | |||||||||||||
|
Balances at December 31, 2014 |
||||||||||||||||||||
|
Goodwill |
191,215 | 85,035 | 32,923 | 210,576 | 519,749 | |||||||||||||||
|
Accumulated impairment losses |
(96,000 | ) | (68,108 | ) | - | - | (164,108 | ) | ||||||||||||
| $ | 95,215 | $ | 16,927 | $ | 32,923 | $ | 210,576 | $ | 355,641 | |||||||||||
In conjunction with its annual review of goodwill impairment as of December 31, 2014, the Company performed the two-step impairment analysis and determined that goodwill was impaired for two of its Human Services segment reporting units. The goodwill impairment in the Maple Star reporting unit was attributable to declines in forecasted referrals, leading to a decline in projected future cash flows of the entity. The Company recorded an impairment charge of $3,810 related to the Maple Star reporting unit. The impairment for the second reporting unit was attributable to lower than expected performance during 2014 in the Providence of Idaho reporting unit, as well as a lower than expected projections in future years. An impairment charge of $2,815 was recorded related to the Providence of Idaho reporting unit.
Additionally, based on a triggering event for one of the Human Services segment reporting units, the Company recorded a goodwill impairment charge of approximately $290 prior to conducting its annual asset impairment test.
Also in conjunction with its annual review of goodwill impairment as of December 31, 2014, the Company performed the two-step analysis of its Ingeus reporting unit. After completing step one, the Company concluded the fair value of the reporting unit was less than its carrying value, requiring the Company to proceed to the second step of the two-step goodwill impairment test. As part of the Step 2 analysis, the Company analyzed its long-term assets, including property, plant and equipment, and its intangible assets. Based on this review, it was determined that the undiscounted cash flows from the reporting unit exceeded its carrying value. However, in determining the implied fair value of goodwill for the Ingeus reporting unit, the assigned fair value of the Ingeus reporting unit’s intangible assets as of December 31, 2014 was $13,700 less than the carrying value. In accordance with ASC 350, the assignment of fair value to the assets and liabilities of the reporting unit is solely for the purpose of testing goodwill for impairment, the assets and liabilities of the reporting unit are not written up or down as a result of the allocation process. Based on the two-step analysis described above, the Company concluded the implied fair value of the Ingeus reporting unit goodwill exceeded its carrying value by $18,500. Accordingly, the Company concluded there was no impairment in its Ingeus reporting unit goodwill, and did not recognize any charges related to goodwill impairment as of December 31, 2014.
The Company believes the assumptions used in its discounted cash flow analysis are appropriate and result in reasonable estimates of the implied fair value of each reporting unit. The Company further believes the most significant assumptions used in its analysis are the expected revenue growth, margins and overall profitability of its reporting units. However, the Company may not meet its revenue growth and profitability targets, working capital needs and capital expenditures may be higher than forecast, changes in credit or equity markets may result in changes to the Company’s discount rate and general business conditions may result in changes to the Company’s terminal value assumptions for its reporting units. The amount of goodwill associated with Ingeus was $32,923 at December 31, 2014.
During the quarter ended June 30, 2013, the not-for-profit entities managed by Rio Grande Management Company, L.L.C. (“Rio”), a wholly-owned subsidiary of the Company, were notified of the termination of funding for certain of their services. Management expected that due to this change in funding, the not-for-profit entities would not be able to maintain their historical level of business, which was expected to result in the decrease, or elimination of, services provided by Rio to these entities. The Company determined that these factors were indicators that an interim goodwill impairment test was required under ASC 350. As a result, the Company estimated the fair value of the goodwill it acquired in connection with the Rio acquisition to be zero at June 30, 2013, and at that time, the Company recorded a non-cash charge of $492 in its Human Services operating segment to eliminate the carrying value of goodwill acquired in connection with its acquisition of Rio. This charge is included in “Asset impairment charge” in the consolidated statements of income for the year ended December 31, 2013.
In connection with its annual asset impairment analysis conducted as of December 31, 2013, the Company determined that no additional impairment charges were required to fairly state the value of these assets.
The total amount of goodwill that was deductible for income tax purposes for acquisitions as of December 31, 2014 and 2013 was approximately $43,776 and $36,870, respectively.
Intangible Assets
Intangible assets are comprised of acquired customer relationships, trademarks and trade names, developed technology, management contracts and restrictive covenants. Intangible assets consisted of the following:
|
December 31, |
||||||||||||||||||||
|
2014 |
2013 |
|||||||||||||||||||
|
Estimated |
Gross |
Gross |
||||||||||||||||||
|
Useful Life |
Carrying |
Accumulated |
Carrying |
Accumulated |
||||||||||||||||
|
(in Yrs) |
Amount |
Amortization |
Amount |
Amortization |
||||||||||||||||
|
Customer relationships |
15 | $ | 73,837 | $ | (38,012 | ) | $ | 73,990 | $ | (33,319 | ) | |||||||||
|
Customer relationships |
10 | 223,118 | (6,999 | ) | 1,417 | (1,027 | ) | |||||||||||||
|
Customer relationships |
5 | 4,100 | (227 | ) | - | - | ||||||||||||||
|
Customer relationships |
3 | 1,039 | (370 | ) | 989 | (21 | ) | |||||||||||||
|
Management contracts |
10 | 7,775 | (7,348 | ) | 11,422 | (9,975 | ) | |||||||||||||
|
Trademarks and Trade Names |
|
Indefinite | 25,900 | - | - | - | ||||||||||||||
|
Trademarks and Trade Names |
10 | 16,724 | (976 | ) | - | - | ||||||||||||||
|
Developed technology |
5 | 44,016 | (1,950 | ) | - | - | ||||||||||||||
|
Restrictive Covenants |
2 | 50 | (4 | ) | - | - | ||||||||||||||
|
Total |
$ | 396,559 | $ | (55,886 | ) | $ | 87,818 | $ | (44,342 | ) | ||||||||||
The weighted-average amortization period at December 31, 2014 for intangibles with a definite life was 10.3 years. No significant residual value is estimated for these intangible assets. Amortization expense was approximately $15,437, $7,134 and $7,486 for the years ended December 31, 2014, 2013 and 2012, respectively. The total amortization expense is estimated to be as follows for the next five years and thereafter, based on completed acquisitions as of December 31, 2014:
|
Year |
Amount |
|||
|
2015 |
$ | 39,218 | ||
|
2016 |
38,728 | |||
|
2017 |
38,279 | |||
|
2018 |
38,279 | |||
|
2019 |
35,883 | |||
|
Thereafter |
124,386 | |||
|
Total |
$ | 314,773 | ||
In connection with its annual asset impairment analysis conducted as of December 31, 2014 and 2013, the Company determined that no impairment charges were required to fairly state the value of these assets.
6. Accrued Expenses
Accrued expenses consisted of the following:
|
December 31, |
||||||||
|
2014 |
2013 |
|||||||
|
Accrued compensation |
$ | 46,425 | $ | 22,940 | ||||
|
NET Services contract adjustments |
27,380 | 12,445 | ||||||
|
Contingent consideration |
7,767 | - | ||||||
|
Other |
40,285 | 17,099 | ||||||
|
Total accrued expenses |
$ | 121,857 | $ | 52,484 | ||||
7. Fair Value Measurements
The Company determines the fair value of its financial instruments based on the fair value hierarchy, which requires an entity to maximize the use of observable inputs and minimize the use of unobservable inputs when measuring fair value. Below are the three levels of inputs that may be used to measure fair value:
Level 1 – Quoted prices in active markets for identical assets or liabilities that the Company has the ability to access at the measurement date.
Level 2 – Observable inputs other than Level 1 prices, such as quoted prices for similar assets or liabilities; quoted prices in markets that are not active; or other inputs that are observable or can be corroborated by observable market data for substantially the full term of the assets or liabilities.
Level 3 – Unobservable inputs that are supported by little or no market activity and that are significant to the fair value of the assets or liabilities.
The Company may be required to pay additional consideration in relation to certain acquisitions based on the achievement of certain earnings targets. Acquisition-related contingent consideration is initially measured and recorded at fair value as an element of consideration paid in connection with an acquisition with subsequent adjustments recognized in other operating expenses in the condensed consolidated statements of income. The Company determines the fair value of acquisition-related contingent consideration, and any subsequent changes in fair value using a discounted probability-weighted approach. This approach takes into consideration Level 3 unobservable inputs including probability assessments of expected future cash flows over the period in which the obligation is expected to be settled and applies a discount factor that captures the uncertainties associated with the obligation. Changes in these unobservable inputs that relate to events occurring subsequent to the date of acquisition could significantly impact the fair value of the obligation recorded in the accompanying condensed consolidated balance sheets and operating expenses in the condensed consolidated statements of income. The fair value of the Company’s contingent consideration was $11,429 at December 31, 2014, of which $7,767 is included in “Accrued expenses” and $3,662 is included in “Other long-term liabilities” in the consolidated balance sheets. The Company recorded a gain due to a change in the estimated fair value of contingent consideration of $16,314 within “General and administrative expense” in the consolidated statement of income for the year ended December 31, 2014.
8. Long-Term Obligations and Note Payable to Related Party
The Company’s long-term obligations were as follows:
|
December 31, |
December 31, |
|||||||
|
2014 |
2013 |
|||||||
|
6.5% convertible senior subordinated notes, interest payable semi-annually beginning May 2008 with principal due May 2014 (the "Notes") |
$ | - | $ | 47,500 | ||||
|
$240,000 revolving loan (previously $165,000; amended May 28, 2014), LIBOR plus 2.25% - 3.25% (effective rate of 3.16% at December 31, 2014) through August 2018 with interest payable at least once every three months |
201,700 | 16,000 | ||||||
|
$250,000 term loan, LIBOR plus 2.25% - 3.25%, with principal payable quarterly beginning March 31, 2015 and interest payable at least once every three months, through August 2018 |
250,000 | - | ||||||
|
$60,000 term loan, LIBOR plus 2.25% - 3.25%, with principal payable quarterly beginning December 31, 2014 and interest payable at least once every three months, through August 2018 |
58,875 | 60,000 | ||||||
|
14.0% unsecured related party, subordinated bridge note with principal due September 30, 2018 and interest payable quarterly |
65,500 | - | ||||||
|
2.0% unsecured, subordinated note to former stockholder of acquired company, principal and interest due May 2016 |
600 | - | ||||||
| 576,675 | 123,500 | |||||||
|
Unamortized discount on debt |
(1,462 | ) | - | |||||
| 575,213 | 123,500 | |||||||
|
Less current portion |
90,688 | 48,250 | ||||||
|
Total long-term obligations, less current portion |
$ | 484,525 | $ | 75,250 | ||||
The carrying amount of the long-term obligations approximated their fair value at December 31, 2014 and 2013. The fair value of the Company’s long-term obligations was estimated based on interest rates for the same or similar debt offered to the Company having same or similar remaining maturities and collateral requirements.
Annual maturities of long-term obligations as of December 31, 2014 are as follows:
|
Year |
Amount |
|||
|
2015 |
$ | 90,688 | ||
|
2016 |
32,938 | |||
|
2017 |
41,287 | |||
|
2018 |
411,762 | |||
|
Total |
$ | 576,675 | ||
Convertible senior subordinated notes
On November 13, 2007, the Company issued $70,000 in aggregate principal amount of 6.5% Convertible Senior Subordinated Notes due in 2014 (the “Senior Notes”), under the amended note purchase agreement dated November 9, 2007 to the purchasers named therein. The proceeds of $70,000 were initially placed into escrow and were released on December 7, 2007 to partially fund the cash portion of the purchase price of Charter LCI Corporation, including its subsidiaries, collectively referred to as LogistiCare. The Senior Notes were general unsecured obligations subordinated in right of payment to any existing or future senior debt. The Senior Notes matured on May 15, 2014, and the Company repaid the balance of $47,500 with cash on hand.
Credit facility
On August 2, 2013, the Company entered into an Amended and Restated Credit Agreement with Bank of America, N.A., as administrative agent, swing line lender and letter of credit issuer, SunTrust Bank, as syndication agent, Merrill Lynch, Pierce, Fenner & Smith Incorporated and SunTrust Robinson Humphrey, Inc., as joint lead arrangers and joint book managers and other lenders party thereto. The Amended and Restated Credit Agreement provided the Company with a senior secured credit facility (“Credit Facility”), in aggregate principal amount of $225,000, comprised of a $60,000 term loan facility and a $165,000 revolving credit facility. The New Senior Credit Facility included sublimits for swingline loans and letters of credit in amounts of up to $10,000 and $25,000, respectively. On August 2, 2013, the Company borrowed the entire amount available under the term loan facility and $16,000 under the revolving credit facility and used the proceeds thereof to refinance certain of the Company’s existing indebtedness.
Under the Credit Facility, the Company has an option to request an increase in the amount of the revolving credit facility and/or the term loan facility from time to time (on substantially the same terms as apply to the existing facilities) in an aggregate amount of up to $75,000 with either additional commitments from lenders under the Amended and Restated Credit Agreement at such time or new commitments from financial institutions acceptable to the administrative agent in its reasonable discretion, so long as no default or event of default exists at the time of any such increase. The Company may not be able to access additional funds under this increase option as no lender is obligated to participate in any such increase under the Credit Facility.
The Credit Facility matures on August 2, 2018. The Company may prepay the Credit Facility in whole or in part, at any time without premium or penalty, subject to reimbursement of the lenders’ breakage and redeployment costs in connection with prepayments of London Interbank Offered Rate (“LIBOR”) loans. The unutilized portion of the commitments under the Credit Facility may be irrevocably reduced or terminated by us at any time without penalty.
The Company’s obligations under the Credit Facility are guaranteed by all of its present and future domestic subsidiaries, excluding certain domestic subsidiaries, which include its insurance captives and not-for-profit subsidiaries. The Company’s, and each guarantor’s, obligations under its guaranty of the Credit Facility are secured by a first priority lien on substantially all of the Company’s respective assets, including a pledge of 100% of the issued and outstanding stock of its domestic subsidiaries and 65% of the issued and outstanding stock of its first tier foreign subsidiaries.
On May 28, 2014, the Company entered into the first amendment (the “First Amendment”) to its Credit Facility. The First Amendment provided for, among other things, an increase in the aggregate amount of the revolving credit facility from $165,000 to $240,000 and other modifications in connection with the consummation of the acquisition of Ingeus.
Additionally, on October 23, 2014, the Company entered into the Second Amendment to the Amended and Restated Credit and Guaranty Agreement and Consent (the “Second Amendment”) to amend the Credit Facility to (i) add a new term loan tranche in aggregate principal amount of up to $250,000 to partly finance the acquisition of Matrix, (ii) provide the consent of the required lenders to consummate the acquisition of Matrix, (iii) permit incurrence of additional debt (including the Related party unsecured subordinated bridge note, described below) to fund the acquisition of Matrix, (iv) add an excess cash flow mandatory prepayment provision and (v) such other amendments which are beneficial to the Company and provide greater flexibility for its future operations.
Interest on the outstanding principal amount of the loans accrue, at the Company’s election, at a per annum rate equal to LIBOR, plus an applicable margin or the base rate plus an applicable margin. The applicable margin ranges from 2.25% to 3.25% in the case of LIBOR loans and 1.25% to 2.25% in the case of the base rate loans, in each case based on the Company’s consolidated leverage ratio as defined in the Second Amendment. Interest on the loans is payable at least every three months in arrears. In addition, the Company is obligated to pay commitment fees based on a percentage of the unused portion of each lender’s commitment under the revolving credit facility and letter of credit fees based on a percentage of the maximum amount available to be drawn under each outstanding letter of credit. The commitment fee and letter of credit fee ranges from 0.25% to 0.50% and 2.25% to 3.25%, respectively, in each case, based on the Company’s consolidated leverage ratio.
The $60,000 term loan is subject to quarterly amortization payments, commencing on December 31, 2014, so that the following percentages of the term loan outstanding on the closing date plus the principal amount of any term loans funded pursuant to the increase option are repaid as follows: 7.5% between December 31, 2014 and September 30, 2015, 10.0% between December 31, 2015 and September 30, 2016, 12.5% between December 31, 2016 and September 30, 2017, 11.25% between December 31, 2017 and June 30, 2018 and the remaining balance at maturity.
The $250,000 term loan is subject to quarterly amortization payments, commencing on March 31, 2015, so that the following percentages of the term loan outstanding on the closing date plus the principal amount of any term loans funded pursuant to the increase option are repaid as follows: 5.625% between March 31, 2015 and September 30, 2015, 10.0% between December 31, 2015 and September 30, 2016, 12.5% between December 31, 2016 and September 30, 2017, 11.25% between December 31, 2017 and June 30, 2018 and the remaining balance at maturity.
The Credit Facility also requires the Company (subject to certain exceptions as set forth in the Amended and Restated Credit Agreement) to prepay the outstanding loans in an aggregate amount equal to 100% of the net cash proceeds received from certain asset dispositions, debt issuances, insurance and casualty awards and other extraordinary receipts.
The Amended and Restated Credit Agreement contains customary affirmative and negative covenants and events of default. The negative covenants include restrictions on the Company’s ability to, among other things, incur additional indebtedness, create liens, make investments, give guarantees, pay dividends, sell assets and merge and consolidate. The Company is subject to financial covenants, including consolidated net leverage and consolidated fixed charge covenants. The Company was in compliance with all covenants as of December 31, 2014.
The Company incurred fees of approximately $12,738 to refinance our long-term debt during 2014. We have accounted for fees related to the refinancing of our long-term debt, as well as unamortized deferred financing fees related to the Senior Credit Facility, under ASC 470-50 – Debt Modifications and Extinguishments. As both credit facilities were loan syndications, and a number of lenders participated in both credit facilities, we evaluated the accounting for financing fees on a lender by lender basis. Of the total amount of fees incurred for the refinancing of debt, approximately $5,224 was deferred as deferred financing fees or debt discount, and will be amortized over the life of the loans, approximately $4,500 was deferred and fully expensed in the fourth quarter of 2014 in relation to bridge financing commitments and approximately $3,014 was expensed in 2014.
Related party unsecured subordinated bridge note
On October 23, 2014, the Company issued to Coliseum Capital Management, LLC and certain of its affiliates (“Coliseum”), a related party, a 14.0% Unsecured Subordinated Note in aggregate principal amount of $65,500 (the “Note”) due September 30, 2018. Interest from the issuance date to, but excluding, the 120th day after the issuance date, was paid in cash in the amount of $3,015 on the issuance of the Note, of which $1,281 is included in “Prepaid expenses and other” in the consolidated balance sheet as of December 31, 2014. Coliseum held approximately 15% of the Company’s outstanding common stock as of October 23, 2014 and is the Company’s largest shareholder. Additionally, Christopher Shackelton, who serves on the Company’s board of directors, is also a Managing Partner at Coliseum Capital Management, LLC.
The Note was repaid in full on February 11, 2015, with the proceeds from a registered Rights Offering (“Rights Offering”) and a related standby purchase agreement. The Rights Offering allowed all of the Company’s existing common stock holders the non-transferrable right to purchase their pro rata share of $65,500 of convertible preferred stock at a price of $100.00 per share, as further described in Note 21. As such, the Note was classified as a current liability at December 31, 2014.
9. Stockholders’ Equity
The Company’s second amended and restated certificate of incorporation provides that the Company’s authorized capital stock consists of 40,000,000 shares of common stock, $0.001 par value per share, and 10,000,000 shares of preferred stock, $0.001 par value per share.
At December 31, 2014 and 2013, there were 16,870,285 and 14,477,312 shares of the Company’s common stock outstanding, respectively, (including 1,014,108 treasury shares at December 31, 2014 and 956,442 treasury shares at December 31, 2013) and no shares of preferred stock outstanding.
The following table reflects the total number of shares of the Company’s common stock reserved for future issuance as of December 31, 2014:
|
Shares of common stock reserved for: |
||||
|
Exercise of stock options and restricted stock awards |
1,501,884 | |||
|
Issuance of Performance Restricted Stock Units |
91,847 | |||
|
Total shares of common stock reserved for future issuance |
1,593,731 |
During the year ended December 31, 2014, the Company granted a total of 463,000 stock options under the 2006 Long-Term Incentive Plan (“2006 Plan”) to purchase the Company’s common stock at exercise prices equal to the market value of the Company’s common stock on the date of grant. The options were granted to executive officers and certain key employees. The option exercise price for all options granted ranged from $36.27 to $43.81. 300,000 options vest in three equal installments on September 11, 2014, June 30, 2015 and June 30, 2016. 163,000 options cliff vest on December 31, 2017. The weighted-average fair value of the options granted during the year ended December 31, 2014 totaled $17.09 per share.
During the year ended December 31, 2014, the Company granted 52,530 shares of restricted stock to non-employee directors of its board of directors, executive officers and certain key employees. The awards primarily vest in three equal installments on the first, second and third anniversaries of the date of grant. Additionally, during the year ended December 31, 2014, the Company granted an additional 567,069 shares to two individuals in connection with the Ingeus acquisition. The awards vest, upon continued employment of the grantees, in four equal installments on each anniversary date of the grant. The weighted-average fair value of all restricted stock awards granted in 2014 totaled $39.80 per share.
During the year ended December 31, 2014, the Company issued 298,186 shares of its common stock in connection with the exercise of employee stock options under the Company’s 2006 Stock Option Plan (“2006 Plan”). In addition, during the year ended December 31, 2014, the Company issued 214,741 shares of its common stock in connection with the exercise of employee stock options under the Company’s 2003 Stock Option Plan (“2003 Plan”). During 2014, the Company also issued 74,714 shares of its common stock to non-employee directors, executive officers and key employees upon the vesting of certain restricted stock awards granted in 2013, 2012 and 2011 under the Company’s 2006 Plan. In connection with the vesting of these restricted stock awards, 18,504 shares of the Company’s common stock were surrendered to the Company by the recipients to pay their associated taxes due to the federal and state taxing authorities during 2014. These shares were placed in treasury.
On February 1, 2007, the Company’s board of directors approved a stock repurchase program for up to one million shares of its common stock. The Company may purchase shares of its common stock from time to time in the open market or in privately negotiated transactions, depending on the market conditions and the Company’s capital requirements. As of December 31, 2013, the Company spent approximately $14,376 to purchase 756,100 shares of its common stock in the open market since the inception of this stock repurchase program. No additional repurchases were made during 2014.
Subject to the rights specifically granted to holders of any then outstanding shares of the Company’s preferred stock, the Company’s common stockholders are entitled to vote together as a class on all matters submitted to a vote of the Company’s stockholders, and are entitled to any dividends that may be declared by the Company’s board of directors. The Company’s common stockholders do not have cumulative voting rights. Upon the Company’s dissolution, liquidation or winding up, holders of the Company’s common stock are entitled to share ratably in the Company’s net assets after payment or provision for all liabilities and any preferential liquidation rights of the Company’s preferred stock then outstanding. The Company’s common stockholders do not have preemptive rights to purchase shares of the Company’s stock. The issued and outstanding shares of the Company’s common stock are not subject to any redemption provisions and are not convertible into any other shares of the Company’s capital stock. The rights, preferences and privileges of holders of the Company’s common stock will be subject to those of the holders of any shares of the Company’s preferred stock the Company may issue in the future.
10. Stock-Based Compensation Arrangements
The Company provides stock-based compensation under the Company’s 2003 Plan and 2006 Plan to employees, non-employee directors, consultants and advisors. Upon stockholder approval in May 2006, the 2006 Plan replaced the former 1997 Stock Option and Incentive Plan (“1997 Plan”) and 2003 Plan. While all awards outstanding under the 2003 Plan remain in effect in accordance with their terms, no additional grants or awards will be made under this plan. The 1997 Plan has expired and no awards were outstanding under the 1997 Plan as of December 31, 2014.
To achieve the purposes of the Company’s stock-based compensation program described above, the 2006 Plan allows the flexibility to grant or award stock options, stock appreciation rights, restricted stock, unrestricted stock, stock units including restricted stock units and performance awards to eligible persons.
Stock option awards granted under the 2003 Plan and 2006 Plan were generally ten year options granted at fair market value on the date of grant with time based vesting over a period determined at the time the options were granted, ranging from one to four years (which is equal to the requisite service period). However, 163,000 stock options granted in December 2014 had a term of approximately 3.25 years. The Company does not intend to pay dividends on unexercised options. New shares of the Company’s common stock are issued when the options are exercised.
The following table summarizes the activity under the 1997 Plan, 2003 Plan and 2006 Plan as of December 31, 2014:
|
Number of shares |
||||||||||||||||
|
Number of shares |
of the Company's |
|||||||||||||||
|
of the Company's |
common stock |
|||||||||||||||
|
common stock |
remaining |
Number of shares of the Company's |
||||||||||||||
|
authorized for |
available for |
common stock subject to |
||||||||||||||
|
issuance |
future grants |
Options |
Stock Grants |
|||||||||||||
|
1997 Plan |
428,572 | - | - | - | ||||||||||||
|
2003 Plan |
1,400,000 | - | 50,760 | - | ||||||||||||
|
2006 Plan |
4,400,000 | 1,061,252 | 762,862 | 780,109 | ||||||||||||
|
Total |
6,228,572 | 1,061,252 | 813,622 | 780,109 | ||||||||||||
The Company chose to follow the short-cut method prescribed by ASC 718 to calculate its pool of excess tax benefits available to absorb tax deficiencies recognized subsequent to the adoption of ASC 718 (“APIC pool”). There was no effect on the Company’s financial results for 2014, 2013 or 2012 related to the application of the short-cut method to determine its APIC pool balance.
The Company calculates the fair value of stock options using the Black-Scholes option-pricing formula. Stock-based compensation expense charged against income for stock options and stock grants awarded during the years ended December 31, 2014, 2013 and 2012 was based on the grant-date fair value adjusted for estimated forfeitures based on awards expected to vest in accordance with the provisions of ASC 718. For stock-based compensation awards granted during 2014, 2013 and 2012, the associated expense is amortized over the vesting period of primarily three years. Additionally, ASC 718 requires forfeitures to be estimated at the time of grant and revised as necessary in subsequent periods if the actual forfeitures differ from those estimates.
The following table reflects the amount of stock-based compensation, for share settled awards, recorded in each financial statement line item for the years ended December 31, 2014, 2013 and 2012:
|
Year ended December 31, |
||||||||||||
|
2014 |
2013 |
2012 |
||||||||||
|
Service expense |
$ | 4,025 | $ | 1,658 | $ | 2,146 | ||||||
|
General and administrative expense |
3,537 | 1,421 | 1,727 | |||||||||
|
Total stock-based compensation |
$ | 7,562 | $ | 3,079 | $ | 3,873 | ||||||
Stock-based compensation included in service expense is comprised of the following:
|
Year ended December 31, |
||||||||||||
|
2014 |
2013 |
2012 |
||||||||||
|
Cost of non-emergency transportation services |
$ | 587 | $ | 1,054 | $ | 1,354 | ||||||
|
Client service expense |
6 | 604 | 792 | |||||||||
|
Workforce development service expense |
3,432 | - | - | |||||||||
|
Total stock-based compenation in service expense |
$ | 4,025 | $ | 1,658 | $ | 2,146 | ||||||
The amounts above exclude the tax benefit of approximately $1,570, $909 and $960 for the years ended December 31, 2014, 2013 and 2012, respectively.
For the years ended December 31, 2014, 2013 and 2012, the amount of excess tax benefits resulting from the exercise of stock options was approximately $2,722, $1,120 and $91, respectively. For the years ended December 31, 2014, 2013 and 2012, the Company had tax shortfalls resulting from the exercise of stock options of approximately $38, $683 and $306, respectively. The excess tax benefits resulting from the exercise of stock options are reflected as cash flows from financing activities for the years ended December 31, 2014, 2013 and 2012 in the consolidated statements of cash flows.
The following table summarizes the stock option activity for the year ended December 31, 2014:
|
Year ended December 31, 2014 |
||||||||||||||||
|
Weighted- |
||||||||||||||||
|
Number |
Weighted- |
average |
||||||||||||||
|
of Shares |
average |
Remaining |
Aggregate |
|||||||||||||
|
Under |
Exercise |
Contractual |
Intrinsic |
|||||||||||||
|
Option |
Price |
Term |
Value |
|||||||||||||
|
Balance at beginning of period |
874,252 | $ | 19.76 | |||||||||||||
|
Granted |
463,000 | 41.16 | ||||||||||||||
|
Exercised |
(512,927 | ) | 21.48 | |||||||||||||
|
Forfeited or expired |
(10,703 | ) | 25.77 | |||||||||||||
|
Outstanding at end of period |
813,622 | $ | 30.77 | 5.9 | $ | 6,821 | ||||||||||
|
Vested or expected to vest at end of period |
754,859 | $ | 30.17 | 6.0 | $ | 6,814 | ||||||||||
|
Exercisable at end of period |
450,620 | $ | 23.00 | 5.2 | $ | 6,794 | ||||||||||
The weighted-average grant-date fair value for options granted, total intrinsic value and cash received by the Company related to options exercised during the years ended December 31, 2014, 2013 and 2012 were as follows:
|
Year ended December 31, |
||||||||||||
|
2014 |
2013 |
2012 |
||||||||||
|
Weighted-average grant date fair value |
$ | 17.09 |
|
Not Applicable | $ | 6.92 | ||||||
|
Options exercised: |
||||||||||||
|
Total intrinsic value |
$ | 9,107 | $ | 4,544 | $ | 351 | ||||||
|
Cash received |
$ | 11,019 | $ | 10,069 | $ | 949 | ||||||
The following table summarizes the activity of the shares and weighted-average grant date fair value of the Company’s non-vested restricted common stock during the year ended December 31, 2014:
|
Weighted-average |
||||||||
|
grant date |
||||||||
|
Shares |
fair value |
|||||||
|
Non-vested at December 31, 2013 |
158,842 | $ | 17.68 | |||||
|
Granted |
619,599 | $ | 39.80 | |||||
|
Vested |
(74,714 | ) | $ | 16.87 | ||||
|
Forfeited |
(15,465 | ) | $ | 16.41 | ||||
|
Non-vested at December 31, 2014 |
688,262 | $ | 37.71 | |||||
Restricted stock grants were not made prior to the approval of the 2006 Plan on May 25, 2006. The fair value of a non-vested restricted stock grant is determined based on the closing market price of the Company’s common stock on the date of grant.
As of December 31, 2014, there was approximately $22,272 of unrecognized compensation cost related to non-vested share settled stock-based compensation arrangements granted under the 2006 Plan. The cost is expected to be recognized over a weighted-average period of 2.74 years. The total fair value of shares vested was $7,053, $3,642 and $4,076 for the years ended December 31, 2014, 2013 and 2012, respectively.
Additionally, as of December 31, 2014, the Company had a short-term liability of $1,357 in “Accrued expenses” and a long-term liability of $176 in “Other long-term liabilities” in the consolidated balance sheet related to unexercised vested and non-vested cash settled share-based payment awards granted under the 2006 Plan. The cash settled share-based compensation expense in total excluded a tax benefit of approximately $610 for the year ended December 31, 2014. The cost is expected to be recognized over a weighted average period of 0.96 years.
There were no stock options awarded during 2013. The fair value of each stock option awarded during the years ended December 31, 2014 and 2012 was estimated on the date of grant using the Black-Scholes option-pricing formula and amortized over the option’s vesting periods with the following assumptions:
|
Year ended December 31, |
||||||||
|
2014 |
2012 |
|||||||
|
Expected dividend yield |
0.0% | 0.0% | ||||||
|
Expected stock price volatility |
45.6%-50.25% | 82.1% | ||||||
|
Risk-free interest rate |
1.1%-1.88% | 0.4%-0.5% | ||||||
|
Expected life of options (in years) |
3.25-5.47 | 3.3-3.6 | ||||||
The risk-free interest rate was based on the US Treasury security rate in effect as of the date of grant. The expected lives of options and the expected stock price volatility were based on the Company’s historical data, or the Company’s best estimate where appropriate.
In addition, in March 14, 2014, the Company issued 6,195 stock equivalent units (“SEUs”), which settle in cash, to Coliseum Capital Partners, L.P., in lieu of a grant to Christopher Shackelton, Chairman of the Board of Directors, that vest one-third upon each anniversary of the vesting date. The fair value of the SEUs is based on the closing stock price on the last day of the period and completed requisite service period. Also, on September 2014, the Company issued 200,000 stock option equivalent units (“SARs”), which settle in cash, to Coliseum Capital Partners, L.P. that vest one-third upon grant, one-third on June 30, 2015 and one-third on June 30, 2016. The Company recorded approximately $1,249 of expense in 2014 related to the SARs which is included in “General and administrative expense” in the Consolidated Statements of Income. The fair value of the SARs was estimated as of December 31, 2014 using the Black-Scholes option-pricing formula and amortized over the option’s graded vesting periods with the following assumptions:
|
Year ended December 31, 2014 |
||||
|
Expected dividend yield |
0.0% | |||
|
Expected stock price volatility |
46.75% - 50.1% | |||
|
Risk-free interest rate |
1.3% - 1.76% | |||
|
Expected life of options (in years) |
3.75 - 5.75 | |||
11. Earnings Per Share
The following table details the computation of basic and diluted earnings per share:
|
Year ended December 31, |
||||||||||||
|
2014 |
2013 |
2012 |
||||||||||
|
Numerator: |
||||||||||||
|
Net income available to common stockholders |
$ | 20,275 | $ | 19,438 | $ | 8,482 | ||||||
|
Denominator: |
||||||||||||
|
Denominator for basic earnings per share -- weighted-average shares |
14,765,303 | 13,499,885 | 13,225,448 | |||||||||
|
Effect of dilutive securities: |
||||||||||||
|
Common stock options and restricted stock awards |
236,538 | 292,937 | 129,165 | |||||||||
|
Performance-based restricted stock units |
16,720 | 17,052 | - | |||||||||
|
Denominator for diluted earnings per share -- adjusted weighted-average shares assumed conversion |
15,018,561 | 13,809,874 | 13,354,613 | |||||||||
|
Basic earnings per share |
$ | 1.37 | $ | 1.44 | $ | 0.64 | ||||||
|
Diluted earnings per share |
$ | 1.35 | $ | 1.41 | $ | 0.64 | ||||||
For the years ended December 31, 2014, 2013 and 2012, employee stock options to purchase 92,054, 452,421 and 1,563,247 shares, respectively, of common stock were not included in the computation of diluted earnings per share as the exercise price of these options was greater than the average fair value of the common stock for the period and, therefore, the effect of these options would have been anti-dilutive. The effect of issuing 1,139,145 and 1,179,999 shares of common stock on an assumed conversion basis related to the Senior Notes was not included in the computation of diluted earnings per share for the years ended December 31, 2013 and 2012, respectively, as it would have been antidilutive.
12. Non-Controlling Interest
In connection with the Company’s acquisition of WCG in August 2007, PSC of Canada Exchange Corp. (“PSC”), a subsidiary established by the Company to facilitate the purchase of all of the equity interest in WCG, issued 287,576 exchangeable shares (“Exchangeable Shares”) as part of the purchase price consideration. The Exchangeable Shares were valued at approximately $7,751 in accordance with the provisions of the purchase agreement ($7,649 for accounting purposes). The Exchangeable Shares were exchangeable at each shareholder’s option, for no additional consideration, into shares of the Company’s common stock on a one-for-one basis. Of the 287,576 Exchangeable Shares originally issued, 25,882 had been exchanged for Company common stock as of December 31, 2013.
The Exchangeable Shares were non-participating such that they were not entitled to any allocation of income or loss of PSC. The Exchangeable Shares represented ownership in PSC and were accounted for as “Non-controlling interest” included in stockholders’ equity in the consolidated balance sheets in the amount of approximately $6,961 at December 31, 2013.
The Exchangeable Shares and the 25,882 shares of the Company’s common stock issued upon the exchange of the same number of Exchangeable Shares noted above were subject to a Settlement and Indemnification Agreement dated November 17, 2009 (“Indemnification Agreement”) by and between the Company and the sellers of WCG. The Indemnification Agreement secured the Company’s claims for indemnification and associated rights and remedies provided by the Share Purchase Agreement (under which the Company acquired all of the equity interest in WCG on August 1, 2007) arising from actions taken by British Columbia to strictly enforce a contractually imposed revenue cap on a per client basis and contractually mandated pass-through activity subsequent to August 1, 2007. The actions taken by British Columbia resulted in an approximate $3,000 Canadian Dollar (“CAD”) dispute and termination of one of its six provincial contracts with WCG, which the Company is disputing. Under the Indemnification Agreement, the sellers agreed to transfer their rights to the Exchangeable Shares and 25,882 shares of the Company’s common stock issued upon the exchange of the same number of Exchangeable Shares to the Company to indemnify the Company against any losses suffered by the Company as the result of an unfavorable ruling upon the conclusion of all appeals related to arbitration. Alternatively, at their option, the sellers could pay cash in lieu of stock in satisfaction of their obligation under the Indemnification Agreement provided payment was made before or concurrently with the execution of any settlement with British Columbia.
Effective April 14, 2010, an arbitrator issued an award with respect to the dispute between WCG and British Columbia. Under the arbitration award, essentially all amounts disputed shall be paid to WCG (except for approximately CAD $13 which will be subject to the terms of the Indemnification Agreement) plus interest. The award affirmed the termination of one of the six provincial contracts that had been terminated effective October 31, 2008. During the second quarter of 2010, British Columbia filed a petition for leave to appeal the arbitration award, and on October 11, 2011, the leave to appeal was granted to British Columbia.
In 2012, WCG received cash totaling approximately $3,394 from British Columbia related to the arbitral award. However, in the event British Columbia prevailed in its arguments during the appeal process, British Columbia could seek immediate repayment of the amount of the arbitral award owing at that time from WCG. Upon receipt of the cash discussed above, the Company recorded approximately $3,394 to cash and other long-term liabilities in 2012. No changes in the status of the appeal occurred and no additional payments were made during 2013.
During the second quarter of 2014, the Company and the sellers of WCG entered into Amendment No. 1 to a Settlement and Indemnification Agreement which authorized WCG to enter into an agreement with the province of British Columbia, Canada to settle the ongoing dispute. Additionally, the sellers of WCG agreed to reimburse WCG certain legal expenses up to a maximum of approximately $120 CAD ($112) upon settlement with British Columbia. On June 6, 2014, British Columbia agreed to the settlement of the dispute for approximately $1,500 CAD ($1,406), which was paid by WCG. The sellers of WCG surrendered 39,162 exchangeable shares of PSC to fulfill their obligation to the Company for the settlement of the dispute with British Colombia and the reimbursement of legal fees. These shares were converted to shares of the Company and transferred to treasury. Additionally, the remaining 222,532 exchangeable shares of PSC were exchanged into shares of common stock of the Company and distributed to the sellers of WCG, thus eliminating the related non-controlling interest balance as of December 31, 2014.
13. Leases
The Company leases many of its operating and office facilities for various terms under non-cancelable operating lease agreements. The leases expire in various years and provide for renewal options. In the normal course of business, it is expected that these leases will be renewed or replaced by leases on other properties.
The operating leases provide for increases in future minimum annual rental payments based on defined increases in the Consumer Price Index, subject to certain minimum increases. Several of these lease agreements contain provisions for periods in which rent payments are reduced. The total amount of rental payments due over the lease term is being charged to rent expense on a straight-line basis over the term of the lease. The difference between rent expense recorded and the amount paid as of December 31, 2014 and 2013 was approximately $2,280 and $1,355, respectively, and was included in "Other long-term liabilities” as of December 31, 2014 in the consolidated balance sheets. Also, the lease agreements generally require the Company to pay executory costs such as real estate taxes, insurance, and repairs.
Future minimum payments under non-cancelable operating leases for equipment and property with initial terms of one year or more consisted of the following at December 31, 2014:
|
Operating |
||||
|
Leases |
||||
|
2015 |
$ | 28,628 | ||
|
2016 |
22,042 | |||
|
2017 |
13,365 | |||
|
2018 |
8,128 | |||
|
2019 |
4,888 | |||
|
Thereafter |
7,513 | |||
|
Total future minimum lease payments |
$ | 84,564 | ||
Rent expense related to operating leases was approximately $30,588, $21,398 and $21,285, for the years ended December 31, 2014, 2013 and 2012, respectively.
14. Retirement Plan
The Company maintains a qualified defined contribution plan under Section 401(k) of the Internal Revenue Code of 1986, as amended (“IRC”), for all employees of its NET Services and Human Services operating segments and corporate personnel. The Company, at its discretion, may make a matching contribution to the plan. The Company’s contributions to the plan were approximately $612, $501 and $461, for the years ended December 31, 2014, 2013 and 2012, respectively.
The Company also maintains defined contribution plans, for the benefit of eligible HA Services’ employees under the provision of Section 401(k) of the US Internal Revenue Code. The Company provides matching contributions that vest over 3 years. Unvested matching contributions are forfeitable upon employee termination. Employee contributions are fully vested and non-forfeitable. The Company’s contributions to these plans were approximately $299 for the year ended December 31, 2014.
WD Services’ employees are entitled to benefits from Ingeus’s retirement plans. Ingeus has separate plans in each country it operates in and has both defined benefit plans and defined contribution plans. The defined contribution plans receive fixed contributions from Ingeus companies and Ingeus’s legal or constructive obligation is limited to these contributions. The Company’s contributions to these defined contribution plans were approximately $2,402 for the year ended December 31, 2014.
On August 31, 2007, the Board adopted The Providence Service Corporation Deferred Compensation Plan (the “Deferred Compensation Plan”) for the Company’s eligible employees and independent contractors of a participating employer (as defined in the Deferred Compensation Plan). Under the Deferred Compensation Plan participants may defer all or a portion of their base salary, service bonus, performance-based compensation earned in a period of 12 months or more, commissions and, in the case of independent contractors, compensation reportable on Form 1099.
The Company also maintains a 409 (A) Deferred Compensation Rabbi Trust Plan for highly compensated employees of its NET Services operating segment. This plan was put in place to compensate for the inability of highly compensated employees to take full advantage of the Company’s 401(k) plan.
15. Income Taxes
The federal and state income tax provision is summarized as follows:
|
Year ended December 31, |
||||||||||||
|
2014 |
2013 |
2012 |
||||||||||
|
Federal: |
||||||||||||
|
Current |
$ | 9,386 | $ | 12,666 | $ | 6,909 | ||||||
|
Deferred |
(3,715 | ) | (2,805 | ) | (81 | ) | ||||||
| 5,671 | 9,861 | 6,828 | ||||||||||
|
State: |
||||||||||||
|
Current |
$ | 3,940 | $ | 2,412 | $ | 2,124 | ||||||
|
Deferred |
(2,089 | ) | (478 | ) | 85 | |||||||
| 1,851 | 1,934 | 2,209 | ||||||||||
|
Foreign: |
||||||||||||
|
Current |
$ | (616 | ) | $ | (19 | ) | $ | (6 | ) | |||
|
Deferred |
596 | 1 | (820 | ) | ||||||||
| (20 | ) | (18 | ) | (826 | ) | |||||||
|
Total provision for income taxes |
$ | 7,502 | $ | 11,777 | $ | 8,211 | ||||||
A reconciliation of the provision for income taxes with amounts determined by applying the statutory U.S. federal income tax rate to income before income taxes is as follows:
|
Year Ended December 31, |
||||||||||||
|
2014 |
2013 |
2012 |
||||||||||
|
Federal statutory rates |
35 | % | 35 | % | 35 | % | ||||||
|
Federal income tax at statutory rates |
$ | 9,722 | $ | 10,925 | $ | 5,844 | ||||||
|
Change in valuation allowance |
2,219 | 185 | 181 | |||||||||
|
Change in uncertain tax positions |
(1,681 | ) | - | - | ||||||||
|
State income taxes, net of federal benefit |
1,315 | 1,198 | 1,436 | |||||||||
|
Difference between federal statutory and foreign tax rate |
(353 | ) | 15 | 384 | ||||||||
|
Stock option expense |
(524 | ) | (862 | ) | 605 | |||||||
|
Meals and entertainment |
207 | 93 | 67 | |||||||||
|
Change in workers' compensation liability accural related to ReDCo |
- | - | (372 | ) | ||||||||
|
Amortization of deferred consideration |
1,574 | - | - | |||||||||
|
Transaction costs |
1,769 | - | - | |||||||||
|
Contingent consideration liability reversal |
(5,748 | ) | - | - | ||||||||
|
Nontaxable interest income |
(660 | ) | - | - | ||||||||
|
Other |
(338 | ) | 223 | 66 | ||||||||
|
Provision for income taxes |
$ | 7,502 | $ | 11,777 | $ | 8,211 | ||||||
|
Effective income tax rate |
27 | % | 38 | % | 49 | % | ||||||
Deferred income taxes reflect the net tax effects of temporary differences between the carrying amounts of assets and liabilities for financial reporting purposes and the amounts used for income tax purposes. Significant components of the Company’s deferred tax assets and liabilities are as follows:
|
December 31, |
||||||||
|
2014 |
2013 |
|||||||
|
Deferred tax assets: |
||||||||
|
Net operating loss carryforwards |
$ | 23,415 | $ | 1,153 | ||||
|
Tax credit carryforwards |
2,602 | - | ||||||
|
Accounts receivable allowance |
5,625 | 905 | ||||||
|
Property and equipment depreciation |
- | 797 | ||||||
|
Accrued items and reserves |
5,211 | 3,004 | ||||||
|
Nonqualified stock options |
2,043 | 1,626 | ||||||
|
Deferred rent |
969 | 657 | ||||||
|
Deferred financing costs |
906 | - | ||||||
|
Deferred Revenue |
320 | - | ||||||
|
Other |
220 | 418 | ||||||
| 41,311 | 8,560 | |||||||
|
Deferred tax liabilities: |
||||||||
|
Prepaids |
2,190 | 1,943 | ||||||
|
Property and equipment depreciation |
4,351 | 4,959 | ||||||
|
Goodwill and intangibles amortization |
106,936 | 7,754 | ||||||
|
Other |
165 | 385 | ||||||
| 113,642 | 15,041 | |||||||
|
Net deferred tax liabilities |
(72,331 | ) | (6,481 | ) | ||||
|
Less valuation allowance |
(14,842 | ) | (814 | ) | ||||
|
Net deferred tax liabilities |
$ | (87,173 | ) | $ | (7,295 | ) | ||
|
Current deferred tax assets, net of valuation allowance of $3,501 and $436 for 2014 and 2013, respectively |
$ | 6,066 | $ | 2,152 | ||||
|
Noncurrent deferred tax liabilities, net of valuation allowance of $11,341 and $378 for 2014 and 2013, repectively |
(93,239 | ) | (9,447 | ) | ||||
| $ | (87,173 | ) | $ | (7,295 | ) | |||
At December 31, 2014, the Company had approximately $19,756 of federal net operating loss carryforwards which expire in years 2018 through 2034, and $70,497 of state net operating loss carryforwards which expire as follows:
|
2015 |
$ | 240 | ||
|
2016 |
2,147 | |||
|
2017 |
1,989 | |||
|
2018 |
- | |||
|
2019 |
- | |||
|
Thereafter |
66,121 | |||
| $ | 70,497 |
In addition, the company had net operating loss carryforwards in Australia of $37,300 and in France of $5,400 which can be carried forward indefinitely.
As a result of statutory “ownership changes” (as defined for purposes of Section 382 of the IRC), the Company’s ability to utilize its federal net operating losses is restricted to $12,037 per year. Realization is dependent on generating sufficient taxable income prior to expiration of the loss carryforwards. Although realization is not assured, management believes it is more likely than not that all of the deferred tax assets will be realized, to the extent they are not covered by a valuation allowance. The amount of the deferred tax asset considered realizable, however, could be reduced in the near term if estimates of future taxable income during the carryforward period are reduced.
The net change in the total valuation allowance for the year ended December 31, 2014 was $14,028, including $10,930 from the acquisition of Ingeus and $879 from the acquisition of Matrix. The valuation allowance includes $12,688 for Australia and France net operating loss carryforwards, and $2,154 for federal and state net operating loss and tax credit carryforwards for which the Company has concluded that it is more likely than not that these net operating loss and tax credit carryforwards will not be realized in the ordinary course of operations. The Company will continue to assess the valuation allowance, and to the extent it is determined that the valuation allowance should be adjusted, an appropriate adjustment will be recorded.
The Company recognized certain excess tax benefits related to stock option plans for the years ended December 31, 2014, 2013 and 2012 in the amount of $2,706, $1,120 and $91, respectively. Such benefits were recorded as a reduction of income taxes payable and an increase in additional paid-in-capital and are included in “Exercise of employee stock options” in the accompanying statements of stockholders’ equity and comprehensive income.
The Company recognized a tax shortfall related to stock option plans for the years ended December 31, 2014, 2013 and 2012 in the amount of $22, $683 and $306, respectively. This was recorded as a reduction of deferred tax assets and a decrease to additional paid-in-capital and is included in “Exercise of employee stock options” in the accompanying statements of stockholders’ equity and comprehensive income.
The Company expects no material amount of the unrecognized tax benefits to be recognized during the next twelve months. The Company recognizes interest and penalties as a component of income tax expense. During the years ended December 31, 2014, 2013 and 2012, the Company recognized approximately $14, $76 and $8, respectively, in interest and penalties. The Company had approximately $24 and $84 for the payment of penalties and interest accrued as of December 31, 2014 and 2013. A reconciliation of the liability for unrecognized income tax benefit is as follows:
|
December 31, |
||||||||||||
|
2014 |
2013 |
2012 |
||||||||||
|
Unrecognized tax benefits, beginning of year |
$ | 414 | $ | 254 | $ | 324 | ||||||
|
Balance upon acquisition |
2,432 | |||||||||||
|
Increase (decrease) related to prior year positions |
14 | 82 | (104 | ) | ||||||||
|
Increase related to current year tax positions |
160 | 78 | 58 | |||||||||
|
Settlements |
- | - | (24 | ) | ||||||||
|
Statute of limitations expiration |
(1,855 | ) | - | - | ||||||||
|
Unrecognized tax benefits, end of year |
$ | 1,165 | $ | 414 | $ | 254 | ||||||
The total amount of unrecognized tax benefits that, if recognized, would favorably affect the effective tax rate in future periods was approximately $1,165 as of December 31, 2014.
The Company is subject to taxation in the United States and various foreign and state jurisdictions. The statute of limitations is generally three years for the United States, two to five years in foreign countries and between three and four years for the various states in which the Company operates. The Company is subject to the following material taxing jurisdictions: United States, United Kingdom, Australia, France, Saudi Arabia and Korea. The tax years that remain open for examination by the United States and various foreign countries and states principally include the years 2010-2014.
Residual United States income taxes have not been provided on undistributed earnings of the Company’s foreign subsidiaries. These earnings are considered to be indefinitely reinvested and, accordingly, no provision for United States federal and state income taxes will be provided thereon. Upon distribution of those earnings in the form of dividends or otherwise, the Company may be subject to both United States income taxes and withholding taxes payable to various foreign jurisdictions less an adjustment for foreign tax credits. Because of the availability of U.S. foreign tax credits, it is not practicable to determine the U.S. federal income tax liability that would be payable if such earnings were not reinvested indefinitely.
16. Commitments and Contingencies
The Company is involved in various claims and legal actions arising in the ordinary course of business, many of which are covered in whole or in part by insurance. Subsequent to December 31, 2014, the Company paid a settlement, not covered by insurance, totaling $1,725, which was accrued as of December 31, 2014. The settlement was related to a review by one of the Company’s Human Services’ payers of certain billing practices.
The Company has two deferred compensation plans for management and highly compensated employees. These deferred compensation plans are unfunded, and benefits are paid from the general assets of the Company. The total of participant deferrals, which is reflected in “Other long-term liabilities” in the consolidated balance sheets, was approximately $1,432 and $1,485 at December 31, 2014 and 2013, respectively.
17. Transactions with Related Parties
Upon the Company’s acquisition of Maple Services, LLC in August 2005, the Company’s former Chief Executive Officer, former Chief Financial Officer, and Chief Executive Officer of Human Services, became members of the board of directors of the not-for-profit organization (Maple Star Colorado, Inc.) formerly managed by Maple Services, LLC. Current members of Maple Star Colorado, Inc.’s board of directors include the Company’s Chief Executive Officer and Chief Financial Officer, and the Chief Executive Officer of Human Services. Maple Star Colorado, Inc. is a non-profit member organization governed by its board of directors and the state laws of Colorado in which it is incorporated. Maple Star Colorado, Inc. is not a federally tax exempt organization and neither the Internal Revenue Service rules governing IRC Section 501(c)(3) exempt organizations, nor any other IRC sections applicable to tax exempt organizations, apply to this organization. The Company provided management services to Maple Star Colorado, Inc. under a management agreement for consideration in the amount of approximately $311, $302 and $258 for the years ended December 31, 2014, 2013 and 2012, respectively. Amounts due to the Company from Maple Star Colorado, Inc. for reimbursable expenses and management services provided to it by the Company at December 31, 2014 and 2013 were approximately $489 and $220, respectively.
The Company operates a call center in Phoenix, Arizona. The building in which the call center is located was leased to the Company from VWP McDowell, LLC (“McDowell”) until July 2014, at which time McDowell sold its interest in the property. Certain immediate family members of the Chief Executive Officer of LogistiCare have a partial ownership interest in McDowell. In the aggregate these family members own an approximately 13% interest in McDowell directly and indirectly through a trust. For 2014, 2013 and 2012, the Company expensed approximately $234, $412 and $417, respectively, in lease payments to McDowell.
On October 23, 2014, we issued to Coliseum Capital Management, LLC and certain of its affiliates (“Coliseum”), a related party, a 14.0% Unsecured Subordinated Note in aggregate principal amount of $65,500 (the “Note”). Interest from the issuance date to, but excluding, the 120th day after the issuance date, was paid in cash in the amount of $3,015 on the issuance of the Note. Coliseum held approximately 15% of our outstanding common stock as of October 23, 2014 and is our largest shareholder. Additionally, Christopher Shackelton, who serves as our Chairman of the board of directors, is also a Managing Partner at Coliseum Capital Management, LLC.
The Note was repaid in full on February 11, 2015, with the proceeds from a registered Rights Offering (“Rights Offering”) and related standby purchase commitment described below, which allowed all of the Company’s existing common stock holders the non-transferrable right to purchase their pro rata share of $65,500 of convertible preferred stock at a price of $100.00 per share, as further described below. As such, the Note was classified as a current liability at December 31, 2014.
In connection with the anticipated Rights Offering, on October 23, 2014, the Company entered into a standby purchase agreement (the “Standby Purchase Agreement”) with Coliseum, pursuant to which Coliseum agreed to purchase, substantially simultaneously with the completion of the Rights Offering, in the aggregate, all of the available preferred stock not otherwise sold in the Rights Offering following the exercise of the subscription privileges of holders of the Company’s common stock. As consideration for entering into the Standby Purchase Agreement, on October 23, 2014, the Company paid Coliseum a fee of $2,947, which is included in “Prepaid expenses and other” in the consolidated balance sheet at December 31, 2014. In addition Coliseum had the additional right, exercisable within 30 days following the completion of the Rights Offering, to purchase additional preferred stock valued at $15,000 at a price per share equal to 105% of the Subscription Price, which was exercised on March 12, 2015.
18. Acquisitions
Ingeus
On May 30, 2014, the Company acquired all of the outstanding equity of Ingeus. The purchase price was comprised of (i) a GBP £35,000, plus adjustments, cash payment on May 30, 2014 ($92,279, after increase for customary adjustments), (ii) contingent consideration of up to GBP £75,000 ($125,978), payable over a five year period, based on the achievement of certain Ingeus milestones including the achievement of certain levels of Ingeus’s earnings before interest, taxes, depreciation and amortization and other defined criteria and (iii) contingent consideration of £5,000 ($8,399) upon successful award of a specified customer contract. In addition, on May 30, 2014, the Company issued restricted shares of the Company’s common stock and payment of cash to the former shareholders of Ingeus with a combined value of GBP £14,346 ($24,097), subject to a vesting schedule of 25% per year over a four year period which is accounted for as a compensatory arrangement. The foreign currency translations above were based on the conversion rate on May 30, 2014.
Ingeus has operations in 10 countries and four continents. It is a workforce development and outsourced services company and a market leader in outsourced employability programs, operating in the social improvement, employment, offender rehabilitation and welfare services markets. The acquisition expands the Company’s presence into international markets, diversifies its customer base, and enhances its workforce development expertise globally.
The Company incurred acquisition and related costs for this acquisition of $4,311 during the year ended December 31, 2014, respectively, which are included in “General and administrative expenses.”
The final purchase price of Ingeus is calculated as follows:
|
Cash purchase of common stock |
$ | 92,279 | ||
|
Adjustment amount (1) |
2,180 | |||
|
Fair value of contingent consideration |
29,893 | |||
|
Total purchase price |
$ | 124,352 |
The table below presents Ingeus’s net assets based upon final assessment of their respective fair values:
|
Cash |
$ | 37,159 | ||
|
Accounts receivable |
34,125 | |||
|
Other current assets |
14,343 | |||
|
Property and equipment |
10,501 | |||
|
Intangibles |
65,700 | |||
|
Goodwill (2) |
35,484 | |||
|
Current liabilities |
(49,026 | ) | ||
|
Other non-current liabilities |
(23,934 | ) | ||
|
Total |
$ | 124,352 |
| (1) | Includes final working capital and other closing account true-ups. | |||||
| (2) | The goodwill was allocated to the Company's WD Services segment. The goodwill is not expected to be deductible for tax purposes. Goodwill includes the value of the purchased assembled workforce. | |||||
The fair value of intangible assets is as follows:
|
Type |
Life ( in Years) |
Value |
|||||||
|
Customer relationships |
Amortizable |
10 | $ | 43,700 | |||||
|
Trademarks and trade names |
Amortizable |
10 | 18,000 | ||||||
|
Developed technology |
Amortizable |
5 | 4,000 | ||||||
| 9.7* | $ | 65,700 | |||||||
|
*Weighted-average amortization period |
|||||||||
Matrix
On October 23, 2014, the Company acquired all of the outstanding equity of CCHN Group Holdings, Inc. (“CCHN”), the parent company of Community Care Health Network, Inc. (dba Matrix Medical Network ), pursuant to an Agreement and Plan of Merger (the “Merger Agreement”), dated as of September 17, 2014, referred to herein as the Matrix Acquisition.
Pursuant to the Merger Agreement, the Company paid consideration of $352,147 in cash (including working capital adjustments) and 946,723 shares of the Company’s common stock (with an aggregate value of $40,000 based on the closing price of the Company’s common stock on the NASDAQ Stock Market on September 17, 2014). Pursuant to the Merger Agreement, at the Closing, subject to the escrow arrangements described in the Merger Agreement, each share of CCHN then outstanding immediately prior to the closing and each vested stock option of CCHN then outstanding immediately prior to the closing was converted into the right to receive the merger consideration described above. The cash required to complete the Matrix Acquisition and fund certain related expenses was derived from (1) the cash proceeds from the new $250,000 term loan under the Second Amendment to the Credit Agreement (as discussed above), (2) the cash proceeds from an approximately $23,400 draw down from the Company’s revolving credit facility, (3) the cash proceeds from the issuance of the Note (as discussed above) and (4) approximately $48,000 of cash on hand. The cash consideration paid for CCHN is subject to certain customary adjustments for working capital purposes.
Matrix is a provider of CHAs for MA health plans and risk bearing providers with a national footprint across 33 states. The acquisition expands the Company's clinical capabilities and home based services with the addition of operations which include approximately 800 nurse practitioners at December 31, 2014.
The Company incurred acquisition and related costs for this acquisition of $7,360 during year ended December 31, 2014, which are included in “General and administrative expenses.”
The preliminary purchase price of Matrix is calculated as follows:
|
Cash purchase of common stock (including working capital adjustment) |
$ | 352,147 | ||
|
Equity consideration (valued using October 23, 2014 stock price) |
38,569 | |||
|
Total estimated purchase price |
$ | 390,716 |
The table below presents Matrix’s net assets based upon a preliminary estimate of their respective fair values:
|
Accounts receivable (1) |
$ | 22,108 | ||
|
Other current assets |
11,371 | |||
|
Property and equipment |
5,099 | |||
|
Intangibles |
247,300 | |||
|
Goodwill (2) |
210,576 | |||
|
Other non-current assets |
3,953 | |||
|
Deferred taxes, net |
(83,677 | ) | ||
|
Accounts payable and accrued liabilities |
(25,460 | ) | ||
|
Other non-current liabilities |
(554 | ) | ||
|
Total |
$ | 390,716 |
| (1) |
The fair value of trade accounts receivable acquired in this transaction was determined to be approximately $22,108. The gross amount due with respect to these receivables is approximately $23,307, of which approximately $1,199 is expected to be uncollectible. | |
| (2) |
The goodwill was allocated to the Company's HA Services segment. Goodwill totaling $995 is expected to be deductible for tax purposes. Goodwill includes the value of the purchased assembled workforce. | |
The above fair value estimates represent the preliminary fair value estimates as the valuation of intangible assets has not been finalized.
The preliminary fair value of intangible assets is as follows:
|
Type |
Life (in Years) |
Value |
|||||||
|
Trademarks and trade names |
Indefinite Lived |
N/A | $ | 25,900 | |||||
|
Customer relationships |
Amortizable |
10 | 181,100 | ||||||
|
Developed technology |
Amortizable |
5 | 40,300 | ||||||
| 9.1* | $ | 247,300 | |||||||
|
*Weighted-average amortization period for intangible assets with definite lives | |
Pro forma information
The amounts of Ingeus’s and Matrix’s revenue and net income included in the Company’s condensed consolidated statements of income for the year ended December 31, 2014, and the unaudited pro forma revenue and net income of the combined entity had the acquisition date been January 1, 2013, are:
|
Year ended December 31, |
||||||||
|
2014 |
2013 |
|||||||
|
Actual Ingeus: |
||||||||
|
Revenue |
$ | 179,307 | $ | - | ||||
|
Net income |
$ | 13,936 | $ | - | ||||
|
Actual Matrix: |
||||||||
|
Revenue |
$ | 43,331 | $ | - | ||||
|
Net income |
$ | 1,348 | $ | - | ||||
|
Proforma: |
||||||||
|
Revenue |
$ | 1,801,696 | $ | 1,636,248 | ||||
|
Net income |
$ | 43,868 | $ | 20,103 | ||||
|
Diluted earnings per share |
$ | 2.74 | $ | 1.31 | ||||
The pro forma information above for the year ended December 31, 2014 includes the elimination of acquisition related costs. Adjustments for all periods include compensation and stock-based compensation expense related to employment agreements effective upon consummation of the acquisitions, additional interest expense on the debt issued to finance the acquisitions, amortization and depreciation expense based on the estimated fair value and useful lives of intangible assets and property and equipment and related tax effects. The pro forma financial information is not necessarily indicative of the results of operations that would have occurred had the transaction been affected on January 1, 2013.
Additionally, during the second and fourth quarters of 2014, the Company acquired two human services businesses through asset purchase agreements. The Company has not disclosed purchase information or the pro forma impact of these acquisitions as it is immaterial to the Company’s financial position and results of operations.
19. Business Segments
The Company’s operations are organized and reviewed by management along its service lines. Historically, the Company has operated in two segments, Human Services and NET Services. With the acquisitions of Ingeus and Matrix in the second and fourth quarters of 2014, respectively, the Company created two additional segments, WD Services and HA Services. Human Services includes government sponsored home and community based counseling, foster care and not-for-profit management services. NET Services includes managing the delivery of non-emergency transportation services. WD Services includes workforce development and outsourced employability programs and HA Services provides CHAs for MA health plans in enrolled members’ homes or nursing facilities.
Segment asset disclosures include property and equipment and other intangible assets. The accounting policies of the Company’s segments are substantially the same as those of the consolidated Company. The Company evaluates performance based on operating income. Operating income is revenue less operating expenses (including cost of non-emergency transportation services, client service expense, cost of workforce development services, cost of health assessment services, general and administrative expense, depreciation and amortization, and asset impairment charges) and is not affected by other income/expense or by income taxes. Other income/expense consists principally of interest expense, loss on extinguishment of debt and interest income. In calculating operating income for each segment, general and administrative expenses incurred at the corporate level are allocated to each segment based upon their relative direct expense levels excluding costs for purchased services. Corporate costs include corporate executive management, corporate accounting and finance, information technology, external audit, tax compliance, business development, cost reporting compliance, internal audit, employee training, legal and various other overhead costs. Corporate depreciation is allocated to operating segments, however, the related property and equipment are not allocated. All intercompany transactions have been eliminated.
The following table sets forth certain financial information attributable to the Company’s business segments for the years ended December 31, 2014, 2013 and 2012. In addition, none of the segments have significant non-cash items other than asset impairment charges and depreciation and amortization charges in operating income.
|
For the year ended December 31, 2014 |
||||||||||||||||||||||||
|
NET |
Human |
WD |
HA |
Consolidated |
||||||||||||||||||||
|
Services |
Services (b) |
Services |
Services |
Corporate (a) |
Total |
|||||||||||||||||||
|
Revenues |
$ | 884,287 | $ | 374,245 | $ | 179,308 | $ | 43,331 | $ | - | $ | 1,481,171 | ||||||||||||
|
Depreciation and amortization |
7,699 | 8,268 | 7,902 | 5,619 | - | 29,488 | ||||||||||||||||||
|
Operating income |
56,804 | (19,597 | ) | 5,990 | (857 | ) | - | 42,340 | ||||||||||||||||
|
Net interest expense |
4,002 | (279 | ) | 2,205 | 8,672 | - | 14,600 | |||||||||||||||||
|
Total assets |
279,633 | 171,456 | 176,134 | 506,069 | 31,953 | 1,165,245 | ||||||||||||||||||
|
Long-lived asset expenditures |
12,477 | 13,451 | 104,572 | 459,991 | 1,981 | 592,472 | ||||||||||||||||||
|
For the year ended December 31, 2013 |
||||||||||||||||||||||||
|
NET |
Human |
WD |
HA |
Consolidated |
||||||||||||||||||||
|
Services |
Services (b) |
Services |
Services |
Corporate (a) |
Total |
|||||||||||||||||||
|
Revenues |
$ | 770,246 | $ | 352,436 | $ | - | $ | - | $ | - | $ | 1,122,682 | ||||||||||||
|
Depreciation and amortization |
7,725 | 7,147 | - | - | - | 14,872 | ||||||||||||||||||
|
Operating income |
37,994 | 640 | - | - | - | 38,634 | ||||||||||||||||||
|
Net interest expense |
6,698 | 196 | - | - | - | 6,894 | ||||||||||||||||||
|
Loss on extinguishment of debt |
260 | 265 | - | - | - | 525 | ||||||||||||||||||
|
Total assets |
247,666 | 140,964 | - | - | 36,128 | 424,758 | ||||||||||||||||||
|
Long-lived asset expenditures |
5,308 | 2,538 | - | - | 3,326 | 11,172 | ||||||||||||||||||
|
For the year ended December 31, 2012 |
||||||||||||||||||||||||
|
NET |
Human |
WD |
HA |
Consolidated |
||||||||||||||||||||
|
Services |
Services (b) |
Services |
Services |
Corporate (a) |
Total |
|||||||||||||||||||
|
Revenues |
$ | 750,658 | $ | 355,231 | $ | - | $ | - | $ | - | $ | 1,105,889 | ||||||||||||
|
Depreciation and amortization |
7,615 | 7,408 | - | - | - | 15,023 | ||||||||||||||||||
|
Operating income |
23,494 | 707 | - | - | - | 24,201 | ||||||||||||||||||
|
Net interest expense (income) |
7,569 | (61 | ) | - | - | - | 7,508 | |||||||||||||||||
|
Total assets |
216,698 | 145,770 | - | - | 29,269 | 391,737 | ||||||||||||||||||
|
Long-lived asset expenditures |
6,271 | 2,489 | - | - | 762 | 9,522 | ||||||||||||||||||
|
|
|
||||||||||||||
| (a) | Corporate costs have been allocated to the four operating segments. | ||||||||||||||
| (b) | Excludes intersegment revenues of approximately $300, $326 and $378 for the years ended December 31, 2014, 2013 and 2012, respectively, that have been eliminated in consolidation. | ||||||||||||||
The following table details the Company’s revenues, net income and long-lived assets by geographic location.
| For the year ended December 31, 2014 | ||||||||||||||||
|
United |
United |
Other |
Consolidated |
|||||||||||||
|
States (a) |
Kingdom |
Foreign |
Total |
|||||||||||||
|
Revenue |
$ | 1,290,709 | $ | 139,065 | $ | 51,397 | $ | 1,481,171 | ||||||||
|
Long-lived assets (c) |
47,614 | 7,292 | 2,242 | 57,148 | ||||||||||||
| For the year ended December 31, 2013 | ||||||||||||||||
|
United |
United |
Other |
Consolidated |
|||||||||||||
|
States (a) |
Kingdom |
Foreign (b) |
Total |
|||||||||||||
|
Revenue |
$ | 1,112,120 | $ | - | $ | 10,562 | $ | 1,122,682 | ||||||||
|
Long-lived assets (c) |
32,279 | - | 430 | 32,709 | ||||||||||||
| For the year ended December 31, 2012 | ||||||||||||||||
|
United |
United |
Other |
Consolidated |
|||||||||||||
|
States (a) |
Kingdom |
Foreign (b) |
Total |
|||||||||||||
|
Revenue |
$ | 1,091,778 | $ | - | $ | 14,111 | $ | 1,105,889 | ||||||||
|
Long-lived assets (c) |
29,692 | - | 688 | 30,380 | ||||||||||||
|
(a) |
Additionally, both segments, on an aggregate basis, derived approximately 10.1%, 10.5% and 10.3% of the Company’s consolidated revenue from the State of New Jersey for the years ended December 31, 2014, 2013 and 2012, respectively. |
|
(b) |
Consists of Canadian operations. | |
| (c) | Represents property and equipment, net. |
20. Quarterly Results (Unaudited)
|
Quarter ended |
||||||||||||||||
|
March 31, |
June 30, |
September 30, |
December 31, |
|||||||||||||
|
2013 |
2013 |
2013 |
2013 |
|||||||||||||
|
Revenues |
$ | 281,487 | $ | 287,637 | $ | 276,713 | $ | 276,845 | ||||||||
|
Operating income |
13,105 | 11,453 | 7,976 | 6,100 | (1) | |||||||||||
|
Net income |
6,678 | 5,876 | 3,527 | 3,357 | (1)(2) | |||||||||||
|
Earnings per share: |
||||||||||||||||
|
Basic |
$ | 0.51 | $ | 0.44 | $ | 0.26 | $ | 0.24 | ||||||||
|
Diluted |
$ | 0.49 | $ | 0.43 | $ | 0.25 | $ | 0.24 | ||||||||
|
Quarter ended |
||||||||||||||||
|
March 31, |
June 30, |
September 30, |
December 31, |
|||||||||||||
|
2014 |
2014 (4) | 2014 | 2014 (6) | |||||||||||||
|
Revenues |
$ | 289,403 | $ | 343,953 | $ | 394,218 | $ | 453,597 | ||||||||
|
Operating income |
$ | 12,120 | (3) | $ | 13,524 | (3) | $ | 1,673 | (3)(5) | $ | 15,023 | (3)(7) | ||||
|
Net income |
$ | 6,287 | (3) | $ | 6,672 | (3) | $ | 266 | (3)(5) | $ | 7,050 | (3)(7) | ||||
|
Earnings per share: |
||||||||||||||||
|
Basic |
$ | 0.45 | $ | 0.47 | $ | 0.02 | $ | 0.46 | ||||||||
|
Diluted |
$ | 0.44 | $ | 0.46 | $ | 0.02 | $ | 0.45 | ||||||||
|
(1) |
The fourth quarter of 2013 includes a charge of approximately $1,277 for severance and related payments (net of the benefit of forfeiture of stock based compensation) for two executive officers and one key employee. |
|
(2) |
The tax provision in the fourth quarter of 2013 included a favorable tax adjustment for the tax treatment of certain equity compensation expenses resulting in a quarterly effective income tax rate of 25.8%. |
|
(3) |
Includes acquisition costs of approximately $1,829, $2,496, $3,686 and $3,827, for the quarters ending March 31, 2014, June 30, 2014, September 30, 2014 and December 31, 2014, respectively. |
|
(4) |
The Company purchased Ingeus on May 30, 2014. Ingeus operations were included beginning in the second quarter of 2014. |
|
(5) |
Includes approximately $3,294 of compensation expense related to the immediate vesting of certain equity based compensation awards granted in the third quarter of 2014. |
|
(6) |
The Company purchased Matrix on October 23, 2014. Matrix operations were included beginning in the fourth quarter of 2014. |
| (7) | Includes a gain due to a change in the estimated fair value of contingent consideration of $16,314. |
21. Subsequent Events
As discussed further in Note 8, the Company completed a Rights Offering, on February 5, 2015, allowing all of the Company’s existing common stock holders the non-transferrable right to purchase their pro rata share of $65,500 of convertible preferred stock at a price equal to $100.00 per share. The convertible preferred stock is convertible into shares of Providence’s common stock at a conversion price equal to $39.88, which was the closing price of the Company’s common stock on the NASDAQ Global Select Market on October 22, 2014.
Stockholders exercised subscription rights to purchase 130,884 shares of the Company's convertible preferred stock. Pursuant to the terms and conditions of the Standby Purchase Agreement between Coliseum Capital Partners, L.P., Coliseum Capital Partners II, L.P., Coliseum Capital Co-Invest, L.P. and Blackwell Partners, LLC (collectively, the "Standby Purchasers") and the Company, the remaining 524,116 shares the Company's preferred stock was purchased by Standby Purchasers at the $100.00 per share subscription price. The Standby Purchasers beneficially own approximately 94% of the Company's outstanding convertible preferred stock after giving effect to the Rights Offering and the Standby Purchase Agreement. The Company received $65,500 in aggregate gross proceeds from the consummation of the Rights Offering and Standby Purchase Agreement, which it used on February 11, 2015 to repay the unsecured subordinated bridge note entered into with the Standby Purchasers to finance a portion of the Matrix acquisition.
Additionally, on March 12, 2015, the Standby Purchasers exercised their right to purchase an additional 150,000 shares of the Company’s convertible preferred stock.
The Company may pay a noncumulative cash dividend on each share of convertible preferred stock, when, as and if declared by its board of directors, at the rate of five and one-half percent (5.5%) per annum on the liquidation preference then in effect. Following the issue date of the convertible preferred stock, on or before the third business day immediately preceding each fiscal quarter, the Company will determine our intention whether or not to pay a cash dividend with respect to that ensuing quarter and will give notice of our intention to each holder of convertible preferred stock as soon as practicable thereafter.
In the event the Company does not declare and pay a cash dividend, the liquidation preference will be increased to an amount equal to the liquidation preference in effect at the start of the applicable dividend period, plus an amount equal to such then applicable liquidation preference multiplied by eight and one-half percent (8.5%) per annum, computed on the basis of a 365-day year and the actual number of days elapsed from the start of the applicable dividend period to the applicable date of determination.
Cash dividends will be payable quarterly in arrears on January 1, April 1, July 1 and October 1 of each year, commencing on the first calendar day of the first January, April, July or October following the date of original issuance of the convertible preferred stock, and, if declared, will begin to accrue on the first day of the applicable dividend period. Paid in kind (“PIK”) dividends, if applicable, will accrue and be cumulative on the same schedule as set forth above for cash dividends and will also be compounded at the applicable annual rate on each applicable subsequent dividend date. PIK dividends are paid upon the occurrence of a liquidation event, conversion or redemption in accordance with the terms of the convertible preferred stock.
|
Item 9. |
Changes in and Disagreements With Accountants on Accounting and Financial Disclosure. |
None.
|
Item 9A. |
Controls and Procedures. |
(a) Evaluation of disclosure controls and procedures
The Company, under the supervision and with the participation of its management, including its principal executive officer and principal financial officer, evaluated the effectiveness of the design and operation of its disclosure controls and procedures, as defined in Rule 13a-15(e) of the Securities Exchange Act of 1934, as amended (the “Exchange Act”) as of the end of the period covered by this report (December 31, 2014) (“Disclosure Controls”). The scope of management’s assessment of the effectiveness of internal control over financial reporting includes all of our businesses except for Ingeus and Matrix, which were acquired on May 30, 2014 and October 23, 2014, respectively, and whose combined financial statements represent 11.8% of total assets and 15.0% of revenues as of and for the year ended December 31, 2014. See Note 18 to the accompanying consolidated financial statements for further discussion of these acquisitions. Based upon the Disclosure Controls evaluation, the principal executive officer and principal financial officer have concluded that the Disclosure Controls are effective in reaching a reasonable level of assurance that (i) information required to be disclosed by the Company in the reports that it files or submits under the Exchange Act is recorded, processed, summarized and reported within the time periods specified in the Securities and Exchange Commission’s rules and forms and (ii) information required to be disclosed by the Company in the reports that it files or submits under the Exchange Act is accumulated and communicated to the Company’s management, including its principal executive and principal financial officers, or persons performing similar functions, as appropriate to allow timely decisions regarding required disclosure.
(b) Changes in internal controls
The principal executive officer and principal financial officer also conducted an evaluation of the Company’s internal control over financial reporting (“Internal Control”) to determine whether any changes in Internal Control occurred during the quarter ended December 31, 2014 that have materially affected or which are reasonably likely to materially affect Internal Control. Based on that evaluation, other than changes relating to the acquisitions of Ingeus and Matrix, there has been no such change during the quarter ended December 31, 2014.
(c) Limitations on the Effectiveness of Controls
Control systems, no matter how well conceived and operated, are designed to provide a reasonable, but not an absolute, level of assurance that the objectives of the control system are met. Further, the design of a control system must reflect the fact that there are resource constraints, and the benefits of controls must be considered relative to their costs. Because of the inherent limitations in all control systems, no evaluation of controls can provide absolute assurance that all control issues and instances of fraud, if any, within the Company have been detected. Because of the inherent limitations in a cost-effective control system, misstatements due to error or fraud may occur and not be detected. The Company conducts periodic evaluations of its internal controls to enhance, where necessary, its procedures and controls.
(d) Management’s report on internal control over financial reporting
Management’s report on internal control over financial reporting is presented in Part II, Item 8, of this report and is hereby incorporated by reference.
(e) Audit report of the independent registered public accounting firm
The audit report of the independent registered public accounting firm is presented in Part II, Item 8, of this report and is hereby incorporated by reference.
|
Item 9B. |
Other Information. |
None.
PART III
|
Item 10. |
Directors, Executive Officers and Corporate Governance. |
This Item is incorporated by reference to our definitive proxy statement on Schedule 14A for our 2015 stockholder meeting; provided that if such proxy statement is not filed on or before April 30, 2015, such information will be included in an amendment to this Report on Form 10-K filed on or before such date.
Code of Ethics
We have adopted a code of ethics that applies to our senior management, including our chief executive officer, chief financial officer, controller and persons performing similar functions. Copies of our code of ethics are available without charge upon written request directed to Ann Mullen, Ethics Program Manager, at The Providence Service Corporation, 64 East Broadway Blvd., Tucson, AZ, 85701.
|
Item 11. |
Executive Compensation. |
This Item is incorporated by reference to our definitive proxy statement on Schedule 14A for our 2015 stockholder meeting; provided that if such proxy statement is not filed on or before April 30, 2015, such information will be included in an amendment to this Report on Form 10-K filed on or before such date.
|
Item 12. |
Security Ownership of Certain Beneficial Owners and Management and Related Stockholder Matters. |
This Item is incorporated by reference to our definitive proxy statement on Schedule 14A for our 2015 stockholder meeting; provided that if such proxy statement is not filed on or before April 30, 2015, such information will be included in an amendment to this Report on Form 10-K filed on or before such date.
|
Item 13. |
Certain Relationships and Related Transactions, and Director Independence. |
This Item is incorporated by reference to our definitive proxy statement on Schedule 14A for our 2015 stockholder meeting; provided that if such proxy statement is not filed on or before April 30, 2015, such information will be included in an amendment to this Report on Form 10-K filed on or before such date.
|
Item 14. |
Principal Accounting Fees and Services. |
This Item is incorporated by reference to our definitive proxy statement on Schedule 14A for our 2015 stockholder meeting; provided that if such proxy statement is not filed on or before April 30, 2015, such information will be included in an amendment to this Report on Form 10-K filed on or before such date.
PART IV
|
Item 15. |
Exhibits, Financial Statement Schedules. |
(a)(1) Financial Statements
The following consolidated financial statements including footnotes are included in Item 8.
|
|
• |
|
Consolidated Balance Sheets at December 31, 2014 and 2013; |
|
|
• |
|
Consolidated Statements of Income for the years ended December 31, 2014, 2013 and 2012; |
|
• |
Consolidated Statements of Comprehensive Income for the years ended December 31, 2014, 2013 and 2012; | ||
|
|
• |
|
Consolidated Statements of Stockholders’ Equity at December 31, 2014, 2013 and 2012; and |
|
|
• |
|
Consolidated Statements of Cash Flows for the years ended December 31, 2014, 2013 and 2012. |
(2) Financial Statement Schedules
Schedule II Valuation and Qualifying Accounts
|
Additions |
||||||||||||||||||||
|
Balance at |
Charged to |
Charged to |
Balance at |
|||||||||||||||||
|
beginning of |
costs and |
other |
end of |
|||||||||||||||||
|
period |
expenses |
accounts |
Deductions |
period |
||||||||||||||||
|
Year Ended December 31, 2014: |
||||||||||||||||||||
|
Allowance for doubtful accounts |
$ | 4,217,921 | $ | 2,588,188 | $ | 4,050,943 | (1) | $ | 4,823,389 | (2) | $ | 6,033,663 | ||||||||
|
Deferred tax valuation allowance |
813,836 | 2,219,300 | 11,808,925 | (3) | - | 14,842,061 | ||||||||||||||
|
Year Ended December 31, 2013: |
||||||||||||||||||||
|
Allowance for doubtful accounts |
$ | 3,684,859 | $ | 2,990,850 | $ | 3,467,114 | (1) | $ | 5,924,902 | (2) | $ | 4,217,921 | ||||||||
|
Deferred tax valuation allowance |
629,137 | 184,699 | - | - | 813,836 | |||||||||||||||
|
Year Ended December 31, 2012: |
||||||||||||||||||||
|
Allowance for doubtful accounts |
$ | 5,834,743 | $ | 2,856,156 | $ | 2,741,315 | (1) | $ | 7,747,355 | (2) | $ | 3,684,859 | ||||||||
|
Deferred tax valuation allowance |
448,567 | 180,570 | - | - | 629,137 | |||||||||||||||
Notes:
|
(1) |
Amounts primarily include the allowance for contractual adjustments related to our non-emergency transportation services operating segment that are recorded as adjustments to non-emergency transportation services revenue as well as certain reclassifications within the “Accounts Receivable” line item of the consolidated balance sheets made to conform with the current period presentation of the allowance for doubtful accounts in this schedule related to our correctional services business. Item also includes beginning balances related to acquired entities. |
|
(2) |
Write-offs, net of recoveries |
| (3) | Includes beginning balances for acquired entities. |
All other schedules are omitted because they are not applicable or the required information is shown in our financial statements or the related notes thereto.
(3) Exhibits
|
Exhibit Number |
|
Description | |
|
2.1(19) |
Share Sale Agreement, dated as of March 31, 2014, by and among The Providence Service Corporation, Pinnacle Australia Holdco Pty Ltd, Thérèse Virginia Rein, Gregory Kenneth Ashmead and GK Ashmead Holdings Pty Limited (as trustee of the GK Ashmead Nominees Trust). | ||
|
2.2(19) |
Australian Share Sale Agreement Side Deed, dated as of March 31, 2014, by and among Providence, Pinnacle Australia Holdco Pty Ltd, Thérèse Virginia Rein, Gregory Kenneth Ashmead, GK Ashmead Holdings Pty Limited (as trustee of the GK Ashmead Nominees Trust) and Deloitte LLP. | ||
|
2.3(21) |
Agreement and Plan of Merger, dated as of September 17, 2014 by and among The Providence Service Corporation, Matrix Acquisition Co., CCHN Group Holdings, Inc. and the Holders' Representative named therein. | ||
|
3.1(1) |
|
Second Amended and Restated Certificate of Incorporation of The Providence Service Corporation, including Certificate of Designation of Series A Junior Participating Preferred Stock, as filed with the Secretary of State of Delaware on December 9, 2011. | |
|
3.2(2) |
|
Amended and Restated Bylaws of The Providence Service Corporation, effective March 10, 2010. | |
|
3.3(17) |
Certificate of Elimination of Series A Junior Participating Preferred Stock of the Providence Service Corporation, dated as of March 27, 2014. | ||
|
4.1(3) |
|
Convertible Senior Subordinated Note Indenture, dated November 13, 2007, between The Providence Service Corporation and The Bank of New York Trust Company, N.A., as Trustee. | |
|
4.2(4) |
|
Form of Note (included as Exhibit A to the Indenture, listed as Exhibit 4.1 hereto). | |
| 4.3(5) | Amended and Restated Rights Agreement, dated as of December 9, 2011, by and between The Providence Service Corporation and Computershare Trust Company, N.A., as Rights Agent. | ||
| 4.4(17) | Amendment and Termination of Rights Agreement, dated as of March 27, 2014, by and between The Providence Service Corporation and Computershare Trust Company, N.A., as Rights Agent. | ||
|
+10.1(6) |
|
The Providence Service Corporation Stock Option and Incentive Plan, as amended. | |
|
+10.2(7) |
|
2003 Stock Option Plan, as amended. | |
|
+10.3(8) |
|
The Providence Service Corporation 2006 Long-Term Incentive Plan, as amended. | |
|
+10.4(9) |
Amended and Restated Providence Service Corporation Deferred Compensation Plan. | ||
|
10.5(3) |
|
Registration Rights Agreement, dated November 13, 2007, by and among The Providence Service Corporation and the Purchasers named therein. | |
|
10.6(13) |
Amended and Restated Credit and Guaranty Agreement dated as of August 2, 2013 among The Providence Service Corporation, Bank of America, N.A. SunTrust Bank, BMO Harris Bank, Merrill Lynch, Pierce, Fenner & Smith Incorporated and SunTrust Robinson Humphrey, Inc. | ||
|
10.7(13) |
Amended and Restated Pledge Agreement dated as of August 2, 2013 by and among The Providence Service Corporation (including its subsidiaries) and Bank of America, N.A., as administrative agent. | ||
|
10.8(13) |
Amended and Restated Security Agreement, dated as of August 2, 2013, by and among The Providence Service Corporation (including its subsidiaries) and Bank of America, N.A., as administrative agent. | ||
|
10.9(20) |
First Amendment to Amended and Restated Credit and Guaranty Agreement and Consent, dated as of May 28, 2014, among The Providence Service Corporation, the Guarantors named therein, the New Subsidiaries named therein, Bank of America, N.A., the Lenders named therein and HSBC Bank USA, National Association. | ||
|
10.10(22) |
Second Amendment, dated as of October 23, 2014, to the Amended and Restated Credit and Guaranty Agreement, dated as of August 3, 2012by and among The Providence Service Corporation, the Guarantors stated therein, Bank of America, N.A., SunTrust Bank, Royal Bank of Canada, BMO Harris Bank, N.A., HSBC Bank USA, National Association, the other Lenders named therein, the New Lenders named therein, Merrill Lynch, Pierce, Fenner & Smith Incorporated, SunTrust Robinson Humphrey, Inc., and RBC Capital Markets. | ||
|
10.11(22) |
14.0% Unsecured Subordinated Note, dated October 23, 2014, by and among The Providence Service Corporation, Coliseum Capital Partners, L.P., Coliseum Capital Partners II, L.P., Coliseum Capital Co-Invest, L.P., and Blackwell Partners, LLC. | ||
|
10.12(22) |
Standby Purchase Agreement, dated October 23, 2014, by and among The Providence Service Corporation, Coliseum Capital Partners, L.P., Coliseum Capital Partners II, L.P., Coliseum Capital Co-Invest, L.P., and Blackwell Partners, LLC. | ||
|
+10.13(10) |
|
Amended and Restated Employment Agreement dated May 17, 2011 between The Providence Service Corporation and Fred D. Furman. | |
|
+10.14(15) |
Separation and General Release Agreement dated December 31, 2013 between The Providence Service Corporation and Fred D. Furman. | ||
|
+10.15(10) |
Amended and Restated Employment Agreement dated May 17, 2011 between The Providence Service Corporation and Craig A. Norris. | ||
|
+10.16(12) |
|
Employment Agreement dated May 7, 2013 between The Providence Service Corporation and Warren S. Rustand. | |
|
+10.17(14) |
Employment Agreement dated September 13, 2013 between The Providence Service Corporation and Robert E. Wilson. | ||
|
+10.18(16) |
Letter Agreement dated March 14, 2014, amending the Amended and Restated Employment Agreement, dated May 17, 2011 between The Providence Service Corporation and Craig A. Norris. | ||
|
+10.18(18) |
Employment Agreement dated March 24, 2014 between The Providence Service Corporation and Herman Schwarz. | ||
|
+10.19(20) |
Executive Service Agreement, dated as of April 10, 2014, by and between Ingeus Europe Limited and Thérèse Rein. | ||
|
+10.20(11) |
Form of Restricted Stock Agreements, as amended. | ||
|
+10.21(11) |
|
Form of Stock Option Agreements. | |
|
+10.22(11) |
Form of 2011 Performance Restricted Stock Unit Agreements. | ||
|
+10.23(1) |
|
Form of 2012 Performance Restricted Stock Unit Agreements. | |
|
+10.24(12) |
Form of 2013 Performance Restricted Stock Unit Agreements. | ||
|
*12.1 |
|
Statement re Computation of Ratios of Earnings to Fixed Charges. | |
|
*21.1 |
|
Subsidiaries of the Registrant. | |
|
*23.1 |
|
Consent of KPMG LLP. | |
|
*31.1 |
|
Certification pursuant to Securities Exchange Act Rules 13a-14 and 15d-14 of the Chief Executive Officer. | |
| *31.2 | Certification pursuant to Securities Exchange Act Rules 13a-14 and 15d-14 of the Chief Financial Officer. | ||
| *32.1 | Certification pursuant to 18 U.S.C Section 1350, as adopted pursuant to Section 906 of the Sarbanes-Oxley Act of 2002, of the Chief Executive Officer. | ||
| *32.2 | Certification pursuant to 18 U.S.C Section 1350, as adopted pursuant to Section 906 of the Sarbanes-Oxley Act of 2002, of the Chief Financial Officer. | ||
|
101. INS |
XBRL Instance Document | |
|
101.SCH |
XBRL Schema Document | |
|
101.CAL |
XBRL Calculation Linkbase Document | |
|
101.LAB |
XBRL Label Linkbase Document | |
|
101.PRE |
XBRL Presentation Linkbase Document | |
|
101.DEF |
XBRL Definition Linkbase Document | |
|
+ |
Management contract or compensatory plan or arrangement. |
|
* |
Filed herewith |
|
(1) |
Incorporated by reference from an exhibit to the registrant’s annual report on Form 10-K for the year ended December 31, 2011 filed with the Securities and Exchange Commission on March 15, 2012. |
|
(2) |
Incorporated by reference from an exhibit to the registrant’s annual report on Form 10-K for the year ended December 31, 2009 filed with the Securities and Exchange Commission on March 12, 2010. |
|
(3) |
Incorporated by reference from an exhibit to the registrant’s current report on Form 8-K filed with the Securities and Exchange Commission on November 15, 2007. |
|
(4) |
Incorporated by reference from an exhibit to the registrant’s current report on Form 8-K filed with the Securities and Exchange Commission on November 7, 2007. |
|
(5) |
Incorporated by reference from an exhibit to the registrant’s current report on Form 8-K filed with the Securities and Exchange Commission on December 9, 2011. |
|
(6) |
Incorporated by reference from an exhibit to the registrant’s registration statement on Form S-1 (Registration No. 333-106286) filed with the Securities Exchange Commission on June 19, 2003. |
|
(7) |
Incorporated by reference from an exhibit to the registrant’s quarterly report on Form 10-Q for the quarter ended June 30, 2005 filed with the Securities and Exchange Commission on August 9, 2005. |
|
(8) |
Incorporated by reference from an appendix to the registrant’s definitive proxy statement on Schedule 14A filed with the Securities and Exchange Commission on April 20, 2011. |
|
(9) |
Incorporated by reference from an exhibit to the registrant’s annual report on Form 10-K for the year ended December 31, 2009 filed with the Securities and Exchange Commission on March 11, 2011. |
|
(10) |
Incorporated by reference from an exhibit to the registrant’s current report on Form 8-K filed with the Securities and Exchange Commission on May 19, 2011. |
|
(11) |
Incorporated by reference from an exhibit to the registrant’s quarterly report on Form 10-Q for the quarter ended March 31, 2011 filed with the Securities and Exchange Commission on May 6, 2011. |
|
(12) |
Incorporated by reference from an exhibit to the registrant’s quarterly report on Form 10-Q for the quarter ended March 31, 2013 filed with the Securities and Exchange Commission on May 10, 2013. |
| (13) | Incorporated by reference from an exhibit to the registrant’s current report on Form 8-K filed with the Securities and Exchange Commission on August 5, 2013. |
| (14) | Incorporated by reference from an exhibit to the registrant’s current report on Form 8-K filed with the Securities and Exchange Commission on September 17, 2013. |
| (15) | Incorporated by reference from an exhibit to the registrant’s current report on Form 8-K filed with the Securities and Exchange Commission on January 1, 2014. |
| (16) | Incorporated by reference from an exhibit to the registrant’s current report on Form 8-K filed with the Securities and Exchange Commission on March 20, 2014. |
| (17) | Incorporated by reference from an exhibit to the registrant’s current report on Form 8-K filed with the Securities and Exchange Commission on March 27, 2014. |
| (18) | Incorporated by reference from an exhibit to the registrant’s current report on Form 8-K filed with the Securities and Exchange Commission on March 28, 2014. |
| (19) | Incorporated by reference from an exhibit to the registrant’s current report on Form 8-K filed with the Securities and Exchange Commission on April 1, 2014. |
| (20) | Incorporated by reference from an exhibit to the registrant’s current report on Form 8-K filed with the Securities and Exchange Commission on June 3, 2014. |
| (21) | Incorporated by reference from an exhibit to the registrant’s current report on Form 8-K filed with the Securities and Exchange Commission on September 18, 2014. |
| (22) | Incorporated by reference from an exhibit to the registrant’s current report on Form 8-K filed with the Securities and Exchange Commission on October 24, 2014. |
SIGNATURES
Pursuant to the requirements of Section 13 or 15(d) of the Securities Exchange Act of 1934, the registrant has duly caused this report to be signed on its behalf by the undersigned, thereunto duly authorized.
|
THE PROVIDENCE SERVICE CORPORATION | ||
|
By: |
|
/s/ WARREN S. RUSTAND |
|
|
Warren S. Rustand Chief Executive Officer | |
Dated: March 16, 2015
Pursuant to the requirements of the Securities Exchange Act of 1934, this report has been signed below by the following persons on behalf of the registrant and in the capacities and on the dates indicated.
|
Signature |
|
Title |
|
Date |
|
/S/ WARREN S. RUSTAND |
|
Chief Executive Officer and Director |
|
March 16, 2015 |
| Warren S. Rustand | (Principal Executive Officer) | |||
|
/S/ ROBERT E. WILSON |
|
(Principal Financial and Accounting Officer) |
|
March 16, 2015 |
| Robert E. Wilson | ||||
|
/S/ CHRISTOPHER SHACKELTON |
|
Chairman of the Board |
|
March 16, 2015 |
| Christopher Shackelton | ||||
|
/S/ RICHARD A. KERLEY |
|
Director |
|
March 16, 2015 |
| Richard A. Kerley | ||||
|
/S/ KRISTI L. MEINTS |
|
Director |
|
March 16, 2015 |
| Kristi L. Meints | ||||
124