Attached files
| file | filename |
|---|---|
| 8-K - 8-K - Escalera Resources Co. | d397445d8k.htm |
Exhibit 99.1
| 1 Double Eagle Petroleum Co |

| 2 Corporate Information & Disclaimer This presentation may contain projections and other forward-looking statements within the meaning of Section 21E of the Securities Exchange Act of 1934, as amended. Any such projections or statements reflect the Company's current views with respect to future events and financial performance. No assurances can be given, however, that these events will occur or that such projections will be achieved and actual results could differ materially from those projected. A discussion of important factors that could cause actual results to differ materially from those projected, such as decreases in oil and gas prices and/or unexpected decreases in oil and gas production, is included in the Company's periodic reports filed with the Securities and Exchange Commission. Cautionary Note to U.S. Investors - The United States Securities and Exchange Commission permits oil and gas companies, in their filings with the SEC, to disclose proved reserves that a company has demonstrated by actual production or conclusive formation tests to be economically and legally producible under existing economic and operating conditions. Effective for the Company's December 31, 2010 Form 10-K, SEC guidelines were changed to also allow for disclosure of "probable" and "possible" reserves. We have used these terms in this presentation. Investors are urged to consider closely the disclosure in our 2011 Form 10-K, File No. 1-33571, available from us at Double Eagle Petroleum, 1675 Broadway, Suite 2200, Denver, Colorado 80202, attention Investor Relations. You can also obtain this form from the SEC by calling 1-800-SEC-0330. Corporate Office: 1675 Broadway, Suite 2200 Denver, CO 80202 Contact Information: Kurtis Hooley, CFO 303-794-8445 www.dble.com |

| 3 Double Eagle Petroleum Co. Overview HIGHLIGHTS Proved Reserves (a) 136.6 Bcfe Proved Developed 81.6 Bcfe Proved Undeveloped 55.0 Bcfe Total Proved PV-10 ($ in Millions) $154.2 Current Production-6/30/2012, net ~28 Mmcfe/d Cash Flow from Operations (12/31/2011) $24.8M Three Year Avg Prod Costs/Mcfe (c) $1.48 Three Year Reserve Replacement 331% Undeveloped Acreage--net ~ 160,000 Total Niobrara Acreage-net 74,419 Per NSAI 12/31/11 reserve report Includes Production Taxes Double Eagle significant plays |

| 4 Financial Summary Stong Financial Performance Stong Financial Performance Stong Financial Performance Stong Financial Performance Stong Financial Performance Stong Financial Performance Stong Financial Performance Stong Financial Performance Stong Financial Performance Stong Financial Performance Stong Financial Performance Stong Financial Performance $'s in millions Income Statement Summary Income Statement Summary Income Statement Summary Income Statement Summary Balance Sheet Summary Balance Sheet Summary Balance Sheet Summary Balance Sheet Summary Six Months Year ended December 31, Year ended December 31, Year ended December 31, 6/30/2012 2011 2010 As of 6/30/12 Total Revenue $ 18.3 $ 64.7 $ 55.0 Cash $ 2.0 Total Assets Total Assets $ 159.3 EBITDA $ (0.7) $ 37.3 $ 25.1 % Margin -4% 58% 46% Total Bank Debt Total Bank Debt $ 42.0 Clean Earnings (1) $ 6.5 $ 21.1 $ 19.6 Preferred Stock Preferred Stock $ 38.0 Shareholders Equity Shareholders Equity $ 51.4 Net Income (loss)-common stock Net Income (loss)-common stock $ (5.0) $ 8.0 $ 1.8 Total Shares OS Total Shares OS 11,232,542 Cash flow from Operations $ 8.0 $ 24.8 $ 25.0 Working Capital Working Capital $ 10.2 Avg. Daily Production (Mcfe) 28,372 25,598 25,093 Avg Realized Price ($/Mcfe) $ 3.52 $ 4.83 $ 4.25 (1) Clean Earnings adds back to US GAAP net income, income taxes, dda, non-cash g/l on price risk management, share-based compensation expense, impairments, other non-cash items. (1) Clean Earnings adds back to US GAAP net income, income taxes, dda, non-cash g/l on price risk management, share-based compensation expense, impairments, other non-cash items. (1) Clean Earnings adds back to US GAAP net income, income taxes, dda, non-cash g/l on price risk management, share-based compensation expense, impairments, other non-cash items. (1) Clean Earnings adds back to US GAAP net income, income taxes, dda, non-cash g/l on price risk management, share-based compensation expense, impairments, other non-cash items. (1) Clean Earnings adds back to US GAAP net income, income taxes, dda, non-cash g/l on price risk management, share-based compensation expense, impairments, other non-cash items. (1) Clean Earnings adds back to US GAAP net income, income taxes, dda, non-cash g/l on price risk management, share-based compensation expense, impairments, other non-cash items. (1) Clean Earnings adds back to US GAAP net income, income taxes, dda, non-cash g/l on price risk management, share-based compensation expense, impairments, other non-cash items. |

| 5 Proven Execution 2003-2010 SEC Reserves Prepared by Netherland, Sewell & Associates, Inc. as of December 31 for each respective year. With a large inventory of drilling locations, we have been able to consistently grow proved developed reserves by converting our probable reserves to proved reserves |
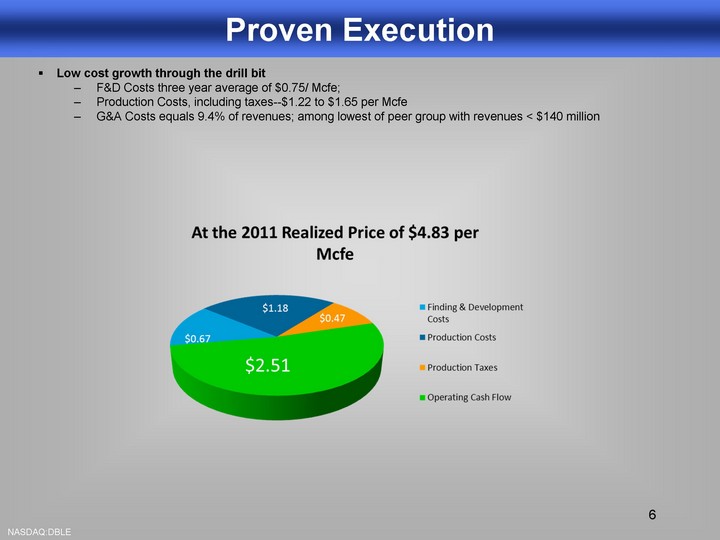
| 6 Proven Execution Low cost growth through the drill bit F&D Costs three year average of $0.75/ Mcfe; Production Costs, including taxes--$1.22 to $1.65 per Mcfe G&A Costs equals 9.4% of revenues; among lowest of peer group with revenues < $140 million |

| Hedge Contracts Past Results of Hedging Hedging Revenue, cash % of total revenue from hedging 2008 $ 4,084 8% 2009 $ 19,244 37% 2010 $ 5,316 11% 2011 $ 10,525 21% 2012 YTD $ 7,061 34% $ 46,230 21% Current Hedging Positions-- 8/1/12 Current Hedging Positions-- 8/1/12 Current Hedging Positions-- 8/1/12 Current Hedging Positions-- 8/1/12 Current Hedging Positions-- 8/1/12 Current Hedging Positions-- 8/1/12 Volume/day (Mcfe) Price Beginning Date End Date Percent of Daily Production 2012 Expirations Natural Gas Swap - NYMEX 10,000 $5.05 1/1/2012 12/31/2012 Natural Gas Swap - NYMEX 5,000 $5.10 1/1/2012 12/31/2012 Natural Gas Swap - NYMEX 6,000 $3.00 8/1/2012 12/31/2012 21,000 75% 2013 Expirations Natural Gas Collar - NYMEX 6,000 $5.00 $5.35 1/1/2013 12/31/2013 Natural Gas Swap - NYMEX 6,000 $5.16 1/1/2013 12/31/2013 Natural Gas Collar - NYMEX 6,000 $3.25 $4.00 1/1/2013 12/31/2013 18,000 64% |

| 8 Proven Execution The Global Hunter Securities 2011 Finding and Development Cost Study of the 100 Largest domestic public Oil and Gas companies. Double Eagle performed very high in all key measurement matrix 2011 2011 3 Yr 3 Yr 5 Yr 5 Yr Rank Rank Rank Drillbit F&D Costs per BOE $ 4.83 3rd $ 5.71 7th $ 7.45 13th Cap-ex as % of Cash Flow 106% 21st 106% 21st 173% 53rd Future Development Costs per BOE $ 4.75 6th $ 4.54 2nd NA NA Reserve Replacement Ratio 331% 38th 331% 38th 329% 38th Debt Adjusted Per Share Reserve Growth 58% 4th 23% 15th NA NA |

| 9 Building Blocks for Shareholder Value Atlantic Rim CBM Midstream Pipeline |

| 10 Growth Strategy Development of Low Cost Assets Catalina CBM Unit (operated)-84 gross (60 net) wells producing 15 Mmcf/d, net; over 190 potential future drilling locations 2011 drilling program up-spaced to 160 spacing; best average production to date with average per well production greater than 700 Mcf/d Spyglass hill CBM (non-operated)-172 gross (37 net) wells producing 5.8 Mmcf/d, net; over 800 future drilling locations Pinedale Anticline (non-operated)--~15 net wells producing 6.2 Mmcfe/d, net; over 200 future drilling locations Exploration Projects Atlantic Rim Niobrara Play-38,000 net acres; performing completion in Q3 2012 Other Niobrara Land Plays-36,000 net acres of additional exploration Main Fork Unit, Utah-2 Tcf potential, farm-out with major in place. 2013/2014 planned assessment |

| 11 Exploration Play-Niobrara Shale Niobrara Basins Double Eagle Acreage Powder River Basin Greater Green River Basin DJ Basin WR Basin Will begin completion Q3 2012 of assessment well in Atlantic Rim Shale thickness up to 1,500' in the Atlantic Rim Heavy natural fracturing based upon prior penetrations 20+ miles of 3D Seismic reprocessed Existing Niobrara production adjacent to Atlantic Rim |
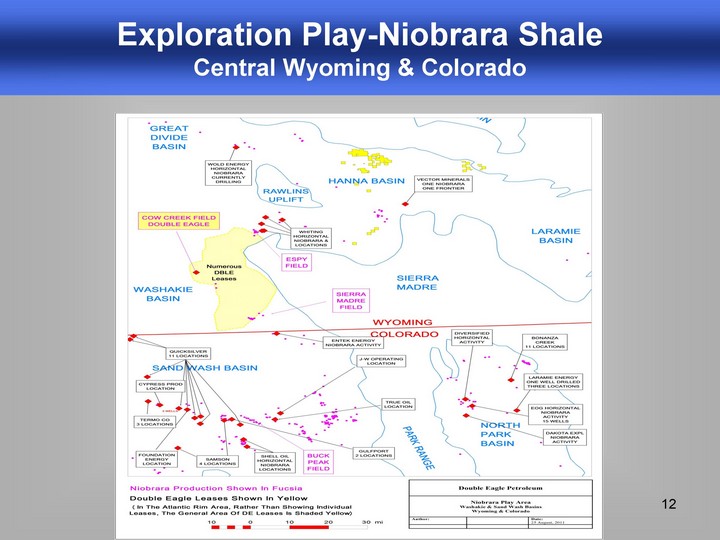
| 12 Exploration Play-Niobrara Shale Central Wyoming & Colorado |
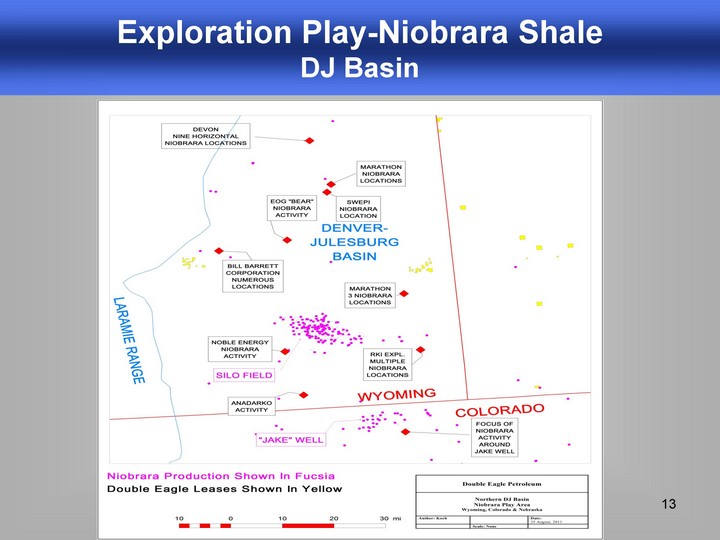
| 13 Exploration Play-Niobrara Shale DJ Basin |
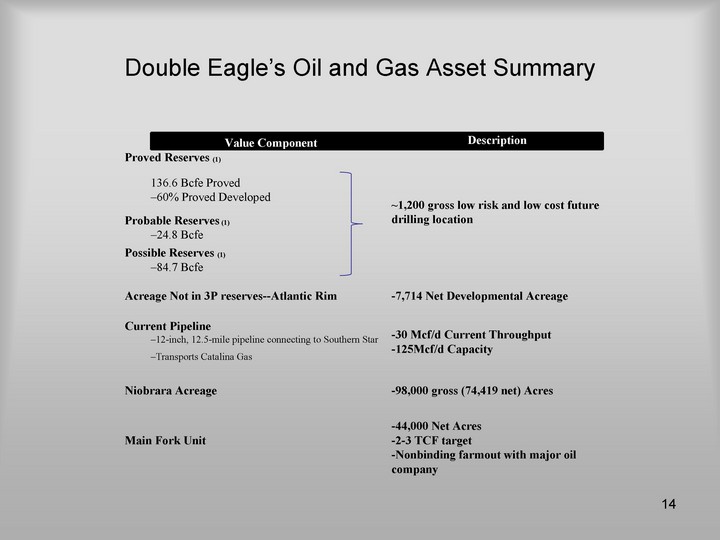
| Double Eagle's Oil and Gas Asset Summary Value Component Description Proved Reserves (1) Proved Reserves (1) ~1,200 gross low risk and low cost future drilling location 136.6 Bcfe Proved ~1,200 gross low risk and low cost future drilling location -60% Proved Developed ~1,200 gross low risk and low cost future drilling location Probable Reserves (1) Probable Reserves (1) ~1,200 gross low risk and low cost future drilling location -24.8 Bcfe ~1,200 gross low risk and low cost future drilling location Possible Reserves (1) Possible Reserves (1) ~1,200 gross low risk and low cost future drilling location -84.7 Bcfe ~1,200 gross low risk and low cost future drilling location Acreage Not in 3P reserves--Atlantic Rim Acreage Not in 3P reserves--Atlantic Rim -7,714 Net Developmental Acreage Current Pipeline Current Pipeline -30 Mcf/d Current Throughput -125Mcf/d Capacity -12-inch, 12.5-mile pipeline connecting to Southern Star -30 Mcf/d Current Throughput -125Mcf/d Capacity -Transports Catalina Gas -30 Mcf/d Current Throughput -125Mcf/d Capacity Niobrara Acreage Niobrara Acreage -98,000 gross (74,419 net) Acres Main Fork Unit Main Fork Unit -44,000 Net Acres -2-3 TCF target -Nonbinding farmout with major oil company 14 |

| Exhibits 15 |

| 16 Historical drilling activity Catalina Unit 84 gross (60 net) wells ~120 future drilling permits approved ~190 total potential future drilling locations 56.5 Bcfe net proved reserves (12/31/2011) Spyglass Hill (formerly Sun Dog / Doty Mnt Units) 172 gross (37 net wells) ~800 total potential future drilling locations 33.9 Bcfe net proved reserves (12/31/2011) 2011 Current Activity Drilled of 13 gross (12.73 net) new CBM wells in Atlantic Rim on 160 acre spacing Drilling 1 Niobrara appraisal well 2012 Planned Activity Potential drilling additional Niobrara wells Participation in Anadarko's drilling of 25 gross (5 net) Doty Mountain wells The Atlantic Rim High level summary of entire field needed including total wells drilled, left to drill and total plans |

| 17 Pinedale Anticline QEP Operated Properties Interests in over 150 wells through 2011; Anticipate participating in 16 new wells in 2012 200+ Potential future locations Double Eagle Working Interests: 6-12.5% WI Well Economics EUR per well of ~230 Mmcfe (net) Lifting costs < $1.00 per Mcfe Estimated drilling and completion--$3.38M gross $300k net ) |
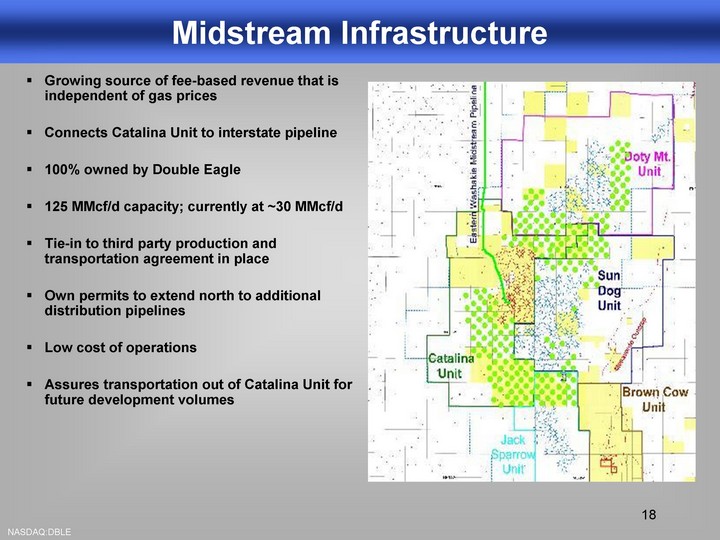
| 18 Midstream Infrastructure Growing source of fee-based revenue that is independent of gas prices Connects Catalina Unit to interstate pipeline 100% owned by Double Eagle 125 MMcf/d capacity; currently at ~30 MMcf/d Tie-in to third party production and transportation agreement in place Own permits to extend north to additional distribution pipelines Low cost of operations Assures transportation out of Catalina Unit for future development volumes |