Attached files
| file | filename |
|---|---|
| EXCEL - IDEA: XBRL DOCUMENT - Escalera Resources Co. | Financial_Report.xls |
| EX-32 - EX-32 - Escalera Resources Co. | d286686dex32.htm |
| EX-23.2 - EX-23.2 - Escalera Resources Co. | d286686dex232.htm |
| EX-99.1 - EX-99.1 - Escalera Resources Co. | d286686dex991.htm |
| EX-23.1 - EX-23.1 - Escalera Resources Co. | d286686dex231.htm |
| EX-31.2 - EX-31.2 - Escalera Resources Co. | d286686dex312.htm |
| EX-21.1 - EX-21.1 - Escalera Resources Co. | d286686dex211.htm |
| EX-31.1 - EX-31.1 - Escalera Resources Co. | d286686dex311.htm |
| EX-10.1.L - EX-10.1.L - Escalera Resources Co. | d286686dex101l.htm |
Table of Contents
UNITED STATES
SECURITIES AND EXCHANGE COMMISSION
Washington, D.C. 20549
FORM 10-K
| x | ANNUAL REPORT PURSUANT TO SECTION 13 OR 15(d) OF THE SECURITIES EXCHANGE ACT OF 1934 |
For the fiscal year ended December 31, 2011
| ¨ | TRANSITION REPORT UNDER SECTION 13 OR 15(d) OF THE SECURITIES EXCHANGE ACT OF 1934 |
For the transition period from to
Commission File No. 1-33571
DOUBLE EAGLE PETROLEUM CO.
(Exact name of registrant as specified in its charter)
| Maryland | 83-0214692 | |
| (State or other jurisdiction of incorporation or organization) |
(I.R.S. Employer Identification No.) |
1675 Broadway, Suite 2200, Denver, CO 80202
(Address of principal executive offices) (Zip Code)
(303) 794-8445
(Registrant’s telephone number, including area code)
Securities registered pursuant to Section 12(b) of the Act:
None.
Securities registered pursuant to Section 12(g) of the Act:
| Title of each class |
Name of each exchange on which registered | |
| $.10 Par Value Common Stock | NASDAQ Global Select Market | |
| $.10 Par Value Series A Cumulative Preferred Stock | NASDAQ Global Select Market |
Indicate by check mark if the registrant is a well-known seasoned issuer, as defined in Rule 405 of the Securities Act. Yes ¨ No x
Indicate by check mark if the registrant is not required to file reports pursuant to Section 13 or Section 15(d) of the Act. Yes ¨ No x
Indicate by check mark whether the registrant (1) has filed all reports required to be filed by Section 13 or 15(d) of the Securities Exchange Act of 1934 during the preceding 12 months (or for such shorter period that the registrant was required to file such reports), and (2) has been subject to such filing requirements for the past 90 days. Yes x No ¨
Indicate by check mark whether the registrant has submitted electronically and posted on its corporate Web site, if any, every Interactive Data File required to be submitted and posted pursuant to Rule 405 of Regulation S-T (§232.405 of this chapter) during the preceding 12 months (or for such shorter period that the registrant was required to submit and post such files). Yes x No ¨
Indicate by check mark if disclosure of delinquent filers pursuant to Item 405 of Regulation S-K (§229.405), is not contained herein, and will not be contained to the best of registrant's knowledge, in definitive proxy or information statements incorporated by reference in Part III of this Form 10-K or any amendment to this Form 10-K. ¨
Indicate by check mark whether the registrant is a large accelerated filer, an accelerated filer, a non-accelerated filer, or a smaller reporting company. See the definitions of “large accelerated filer,” “accelerated filer” and “smaller reporting company” in Rule 12b-2 of the Exchange Act.
| Large accelerated filer |
¨ |
Accelerated filer |
x | |||
| Non-accelerated filer |
¨ (Do not check if a small reporting company) |
Small reporting company |
¨ | |||
Indicate by check mark whether the registrant is a shell company (as defined by Rule 12b-2 in the Act). Yes ¨ No x
The aggregate market value of the voting common stock held by non-affiliates of the registrant at the close of business on June 30, 2011, was $94,616,421 (directors and officers are considered affiliates).
The number of shares of the registrant’s common stock outstanding as of March 1, 2012 was 11,227,814.
DOCUMENTS INCORPORATED BY REFERENCE
Portions of the registrant’s definitive proxy statement for the 2012 annual meeting of stockholders, which will be filed within 120 days after December 31, 2011, are incorporated by reference in Part III of this Form 10-K.
Table of Contents
DOUBLE EAGLE PETROLEUM CO.
FORM 10-K
| PAGE | ||||||
| Items 1. and 2. | 4 | |||||
| Item 1A. | 20 | |||||
| Item 1B. | 28 | |||||
| Item 3. | 28 | |||||
| Item 4. | 29 | |||||
| PART II | ||||||
| Item 5. | 29 | |||||
| Item 6. | 31 | |||||
| Item 7. | Management’s Discussion and Analysis of Financial Condition and Results of Operations |
32 | ||||
| Item 7A. | 47 | |||||
| Item 8. | 48 | |||||
| Item 9. | Changes in and Disagreements With Accountants on Accounting and Financial Disclosure |
48 | ||||
| Item 9A. | 48 | |||||
| Item 9B. | 50 | |||||
| PART III | ||||||
| Item 10. | 50 | |||||
| Item 11. | 50 | |||||
| Item 12. | Security Ownership of Certain Beneficial Owners and Management and Related Stockholder Matters |
50 | ||||
| Item 13. | Certain Relationships and Related Transactions, and Director Independence |
51 | ||||
| Item 14. | 51 | |||||
| PART IV | ||||||
| Item 15. | 51 | |||||
1
Table of Contents
Cautionary Information about Forward-Looking Statements
This Form 10-K includes “forward-looking statements” as defined by the Securities and Exchange Commission, or SEC. We make these forward-looking statements in reliance on the safe harbor protections provided under Section 27A of the Securities Act of 1933, as amended, Section 21E of the Securities Exchange Act of 1934, as amended, and the Private Securities Litigation Reform Act of 1995. All statements, other than statements of historical facts, included in this Form 10-K that address activities, events or developments that we expect, believe or anticipate will or may occur in the future are forward-looking statements. These forward-looking statements are based on assumptions which we believe are reasonable based on current expectations and projections about future events and industry conditions and trends affecting our business. However, whether actual results and developments will conform to our expectations and predictions is subject to a number of risks and uncertainties that, among other things, could cause actual results to differ materially from those contained in the forward-looking statements, including without limitation the Risk Factors set forth in this Form 10-K in Part I, "Item 1A. Risk Factors" and the following factors:
| • | A sustained decline in natural gas or oil prices; |
| • | The shortage or high cost of equipment, qualified personnel and other oil field services; |
| • | General economic conditions, tax rates or policies, interest rates and inflation rates; |
| • | Our ability to obtain, or a decline in, oil or gas production; |
| • | Our ability to increase our natural gas and oil reserves; |
| • | Our ability to maintain adequate liquidity in connection with low natural gas prices; |
| • | Our future capital requirements and availability of capital resources to fund capital expenditures; |
| • | Incorrect estimates of required capital expenditures; |
| • | The amount and timing of capital deployment in new investment opportunities; |
| • | The changing political and regulatory environment in which we operate; |
| • | Changes in or compliance with laws and regulations, particularly those relating to drilling, derivatives, and safety and protection of the environment such as initiatives related to drilling and well completion techniques including hydraulic fracturing; |
| • | The volumes of production from our oil and gas development properties, which may be dependent upon issuance by federal and state governments, or agencies thereof, of drilling, environmental and other permits; |
| • | Our ability to market and find reliable and economic transportation for our gas; |
| • | Our ability to successfully identify, execute, integrate and profitably operate any future acquisitions; |
| • | Industry and market changes, including the impact of consolidations and changes in competition; |
| • | The actions of third party co-owners of interests in properties in which we also own an interest, and in particular those which we do not operate or control; |
| • | Our ability to manage the risk associated with operating in one major geographic area; |
| • | Weather, climate change and other natural phenomena; |
| • | Our ability and the ability of our partners to continue to develop the Atlantic Rim project; |
| • | The credit worthiness of third parties with which we enter into hedging and business agreements; |
| • | Our ability to interpret 2-D and 3-D seismic data; |
| • | Numerous uncertainties inherent in estimating quantities of proved oil and gas reserves and actual future production rates and associated costs; |
| • | The volatility of our stock price; and |
| • | The outcome of any future litigation or similar disputes and the impact on any such outcome or related settlements. |
We may also make material acquisitions or divestitures or enter into financing transactions. None of these events can be predicted with certainty and the possibility of their occurring is not taken into consideration in the forward-looking statements.
2
Table of Contents
New factors that could cause actual results to differ materially from those described in forward-looking statements emerge from time to time, and it is not possible for us to predict all such factors, or the extent to which any such factor or combination of factors may cause actual results to differ from those contained in any forward-looking statement. We assume no obligation to update publicly any such forward-looking statements, whether as a result of new information, future events, or otherwise.
The terms “Double Eagle,” the “Company,” “we,” “our,” and “us” refer to Double Eagle Petroleum Co. and its subsidiaries, as a consolidated entity, unless the context suggests otherwise. We have included technical terms important to an understanding of our business under “Glossary”, in Items 1 and 2 “Business and Properties” of this Annual Report on Form 10-K for the year ended December 31, 2011. Dollar amounts set forth herein are in thousands unless otherwise noted.
3
Table of Contents
| ITEMS | 1. AND 2. BUSINESS AND PROPERTIES |
General
We are an independent energy company engaged in the exploration, development, production and sale of natural gas and crude oil, primarily in Rocky Mountain Basins of the western United States. We were incorporated in Wyoming in 1972 and reincorporated in Maryland in 2001. Our common stock is publicly traded on the NASDAQ Global Select Market under the symbol “DBLE” and our Series A Cumulative Preferred Stock is traded on the NASDAQ Global Select Market under the symbol “DBLEP”. Our corporate offices are located at 1675 Broadway, Suite 2200, Denver, Colorado 80202, telephone number (303) 794-8445. Our website is www.dble.com.
Overview and Strategy
Our objective is to increase long-term shareholder value by profitably growing our reserves, production, revenues, and cash flow. To meet this objective, we primarily focus on:
| • | new coal bed methane gas development drilling; |
| • | enhancement of existing production wells and field facilities on operated and non-operated properties in the Atlantic Rim; |
| • | continued participation in the development of tight sands gas wells at the Mesa Units on the Pinedale Anticline; |
| • | expansion of our midstream business; |
| • | pursuit of high quality exploration and strategic development projects with potential for providing long-term drilling inventories that generate high returns; and |
| • | selectively pursing strategic acquisition or mergers. |
Our core properties are located in southwestern Wyoming. We have coal bed methane reserves and production in the Atlantic Rim Area of the eastern Washakie Basin and tight gas reserves and production on the Pinedale Anticline in the Green River Basin of Wyoming. We also have an active exploration project, where we are pursuing hydrocarbons in the Niobrara formation in the eastern Washakie Basin, located in south central Wyoming. At December 31, 2011, we had over 74,000 net acres which we believe have Niobrara formation exposure, located primarily in Wyoming and western Nebraska. Substantially all of our revenues are generated through the sale of natural gas and oil production at market prices and the settlement of commodity hedges. Approximately 98% of our 2011 production volume was natural gas.
As of December 31, 2011, we had estimated proved reserves of 133.9 Bcf of natural gas and 450 MBbl of oil, or a total of 136.6 Bcfe. This represents a total net increase in estimated proved reserve quantities of 19% from the prior year, after adjustments for extensions and discoveries, current year production and revision of estimates. The increase in estimated proved reserves as compared to the prior year is attributable to extensions and discoveries totaling 31.7 Bcfe of reserves as the result of organic growth from drilling in the Catalina Unit in the Atlantic Rim and the Pinedale Anticline. We also benefited from a decrease in capital and production costs in the Pinedale Anticline, which has resulted in additional undeveloped well locations in this area becoming economic. Of these estimated proved reserves, 60% were proved developed and 98% were natural gas.
The proved oil and gas reserves at December 31, 2011 had a PV-10 value of approximately $154.2 million, an increase of 7% from December 31, 2010 primarily due to extensions and discoveries in the Catalina Unit and Pinedale Anticline. The average price used in calculating the December 31, 2011 reserves remained consistent at $3.93 per MMBtu for 2011 as compared to $3.95 per MMBtu for December 31, 2010. (See the reconciliation of the PV-10 non-GAAP financial measure to the standardized measure under Reserves on page 10). In 2011, the reserve engineers modified the production curves related to our reserves, which extended the recovery period for some of our reserves. This change resulted in a lower present value for the reserves and as such, our PV-10 value did not increase consistent with the increase in proved reserves.
Our total net production increased 2% to 9.3 Bcfe for 2011, from 9.2 Bcfe in 2010.
4
Table of Contents
During 2011, we invested $25.8 million in capital expenditures related to the development of our existing properties, as compared to $21.5 million in 2010. The focus of the capital expenditures was primarily on drilling 13 new producing wells in our operated Catalina Unit and non-operated drilling on the Pinedale Anticline, where we have historically had a high rate of return. We also invested a portion of our 2011 capital budget in an exploratory well in the Atlantic Rim, in which we are exploring for hydrocarbons in the Niobrara, Frontier and Dakota formations. This well was in process at December 31, 2011. We reached total depth on this well in February 2012.
We continually assess projects that are in progress and those proposed for future development to determine the best use for our available capital. This assessment includes analyzing the risk and estimated rate of return for each proposed project, including our non-operated assets (primarily the Pinedale Anticline and the Doty Mountain and Sun Dog Units in the Atlantic Rim). Our estimated capital budget for 2012 is approximately $15 to $20 million, primarily for our development and exploration programs in the Atlantic Rim and Pinedale Anticline. We intend to participate in the drilling of approximately 25 production wells in the Doty Mountain Unit and approximately 15 new wells at the Mesa Units on the Pinedale Anticline. During the fourth quarter of 2011 and into the first quarter of 2012, we drilled an exploratory well located in the center of the Catalina Unit. The primary target was the Niobrara Shale formation. We also drilled into the Frontier and Dakota formations to test for hydrocarbons. We expect the core and log analysis on this well to be completed in the second quarter of 2012, and at that time we will determine the completion opportunities, if any, in the various formations.
We also continue to evaluate acquisition and merger opportunities that we believe will complement our existing operations, offer economies of scale and/or provide further development, exploitation and exploration opportunities. In addition to potential acquisitions, we also may decide to divest of certain non-core assets, enter into strategic partnerships or form joint ventures related to our assets that are not currently considered in our expected 2012 capital expenditures.
Properties and Operations
As of December 31, 2011, we owned interests in over 1,200 producing wells and had an acreage position of 405,726 gross (139,962 net) acres, of which 262,650 gross (124,306 net) acres are undeveloped, in what we believe are natural gas prone basins primarily located in the Rocky Mountains. Two developing areas, the Atlantic Rim coal bed natural gas play and the Pinedale Anticline, accounted for 94% of our proved reserves as of December 31, 2011, and 94% of our 2011 production.
As of December 31, 2011, our estimated acreage holdings by basin are:
| Basin |
Gross Acres | Net Acres | ||||||
| Washakie Basin |
134,572 | 54,710 | ||||||
| Wind River Basin |
50,946 | 3,012 | ||||||
| Powder River Basin |
49,890 | 19,913 | ||||||
| Utah Overthrust |
47,077 | 21,162 | ||||||
| Greater Green River Basin |
43,485 | 8,211 | ||||||
| Huntington Basin |
33,375 | 7,166 | ||||||
| Hanna Basin |
18,003 | 10,948 | ||||||
| Other |
28,378 | 14,840 | ||||||
|
|
|
|
|
|||||
| Total |
405,726 | 139,962 | ||||||
|
|
|
|
|
|||||
Our project development focus is in areas where we believe our core competencies can provide us with competitive advantages. We intend to grow our reserves and production primarily through our current areas of development, which are as follows:
The Atlantic Rim Coal Bed Natural Gas Project
Located in Carbon County of south central Wyoming, the Atlantic Rim play is a 40-mile long trend in the eastern Washakie Basin, in which we have an interest in 99,512 gross (46,716 net acres) acres. The Mesaverde coals in this area differ from those found in the Powder River Basin in that they are thinner zones, but generally have higher gas content. The productivity of coal beds is dependent not only on specific natural gas content, but also on favorable permeability to natural gas. The primary areas currently being developed within the Atlantic Rim are the Catalina Unit, for which we are the operator, and our non-operated interests in the Sun Dog and the Doty Mountain Units.
5
Table of Contents
In May 2007, a Record of Decision on the Atlantic Rim Environmental Impact Statement (“EIS”), was issued. The EIS allows for the drilling of up to 1,800 coal-bed methane wells and 200 conventional oil and gas wells in the Atlantic Rim area, of which 268 of the potential well sites are in the Catalina Unit, that we operate.
During 2011, we recognized net sales volumes from the coal bed natural gas projects in the Atlantic Rim of 6.8 Bcfe, which represented 73% of our total 2011 natural gas equivalent sales volume. The wells have historically been economic, and we intend to continue to focus our efforts on development of this area by participating in an estimated 25 producing wells drilled by Anadarko Petroleum Corporation (“Anadarko”), in the Doty Mountain Unit in 2012.
The operations in the Atlantic Rim operate under federal exploratory unit agreements between the working interest partners. Unitization is a type of sharing arrangement by which owners of operating and non-operating working interests pool their property interests in a producing area to form a single operating unit. Units are designed to improve efficiency and economics of developing and producing an area. The share that each interest owner receives is based upon the respective acreage contributed by each owner in the participating area (“PA”) that surround the producing wells as a percentage of the entire acreage of the PA. The PA, and the associated working interest, may change as more wells and acreage are added to the PA.
During 2011, Anadarko filed and received approval to combine the Doty Mountain and Sun Dog Units, as well as additional undeveloped properties into a new unit titled the Spyglass Hill Unit. Once required production levels have been reached on the 2011 wells drilled by Anadarko, the Spyglass Hill Unit will formally be formed. The Company’s working interest will continue to be in accordance with the original Doty Mountain and Sun Dog Unit agreements.
Catalina Unit
The Catalina Unit consists of 21,725 total acres (9,134 net acres) that we operate. Our development of the Catalina Unit began in 2007 with the 14 original producing wells in the Cow Creek Field and has expanded to 83 production wells as of December 31, 2011.
We acquired our initial 100% working interest in the Cow Creek Field from KCS Mountain Resources in April 1999. The 14 original producing wells in the Cow Creek Field became a part of the Catalina Unit participating area on December 21, 2007, when the 33 new wells we drilled during 2007 established production levels specified in the unit agreement. We continued to drill and complete 23 producing wells in 2008. In 2010, we purchased additional working interest in the Catalina Unit from a third party. Our current working interest in the PA is 72.40%. As we continue to expand the PA, our working interest will continue to change. We anticipate our working interest will be approximately 51% upon the completion of planned development of the existing acreage.
In 2011, we drilled and completed 13 new producing wells in the unit. Twelve of the 13 new wells are located in an exploratory area of the Catalina Unit (outside the existing PA) and we hold a 100% working interest in these wells. The exploratory wells remain separate from the PA until the offsetting acreage is drilled and it is physically connected to the existing PA. As of December 31, 2011, all 13 wells were on-line for production.
Prior to 2011, we drilled the wells in the Catalina Unit using 80 acre spacing. Our historical production results and reservoir studies show that wells drilled in this area on the 80 acre spacing are communicating with each other, which may indicate that by increasing the spacing, we can potentially exploit the same reserves with fewer capital expenditures. Based on these studies, the 12 wells located within the exploratory area of the Catalina Unit were drilled on 160 acre spacing. The drilling of wider spacing does not preclude us from infill drilling in the same area. The preliminary results of these new wells are positive. For the 2011 reserve report, we did not receive additional reserves above those we have gotten on 80 acre spacing wells due to the limited time on production. We anticipate that as additional production and drilling results are available, additional reserves per well could be realized.
Production in the Catalina Unit resulted in net sales volumes of 4.9 Bcf in 2011, which represented 52% of our total sales volumes for 2011. Our daily net production at the Catalina Unit was 13,372 Mcf.
6
Table of Contents
Coal bed methane gas wells involve removing gas trapped within the coal itself. Often, the coals are completely saturated with water. As water is removed, gas is able to flow to the wellbore. In the Atlantic Rim, we and Anadarko as operators have received permits by which produced water can be injected back into the ground through injection wells. Also, in 2008, we were granted a permit by the Bureau of Land Management (“BLM”) to treat water removed from the wells, for release on the surface. We are currently the only company in the Atlantic Rim area with such a permit. We engaged EMIT Technologies Inc (“EMIT”) to construct a pilot waste water treatment facility within the Catalina Unit. The EMIT plant has capacity to treat and release up to 10,000 barrels of water per day. We would pay EMIT a fee per barrel of water processed. However, due to the current water production volumes and the cost of water treatment, all of the water produced by our CBM wells is currently reinjected into the ground.
Eastern Washakie Midstream Pipeline LLC
Through a wholly-owned subsidiary, Eastern Washakie Midstream Pipeline LLC (“EWM”), we own a 13-mile pipeline and gathering assets, which connect the Catalina Unit with the pipeline system owned by Southern Star Central Gas Pipeline, Inc. The pipeline provides us with access to the interstate gas markets, and the ability to move third party gas. We have an agreement in place for transportation and gathering of all Catalina Unit production volumes that move through our pipeline, for which we receive a fee per Mcf of gas transported. The pipeline has a transportation capacity of approximately 125 MMcf per day. The pipeline’s current usage is less than 25% of capacity. The pipeline is expected to provide reliable transportation for future development by us and other operators in the Atlantic Rim. EWM also owns survey and right of way permits for a potential extension to the Wyoming Interstate Company (“WIC”) interstate pipeline.
In 2011, we entered into an agreement with a third party to transport gas through our pipeline. Based on the third party’s current production volumes and development plans within this area, we expect to begin transporting the third party gas in late 2012 or 2013.
Sun Dog Unit
The Sun Dog Unit was established in 2005 and is adjacent to the Catalina Unit to the east. Anadarko operates this 21,929 acre unit in which we own a total of 11,420 gross (5,147 net) acres. Within the Sun Dog Unit PA, we owned a 21.53% working interest in the 114 production wells therein as of December 31, 2011. During 2011, we recognized a total net production from the Sun Dog Unit of 1,152 MMcf, or an average daily net production of 3,155 Mcf per day, an increase of 59% as compared to 2010. The increase was primarily due to us holding a higher working interest for the full year, as we purchased additional working interest in the unit in July 2010. In addition, the operator added additional water injection capacity in the unit in early 2011, which has led to improved production volume from this field. Currently, we do not expect any drilling by the operator in the Sun Dog Unit during 2012.
Doty Mountain Unit
The Doty Mountain Unit was established in 2005 and is adjacent to the Catalina Unit to the northeast. Anadarko operates this 20,336 acre unit in which we own a total of 2,000 gross (2,000 net) acres. As of December 31, 2011, we owned an 18.00% working interest in the 60 production wells within the PA of the Unit. During 2011, we recognized a total net production from the Doty Mountain Unit of 761 MMcf, or an average of 2,085 Mcf per day, an increase of 20% as compared to 2010. Management believes this increase is related to fracture stimulation performed on certain existing wells during 2009 and 2010. The operator has informed us that it plans to drill 25 wells within the Doty Mountain Unit in 2012.
Other Acreage
Other than these three units, we own interests in approximately 64,367 gross (30,435 net) additional acres in the Atlantic Rim that may provide other opportunities for future development.
The Pinedale Anticline in the Green River Basin of Wyoming
The Pinedale Anticline is in southwestern Wyoming, ten miles south of the town of Pinedale. QEP Resources, Inc. operates 2,400 acres in the three Mesa Units in which we hold a net acreage position of 110 acres. The Mesa Units on the Pinedale Anticline includes approximately 165 non-operated wells that produced 21% of our total production for 2011. Our net production from the Mesa Units in 2011 was 1,987 MMcfe, or 5,445 Mcfe per day, net to our interest.
7
Table of Contents
As of December 31, 2011, in the Mesa “A” PA, there were 22 producing wells, in which we hold a 0.312% overriding royalty interest. We own approximately 600 gross (1.875 net) acres in the Mesa “A” PA.
In the Mesa “B” PA, where we have an 8% average working interest in the shallow producing formations and a 12.5% average working interest in the deep producing formations, there were 109 producing wells that produced 1,463 MMcfe in 2011, net to our interest, an increase of 14% as compared to 2010. We have 600 gross (64 net) acres in the shallower formations in the “B” PA, and 800 gross (100 net) acres in the deep producing formations. Nineteen of the 109 wells came on-line for production during the second, third and fourth quarters of 2011. We are also currently participating in the drilling of 19 additional wells, which are estimated to be completed during 2012. We believe the operator will begin drilling approximately 15 additional wells in the Mesa “B” PA in second half of 2012.
In the Mesa “C” PA, where we have a working interest of 6.4%, 34 wells produced 446 MMcfe in 2011, net to our interest, a decrease of 21% as compared to 2010. We have 1,000 gross (65.27 net) acres in the Mesa “C” Participating Area.
At year end, we had working interests or overriding royalty interests in a total of 4,840 acres in and around this developing natural gas field.
The Wind River Basin in Central Wyoming
Located in central Wyoming, the Wind River Basin is home to Wyoming’s first oil production, which began in 1884. Since that time, numerous fields have been discovered in this basin, including two very large natural gas accumulations, the Madden Anticline and the Cave Gulch/Waltman Fields. We have interests in 50,946 gross acres, (3,012 net acres), of leases in the Wind River Basin.
Madden Anticline
The Madden Anticline is located in central Wyoming, 65 miles west of the town of Casper. The anticline is 20 miles long and six miles wide lying in the deepest part of the Wind River Basin. In late 2006, through unitization, we acquired a 0.349% working interest in the Madden Sour Gas PA in the Madden Deep Unit and the Lost Cabin Gas Processing Plant, at a cost of approximately $2.5 million. Under the current approved PA, we have 504.74 gross (84.14 net) acres that are included in the 24,088 acre participating area. In total, we own an approximate 16.67 % working interest in 734.25 acres on the Madden Anticline that potentially could be included in the Madden Sour Gas PA. The unit’s primary operator, ConocoPhillips, plans to continue to drill additional wells in the unit.
The Madden Sour Gas PA produced 183 MMcf net to our interest in 2011 from eight wells. We believe that these are long-lived wells with large producing rates and reserves.
We also own interests, which are restricted in depth and size, in over 12,000 additional acres on the Madden Anticline. Additionally, we operate and produce from one lower Fort Union well and one upper Fort Union well outside of the unit. We will continue to produce these two wells and evaluate the potential for offsets.
The Moxa Arch and Other Areas in Southwest Wyoming
We continue to participate in development drilling on the Moxa Arch and other areas within southwest Wyoming. However, due to the economic downturn and low natural gas prices, drilling in this area has slowed significantly in the past three years. We have interest in over 350 wells in this area. In 2012, natural gas prices will dictate further participation in drilling proposals in this area.
Exploration Projects
Niobrara Shale Formation
The Niobrara Shale formation (“Niobrara”) is an emerging oil play in the Rocky Mountain region of the United States. Niobrara is a thick and continuous Cretaceous source rock that ranges from 150 feet to 1,500 feet thick. In October 2011, we began drilling an exploratory oil well located within our Atlantic Rim play. Our working interest in this well is 95%. The target depth of this well is 9,450 feet and will allow us to explore the Niobrara, Frontier and Dakota formations. We reached total depth of this well in February 2012.
8
Table of Contents
We have additional potential exploration opportunities in the Niobrara, as we hold over 97,774 gross (74,419 net) acres, primarily located in Wyoming and western Nebraska, that we believe have Niobrara exposure. The acreage consists of leases in the following areas as of December 31, 2011:
| Area |
Gross Acres | Net Acres | ||||||
| Atlantic Rim |
61,310 | 37,955 | ||||||
| DJ Basin—Wyoming |
6,674 | 6,674 | ||||||
| DJ Basin—Nebraska |
4,198 | 4,198 | ||||||
| Power River Basin |
16,283 | 16,283 | ||||||
| Laramie/Hanna Basin |
8,669 | 8,669 | ||||||
| Wind River Basin |
640 | 640 | ||||||
|
|
|
|
|
|||||
| Total Estimated Niobrara Acreage |
97,774 | 74,419 | ||||||
|
|
|
|
|
|||||
Main Fork Unit in Utah
The Main Fork Unit (formerly the Table Top Unit) is located on a structural dome in the southwest corner of the Green River Basin, in Summit County, Utah. The dome is overlaid by the Wyoming Overthrust Belt and the North Flank Thrust of the Uinta Mountains. In early 2007, drilling at the Table Top Unit #1 (“TTU #1”) well reached the originally planned depth of 15,760 feet. The drilling did not find reservoir rocks with sufficient permeability, and operations were suspended to assess alternative approaches to completing the project. In June 2009, the BLM approved a suspension of operations (“SOP”) and production for all leases within the Main Fork Unit. The SOP stops the expiration of lease terms and halts any lease rentals until an environmental impact study is completed, which is expected to take three or more years to complete. During the EIS, we are not prevented from exercising our approved rights to re-enter the TTU #1, or drill a new well at the TTU #3 site. We are currently working with a major integrated oil and gas company that has option farm-in rights where they could drill the TTU #1 deeper to the Nugget Sandstone formation at 18,000 feet, or the Madison formation at 22,000-24,000 feet. If the farm-out rights are exercised by the third party, the third party would bear all costs and we would retain a 12%-16% working interest after payout in the TTU#3.
Reserves
We engaged the independent petroleum engineering firm, Netherland, Sewell & Associates, Inc. (“NSAI”) to prepare our reserve estimates at December 31, 2011, 2010 and 2009. NSAI is a worldwide leader of petroleum property analysis for industry and financial organizations, and government agencies. NSAI was founded in 1961 and performs consulting petroleum engineering services under the Texas Board of Professional Engineers Registration No. F-2699. Within NSAI, the technical persons primarily responsible for preparing the estimates set forth in the NSAI reserves report included herein are David Miller and John Hattner. Mr. Miller has been practicing consulting petroleum engineering at NSAI since 1997. Mr. Miller is a Registered Professional Engineer in the State of Texas (License No. 96134) and has over 29 years of practical experience in petroleum engineering, with over 14 years of experience in the estimation and evaluation of reserves. Mr. Hattner has been practicing consulting petroleum geology at NSAI since 1991. Mr. Hattner is a Certified Petroleum Geologist and Geophysicist in the State of Texas (License No. 559) and has over 31 years of practical experience in petroleum geosciences, with over 20 years of experience in the estimation and evaluation of reserves. Both technical principals meet or exceed the education, training, and experience requirements set forth in the Standards Pertaining to the Estimating and Auditing of Oil and Gas Reserves Information promulgated by the Society of Petroleum Engineers; both are proficient in judiciously applying industry standard practices to engineering and geosciences evaluations as well as applying SEC and other industry reserves definitions and guidelines.
9
Table of Contents
NSAI evaluated properties representing a minimum of 99% of our reserves, valued at the total estimated future net cash flows before income taxes, discounted at 10% (“PV-10”), for all periods presented below. In estimating the proved reserves and future revenue, NSAI used technical and economic data including, but not limited to, well logs, geologic maps, seismic data, well test data, production data, historical price and cost information, and property ownership interests. Senior members of our finance, engineering and geology teams review the final reserve report to verify the accuracy and completeness of all inputs into the report. NSAI’s report to management, which summarizes the scope of work performed and its conclusions, has been included in this report as Exhibit 99.1
All of our proved reserves, as shown in the table below, are located within the continental United States.
| As of December 31, | ||||||||||||||||||||||||
| 2011 | 2010 | 2009 | ||||||||||||||||||||||
| Oil (Bbls) |
Natural Gas (Mcf) |
Oil (Bbls) |
Natural Gas (Mcf) |
Oil (Bbls) |
Natural Gas (Mcf) |
|||||||||||||||||||
| PROVED |
||||||||||||||||||||||||
| Developed |
245,124 | 80,121,740 | 235,808 | 73,049,048 | 312,963 | 64,296,948 | ||||||||||||||||||
| Undeveloped |
205,077 | 53,781,823 | 145,443 | 39,719,466 | 106,250 | 25,479,722 | ||||||||||||||||||
|
|
|
|
|
|
|
|
|
|
|
|
|
|||||||||||||
| Total proved reserves |
450,201 | 133,903,563 | 381,251 | 112,768,514 | 419,213 | 89,776,670 | ||||||||||||||||||
|
|
|
|
|
|
|
|
|
|
|
|
|
|||||||||||||
Reserve estimates are inherently imprecise and are subject to revisions based on production history, results of additional exploration and development, prices of oil and gas, and other factors. Accordingly, reserves estimates may vary from the quantities of oil and natural gas that are ultimately recovered. For more information regarding the inherent risks associated with estimating reserves, see Item 1A. “Risk Factors.”
During the year ended December 31, 2011, we converted approximately 2.1 Bcfe of proved undeveloped reserves into proved developed reserves. The conversion of these undeveloped reserves into developed reserves was primarily due to developmental drilling in the Catalina Unit and the Mesa Units in the Pinedale Anticline. We did not have proved undeveloped reserves in 2010 for several of the well locations we selected for drilling in the Catalina Unit and the operator selected in the Pinedale Anticline. In addition, we had negative revisions of approximately 4.4 Bcfe in proved undeveloped reserves. We do not have any material concentrations of reserves that have remained undeveloped for a period of five years or more.
The table below shows our reconciliation of our PV-10 to our standardized measure of discounted future net cash flows (the most directly comparable measure calculated and presented in accordance with GAAP). PV-10 is our estimate of the present value of future net revenues from estimated proved oil and natural gas reserves after deducting estimated production and ad valorem taxes, future capital costs and operating expenses, but before deducting any estimates of future income taxes. The estimated future net revenues are discounted at an annual rate of 10% to determine their present value. We believe PV-10 to be an important measure for evaluating the relative significance of our oil and natural gas properties and that the presentation of the non-GAAP financial measure of PV-10 provides useful information to investors because it is widely used by professional analysts and sophisticated investors in evaluating oil and gas companies. Because there are many unique factors that can impact an individual company when estimating the amount of future income taxes to be paid, we believe the use of a pre-tax measure is valuable for evaluating our company. We believe that most other companies in the oil and gas industry calculate PV-10 on the same basis. PV-10 should not be considered as an alternative to the standardized measure of discounted future net cash flows as computed under GAAP. Reference should also be made to the Supplemental Oil and Gas Information included in Item 15, Note 12 to the Notes to the Consolidated Financial Statements for additional information.
10
Table of Contents
| As of December 31, | ||||||||||||
| 2011 | 2010 | 2009 | ||||||||||
| Present value of estimated future net cash flows before income taxes, discounted at 10% (1) |
$ | 154,218 | $ | 143,694 | $ | 91,133 | ||||||
|
|
|
|
|
|
|
|||||||
| Reconciliation of non-GAAP financial measure: |
||||||||||||
| PV-10 |
$ | 154,218 | $ | 143,694 | $ | 91,133 | ||||||
|
|
|
|
|
|
|
|||||||
| Less: Undiscounted income taxes |
(64,103 | ) | (50,732 | ) | (14,279 | ) | ||||||
| Plus: 10% discount factor |
30,562 | 21,982 | 5,853 | |||||||||
|
|
|
|
|
|
|
|||||||
| Discounted income taxes |
(33,541 | ) | (28,750 | ) | (8,426 | ) | ||||||
|
|
|
|
|
|
|
|||||||
| Standardized measure of discounted future net cash flows |
$ | 120,677 | $ | 114,944 | $ | 82,707 | ||||||
|
|
|
|
|
|
|
|||||||
| (1) | The average prices used for December 31, 2011, 2010, and 2009, respectively, were $3.93 per MMBtu and $92.71 per barrel of oil; $3.95 per MMBtu and $75.96 per barrel of oil; and $3.04 per MMBtu and $57.65 per barrel of oil. These prices are adjusted by field for quality, transportation fees and regional prices differentials. |
The PV-10 values shown in the aforementioned table are not intended to represent the current market value of the estimated proved oil and gas reserves owned by us. The PV-10 value above does not include the impact of our outstanding financial hedges. The 10% discount factor used to calculate present value, which is required by Financial Accounting Standards Board pronouncements (“FASB”), is not necessarily the most appropriate discount rate. The present value, no matter what discount rate is used, is materially affected by assumptions as to timing of future production, which may prove to be inaccurate
Production
The following table sets forth oil and gas production by geographic area from our net interests in producing properties for the years ended December 31, 2011, 2010 and 2009.
| For the Year Ended December 31, | ||||||||||||||||||||||||
| 2011 | 2010 | 2009 | ||||||||||||||||||||||
| Oil (Bbls) | Gas (MMcf) | Oil (Bbls) | Gas (MMcf) | Oil (Bbls) | Gas (MMcf) | |||||||||||||||||||
| Production: |
||||||||||||||||||||||||
| Atlantic Rim |
— | 6,793 | — | 6,729 | — | 6,677 | ||||||||||||||||||
| Pinedale Anticline |
15,090 | 1,897 | 15,413 | 1,760 | 16,741 | 1,961 | ||||||||||||||||||
| Other |
13,001 | 485 | 10,611 | 514 | 12,186 | 524 | ||||||||||||||||||
|
|
|
|
|
|
|
|
|
|
|
|
|
|||||||||||||
| Company total |
28,091 | 9,175 | 26,024 | 9,003 | 28,927 | 9,162 | ||||||||||||||||||
| Average sales price ($/Bbl or $/Mcf) |
||||||||||||||||||||||||
| Atlantic Rim (1) |
N/A | $ | 4.89 | N/A | $ | 4.08 | N/A | $ | 5.42 | |||||||||||||||
| Pinedale Anticline |
$ | 84.13 | $ | 3.91 | $ | 66.80 | $ | 4.21 | $ | 47.40 | $ | 3.39 | ||||||||||||
| Other |
$ | 95.63 | $ | 4.03 | $ | 75.51 | $ | 4.36 | $ | 57.49 | $ | 3.09 | ||||||||||||
| Company average |
$ | 89.45 | $ | 4.64 | $ | 70.35 | $ | 4.12 | $ | 51.65 | $ | 4.85 | ||||||||||||
| Average production cost ($/mcfe) |
||||||||||||||||||||||||
| Atlantic Rim (2) |
$ | 1.24 | $ | 1.10 | $ | 0.85 | ||||||||||||||||||
| Pinedale Anticline |
$ | 0.70 | $ | 0.68 | $ | 0.53 | ||||||||||||||||||
| Other |
$ | 2.22 | $ | 1.88 | $ | 1.67 | ||||||||||||||||||
| Company average |
$ | 1.18 | $ | 1.06 | $ | 0.83 | ||||||||||||||||||
| (1) | Our average gas price in the Atlantic Rim includes the settlements on our financial hedges that due to accounting rules, are included in price risk management activities on the consolidated statements of operations, totaling $933, $5,316, and $3,503, for the years ended December 31, 2011, 2010 and 2009, respectively. |
| (2) | Production costs, on a dollars per Mcfe basis, are calculated by dividing production costs, as stated on the consolidated statement of operations, by total production volumes during the period. This calculation for the Atlantic Rim excludes certain gathering costs incurred by our subsidiary, Eastern Washakie Midstream, which are eliminated in consolidation. |
Derivative Instruments
We have entered into various derivative instruments to mitigate the risk associated with downward fluctuations in the natural gas price and the resulting impact on cash flow, net income, and earnings per share. Historically these derivative instruments have consisted of forward contracts, costless collars and swaps. The duration and size of our various derivative instruments varies, and depends on our view of market conditions, available contract prices and our
11
Table of Contents
operating strategy. Under our current credit agreement, we can hedge up to 90% of the projected proved developed producing reserves for the next 12 month period, and up to 80% of the projected proved producing reserves for the ensuing 24 month period. Our outstanding derivative instruments as of December 31, 2011 are summarized below (volume and daily production are expressed in Mcf):
| Type of Contract |
Remaining Contractual Volume |
Daily Production |
Term | Price | Price Index (1) |
|||||||||||||||
| Fixed Price Swap |
1,830,000 | 5,000 | 01/12-12/12 | $ | 5.10 | NYMEX | ||||||||||||||
| Fixed Price Swap |
3,660,000 | 10,000 | 01/12-12/12 | $ | 5.05 | NYMEX | ||||||||||||||
| Fixed Price Swap |
2,190,000 | 6,000 | 01/13-12/13 | $ | 5.16 | NYMEX | ||||||||||||||
| Costless Collar |
2,190,000 | 6,000 | 01/13-12/13 | $ | 5.00 floor | NYMEX | ||||||||||||||
| $ | 5.35 ceiling | |||||||||||||||||||
|
|
|
|||||||||||||||||||
| Total |
9,870,000 | |||||||||||||||||||
|
|
|
|||||||||||||||||||
| (1) | NYMEX refers to quoted prices on the New York Mercantile Exchange. |
We have a $30 million fixed rate swap contract with a third party in place as a hedge against the floating interest rate on our credit facility. Under the hedge contract terms, we locked in the Eurodollar LIBOR portion of the interest calculation at approximately 0.578% for this tranche of our outstanding debt, which based on our current level of outstanding debt, translates to an interest rate on this tranche of approximately 3.08%. The contract is effective through December 31, 2012.
See Item 15, Note 5 to the Notes to the Consolidated Financial Statements for discussion regarding the accounting treatment of our derivative contracts.
Productive Wells
The following table categorizes certain information concerning the productive wells in which we owned an interest as of December 31, 2011. For purposes of this table, wells producing both oil and gas are shown in both columns. Of the wells included in the table below, we are the operator of 91 producing wells in the state of Wyoming, four wells in Texas and one in Oklahoma.
| Oil | Gas | |||||||||||||||
| State |
Gross | Net | Gross | Net | ||||||||||||
| Wyoming |
93 | 6.0353 | 1,121 | 116.9912 | ||||||||||||
| Other |
43 | 4.5682 | 5 | 0.0855 | ||||||||||||
|
|
|
|
|
|
|
|
|
|||||||||
| Total |
136 | 10.6035 | 1,126 | 117.0767 | ||||||||||||
|
|
|
|
|
|
|
|
|
|||||||||
12
Table of Contents
Drilling Activity
We drilled or participated in the drilling of wells as set forth in the following table for the periods indicated. In certain wells in which we participate, we have an overriding royalty interest and no working interest.
| For the Year Ended December 31, | ||||||||||||||||||||||||
| 2011 | 2010 | 2009 | ||||||||||||||||||||||
| Gross | Net | Gross | Net | Gross | Net | |||||||||||||||||||
| Exploratory |
||||||||||||||||||||||||
| Oil |
2 | 0.96 | — | — | — | — | ||||||||||||||||||
| Gas |
— | — | — | — | — | — | ||||||||||||||||||
| Dry Holes |
— | — | — | — | — | — | ||||||||||||||||||
| Water Injection |
||||||||||||||||||||||||
| Other |
— | — | — | — | — | — | ||||||||||||||||||
|
|
|
|
|
|
|
|
|
|
|
|
|
|||||||||||||
| Total |
2 | 0.96 | — | — | — | — | ||||||||||||||||||
|
|
|
|
|
|
|
|
|
|
|
|
|
|||||||||||||
| Development |
||||||||||||||||||||||||
| Oil |
4 | 0.07 | 13 | 0.04 | — | — | ||||||||||||||||||
| Gas 1 |
47 | 15.44 | 26 | 2.08 | 42 | 3.12 | ||||||||||||||||||
| Dry Holes |
— | — | — | — | — | — | ||||||||||||||||||
| Water Injection |
2 | 2.00 | — | — | — | — | ||||||||||||||||||
| Water Supply |
— | — | — | — | 1 | 1.00 | ||||||||||||||||||
| Other |
— | — | — | — | — | — | ||||||||||||||||||
|
|
|
|
|
|
|
|
|
|
|
|
|
|||||||||||||
| Total |
53 | 17.51 | 39 | 2.12 | 43 | 4.12 | ||||||||||||||||||
|
|
|
|
|
|
|
|
|
|
|
|
|
|||||||||||||
| (1) | Includes 13 wells drilled in the Catalina Unit in 2011, 12 of which were drilled outside the current PA, and were initially classified as exploratory wells. We were able to establish economically producible reserves for each of these 12 wells and they have been reclassified to development wells. |
Finding and Development Costs
Our reserve replacement ratio represents the amount of proved reserves added to our reserve base during the year, as compared to the amount of oil and gas we produced. For the year ended December 31, 2011, we had extensions and discoveries of 31.7 Bcfe, providing for a reserve replacement ratio of 339%.
During 2011, we expended $21.3 million in finding and development costs, defined as costs we incurred in 2011 related to successful exploratory wells and successful and dry hole development wells. This activity resulted in a one-year finding and development cost in 2011 of $0.67 per Mcfe. “Finding and development costs per Mcfe” is determined by dividing our annual exploratory and development costs, as defined above, by proved reserve additions, including both developed and undeveloped reserves added during the current year (gross amounts, not net of production). We use this measure as one indicator of the overall effectiveness of our exploration and development activities.
In determining the finding and development costs per Mcfe for the years ended December 31, 2011, 2010 and 2009, total proved reserve additions consisted of (expressed in Mcfe):
| As of December 31 | ||||||||||||
| 2011 | 2010 | 2009 | ||||||||||
| Proved Developed (MMcfe) |
10,787 | 3,021 | 10,543 | |||||||||
| Proved Undeveloped (MMcfe) |
20,925 | 13,941 | 11,761 | |||||||||
|
|
|
|
|
|
|
|||||||
| Total Proved Reserves Added (Mmcfe) |
31,712 | 16,962 | 22,304 | |||||||||
|
|
|
|
|
|
|
|||||||
| One year finding and development costs per Mcfe |
$ | 0.67 | $ | 0.68 | $ | 0.91 | ||||||
Our finding and development costs per Mcfe measure has certain limitations. Consistent with industry practice, our finding and development costs have historically fluctuated on a year-to-year basis based on a number of factors including the extent and timing of new discoveries, property acquisitions and fluctuations in the commodity prices used to estimate reserves. Due to the timing of proved reserve additions and timing of the related costs incurred to find and develop our reserves, our finding and development costs per Mcfe measure often includes quantities of reserves for which a majority of
13
Table of Contents
the costs of development have not yet been incurred or may exclude costs to drill an exploratory well before reserves have been established. Conversely, the measure also often includes costs to develop proved reserves that were added in earlier years. Finding and development costs, as measured annually, may not be indicative of our ability to economically replace oil and natural gas reserves because the recognition of costs may not necessarily coincide with the addition of proved reserves. Our finding and development costs per Mcfe may also be calculated differently than the comparable measure for other oil and gas companies.
Acreage
The following tables set forth the gross and net acres of developed and undeveloped oil and gas leases in which we had working interests and royalty interests as of December 31, 2011. Undeveloped acreage includes leasehold interests that may have been classified as containing proved undeveloped reserves.
Acreage by Working Interest:
| Developed Acres (1) | Undeveloped Acres (2) | Total Acres | ||||||||||||||||||||||
| State |
Gross | Net | Gross | Net | Gross | Net | ||||||||||||||||||
| Wyoming |
123,342 | 12,737 | 142,601 | 89,622 | 265,943 | 102,359 | ||||||||||||||||||
| Nevada |
— | — | 33,375 | 7,166 | 33,375 | 7,166 | ||||||||||||||||||
| Utah |
637 | 16 | 46,440 | 21,146 | 47,077 | 21,162 | ||||||||||||||||||
| Other |
5,544 | 2,678 | 6,838 | 4,342 | 12,382 | 7,020 | ||||||||||||||||||
|
|
|
|
|
|
|
|
|
|
|
|
|
|||||||||||||
| Total |
129,523 | 15,431 | 229,254 | 122,276 | 358,777 | 137,707 | ||||||||||||||||||
|
|
|
|
|
|
|
|
|
|
|
|
|
|||||||||||||
Acreage by Royalty Interest:
| Developed Acres (1) | Undeveloped Acres (2) | Total Acres | ||||||||||||||||||||||
| State |
Gross | Net | Gross | Net | Gross | Net | ||||||||||||||||||
| Wyoming |
10,464 | 162 | 27,763 | 1,547 | 38,227 | 1,709 | ||||||||||||||||||
| Other |
3,089 | 63 | 5,633 | 483 | 8,722 | 546 | ||||||||||||||||||
|
|
|
|
|
|
|
|
|
|
|
|
|
|||||||||||||
| Total |
13,553 | 225 | 33,396 | 2,030 | 46,949 | 2,255 | ||||||||||||||||||
|
|
|
|
|
|
|
|
|
|
|
|
|
|||||||||||||
| (1) | Developed acreage is acreage assigned to producing wells for the spacing unit of the producing formation. Developed acreage in certain of our properties that include multiple formations with different well spacing requirements may be considered undeveloped for certain formations, but have only been included as developed acreage in the presentation above. |
| (2) | Undeveloped acreage is lease acreage on which wells have not been drilled or completed to a point that would permit the production of commercial quantities of oil and gas regardless of whether such acreage contains proved reserves. |
14
Table of Contents
Substantially all of the leases summarized in the preceding table will expire at the end of their respective primary terms unless the existing leases are renewed, production has been obtained from the acreage subject to the lease prior to that date, or a suspension of a lease is granted. The following table sets forth the gross and net acres subject to leases summarized in the preceding table that will expire during the years indicated:
| Expiring Acreage | ||||||||
| Year |
Gross | Net | ||||||
| 2012 |
16,275 | 3,273 | ||||||
| 2013 |
3,564 | 1,320 | ||||||
| 2014 and thereafter |
385,887 | 135,369 | ||||||
|
|
|
|
|
|||||
| Total |
405,726 | 139,962 | ||||||
|
|
|
|
|
|||||
Other Significant Developments since December 31, 2010
In July, 2011, we sold 75% of our interest in leases of 36,045 gross (30,264 net) acres in the Huntington Valley in Elko and White Pine Counties, Nevada for cash proceeds of $371. We had impaired these properties in 2008, as we had no plans to develop the leases and there had been no commercial deposits of oil and gas found in the area. We retained a small overriding royalty interest in the Nevada interests sold.
On October 24, 2011, we amended our credit facility to increase the revolving line of credit to $150 million ($60 million borrowing base) and extended the maturity date of the facility to October 24, 2016. The amendment also lowered the interest rate margin for the level of funds borrowed to between 0.75% and 1.75%.
Marketing and Major Customers
The principal products produced by us are natural gas and crude oil. These products are marketed and sold primarily to purchasers that have access to nearby pipeline facilities. Typically, oil is sold at the wellhead at field-posted prices and natural gas is sold both (i) under contract at negotiated prices based upon factors normally considered in the industry (such as distance from well to pipeline, pressure, quality); and (ii) at spot prices. We currently have no long-term delivery contracts in place.
The marketing of most of our products is performed by a third-party marketing company, Summit Energy, LLC. During the years ended December 31, 2011, 2010 and 2009, we sold 76%, 77% and 85%, respectively, of our total oil and gas sales volumes to Summit Energy, LLC. No other companies purchased more than 10% of our oil and gas production. Although a substantial portion of our production is purchased by one customer, we do not believe the loss of this customer would likely have a material adverse effect on our business because there are other customers in the area that would be accessible to us.
Title to Properties
Substantially all of our working interests are held pursuant to leases from third parties. A title opinion is usually obtained prior to the commencement of drilling operations on properties. We have obtained title opinions or conducted a thorough title review on substantially all of our producing properties and believe that we have satisfactory title to such properties in accordance with standards generally accepted in the oil and gas industry. The majority of the value of our properties is subject to a mortgage under our credit facility, customary royalty interests, liens for current taxes, and other burdens that we believe do not materially interfere with the use of or affect the value of such properties. We also perform a title investigation before acquiring undeveloped leasehold interests.
Seasonality
Generally, but not always, the demand and price levels for natural gas increase during the colder winter months and warmer summer months but decrease during the spring and fall (“shoulder months”). Pipelines, utilities, local distribution companies and industrial users utilize natural gas storage facilities and purchase some of their anticipated winter and summer requirements during the shoulder months, which can lessen seasonal demand fluctuations. We have entered into various financial derivative instruments for a portion of our production, which reduces our overall exposure to seasonal demand and resulting commodity price fluctuations.
15
Table of Contents
Competition
The oil and gas industry is highly competitive and we compete with a substantial number of other companies that have greater financial and other resources than we do. We encounter significant competition particularly in acquiring desirable leasehold acreage for our drilling and development operations, locating and acquiring prospective oil and natural gas properties, obtaining experienced and qualified oil service providers, obtaining purchasers and transporters of the oil and natural gas we produce and hiring and retaining key employees and other personnel. There is also competition between oil and natural gas producers and other industries producing energy and fuel. Our competitive position also depends on our geological, geophysical and engineering expertise, and our financial resources. We believe that the location of our leasehold acreage, our exploration, drilling and production expertise and the experience and knowledge of our management and industry partners generally enables us to compete effectively in our current operating areas.
Government Regulations
Exploration for, and production and marketing of, crude oil and natural gas are extensively regulated at the federal and state and local levels. Matters subject to regulation include the issuance of drilling permits, allowable rates of production, the methods used to drill and case wells, reports concerning operations (including hydraulic fracture stimulation reports), the spacing of wells, the unitization of properties, taxation issues and environmental protection (including climate change). These regulations are under constant review and may be amended or changed from time-to-time in response to economic or political conditions. Pipelines are also subject to the jurisdiction of various federal, state and local agencies. Our ability to economically produce and sell crude oil and natural gas is affected by a number of legal and regulatory factors, including federal, state and local laws and regulations in the US and laws and regulations of foreign nations. Many of these governmental bodies have issued rules and regulations that are often difficult and costly to comply with, and that carry substantial penalties for failure to comply. These laws, regulations and orders may restrict the rate of crude oil and natural gas production below the rate that would otherwise exist in the absence of such laws, regulations and orders. The regulatory burden on the crude oil and natural gas industry increases our costs of doing business and consequently affects our profitability. See Item 1A. Risk Factors – Our operations are subject to governmental risks that may impact our operations.
Examples of US federal agencies with regulatory authority over our exploration for, and production and sale of, crude oil and natural gas include:
| • | The BLM and the Bureau of Ocean Energy Management, Regulation and Enforcement (“BOEMRE”) (formerly the Minerals Management Service), which under laws such as the Federal Land Policy and Management Act, Endangered Species Act, National Environmental Policy Act and Outer Continental Shelf Lands Act have certain authority over our operations on federal lands, particularly in the Rocky Mountains; |
| • | The Environmental Protection Agency (“EPA”) and the Occupational Safety and Health Administration, which under laws such as the Comprehensive Environmental Response, Compensation and Liability Act, as amended, the Resource Conservation and Recovery Act, as amended, the Oil Pollution Act of 1990, the Clean Air Act, the Clean Water Act, the Occupational Safety and Health Act and the recent Final Mandatory Reporting of Greenhouse Gases Rule have certain authority over environmental, health and safety matters affecting our operations; and |
| • | The Federal Energy Regulatory Commission, which under laws such as the Energy Policy Act of 2005 has certain authority over the marketing and transportation of crude oil and natural gas. |
In 2010, the BLM issued a revised oil and gas leasing policy that requires, among other things, a more detailed environmental review prior to leasing oil and natural gas resources, increased public engagement in the development of master leasing and development plans prior to leasing areas where intensive new oil and gas development is anticipated, and a comprehensive parcel review process. We do not expect this legislation to impact our current development projects, but it may impact our future leasing opportunities and cause longer lead-times in the permitting process.
Most of the states within which we operate have separate agencies with authority to regulate related operational and environmental matters. Some of the counties and municipalities within which we operate have adopted regulations or ordinances that impose additional restrictions on our oil and gas exploration, development and production.
16
Table of Contents
We participate in a substantial percentage of our wells on a non-operated basis, and accordingly may be limited in our ability to control some risks associated with these natural gas and oil operations. We believe that operations where we own interests, whether operated or not, comply in all material respects with the applicable laws and regulations and that the existence and enforcement of these laws and regulations have no more restrictive an effect on our operations than on other similar companies in our industry.
Environmental Laws and Regulations
Our operations are subject to numerous federal, state and local laws and regulations governing the siting of operations, the release of materials into the environment or otherwise relating to environmental protection. These laws and regulations may require the acquisition of a permit before drilling commences, restrict the types, quantities and concentration of various substances that can be released into the environment in connection with drilling and production activities, limit or prohibit drilling activities on specified lands within wilderness, wetlands and other protected areas, require remedial measures to mitigate pollution from former operations, such as pit closure and plugging abandoned wells, and impose substantial liabilities for pollution resulting from production and drilling operations. To the extent laws are enacted or other governmental action is taken that restricts drilling or imposes more stringent and costly waste handling, disposal and cleanup requirements, our business and prospects could be adversely affected.
The National Environmental Policy Act (“NEPA”) requires a thorough review of the environmental impacts of “major federal actions” and a determination of whether proposed actions on federal land would result in “significant impact”. For oil and gas operations on federal lands or requiring federal permits, NEPA review can increase the time for obtaining approval and impose additional regulatory burdens on the natural gas and oil industry, thereby increasing our costs of doing business and our profitability. The federal Comprehensive Environmental Response, Compensation and Liability Act, or CERCLA, also known as the “Superfund” law, imposes liability, without regard to fault, on certain classes of persons with respect to the release of a “hazardous substance” into the environment. The Resource Conservation and Recovery Act imposes regulations on the management, handling, storage, transportation and disposal of solid and hazardous wastes, and may also impose cleanup liability on certain classes of persons regulated under that federal statute. Our operations may also be subject to the Clean Air Act, the Clean Water Act, the Endangered Species Act, the National Historic Preservation Act and a variety of other federal, state and local review, mitigation, permitting, reporting, and registration requirements relating to protection of the environment. We believe that we, as operators, and the outside operators with which we do business are in substantial compliance with current applicable federal, state and local environmental laws and regulations and that continued compliance with existing requirements will not have a material adverse effect on us. Nevertheless, changes in environmental laws have the potential to adversely affect operations.
It is customary in our industry to recover natural gas and oil from formations through the use of hydraulic fracturing. Hydraulic fracturing involves the injection of water, sand and chemicals under pressure into rock formations to stimulate natural gas production. These formations are generally geologically separated and isolated from fresh ground water supplies by protective rock layers. We find that the use of hydraulic fracturing is necessary to produce commercial quantities of natural gas and oil from many reservoirs, including the CBM wells in the Atlantic Rim. Currently, regulation of hydraulic fracturing is primarily conducted at the state level through permitting and other compliance requirements. Concern around the exploration and development of shale gas using hydraulic fracturing has continued to grow, which may give rise to additional regulation in this area. If passed into law, such efforts could have an adverse effect on our operations.
We have made and will continue to make expenditures in our efforts to comply with environmental requirements. We do not believe that we have, to date, expended material amounts in connection with such activities or that compliance with such requirements will have a material adverse effect on our capital expenditures, earnings or competitive position. Although such requirements do have a substantial impact on the crude oil and natural gas industry, we do not believe that they do not appear to affect us to any greater or lesser extent than other companies in the industry.
Employees and Office Space
As of December 31, 2011, we had 23 full-time employees. None of our employees is subject to a collective bargaining agreement, and we consider our relations with our employees to be good. We lease 7,470 square feet of office space in Denver, Colorado, for our principal executive offices. We also own 6,765 square feet of office space in Casper, Wyoming that houses our land and geology departments.
17
Table of Contents
Available Information
Our Annual Report on Form 10-K, Quarterly Reports on Form 10-Q, and amendments to reports filed or furnished pursuant to Sections 13(a) and 15(d) of the Securities Exchange Act of 1934, as amended, are available on our website at http://www.dble.com/, as soon as reasonably practicable after we electronically file such reports with, or furnish those reports to the Securities and Exchange Commission. Our Annual Report on Form 10-K, Quarterly Reports on Form 10-Q and amendments to reports are available free of charge by writing to:
Double Eagle Petroleum Co.
c/o John Campbell, Investor Relations
1675 Broadway, Suite 2200
Denver, CO 80202
We maintain a code of ethics applicable to our Board of Directors, principal executive officer, and principal financial officer, as well as all of our other employees. A copy of our Code of Business Conduct and Ethics and our Whistleblower Procedures may be found on our website at http://www.dble.com/, under the Corporate Governance section. These documents are also available in print to any stockholder who requests them. Requests for these documents may be submitted to the above address.
Information on our website is not incorporated by reference into this Form 10-K and should not be considered a part of this document.
Glossary
The terms defined in this section are used throughout this Annual Report on Form 10-K.
2-D seismic. The standard acquisition technique used to image geologic formations over a broad area. Data is collected by a single line of energy sources which reflect seismic waves to a single line of geophones. 2-D seismic data produces an image of a single vertical plane of sub-surface data.
3-D seismic. Acoustical reflection data that depict the subsurface strata in three dimensions. 3-D seismic typically provides a more detailed and accurate interpretation of the subsurface strata than 2-D, or two-dimensional, seismic.
Bbl. One stock tank barrel, or 42 U.S. gallons liquid volume, used in reference to oil or other liquid hydrocarbons.
Bcf. Billion cubic feet, used in reference to natural gas.
Bcfe. Billion cubic feet of gas equivalent. Gas equivalents are determined using the ratio of six Mcf of gas (including gas liquids) to one Bbl of oil.
Btu. A British Thermal Unit is the amount of heat required to raise the temperature of a one-pound mass of water by one degree Fahrenheit.
Development well. A well drilled within the proved area of an oil or gas reservoir to the depth of a stratigraphic horizon known to be productive in an attempt to recover proved undeveloped reserves.
Dry hole. A well found to be incapable of producing either oil or gas in sufficient quantities to justify completion as an oil or gas well.
Estimated net proved reserves. The estimated quantities of oil, gas and gas liquids which geological and engineering data demonstrate with reasonable certainty to be recoverable in future years from known reservoirs under existing economic and operating conditions.
18
Table of Contents
Exploratory well. A well drilled to find and produce oil or gas in an unproved area, to find a new reservoir in a field previously found to be productive of oil or gas in another reservoir or to extend a known reservoir beyond its productive horizon.
Economically producible. A resource which generates revenue that exceeds, or is reasonably expected to exceed, the costs of the operation.
Field. An area consisting of a single reservoir or multiple reservoirs all grouped on or related to the same individual geological structural feature or stratigraphic condition.
Hydraulic fracturing. The injection of water, sand and additives under pressure, usually down casing that is cemented in the wellbore, into prospective rock formations at depth to stimulate natural gas and oil production.
Gross acre. An acre in which a working interest is owned.
Gross well. A well in which a working interest is owned.
MBbl. One thousand barrels of oil or other liquid hydrocarbons.
Mcf. One thousand cubic feet.
Mcfe. One thousand cubic feet of gas equivalent. Gas equivalents are determined using the ratio of six Mcf of gas (including gas liquids) to one Bbl of oil.
MMcf. One million cubic feet.
MMcfe. One million cubic feet of gas equivalent. Gas equivalents are determined using the ratio of six Mcf of gas (including gas liquids) to one Bbl of oil.
MMBtu. One million British Thermal Units.
Net acres or net wells. The sum of our fractional working interests owned in gross acres or gross wells.
Participating area. A spacing unit established for producing well within a federal exploratory unit approved by the BLM. All interest owners in the PA share in all well(s) production on a proportional basis to their interest in the PA. As more wells are drilled adjacent to the PA, the PA is enlarged or revised. At each revision, all interest owner’s participation is recalculated.
Permeability. The ability, or measurement of a rock's ability, to transmit fluids. Formations that transmit fluids readily, such as sandstones, are described as permeable and tend to have many large, well-connected pores. Impermeable formations, such as shales and siltstones, tend to be finer grained or of a mixed grain size, with smaller, fewer, or less interconnected pores.
Productive well. A well that is producing oil or gas or that is capable of production.
Proved developed reserves. Proved reserves that can be expected to be recovered through existing wells with existing equipment and operating methods.
Proved reserves. The quantities of oil, natural gas and natural gas liquids, which, by analysis of geoscience and engineering data, can be estimated with reasonable certainty to be economically producible – from a given date forward, from known reservoirs under existing economic conditions and operating conditions.
Proved undeveloped reserves. Proved reserves that are expected to be recovered from new wells on undrilled acreage, or from existing wells where a relatively major expenditure is required for recompletion.
PV-10 value. The present value of estimated future gross revenue to be generated from the production of estimated net proved reserves, net of estimated production and future development costs, using prices and costs in effect as of the date indicated (unless such prices or costs are subject to change pursuant to contractual provisions), without giving effect to non-property related expenses such as general and administrative expenses, debt service and future income tax expenses or to depreciation, depletion and amortization, discounted using an annual discount rate of 10 percent. While this measure does not include the effect of income taxes as it would in the use of the standardized measure calculation, it does provide an indicative representation of the relative value of the company on a comparative basis to other companies and from period to period.
19
Table of Contents
Royalty. The share paid to the owner of mineral rights expressed as a percentage of gross income from oil and gas produced and sold unencumbered by expenses relating to the drilling, completing and operating of the affected well.
Royalty interest. An interest in an oil and gas property entitling the owner to shares of oil and gas production free of costs of exploration, development and production.
Undeveloped acreage. Lease acreage on which wells have not been drilled or completed to a point that would permit the production of commercial quantities of oil and gas, regardless of whether such acreage contains estimated net proved reserves.
Unitization. A type of sharing arrangement by which owners of operating and non-operating working interests pool their property interests in a producing area to form a single operating unit. The share that each interest owner receives is based upon the respective acreage contributed by each owner in the participating area.
Working interest. The operating interest that gives the owner the right to drill, produce and conduct operating activities on the property and to share in the production. Working interest owners also share a proportionate share of the costs of exploration, development, and production costs.
| ITEM1A. | RISK FACTORS |
Investing in our securities involves risk. In evaluating us, careful consideration should be given to the following risk factors, in addition to the other information included or incorporated by reference in this Form 10-K. Each of these risk factors, as well as other risks described elsewhere in this Form 10-K, could materially adversely affect our business, operating results or financial condition, as well as adversely affect the value of an investment in our common or preferred stock. See “Cautionary Note about Forward-Looking Statements’’ for additional risks and information regarding forward- looking statements.
Risks Related to the Oil and Natural Gas Industry and Our Business
We cannot predict the future price of natural gas and sustained low prices could hurt our profitability, financial condition and ability to grow.
Natural gas made up approximately 98% of our total production for the year ended December 31, 2011 and represented 98% of our reserves as of December 31, 2011. Our revenues, profitability liquidity, future rate of growth and the carrying value of our properties depend heavily on prevailing prices for natural gas. Historically natural gas prices have been highly volatile, particularly in the Rocky Mountain region of the United States, and in recent years have been depressed by excess total domestic natural gas supplies. Prices have also been affected by actions of federal, state and local governments and agencies, foreign governments, national and international economic and political conditions, levels of consumer demand, weather conditions, domestic and foreign supply of oil and natural gas, proximity and capacity of gas pipelines and other transportation facilities, and the price and availability of alternative fuels. In addition, sales of natural gas are seasonal in nature, leading to substantial differences in cash flow at various times throughout the year. These external factors and the volatile nature of the energy markets make it difficult to estimate future prices of natural gas. Any substantial or extended decline in the price of natural gas would have a material adverse effect on our financial condition and results of operations, including reduced cash flow, borrowing capacity and our reserves. Price volatility also makes it difficult to budget for and project the return on potential acquisitions and development and exploration projects, and sustained lower gas prices may cause us or the operators of properties in which we have interests to curtail some projects and drilling activity.
The unavailability or high cost of equipment, personnel and other oil field services could adversely affect our ability to execute our exploration and development plans on a timely basis and within our budget.
Our industry is cyclical and, from time to time, there is a shortage of equipment, qualified personnel, and oil field services. Regardless of the economic conditions, there may not be enough available qualified personnel in our industry. Also, as part of our business strategy, we rely on oil field service groups for a number of services, including drilling, cementing and hydraulic fracturing. Due to the increasing activity and attractiveness of the shale opportunities across the United States, there is increased competition for qualified and experienced crews in the Rocky Mountain region. If we are unable to economically attract qualified personnel or secure qualified oil field services, our drilling program may be delayed and our operations otherwise may be adversely affected.
20
Table of Contents
A U.S. and global economic downturn could have a material adverse effect on our business and operations.
The European sovereign debt crisis has had a negative effect on world economic growth, which has increased concerns about global economic recovery. Any or all of the following may occur as a result of a renewed crisis in the global financial and securities markets and resulting economic downturn:
| • | The economic slowdown has led and could continue to lead to lower demand for oil and natural gas by individuals and industries, which has contributed to and could continue to contribute to lower prices for the natural gas sold by us, lower revenues and possibly losses. |
| • | The lenders under our bank credit facility may become more restrictive in their lending practices or unable or unwilling to fund their commitments, which would limit our access to capital to fund our capital expenditures and operations. This would limit our ability to generate revenues as well as limit our projected production and reserves growth, leading to declining production and possibly losses. |
| • | We may be unable to obtain additional debt or equity financing, which would require us to limit our capital expenditures and other spending. This would lead to lower growth in our production and reserves than if we were able to spend more than our cash flow. Financing costs may significantly increase as lenders may be reluctant to lend without receiving higher fees and spreads. |
| • | The losses incurred by financial institutions, as well as the bankruptcy of some financial institutions, heightens the risk that a counterparty to our hedge arrangements could default on its obligations. These losses and the possibility of a counterparty declaring bankruptcy may affect the ability of the counterparties to meet their obligations to us on hedge transactions, which could reduce our revenues from hedges at a time when we are also receiving a lower price for our natural gas and oil sales. As a result, our financial condition could be materially adversely affected. |
| • | Pipeline companies may be unable to obtain funding for new pipelines, leading to an increased inability to transport gas out of our operating areas in the Rocky Mountains to markets with higher demand and higher prices. As a result, we could be faced with lower prices in the Rocky Mountain region due to increasing supplies and lower demand in the region compared to more populated and more heavily industrialized areas with higher demand. This would result in lower revenues for us and possibly losses. |
| • | Bankruptcies of financial institutions or illiquidity of money market funds may limit or delay our access to our cash equivalent deposits, causing us to lose some or all of those funds or to incur additional costs to borrow funds needed on a short-term basis that were previously funded from our money market deposits. |
| • | Bankruptcies of purchasers of our natural gas and oil could lead to the delay or failure of us to receive the revenues from those sales. |
Indebtedness may limit our liquidity and financial flexibility.
As of December 31, 2011, we had $42 million drawn under our bank credit facility and we had 1,610,000 shares of our Series A Preferred Stock outstanding (redeemable at our option), which require payment of cumulative cash dividends at a rate of 9.25% per year.
Our indebtedness affects our operations in several ways, including
| • | a portion of our cash flows from operating activities must be used to service our indebtedness and is not available for other purposes; |
| • | we may be at a competitive disadvantage as compared to similar companies that have less debt; |
| • | our credit facility limits the amounts we can borrow to a borrowing base amount, determined by our lenders in their sole discretion based on their assessment of current and future commodity prices. The lenders can adjust the borrowing base and the borrowings permitted to be outstanding under the credit facility. Any decrease in the borrowing base could limit our ability to fund operations or future development; |
21
Table of Contents
| • | upon any downward adjustment of the borrowing base, if the outstanding borrowings are in excess of the revised borrowing base, we may have to repay our indebtedness in excess of the borrowing base immediately, or in six monthly installments, or pledge additional properties as collateral. We may not have sufficient funds to make such repayments or additional properties to pledge as collateral; |
| • | the covenants contained in the agreements governing our outstanding indebtedness and future indebtedness may limit our ability to borrow additional funds, pay dividends and make certain investments and may also affect our flexibility in planning for, and reacting to, changes in the economy and in our industry; and |
| • | additional financing in the future for working capital, capital expenditures, acquisitions, general corporate or other purposes may have higher costs and more restrictive covenants. |
We may incur additional debt in order to fund our exploration, development and acquisition activities. A higher level of indebtedness increases the risk that our liquidity may become impaired and we may default on our debt obligations. Our ability to meet our debt obligations and reduce our level of indebtedness depends on future performance. General economic conditions, natural gas and oil prices and financial, business and other factors will affect our operations and our future performance. Many of these factors are beyond our control. We may not be able to generate sufficient cash flow to pay the interest on our debt, and future working capital, borrowings and equity financing may not be available to pay or refinance such debt.
Our operations require substantial capital and we may be unable to fund our planned capital expenditures.
The oil and gas industry is capital intensive. We spend and will continue to spend a substantial amount of capital for the acquisition, exploration, exploitation, development and production of natural gas and oil reserves. We have historically addressed our short and long-term liquidity needs through the use of cash flow provided by operating activities, borrowing under bank credit facilities, and the issuance of equity. Without adequate capital we may not be able to successfully execute our operating strategy. The availability of these sources of capital will depend upon a number of factors, some of which are beyond our control. These factors include:
| • | general economic and financial market conditions; |
| • | our proved reserves; |
| • | our ability to acquire, locate and produce new reserves; |
| • | global credit and securities markets; |
| • | natural gas and oil prices; and |
| • | our market value and operating performance. |
If low natural gas and oil prices, lack of adequate gathering or transportation facilities, operating difficulties or other factors, many of which are beyond our control, cause our revenues and cash flows from operating activities to decrease, we may be limited in our ability to obtain the capital necessary to complete our capital expenditures program.
Natural gas and oil drilling and production operations can be hazardous and expose us to liabilities
The exploration, development and operation of oil and gas properties involve a variety of operating risks, including the risk of fire, explosions, blowouts, hole collapse, pipe failure, abnormally pressured formations, natural disasters, vandalism, and environmental hazards, including gas and oil leaks, pipeline ruptures or discharges of toxic gases. These industry related operating risks can result in injury or loss of life, severe damage to or destruction of property, natural resources and equipment, pollution or other environmental damage, clean-up responsibilities, regulatory investigation and penalties, and suspension of operations which could result in substantial losses.
We maintain insurance against some, but not all, of the risks described above. Such insurance may not be adequate to cover losses or liabilities. Also, we cannot predict the continued availability of insurance at premium levels that justify its purchase. The occurrence of a significant event that is not fully insured or indemnified against could materially and adversely affect our financial condition and operations.
22
Table of Contents
Our operations are subject to governmental risks that may impact our operations.
Our operations have been, and at times in the future may be, affected by political developments and are subject to complex federal, state, local and other laws and regulations such as:
| • | hydraulic fracturing |
| • | restrictions on production |
| • | permitting |
| • | changes in taxes |
| • | deductions |
| • | royalties and other amounts payable to governments or governmental agencies |
| • | price or gathering-rate controls, and |
| • | environmental protection regulations |
In order to conduct our operations in compliance with these laws and regulations, we must obtain and maintain numerous permits, approvals and certificates from various federal, state and local governmental authorities. We may incur substantial costs in order to maintain compliance with these existing laws and regulations. Failure to comply with these laws and regulations also may result in the suspension or termination of our operations and/or subject us to administrative, civil and criminal penalties. In addition, our costs of compliance may increase if existing laws or regulations, including environmental and tax laws, and regulations are revised or reinterpreted, or if new laws or regulations become applicable to our operations. For example, currently proposed federal legislation and regulation, that, if adopted, could adversely affect our business, financial condition and results of operations, include legislation and regulation related to hydraulic fracturing, derivatives, and environmental regulations, which are each discussed below. In addition, there has been a significant amount of discussion by the United States Congress and presidential administrations concerning a variety of energy tax proposals, including the elimination of the immediate deduction for intangible drilling and development costs. These proposals would potentially increase and accelerate the payment of federal income taxes of producers of natural gas and oil, which would have a materially adverse impact on our cash flows and financial condition.
| • | Federal and state legislation and regulatory initiatives relating to hydraulic fracturing could result in increased costs and additional operating restrictions and could reduce the amount of natural gas and oil we can produce. Hydraulic fracturing involves the injection of water, sand and chemicals under pressure into rock formations to stimulate natural gas production. We find that the use of hydraulic fracturing is necessary to produce commercial quantities of natural gas and oil from many reservoirs. Currently, regulation of hydraulic fracturing is primarily conducted at the state level through permitting and other compliance requirements. Concern around the exploration and development of shale gas using hydraulic fracturing has continued to grow, which may give rise to additional regulation in this area. Concerns about potential drinking water contamination has led the U.S. Congress to consider legislation to amend the federal Safe Drinking Water Act to require the disclosure of chemicals used by the oil and natural gas industry in the hydraulic fracturing process. In Wyoming, where we conduct substantially all of our operations, we are now required to provide detailed information about wells we hydraulically fracture. Any other new federal or state laws or regulations that significantly restrict hydraulic fracturing could make it more difficult or costly for us to perform hydraulic fracturing activities and thereby affect our determination of whether a well is commercially viable. In addition, if hydraulic fracturing is regulated at the federal level, our fracturing activities could become subject to additional permit requirements or operational restrictions and also to associated permitting delays and potential increases in costs. We conduct hydraulic fracturing operations on most of our wells, and therefore restrictions on hydraulic fracturing could reduce the amount of oil and natural gas that we are ultimately able to produce in commercial quantities. |
| • | Federal legislation may decrease our ability, and increase the cost, to enter into hedging transactions. The Dodd-Frank Act passed in July 2010 expanded federal regulation of financial derivative instruments, including credit default swaps, commodity derivatives and other over-the-counter derivatives. Although under the current definitions within the Dodd Frank Act we believe that we would meet the qualifications for exemption status with respect to the requirement to post cash collateral in all hedging transactions, we cannot at this time predict the impact of any final regulations adopted. If the regulations ultimately adopted require us to post cash collateral, our hedging program may become more expensive and we may choose to alter our hedging strategy. |
| • | Various federal and state government organizations are considering enacting new legislation and regulations governing or restricting the emission of greenhouse gases. In addition to various proposed state regulations, at the federal level, the EPA has taken recent action related to greenhouse gas emissions (“GHGs”). The EPA now purports to have a basis to begin regulating emissions of GHGs under the federal Clean Air Act. Legislative and regulatory proposals for restricting GHGs or otherwise addressing climate change could require us to incur additional operating costs and could adversely affect demand for the natural gas and oil that we sell. The potential increase in our operating costs could include new or increased costs to obtain permits, operate and maintain our equipment and facilities, install new emission controls on our equipment and facilities, acquire allowances to authorize our GHGs, and administer and manage a GHGs program. |
23
Table of Contents
We may be unable to find reliable and economic markets for our gas production.
All of our current natural gas production is produced in the Rocky Mountain region, and there is a limited amount of transportation volume availability for all of the area producers. Although there are numerous transportation pipeline projects, we cannot predict whether these new pipelines will add enough capacity in the future. We have contracts with marketing companies that provide for the availability of transportation for our natural gas but interruption of any transportation line out of the Rocky Mountains could have a material impact on our financial condition.
In addition, the transportation providers have gas quality requirements, including Btu content, and carbon dioxide content. The gas we produce in the Catalina Unit is transported on the Southern Star Transportation line, which has various gas quality requirements, including that gas must have carbon dioxide content below 1%. We are currently in compliance with this requirement; however, in certain prior years our carbon dioxide exceeded this limit. If this problem recurs, and we are unable to obtain a waiver, we may incur additional costs to process this gas, or we may experience a production interruption at certain wells, which could have a material adverse impact on our cash flow and results of operations.
Acquisitions are a part of our growth strategy, and we may not be able to identify, execute, or integrate acquisitions successfully
There is strong competition for acquisition opportunities in our industry, and this can be particularly challenging for a company of our size and capital structure. Our ability to identify and complete acquisitions is dependent upon, among other things, our ability to obtain debt and equity financing and, in some cases, regulatory approvals. Our ability to pursue our acquisition strategy may be hindered if we are not able to obtain financing or regulatory approvals on economically attractive terms, or at all. Additionally, competition for acquisitions may increase the cost of, or cause us to refrain from, completing acquisitions.
We could be subject to significant liabilities related to acquisitions. The successful acquisition of producing and non-producing properties requires an assessment of a number of factors, many of which are beyond our control. These factors include recoverable reserves, future oil and gas prices, operating costs and potential environmental and other liabilities, title issues and other factors. It generally is not feasible to review in detail every individual property included in an acquisition. Ordinarily, a review is focused on higher valued properties. Further, even a detailed review of all properties and records may not reveal existing or potential problems, nor will it permit us to become sufficiently familiar with the properties to assess fully their deficiencies and capabilities. We do not always inspect every well we acquire, and environmental problems, such as groundwater contamination, are not necessarily observable even when an inspection is performed. We cannot assure you that we will realize the expected benefits or synergies of a transaction.
Acquisitions also often pose integration risks and difficulties. In connection with future acquisitions, the process of integrating acquired operations into our existing operations may result in unforeseen operating difficulties and may require significant management attention and financial resources that would otherwise be available for the ongoing development or expansion of existing operations. Acquisitions could result in us incurring additional debt, contingent liabilities and expenses, all of which could have a material adverse effect on our financial condition and operating results.
Competition in the oil and natural gas industry is intense, and many of our competitors have greater financial and other resources than we do.
We operate in the highly competitive areas of oil and natural gas exploration, development and production. We face intense competition from both major integrated energy companies and other independent oil and natural gas companies, many of which have resources substantially greater than ours. We compete in each of the following areas:
| • | seeking to acquire desirable producing properties or new leases for future exploration; |
| • | seeking to acquire or merge with desirable companies or business; |
| • | seeking to acquire the equipment and expertise necessary to develop and operate our properties; and |
| • | retention and hiring of skilled employees. |
24
Table of Contents
Our competitors may be able to pay more for development prospects, productive oil and natural gas properties, or other companies and businesses, and may be able to define, evaluate, bid for and purchase a greater number of properties, prospects and companies than our financial or human resources permit. There is also growing pressure for companies to balance their oil to natural gas reserve ratios, as natural gas is considered to be a relatively clean fossil fuel and has potential to become the major fuel for multiple end uses. This may further increase competition, particularly in the emerging natural gas shale plays. Our ability to develop and exploit our oil and natural gas properties and to acquire additional properties or companies in the future will depend upon our ability to successfully conduct operations, evaluate and select suitable properties and consummate transactions in this highly competitive environment.
The exploration, development and operation of oil and gas properties involve substantial risks that may result in a total loss of investment.
Exploring for and, to a lesser extent, developing and operating oil and gas properties involve a high degree of business and financial risk, and thus a substantial risk of loss of investment. We may drill wells that are unproductive or, although productive, do not produce oil and/or natural gas in sufficient quantities to cover the drilling, operating and other costs. Acquisition and completion decisions generally are based on subjective judgments and assumptions that are speculative. We cannot predict with certainty the production potential of a particular property or well. Furthermore, a successful completion of a well does not ensure a profitable return on the investment. There are a variety of geological, operational, and market-related factors that may substantially delay or prevent completion of any well or otherwise prevent a property or well from being profitable. These include:
| • | unusual or unexpected drilling conditions and geological formations, |
| • | weather conditions; |
| • | equipment failures or accidents; and |
| • | shortages or delays in the availability of drilling rigs, equipment or experienced personnel. |
Our reserves and future net revenues may differ significantly from our estimates.
This report contains estimates of our proved oil and natural gas reserves and estimated future net revenues from proved reserves. The estimates of reserves and future net revenues are not exact and are based on many variable and uncertain factors; including assumptions required by the SEC related to oil and gas prices, operating expenses, capital expenditures, taxes, and availability of funds. The process of estimating oil and natural gas reserves requires significant decisions and assumptions in the evaluation of available geological, geophysical, engineering and economic data for each reservoir. Therefore, these estimates are inherently imprecise.
Actual future production, oil and natural gas prices, revenues, taxes, development expenditures, operating expenses and quantities of recoverable oil and natural gas reserves will vary from those estimated. Any significant variance could materially affect the estimated quantities and the value of our reserves. Our properties may also be susceptible to hydrocarbon drainage from production by other operators on adjacent properties. In addition, we may adjust estimates of proved reserves to reflect production history, results of exploration and development, prevailing oil and natural gas prices and other factors, many of which are beyond our control.
At December 31, 2011, approximately 40% of our reserves were classified as proved undeveloped (PUDs). The reserve data reflect our plans to make significant capital expenditures to develop our reserves over the next five years. Actual capital expenditures will likely vary from estimated capital expenditures, development may not occur as scheduled and actual results may not be as estimated. If we choose not to develop our PUDs, or if we are not otherwise able to successfully develop them, we will be required to remove the associated volumes from our reported proved reserves. In addition, under the SEC’s reserve reporting rules, because PUDs generally may be booked only if they relate to wells scheduled to be drilled within five years of the date of booking, we may be required to remove PUDs that are not developed within this five-year time frame.
The present value, discounted at 10%, of the pre-tax future net cash flows attributable to our net proved reserves included in this report should not be considered as the market value of our oil and gas reserves. In accordance with SEC requirements, we base the present value, discounted at 10%, of the pre-tax future net cash flows attributable to our net proved reserves on the average oil and natural gas prices during the 12-month period before the ending date of the period covered by this report determined as an unweighted, arithmetic average of the first-day-of the-month price for each month within such period, adjusted for quality and transportation. The assumed costs to produce the reserves remain constant at the costs prevailing on the date of the estimate. Actual future prices and costs may be materially higher or lower than those used in the present value calculation. In addition, the 10% discount factor, which the SEC requires us to use in calculating our discounted future net revenues for reporting purposes, may not be the most appropriate discount factor based on our cost of capital from time to time and the risks associated with our business.
25
Table of Contents
We do not control all of our operations and development projects.
Certain of our business activities are conducted through operating agreements under which we own partial interests in oil and natural gas wells. If we do not operate wells in which we own an interest, we do not have control over normal operating procedures, expenditures or future development of underlying properties. The failure of an operator of our wells to adequately perform operations, or an operator’s breach of the applicable agreements, could reduce our production and revenues. The success and timing of drilling and development activities on properties operated by others therefore depends upon a number of factors outside of our control, including the operator’s:
| • | timing and amount of capital expenditures; |
| • | expertise and financial resources; |
| • | inclusion of other participants in drilling wells; and |
| • | use of technology. |
Since we do not have a majority interest in most wells we do not operate, we may not be in a position to remove the operator in the event of poor performance.
Substantially all of our producing properties are located in the Rocky Mountains, making us vulnerable to risks associated with operating in one major geographic area.
Our operations have been focused on the Rocky Mountain region, which means our current producing properties and new drilling opportunities are geographically concentrated in that area. Because our operations are not as diversified geographically as many of our competitors, the success of our operations and our profitability may be disproportionately exposed to the effect of any regional events, including fluctuations in prices of natural gas and oil produced from the wells in the region, natural disasters, restrictive governmental regulations, transportation capacity constraints, weather, curtailment of production or interruption of transportation, and any resulting delays or interruptions of production from existing or planned new wells.
Seasonal weather conditions and lease stipulations adversely affect our ability to conduct drilling activities in some of the areas where we operate.
Oil and natural gas operations in the Rocky Mountains are adversely affected by seasonal weather conditions and lease stipulations designed to protect various wildlife. In certain areas on federal lands, drilling and other oil and natural gas activities can only be conducted during limited times of the year. This limits our ability to operate in those areas and can intensify competition during those times for drilling rigs, oil field equipment, services, supplies and qualified personnel, which may lead to periodic shortages. These constraints and the resulting shortages or high costs could delay our operations and materially increase our operating and capital costs.
We may be unable to develop our existing acreage due to the change in environmental and political pressures around natural resource development.
Our anticipated growth and planned expenditures are based upon the assumption that existing leases and regulations will remain intact and allow for the future development of carbon based fuels. However, the United States federal government has not adopted a clear energy policy, and policy decisions continue to be complicated by the political situation in Washington D.C. Our ability to develop known and unknown reserves in areas in which we have reserves or leases may be limited, thereby limiting our ability to grow and generate cash flows from operations.
The largest portion of our anticipated growth and planned capital expenditures is expected to be from properties located in the Atlantic Rim that are covered by the Atlantic Rim EIS. In May 2007, the final Record of Decision for the Atlantic Rim EIS was issued, which allowed us and other operators in the area to pursue additional coal bed methane drilling. Three separate coalitions of conservation groups appealed the approval of the EIS to the BLM. All of the appeals were subsequently dismissed. Although there are currently no outstanding appeals, the BLM allows public comment during the permitting process. Pressure from conservation and environmental groups could ultimately prevent drilling in this area.
26
Table of Contents
Our hedging activities could result in financial losses or could reduce our income.
To achieve a more predictable cash flow and to reduce our exposure to adverse fluctuations in the prices of commodities, we currently, and will likely in the future, enter into hedging arrangements for a portion of our production revenues. Hedging arrangements for a portion of our production revenues expose us to the risk of financial loss in some circumstances, including when:
| • | there is a change in the expected differential between the underlying price in the hedging agreement and actual prices received ; or |
| • | the counterparty to the hedging contract defaults on its contractual obligations. |
In addition, some of the hedging arrangements entered into, mainly swaps, limit the benefit we would receive from increases in commodities prices. Currently, none of our existing hedging activities expose us to cash margin requirements but if we were to hedge with counterparties who are not parties to our credit facility, cash margin requirement may exist. Our counterparties are typically financial institutions that are lenders under our credit facility. The risk that a counterparty may default on its obligations is heightened by the recent financial sector crisis and losses incurred by many banks and other financial institutions, including our counterparties or their affiliates. These losses may affect the ability of the counterparties to meet their obligations to us on hedge transactions, which would reduce our revenues from hedges at a time when we are also receiving a lower price for our production revenues, thus triggering the hedge payments. As a result, our financial condition could be materially adversely affected.
We may be unable to find additional reserves, which would adversely impact our ability to sustain production levels.
Our future operations depend on whether we find, develop or acquire additional reserves that are economically recoverable. Our properties produce oil and gas at a declining rate. Unless we acquire properties containing proved reserves or conduct successful exploration and development activities, or both, our proved reserves, production and revenues will decline over time. There are no assurances that we will be able to find, develop or acquire additional reserves to replace our current and future production at acceptable costs, or at all.
We are exposed to counterparty credit risk as a result of our receivables and hedging transactions.
We are exposed to risk of financial loss from trade, hedging activity, and other receivables. In 2011, we sold approximately 76% of our crude oil and natural gas to one counterparty, which may impact our overall credit risk. We monitor the creditworthiness of our counterparties on an ongoing basis. However, disruptions in the financial markets could lead to sudden changes in a counterparty’s liquidity, and they may be unable to satisfy their obligations to us. We are unable to predict sudden changes in financial market conditions or a counterparty’s creditworthiness or ability to perform. Even if we do accurately predict sudden changes, our ability to negate the risk may be limited depending upon market conditions.
A default by any of our counterparties could have an adverse impact on our ability to fund our planned activities or could result in a larger percentage of our production being subject to commodity price changes. In our hedging arrangements, we use master agreements that allow us, in the event of default, to elect early termination of all contracts with the defaulting counterparty. If we choose to elect early termination, all asset and liability positions with the defaulting counterparty would be “net settled” at the time of election. “Net settlement” refers to a process by which all transactions between counterparties are resolved into a single amount owed by one party to the other. During periods of falling or sustained low commodity prices, the value of our hedge receivable positions increase, which increases our counterparty exposure.
Our use of 2-D and 3-D seismic data is subject to interpretation and may not accurately identify the presence of natural gas and oil, which could adversely affect the results of our drilling operations.
Even when properly used and interpreted, 2-D and 3-D seismic data and visualization techniques are tools used to assist geoscientists in identifying subsurface structures and hydrocarbon indicators and do not enable geoscientists to know whether hydrocarbons are, in fact, present in those structures and the amount of hydrocarbons. In addition, the use of 3-D seismic and other advanced technologies requires greater predrilling expenditures than traditional drilling strategies, and we could incur greater drilling and testing expenses as a result of such expenditures, which may result in a reduction in our returns or losses. As a result, our drilling activities may not be successful or economical, and our overall drilling success rate or our drilling success rate for activities in a particular area could decline.
27
Table of Contents
We may gather 3-D seismic data over large areas. Our interpretation of seismic data delineates those portions of an area that we believe are desirable for drilling. Therefore, we may choose not to acquire option or lease rights prior to acquiring seismic data, and, in many cases, we may identify hydrocarbon indicators before seeking option or lease rights in the location. If we are not able to lease those locations on acceptable terms, we will have made substantial expenditures to acquire and analyze 3-D data without having an opportunity to attempt to benefit from those expenditures.
Risks Related to Our Securities
The trading volatility and price of our common stock may be affected by many factors.
In addition to our operating results and business prospects, many other factors affect the volatility and price of our common stock. The most important of these, some of which are outside our control, are the following:
| • | Governmental action or inaction in light of key indicators of economic activity or events that can significantly influence U.S. financial markets, and media reports and commentary about economic or other matters, even when the matter in question does not directly relate to our business; |
| • | Trading activity in our common stock, which can be a reflection of changes in the prices for oil and gas, or market commentary or expectations about our business and overall industry; and |
| • | Liquidity of our common stock, including whether our total number of shares outstanding continues to be significantly lower than our competition. |
Failure of our common stock to trade at reasonable prices may limit our ability to fund future potential capital needs through issuances or sales of our stock.
Provisions in our corporate documents and Maryland law could delay or prevent a change of control of Double Eagle, even if that change would be beneficial to our stockholders.
Our restated certificate of incorporation and by-laws contain provisions that may make a change of control of Double Eagle difficult, even if it may be beneficial to our stockholders, including the authorization given to our Board of Directors to issue and set the terms of preferred stock. In 2007, our Board of Directors of the Company adopted a Shareholder Rights Plan (“Rights Plan”). The Rights Plan provided us with the ability to issue rights that entitles stockholders to purchase a fractional share of our Series B Junior Participating Preferred Stock at an exercise price of $45, if a person or group acquires, or announces a tender or exchange offer that would result in the acquisition of 20% or more of our common stock. We could issue the rights that would become exercisable by all rights holders, except the acquiring person or group, for shares of our common stock having a value of twice the right’s then-current exercise price. The Rights Plan adopted in 2007 expired in 2010, but the Board of Directors may reinstate it in the future.
| ITEM 1B. | UNRESOLVED STAFF COMMENTS |
None.
| ITEM 3. | LEGAL PROCEEDINGS |
From time to time, we are involved in various legal proceedings, including, but not limited to, the matters discussed below. These proceedings are subject to the uncertainties inherent in any litigation. We are defending ourselves vigorously in all such matters, and while the ultimate outcome and impact of any proceeding cannot be predicted with certainty, our management believes that the resolution of any proceeding will not have a material adverse effect on our financial condition or results of operations.
On December 18, 2009, Tiberius Capital, LLC ("Plaintiff"), a stockholder of Petrosearch Energy Corporation ("Petrosearch") prior to our acquisition (the "Acquisition") of Petrosearch pursuant to a merger between Petrosearch and one of our wholly-owned subsidiaries, filed a claim in the District Court for the Southern District of New York against Petrosearch, us, and the individuals who were officers and directors of Petrosearch prior to the Acquisition. In general, the claims against us and Petrosearch are that Petrosearch inappropriately denied dissenters' rights of appraisal under the Nevada Revised Statutes to its stockholders in connection with the Acquisition, that the defendants violated various sections of the Securities Act of 1933 and the Securities Exchange Act of 1934, and that the defendants caused other damages to the stockholders of Petrosearch. The plaintiff was seeking monetary
28
Table of Contents
damage. On March 31, 2011, the District Court judge dismissed the case. The plaintiff filed a notice of appeal on April 29, 2011 and filed its appellate brief and appendix with the Second Circuit Court of Appeals on August 11, 2011. We filed a brief on October 13, 2011 supporting the District Court's March 31, 2011 opinion and judgment dismissing Tiberius's case.
| ITEM 4. | MINE SAFETY DISCLOSURES |
Not applicable.
| ITEM 5. | MARKET FOR REGISTRANT’S COMMON EQUITY, RELATED STOCKHOLDER MATTERS AND ISSUER PURCHASES OF EQUITY SECURTIES |
Common Stock
Market Information. Our common stock is currently traded on the NASDAQ Global Select Market under the symbol “DBLE”.
The range of high and low sales prices for our common stock for each quarterly period from January 1, 2010 through December 31, 2011 as reported by the NASDAQ Stock Market, is set forth below:
| Quarter Ended |
High | Low | ||||||
| March 31, 2011 |
$ | 12.00 | $ | 4.95 | ||||
| June 30, 2011 |
$ | 11.70 | $ | 6.54 | ||||
| September 30, 2011 |
$ | 11.25 | $ | 6.03 | ||||
| December 31, 2011 |
$ | 9.33 | $ | 5.51 | ||||
| March 31, 2010 |
$ | 5.00 | $ | 4.01 | ||||
| June 30, 2010 |
$ | 5.53 | $ | 4.14 | ||||
| September 30, 2010 |
$ | 4.48 | $ | 3.90 | ||||
| December 31, 2010 |
$ | 5.45 | $ | 4.14 | ||||
On February 22, 2012, the closing sales price for the Common Stock as reported by the NASDAQ Global Select Market was $7.27 per share.
Holders. On February 22, 2012, the number of holders of record of our common stock was 1,113.
Dividends. We have not paid or declared any cash dividends on our common stock in the past and do not intend to pay or declare any cash dividends in the foreseeable future. We currently intend to retain future earnings for the future operation and development of our business including exploration, development and acquisition activities. Any future dividends would be subordinate to the full cumulative dividends on all shares of our Series A Preferred Stock.
Our credit facility limits the aggregate value of dividends to common shareholders in any fiscal year to no more than 40% of consolidated net income, provided that we are not in default on our credit facility.
29
Table of Contents
Performance Graph
Comparison of Five-Year Cumulative Total Return Among
Double Eagle Petroleum Co., the Standard and Poor’s Small Cap 600 Index, and the Peer Group Index
Total Return (Stock Price Plus Reinvested Dividends)
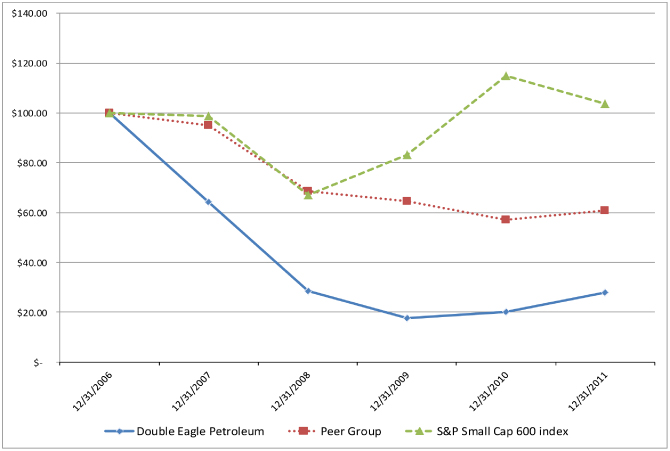
| December 31, | ||||||||||||||||||||||||
| January 1, 2007 | 2007 | 2008 | 2009 | 2010 | 2011 | |||||||||||||||||||
| Double Eagle Petroleum |
$ | 100.00 | $ | 64.20 | $ | 28.59 | $ | 17.60 | $ | 20.08 | $ | 28.02 | ||||||||||||
| Peer Group |
$ | 100.00 | $ | 95.00 | $ | 68.49 | $ | 64.48 | $ | 57.00 | $ | 60.92 | ||||||||||||
| S&P SmallCap 600 |
$ | 100.00 | $ | 98.78 | $ | 67.18 | $ | 83.15 | $ | 114.93 | $ | 103.76 | ||||||||||||
The total return assumes that dividends were reinvested quarterly and is based on a $100 investment on December 31, 2006. During the five year period ended December 31, 2011, Double Eagle’s common stock cumulative annual growth rate was -22.5%, as compared to -9.4% for our Peer Group and 0.7% for the S&P Small Cap 600 Index.
The Peer Group Index is comprised of the following companies, which are selected by Company management: Abraxas Petroleum Corp., Credo Petroleum Corporation, Crimson Exploration Inc., GeoMet Inc., FX Energy Inc., Pan Handle Oil and Gas Inc., PrimeEnergy Corp., and Warren Resources.
Issuer Purchases of Equity Securities.
The table below summarizes repurchases of our common stock in the fourth quarter of 2011:
| Total Number of Shares | Maximum Number of | |||||||||||||||
| Purchased as Part of | Shares that May Yet Be | |||||||||||||||
| Total Number of Shares | Average Price Paid per | Publically Announced | Purchased Under the | |||||||||||||
| Period |
Purchased | Share | Plans or Programs | Plans or Programs | ||||||||||||
| October 2011 |
— | — | — | — | ||||||||||||
| November 2011 |
— | — | — | — | ||||||||||||
| December 2011 |
4,185 | (1) | $ | 6.88 | — | — | ||||||||||
| (1) | None of the shares were repurchased as part of publicly announced plans or programs. All such purchases were from employees for settlement of payroll taxes due at the time of restricted stock vesting. All repurchased shares were subsequently retired. |
30
Table of Contents
| ITEM 6. | SELECTED FINANCIAL DATA |
The following selected financial information should be read in conjunction with our consolidated financial statements and the accompanying notes.
| Year Ended December 31, | ||||||||||||||||||||
| 2011 | 2010 | 2009 | 2008 | 2007 | ||||||||||||||||
| (In thousands, except per share and volume data) | ||||||||||||||||||||
| Statement of Operations Information |
||||||||||||||||||||
| Total operating revenues |
$ | 64,703 | $ | 54,984 | $ | 44,791 | $ | 49,578 | $ | 17,197 | ||||||||||
| Income (loss) from operations |
$ | 19,766 | $ | 10,265 | $ | 3,884 | $ | 15,949 | $ | (17,909 | ) | |||||||||
| Net income (loss) |
$ | 11,687 | $ | 5,503 | $ | 1,209 | $ | 10,381 | $ | (11,603 | ) | |||||||||
| Net income (loss) attributable to common stock |
$ | 7,964 | $ | 1,780 | $ | (2,514 | ) | $ | 6,658 | $ | (13,413 | ) | ||||||||
| Net income (loss) per common share: |
||||||||||||||||||||
| Basic |
$ | 0.71 | $ | 0.16 | $ | (0.25 | ) | $ | 0.73 | $ | (1.47 | ) | ||||||||
| Diluted |
$ | 0.71 | $ | 0.16 | $ | (0.25 | ) | $ | 0.73 | $ | (1.47 | ) | ||||||||
| Balance Sheet Information |
||||||||||||||||||||
| Total assets |
$ | 170,594 | $ | 152,517 | $ | 150,494 | $ | 171,989 | $ | 84,597 | ||||||||||
| Balance on credit facility |
$ | 42,000 | $ | 32,000 | $ | 34,000 | $ | 24,639 | $ | 3,445 | ||||||||||
| Total long-term liabilities |
$ | 61,614 | $ | 47,426 | $ | 44,684 | $ | 33,011 | $ | 5,895 | ||||||||||
| Stockholders' equity and preferred stock |
$ | 94,181 | $ | 90,677 | $ | 84,696 | $ | 92,875 | $ | 66,596 | ||||||||||
| Cash Flow Information |
||||||||||||||||||||
| Net cash provided by (used in): |
||||||||||||||||||||
| Operating activities |
$ | 24,782 | $ | 25,044 | $ | 22,062 | $ | 22,904 | $ | 5,166 | ||||||||||
| Investing activities |
$ | (23,946 | ) | $ | (21,858 | ) | $ | (21,461 | ) | $ | (40,778 | ) | $ | (42,056 | ) | |||||
| Financing activities |
$ | 5,237 | $ | (6,263 | ) | $ | 5,081 | $ | 17,749 | $ | 36,404 | |||||||||
| Total Proved Reserves (1) |
||||||||||||||||||||
| Oil (MBbl) |
450 | 381 | 419 | 420 | 413 | |||||||||||||||
| Gas (MMcf) |
133,904 | 112,769 | 89,777 | 86,331 | 71,254 | |||||||||||||||
| MMcfe |
136,605 | 115,056 | 92,292 | 88,852 | 73,731 | |||||||||||||||
| Net Production Volumes |
||||||||||||||||||||
| Oil (Bbl) |
28,091 | 26,024 | 28,927 | 25,668 | 13,963 | |||||||||||||||
| Gas (Mcf) |
9,174,655 | 9,002,873 | 9,162,362 | 6,559,662 | 2,928,335 | |||||||||||||||
| Mcfe |
9,343,201 | 9,159,017 | 9,335,924 | 6,713,670 | 3,012,113 | |||||||||||||||
| (1) | Effective December 31, 2009, we adopted the SEC’s new oil and gas reserve reporting rules. These rules applied to our 2011, 2010 and 2009 reserve estimates. |
31
Table of Contents
| ITEM 7. | MANAGEMENT'S DISCUSSION AND ANALYSIS OF FINANCIAL CONDITION AND RESULTS OF OPERATIONS |
(In this Item 7, amounts in thousands of dollars, except share, per share data, and amounts per unit of production)
The following discussion and analysis should be read in conjunction with the “Selected Financial Data” and the accompanying consolidated financial statements and related notes included elsewhere in this Annual Report on Form 10-K. The following discussion contains forward-looking statements that reflect our future plans, estimates, beliefs and expected performance. Factors that might cause such differences include, but are not limited to, those discussed in the subsection entitled “Risk Factors” above, which are incorporated herein by reference. We assume no obligation to revise or update any forward-looking statements for any reason, except as required by law. See also “Cautionary Information About Forward-Looking Statements”.
BUSINESS OVERVIEW
We are an independent energy company engaged in the exploration, development, production and sale of natural gas and crude oil, primarily in Rocky Mountain basins of the western United States. Our core properties are located in southwestern Wyoming. We have coal bed methane (“CBM”) reserves and production in the Atlantic Rim Area of the eastern Washakie Basin and tight gas reserves and production in the Pinedale Anticline. During 2011, we also began an exploration project to pursue hydrocarbons in the Niobrara formation of the eastern Washakie Basin. At December 31, 2011, we had over 74,000 net acres which we believe have Niobrara formation exposure, located primarily in Wyoming and western Nebraska.
Our objective is to increase long-term shareholder value by profitably growing our reserves, production, revenues, and cash flow. To meet this objective, we primarily focus on: (i) new CBM gas development drilling; (ii) enhancement of existing production wells and field facilities on operated and non-operated properties in the Atlantic Rim; (iii) continued participation in the development of tight sands gas wells at the Mesa Units on the Pinedale Anticline; (iv) expansion of our midstream business; (v) pursuit of high quality exploration and strategic development projects with potential for providing long-term drilling inventories that generate high returns and (vi) selectively pursuing strategic acquisitions or mergers. Substantially all of our revenues are generated through the sale of natural gas and oil production at market prices and the settlement of commodity hedges. Approximately 98% of our 2011 production volume was natural gas.
As of December 31, 2011, we had estimated proved reserves of 133.9 Bcf of natural gas and 450 MBbl of oil, or a total of 136.6 Bcfe. This represents a net increase in reserve quantities of 19% from 2010, after adjustments for extensions and discoveries, current year production and revision of estimates. The increase in estimated proved reserves as compared to the prior year is primarily the result of 31.7 Bcfe of additional reserves added as a result of organic growth from drilling in the Catalina Unit and Pinedale Anticline. We also benefited from a decrease in capital and production costs in the Pinedale Anticline, which has resulted in more undeveloped well locations in this area being economic.
The estimated proved reserves have a PV-10 value of approximately $154,218 at December 31, 2011 as compared to $143,694 at December 31, 2010 (see reconciliation of the PV-10 non-GAAP financial measure to the standardized measure under Reserves within Part 1 and 2: Business and Properties section of this Form 10-K). The average price used in calculating reserves remained consistent at $3.93 per MMbtu for the year ended December 31, 2011 and $3.95 per MMBtu for the year ended December 31, 2010. The increase in our PV-10 value was attributed primarily to extensions and discoveries. In 2011, the reserve engineers modified the production curves related to our reserves, which extended the recovery period for some of our reserves. This change resulted in a lower present value for the reserves and as such, our PV-10 value did not increase consistent with the increase in proved reserves.
Developments since December 31, 2010
During 2011, we invested $25.8 million to continue to grow production and reserves in our core properties and to commence an exploration project, where we are pursing hydrocarbons in the Niobrara formation of the eastern Washakie Basin.
Our 2011 drilling program included the following:
| • | At our Company-operated Catalina Unit, we drilled and completed 13 new producing wells in the unit. Twelve of the 13 new wells are located in an exploratory area of the Catalina Unit (outside the existing PA) and we hold a 100% working interest in these wells. The exploratory wells remain separate from the PA until the offsetting acreage is drilled and it is physically connected to the existing PA. All 13 wells were on-line for production at December 31, 2011. |
32
Table of Contents
| • | In the Mesa “B” Participating Area in the Pinedale Anticline, 19 new wells were brought on-line during 2011. We are also currently participating in the drilling of approximately 19 additional wells, which we expect to begin producing in 2012. |
| • | In October 2011, we began drilling an exploratory well located within our Atlantic Rim field. The target depth of this well is 9,450 feet and will allow us to explore the Niobrara, Frontier and Dakota formations. We reached total depth of this well in February 2012. |
In 2011, we entered into an agreement with a third party to transport gas through our pipeline, that connects the Catalina Unit to the pipeline system owned by Southern Star Central Gas Pipeline, Inc. Based on the current production volumes within the third party’s field, we expect to begin transporting the third party’s gas in late 2012 or 2013.
We hold leases on 36,045 gross (30,264 net) acres, in the Huntington Valley in Elko and White Pine Counties, Nevada. In July, 2011, we sold 75% of our interest in these leases for cash proceeds of $371. We had impaired these properties in 2008, as we had no plans to develop the leases, and there had been no commercial deposits of oil and gas found in the area. We retained a small overriding royalty interest in the Nevada interests sold.
On October 24, 2011, we amended our credit facility to increase the revolving line of credit to $150 million ($60 million borrowing base) and extended the maturity date of the facility to October 24, 2016. The amendment also lowered the interest rate margin for the level of funds borrowed to between 0.75% and 1.75%.
Our Industry:
The exploration for, and the acquisition, development, production, and sale of, natural gas and oil is highly competitive and capital intensive. As in any commodity business, the market price of the commodity produced and the costs associated with finding, acquiring, extracting, and financing the operation are critical to profitability and long-term value creation for stockholders. Currently, our production is comprised of 98% natural gas, which heightens our exposure to the market volatility associated with natural gas. As the current forecast for 2012 and 2013 shows relatively low natural gas prices, we are required to continue to focus on low cost production assets. If average natural gas prices decline and remain at low levels, it could reduce the value of our reserves, and thus the borrowing base of our credit facility. Generating reserve and production growth while containing costs is an ongoing focus for management, and is made particularly important in our business by the natural production and reserve declines associated with oil and gas properties. We attempt to overcome these declines by drilling to find additional reserves, acquisitions of additional reserves and exploiting new exploration opportunities. Our future growth will depend on our ability to continue to add reserves in excess of production.
Our ability to add reserves through drilling is dependent on our available capital resources but is also limited by many other factors, including our ability to timely obtain drilling permits, regulatory approvals and the ability to complete drilling operations within the stipulated timeframe. The permitting and approval process has become increasingly difficult over the past several years due to an increase in regulatory requirements and increased activism from environmental and other groups, which has extended the time it takes us to receive permits, and other necessary approvals. This was evident in 2011, as we experienced a time frame longer than normal to obtain our permit to drill the exploratory well in the Atlantic Rim. Prior to 2011, we had not encountered any significant delays in permit or drilling approvals in our core properties. Because of our relatively small size and concentrated operated property base, we can be at a disadvantage to our competitors by delays in obtaining or failing to obtain drilling approvals compared to companies with larger or more dispersed property bases. As a result, we are less able to shift drilling activities to areas where permitting may be easier, and we have fewer properties over which to spread the costs related to complying with these regulations and the costs or foregone opportunities resulting from delays.
We also face challenges in attracting and retaining qualified personnel and third-party service providers, gaining access to equipment and supplies and maintaining access to capital on sufficiently favorable terms.
33
Table of Contents
We have taken the following steps to mitigate the challenges we face:
| • | We have an inventory of what we believe are attractive drilling locations, allowing us to grow reserves and replace and expand production organically without having to rely solely on acquisitions. Drilling opportunities in both the Atlantic Rim and the Pinedale Anticline are expected to last for several years. |
| • | We attempt to reduce our overall exposure to commodity price fluctuations through the use of various hedging instruments for some of our production. Our strategic objective is to hedge at least 50% of our anticipated production on a forward 12 to 24 month basis. The duration of our various hedging instruments depends on our view of market conditions, available contract prices and our operating strategy. Use of such hedging instruments may limit the risk of fluctuating cash flows. Refer to Contracted Volumes on page 44 for the derivative instruments we had in place as of December 31, 2011. |
| • | We have a significant holding of acreage in the Niobrara Shale formation in Wyoming and Nebraska to provide for future exploration potential. |
| • | We proactively work with state and federal regulatory agencies to facilitate communication and necessary approvals. |
Development and Exploration Outlook for 2012:
We expect to expend $15 to $20 million of capital for development drilling and exploration programs in 2012. The drilling activity provided for in our 2012 capital budget is primarily allocated to the projects below:
Atlantic Rim. We intend to participate in the development drilling of 25 production wells in the Doty Mountain Unit in the second half of 2012. Due to the outlook of continuing low natural gas prices, we do not currently plan to drill in the Catalina Unit in 2012.
Pinedale Anticline. At the Pinedale Anticline, the operator is in the process of drilling 19 wells, which are expected to come on-line in 2012. We believe the operator will drill approximately 15 additional wells in the second half of 2012.
Exploration Projects. Our capital budget includes the costs associated with completing the drilling phase of our Niobrara exploratory well, which we commenced in October 2011 and reached total depth in early February 2012. We expect to complete the core and log analysis on this well in the second quarter of 2012, and at that time we will determine the completion opportunities, if any, in the various formations.
Other. In January 2012, we participated in drilling an exploratory well in the High Road Prospect near Gillette, Wyoming. The well reached total depth in February 2012 and the results of geological testing showed no economically producible hydrocarbons existed. The expected net cost to the Company is approximately $450 and will be recorded as a dry hole cost in the first quarter 2012 financial statements.
We believe that we have the necessary capital, personnel and available drilling equipment to execute this development and exploration program.
34
Table of Contents
RESULTS OF OPERATIONS
The table below provides a year-to-year overview of selected reserve, production and financial information. The information contained in the table below should be read in conjunction with our consolidated financial statements and accompanying notes included in this Form 10-K.
| As of and for the year ended December 31, | Percent change between years | |||||||||||||||||||
| 2011 | 2010 | 2009 | 2010 to 2011 | 2009 to 2010 | ||||||||||||||||
| Total proved reserves |
||||||||||||||||||||
| Oil (MBbl) |
450 | 381 | 419 | 18 | % | -9 | % | |||||||||||||
| Gas (MMcf) |
133,904 | 112,769 | 89,777 | 19 | % | 26 | % | |||||||||||||
| MMcfe |
136,605 | 115,056 | 92,292 | 19 | % | 25 | % | |||||||||||||
| Net production volumes |
||||||||||||||||||||
| Oil (Bbl) |
28,091 | 26,024 | 28,927 | 8 | % | -10 | % | |||||||||||||
| Gas (Mcf) |
9,174,655 | 9,002,873 | 9,162,362 | 2 | % | -2 | % | |||||||||||||
| Mcfe |
9,343,201 | 9,159,017 | 9,335,924 | 2 | % | -2 | % | |||||||||||||
| Average daily produciton |
||||||||||||||||||||
| Mcfe |
25,598 | 25,093 | 25,578 | 2 | % | -2 | % | |||||||||||||
| Average price per unit production |
||||||||||||||||||||
| Oil (Bbl) |
$ | 89.45 | $ | 70.35 | $ | 51.65 | 27 | % | 36 | % | ||||||||||
| Gas (Mcf) |
$ | 4.64 | $ | 4.12 | $ | 4.85 | 13 | % | -15 | % | ||||||||||
| Mcfe |
$ | 4.83 | $ | 4.25 | $ | 4.92 | 14 | % | -14 | % | ||||||||||
| Oil and gas production revenues |
||||||||||||||||||||
| Oil revenues |
$ | 2,513 | $ | 1,831 | $ | 1,494 | 37 | % | 23 | % | ||||||||||
| Gas revenues |
41,647 | 31,779 | 40,904 | 31 | % | -22 | % | |||||||||||||
|
|
|
|
|
|
|
|||||||||||||||
| Total |
$ | 44,160 | $ | 33,610 | $ | 42,398 | 31 | % | -21 | % | ||||||||||
|
|
|
|
|
|
|
|||||||||||||||
| Oil and gas production costs |
||||||||||||||||||||
| Production costs |
$ | 11,047 | $ | 9,708 | $ | 7,754 | 14 | % | 25 | % | ||||||||||
| Production taxes |
4,365 | 4,563 | 3,652 | -4 | % | 25 | % | |||||||||||||
|
|
|
|
|
|
|
|||||||||||||||
| Total |
$ | 15,412 | $ | 14,271 | $ | 11,406 | 8 | % | 25 | % | ||||||||||
|
|
|
|
|
|
|
|||||||||||||||
| Data on a per Mcfe basis |
||||||||||||||||||||
| Average price (1) |
$ | 4.83 | $ | 4.25 | $ | 4.92 | 14 | % | -14 | % | ||||||||||
|
|
|
|
|
|
|
|||||||||||||||
| Production costs (2) |
1.18 | 1.06 | 0.83 | 11 | % | 28 | % | |||||||||||||
| Production taxes |
0.47 | 0.50 | 0.39 | -6 | % | 28 | % | |||||||||||||
| Depletion and amortization |
1.97 | 1.98 | 1.94 | -1 | % | 2 | % | |||||||||||||
|
|
|
|
|
|
|
|||||||||||||||
| Total operating costs |
3.62 | 3.54 | 3.16 | 2 | % | 12 | % | |||||||||||||
|
|
|
|
|
|
|
|||||||||||||||
| Gross margin |
$ | 1.21 | $ | 0.71 | $ | 1.76 | 69 | % | -60 | % | ||||||||||
|
|
|
|
|
|
|
|||||||||||||||
| Gross margin percentage |
25 | % | 17 | % | 36 | % | 47 | % | -53 | % | ||||||||||
| (1) | Our average gas price per Mcfe realized for the years ended December 31, 2011, 2010 and 2009 is calculated by summing (a) production revenue received from third parties for sale of our gas, included in oil and gas sales on the consolidated statement of operations, (b) settlement of our cash flow hedges included within oil and gas sales on the consolidated statement of operations and (c) realized gain/loss on our financial hedges, which due to accounting rules is included in price risk management activities on the consolidated statement of operations, totaling $933, $5,316, and $3,503 for the years ended December 31, 2011, 2010, and 2009, respectively. This amount is divided by the total Mcfe volume for the period. |
| (2) | Production costs, on a dollars per Mcfe basis, is calculated by dividing production costs, as stated on the consolidated statement of operations, by total production volumes during the period. This calculation excludes certain gathering costs incurred by our subsidiary, Eastern Washakie Midstream, which are eliminated in consolidation. |
Year ended December 31, 2011 compared to the year ended December 31, 2010
The following analysis provides comparison of the year ended December 2011 and the year ended December 31, 2010.
35
Table of Contents
Oil and gas sales, production volume and price comparisons
Oil and gas sales increased 31% to $44,160, due primarily to our hedging program, which provided cash of $9,592 from the settlement of our cash flow hedges during 2011. We had no cash flow hedge settlements in 2010. In addition, we experienced a 2% increase in production volumes in 2011 as compared to 2010. These increases were offset by a 3% decrease in the average CIG market price, which is the index on which most of our gas volumes are sold.
As shown on the table on the preceding page, our average realized gas price increased 13% to $4.64. Despite the decrease in the average CIG market price during the 2011 period, we realized a higher natural gas price as a result of our hedging program. In addition to the $9,592 of cash flow hedge settlements included in oil and gas sales noted above, we also realized settlements on our economic hedges totaling $933 during 2011. In 2010, our economic hedges accounted for a total of $5,316.
Our total net production increased 2% to 9.3 Bcfe, primarily due to an increase in production volumes at the Sun Dog and Doty Mountain Units, which offset a production decline at the Catalina Unit, as discussed below.
Our total average daily net production at the Atlantic Rim was consistent between periods, totaling 18,612 Mcfe per day in 2011 and 18,436 Mcfe per day in 2010. Our Atlantic Rim production comes from three operating units, the Catalina Unit, the Sun Dog Unit and the Doty Mountain Unit. We operate the Catalina Unit.
| • | Average daily net production at our Catalina Unit decreased 9% to 13,372 Mcfe, largely due to what management believes to be the normal production decline for wells within the field. During the second half of 2011, we drilled 13 new production wells in the Catalina Unit. Twelve of the 13 new wells are located outside the current PA, and our working interest in these wells is 100% (as compared to 72.40% for wells in the current PA). These wells came on-line for production in late November 2011. |
| • | Average daily production, net to our interest, at the Sun Dog and Doty Mountain units increased 40% to 5,240 Mcfe, which was primarily attributed to better production from certain Sun Dog wells due to additional water injection capacity added in the first quarter of 2011 and a small increase in certain Doty Mountain wells due to fracture stimulation. We also benefited from higher working interests in both units for part of the period as we completed our purchase of additional working interests in the Sun Dog and Doty Mountain Units in late July 2010. Our working interest increased in the Sun Dog Unit to 21.53% from 8.89%, and the Doty Mountain Unit to 18.00% from 16.5%. The operator did not drill any new wells in these units in 2011. |
Average daily net production in the Pinedale Anticline increased 7% to 5,445 Mcfe, as the operator brought 19 new wells on-line for production during the second, third and fourth quarter of 2011.
Transportation and gathering revenue
We receive fees for gathering and transporting third-party gas through our intrastate gas pipeline, which connects the Catalina Unit with the interstate pipeline system owned by Southern Star Central Gas Pipeline, Inc. Transportation and gathering revenue decreased 12% to $4,894 due to the decrease in production volumes at the Catalina Unit discussed above. With additional compression, our pipeline is expected to have approximately 125 MMcf per day capacity, which is expected to be sufficient to handle the development of the Catalina Unit and additional third party gas from other non-operated properties in the Atlantic Rim proximity.
Price risk management
We recorded a net gain on our derivative contracts not designated as cash flow hedges of $14,740. This consisted of an unrealized non-cash gain of $13,807, which represents the change in the fair value on our economic hedges at December 31, 2011 based on the expected future prices of the related commodities, and a net realized gain of $933 related to the cash settlement of some of our economic hedges.
Proceeds from Madden Deep settlement
In 2010 we recorded revenue of $3,841 as a settlement we received from many of the defendants in a lawsuit we sought to recover either monetary damages or our respective share of natural gas produced by our interest in the Madden Deep Unit during the period February 1, 2002 through June 30, 2007. As part of the settlement, we received cash proceeds of $4,061. Prior to the litigation settlement, we had not recognized any amount of sales proceeds related to natural gas from the Madden Deep Unit for the period February 1, 2002 through October 30, 2006. For the period from November 1, 2006 through June 30, 2007, we had recognized the sales and had recorded a related account receivable of $292, net of allowance for uncollectible amounts.
36
Table of Contents
Oil and gas production expenses, production taxes, and depreciation, depletion and amortization
Well production costs increased 14% to $11,047 and production costs in dollars per Mcfe increased 11%, or $0.12 to $1.18, driven by additional production costs from the Sun Dog Unit, partially attributed to the higher working interest we held in this unit in 2011, as compared to only half of 2010. In addition, because production from the Sun Dog and Doty Mountain units, which have historically yielded lower margins than many of our other properties, made up a larger percentage of our total production during the full 2011 period, we experienced an increase in production costs on a per Mcfe basis. This increase was partially offset by lower workover costs at the Catalina Unit.
Production taxes decreased 4% to $4,365, and production taxes, on a dollars per Mcfe basis, decreased 6%, or $0.03 to $0.47 per Mcfe. We are required to pay taxes on the proceeds received upon the physical sale of our gas to counterparties. Although we had higher physical oil and gas sales in 2011 as compared to the prior year, in 2010 we also paid production taxes on the revenues from one of our derivative instruments due to the contractual terms of that agreement.
Total depreciation, depletion and amortization expenses (“DD&A”) increased 1% to $18,844, and depletion and amortization related to producing assets increased 2% to $18,439. Expressed in dollars per Mcfe, depletion and amortization related to producing assets remained consistent year over year, totaling, $1.97 in 2011 and $1.98 in 2010.
Impairment and abandonment of equipment and properties
We continually evaluate our properties for potential impairment of value. We incurred $187 and $480 for 2011 and 2010, respectively, for the write-off of expiring undeveloped leaseholds. In 2010, management concluded that the non-producing Waltman 34-24 well was not capable of economically producing gas, which resulted in a $1,103 impairment charge.
General and administrative
General and administrative (“G&A”) expenses increased 2% to $6,107, primarily due to a $197 increase in stock-based compensation. In September 2011, we adopted a Long Term Incentive Plan (“LTIP”), under which our executive officers can earn shares of common stock for achieving certain service and performance targets. Of the total increase in stock-based compensation, $161 related to the LTIP. The 2011 expenses were also higher because the 2010 G&A expenses were net of a recovery of an outstanding receivable that had previously been written off totaling $155. These increases were offset by a $197 decrease in legal fees, which was the result of both less activity related to the litigation that resulted from the 2009 Petrosearch acquisition and a recovery of $146 from our insurance company related to legal fees from this litigation.
Interest expense
We pay interest on outstanding borrowings under our credit facility, which was $42 million at December 31, 2011 and related to certain assets that were under a capital leases during 2010 and 2011. The interest rate on our credit facility fluctuates based upon changes in our levels of outstanding debt and the prevailing market rates. Interest expense decreased 14% to $1,317 due primarily to a decline in the average interest rates for the year. In 2010 and through March 2011, our credit facility had an interest rate floor of 4.5%, which was higher than the prevailing market rate throughout 2011. Our credit facility was amended in March 2011 to remove the floor. Our outstanding balance on the facility was higher at December 31, 2011, which somewhat offset the decrease in the average interest rate.
Income taxes
During the year ended December 31, 2011, we recorded income tax expense of $6,762. Our income tax expense reflects an effective book rate of 36.66% in 2011. The rate was slightly lower in 2011 as compared to 2010 due to a decrease in permanent income tax differences. We expect to continue to generate losses for federal income tax reporting purposes, and anticipate net income from operations in future years, which has resulted in a deferred tax position reported under U.S. generally accepted accounting principles. We do not anticipate any significant required payments for current tax liabilities in the near future. We have net operating loss carry-forwards (“NOLs”) of $44.2 million at December 31, 2011. We have evaluated the need to provide a valuation allowance on the amount recorded as the net operating loss carry-forward, and management has concluded that no valuation allowance is required as of December 31, 2011. In reaching this conclusion, management considered that we expect to generate income in excess of our NOLs by continuing to develop our core assets. In addition, we routinely consider the sale of non-core assets, which is likely to generate a tax gain, as the tax cost per Mcfe of our assets is generally lower than the current market rates being paid in the open market for gas producing properties. Our current NOLs do not begin to expire for nine years. Our assessment does not take into account any future impact of changes in tax laws.
37
Table of Contents
Year ended December 31, 2010 compared to the year ended December 31, 2009
The following analysis provides comparison of the year ended December 2010 and the year ended December 31, 2009.
Oil and gas sales, production volume and price comparisons
Oil and gas sales decreased 21% to $33,610, which was primarily due to lower cash settlements from our derivative instruments. In 2009, $13,164 of oil and gas sales was cash received upon a derivative contract settlement, whereas in 2010, $0 of oil and gas sales was related to derivative settlements. The decrease was also due in part to an overall 2% decrease in production volumes, discussed in more detail below.
Our average realized natural gas price decreased 15%, to $4.12. Although the average CIG index price was approximately 24% higher for 2010, our hedges did not generate as much cash in 2010 as compared to 2009. Our hedge settlements provided $5,316 in 2010 and $16,667 in 2009.
Our total net production decreased 2% to 9,159 MMcfe, largely due to lower production volumes at the Catalina Unit and the Mesa Units. Our purchase of additional working interest at the Sun Dog and Doty Mountain Units in the third quarter of 2010 increased our net production in these units and somewhat offset the production decline at the Catalina and Mesa Units.
Our average daily net production at the Atlantic Rim increased 1% to 18,436 Mcfe, as compared to 18,294 Mcfe in 2009. The production from the Atlantic Rim comes from three operating units, the Catalina Unit, the Sun Dog Unit and the Doty Mountain Unit.
| • | Average daily net production at the Catalina Unit decreased 9% to 14,705 Mcfe largely due to the result of what management believes to be the normal production decline for wells within this field. In addition, the decrease is a result of the continuation of our well-enhancement program, which began in the third quarter of 2009 and continued throughout 2010. This program requires individual wells to be off-line for periods of time while the well is worked-over. Finally, the Catalina field also experienced several power outages during the second quarter of 2010 and the Southern Star pipeline was shut down for maintenance for several days in April 2010, both of which temporarily halted production. These decreases were partially offset by the increase in our working interest to 72.40% from 69.31%, which resulted from our working interest purchase from a third-party in July 2010. |
| • | Average daily net production at the Sun Dog and Doty Mountain Units increased 74% to 3,731 Mcfe per day, largely due to our higher working interest in both units. We purchased additional working interests in the Sun Dog and Doty Mountain Units during the third quarter of 2010, increasing our working interest in the Sun Dog Unit to 21.53% from 8.89%, and in the Doty Mountain Unit to 18.00% from 16.5%. Also, the operator added additional compressor capacity at the Doty Mountain Unit in the first quarter of 2010, which boosted production. |
Average daily net production in the Pinedale Anticline decreased 10% to 5,075 Mcfe. Although the operator of the Mesa Units brought an additional 16 wells on-line during 2010, this did not result in an overall increase in production. Management believes that the production decline is due to the operator managing the production flow from the field due to the low gas prices in the Rocky Mountain region.
Transportation and gathering revenue
Transportation and gathering revenue decreased 10% to $5,549, which is directly correlated with the decrease in production at the Catalina Unit.
38
Table of Contents
Price risk management
We recorded a net gain on our derivative contracts of $11,512 for 2010, as compared to a net loss of $4,295 for 2009. The net gain consisted of an unrealized non-cash gain of $6,196, which represents the change in the fair value on our economic hedges at December 31, 2010, based on the future expected prices of the related commodities, and a net realized gain of $5,316 related to the cash settlement of some of our economic hedges.
Proceeds from Madden Deep settlement
In the third quarter of 2010, we reached a settlement with many of the defendants in a lawsuit brought by us through which we sought to recover either monetary damages or our respective share of natural gas produced by our interest in the Madden Deep Unit during the period February 1, 2002 through June 30, 2007. As part of the settlement, we received cash proceeds of $4,061. Prior to the litigation settlement, we had not recognized any amount of sales proceeds related to natural gas from the Madden Deep Unit for the period February 1, 2002 through October 30, 2006. For the period from November 1, 2006 through June 30, 2007, we had recognized the sales and had recorded a related account receivable of $292, net of allowance for uncollectible amounts. As such, we recorded income of $3,841 upon the settlement within proceeds from Madden Deep settlement on the consolidated statements of operations during 2010.
Oil and gas production expenses, production taxes, and depreciation, depletion and amortization
Well production costs increased 25% to $9,708 and production costs in dollars per Mcfe increased 28%, or $0.23, to $1.06, as compared to the same prior- year period. The increase in total production costs and production costs on a per Mcfe basis was primarily driven by higher workover costs at the Catalina and Sun Dog Units related to the well enhancement and workover programs during the year. In addition, we incurred higher transportation expense at the Sun Dog and Doty Mountain Units resulting from an operator metering adjustment.
Production taxes increased 25% to $4,563 and production taxes, on a dollars per Mcfe basis, increased 28%, or $0.11 to $0.50 was due to the an increase in the CIG market price.
Total DD&A remained flat year over year, totaling $18,574 and $18,562 for 2010 and 2009, respectively, and depletion and amortization related to producing assets was $18,159, as compared to $18,136 in the 2009. Expressed in dollars per Mcfe, depletion and amortization related to producing assets increased 2%, or $0.04, to $1.98, as compared to the prior year.
Pipeline operating costs
Pipeline operating costs increased 12% to $4,152 due to an increase is the result of consulting costs we incurred in the first half of 2010 related to reconfiguring our compressor units. In addition, the 2009 expenses were net of a vendor credit we received for compressor downtime, which lowered the pipeline operating costs for 2009.
Impairment and abandonment of equipment and properties
During the fourth quarter of 2010, management concluded that the non-producing Waltman 34-24 well was not capable of economically producing gas. Accordingly, we incurred a $1,103 impairment charge on the consolidated statement of operations during 2010. We also incurred expense of $480 in 2010 for the write-off of expiring undeveloped leaseholds.
General and administrative
General and administrative expenses decreased 11% to $5,976 primarily because the 2009 expenses included $513 of transaction costs related to the Petrosearch acquisition that did not recur in 2010. In addition, share-based compensation expense decreased by $528 primarily because of stock forfeitures related to two executive terminations in the second quarter of 2010. These decreases were partially offset by a $154 increase in bank fees related to the unused portion of our credit facility, a $98 increase in salary and salary-related expenses due to increased healthcare costs and an $80 increase due to the Petrosearch building leases assumed in the merger in August 2009.
39
Table of Contents
Income taxes
We recorded income tax expense of $3,224, as compared to income tax expense of $902 during the prior year. Our income tax expense reflected an effective book rate of 36.95%. The rate was lower for 2010 due to a reduction in permanent income tax differences related to stock option expense, higher net income and the impact of the Petrosearch acquisition, which had increased the rate in 2009.
LIQUIDITY AND CAPITAL RESOURCES
Our sources of liquidity and capital resources historically have been net cash provided by operating activities, funds available under our credit facilities and proceeds from offerings of equity securities. The primary uses of our liquidity and capital resources have been in the development and exploration of oil and gas properties. In the past, these sources of liquidity and capital have been sufficient to meet our needs and finance the growth of our business.
We currently have a $150 million credit facility in place ($60 million borrowing base), and in the third quarter of 2011, we entered into an at market issuance sales agreement (“ATM”), which allows us to offer and sell shares of our common stock from time to time, up to an aggregate offering price of $20 million. We have not sold any shares under the ATM to date. The ATM is in effect through May 2012. We currently believe that the amounts available under our credit facility, combined with our net cash from operating activities, will provide us with sufficient funds to meet future financial covenants, develop new reserves, maintain our current facilities, and complete our 2012 capital expenditure program (see “Calendar 2012 Capital Spending Budget” below). Depending on the timing and amounts of future projects, we may need to seek additional sources of capital. We can provide no assurance that we will be able to do so on favorable terms or at all. The Company currently has an effective Form S-3 shelf registration statement on file with the SEC, which has $150 million of securities available for issuance and provides us the ability to raise additional funds through registered offerings of equity, debt or other securities. We are conducting the ATM offering under the shelf registration statement. We also may issue equity or debt in private placements or obtain additional debt financing, which may be secured by our oil and gas properties, or unsecured.
Our Credit Facility at December 31, 2011
At December 31, 2011, we had a $150 million credit facility in place, with a $60 million borrowing base. The credit facility is collateralized by our oil and gas producing properties and other assets. At December 31, 2011, we had $42 million outstanding on the facility. We have depended on our credit facility over the past four years to supplement our operating cash flow in the development of the Company-operated Catalina Unit and other non-operated projects in the Atlantic Rim, including our 2010 working interest purchase in this field, projects in the Pinedale Anticline, and the drilling of our Niobrara exploration well.
Borrowings under the revolving line of credit bear interest at a daily rate equal to the greater of (a) the Federal Funds rate, plus 0.5%, the Prime Rate or the Eurodollar Rate plus 1%, plus (b) a margin ranging between 0.75% and 1.75% depending on the level of funds borrowed. As of December 31, 2011, the average interest rate on the outstanding debt was 3.05%. We are subject to a variety of financial and non-financial covenants under this facility. As of December 31, 2011, we were in compliance with all covenants under the facility. If any of the covenants are violated, and we are unable to negotiate a waiver or amendment thereof, the lender would have the right to declare an event of default, terminate the remaining commitment and accelerate all principal and interest outstanding.
Our lending banks conduct an assessment of our available borrowing base semi-annually on April 1 and October 1. If natural gas prices continue to decrease for extended periods of time, our borrowing base could be reduced, thus limiting the future amounts of funds under the current facility. This may impact our ability to execute our 2012 capital expenditure program, or require that we seek alternative sources of capital. Upon any downward adjustment of the borrowing base, if the outstanding borrowings are in excess of the revised borrowing base, we may have to repay our indebtedness in excess of the borrowing base immediately, or in six monthly installments, or pledge additional properties as collateral. We may not have sufficient funds to make such repayments or additional properties to pledge as collateral.
40
Table of Contents
Capital Expenditures
Our primary capital expenditures by type for the years ended December 31, 2011 and 2010 were:
| Year Ended December 31, | ||||||||
| 2011 | 2010 | |||||||
| Property acquisition costs |
$ | 266 | $ | 1,043 | ||||
| Exploration |
16,198 | 73 | ||||||
| Development |
9,316 | 20,402 | ||||||
|
|
|
|
|
|||||
| Total capital expenditures |
$ | 25,780 | $ | 21,518 | ||||
|
|
|
|
|
|||||
Year Ended December 31, 2011
In 2011, we continued to invest in our core properties in the Atlantic Rim and the Pinedale Anticline, and began exploration of the Niobrara formation in the Eastern Washakie Basin.
We drilled and completed 13 new producing wells in the Catalina Unit in 2011. Twelve of the 13 new wells are located outside the existing PA, and therefore they were classified as exploratory wells for accounting purposes. We hold a 100% working interest in these 12 wells. The exploratory CBM wells will remain separate from the PA until the offsetting acreage is drilled and the wells are physically connected to the existing PA. All 13 wells were online as of December 31, 2011. Our capital costs at the Catalina Unit totaled $13,156, of which $12,141 was classified as exploratory costs and $1,015 was classified as development costs. We were able to establish economically producible reserves for each of these 12 wells and they have been reclassified to development wells.
In October 2011, we commenced drilling of an exploratory well located in the center of the Catalina Unit. The primary target was the Niobrara Shale formation. We reached total depth of this well in February 2012. We also drilled into the Frontier and Dakota formations to test for hydrocarbons. We expect the core and log analysis on this well to be completed in the second quarter of 2012, and at that time we will determine the completion opportunities, if any, in the various formations. The exploratory costs incurred in 2011 related to this well totaled $4,170.
We also incurred capital costs of $6,891, net to our interest, related to the Pinedale Anticline development, as we participated in the drilling and completion of 19 new wells in the Mesa Units. We also are currently participating in the drilling of 19 additional wells, which were drilled in the second half of 2011, and are expected to come on-line in 2012. Capital expenditures recorded for the Sun Dog and Doty Mountain Units in 2011 totaled $907, net to our interest.
During 2011, we also spent $266 to acquire additional acreage in the Niobrara formation in Wyoming and western Nebraska.
Year Ended December 31, 2010
Our development projects in 2010 focused on our core properties in the Atlantic Rim and the Pinedale Anticline. In the Atlantic Rim, we completed a purchase of additional working interests from a third party in the Catalina, Sun Dog and Doty Mountain Units. The purchase gave us an immediate increase in production and reserve amounts in the units. The total purchase price of the additional working interests was $8,417. We invested $2,421, net to our working interest, to continue our well enhancement and production maximization project in the Catalina Unit. We also reconfigured certain compressor equipment in the Catalina Unit in the second quarter of 2010. Capital expenditures recorded for the Sun Dog and Doty Mountain Units in 2010 totaled $3,740, net to our interest. In 2010, the operator added additional compressor capacity in the Doty Mountain Unit and completed well workovers, including fracture stimulation, on approximately 35 wells at the Sun Dog and Doty Mountain Units.
We also incurred capital costs of $5,398, net to our interest, related to the Pinedale Anticline development, as we participated in the drilling and completion of 16 new wells in the Mesa Units. We also participated in the drilling of 17 additional wells, which the operator began drilling in the second half of 2010, which came on-line in 2011.
During 2010, we spent $1,043 to acquire additional acreage in the Niobrara formation in Wyoming and western Nebraska in anticipation of future exploration.
41
Table of Contents
2012 Capital Spending Budget
For 2012, we have budgeted approximately $15 to $20 million for our development and exploration programs in the Atlantic Rim and Pinedale Anticline. We intend to participate in drilling 25 new production wells in the Doty Mountain Unit in the second half of 2012. We plan to participate in drilling approximately 15 new wells at the Mesa Units. We also have allocated capital in our 2012 capital budget to complete our Niobrara exploratory well, which reached total depth in February 2012. Upon completion of the core and log analysis on this well in the second quarter of 2012, we will determine the completion opportunities, if any, in the various formations. We expect to fund our 2012 capital expenditures with cash provided by operating activities and funds made available through our credit facility. Our 2012 capital budget does not include the impact of potential future exploration projects or possible acquisitions, which we continually evaluate.
Cash Flows
The table below provides a year-to-year overview of selected financial information that addresses our overall financial condition, liquidity, and cash flow activities. The information contained in the table below should be read in conjunction with our consolidated financial statements and accompanying notes included in this Form 10-K.
| As of and for the Years Ended December 31, | Percent Change Between Years | |||||||||||||||||||
| 2011 | 2010 | 2009 | 2010 to 2011 | 2009 to 2010 | ||||||||||||||||
| Financial information |
||||||||||||||||||||
| Working capital |
$ | 13,540 | $ | 7,477 | $ | (4,067 | ) | 81 | % | 284 | % | |||||||||
| Balance oustanding on credit facility |
$ | 42,000 | $ | 32,000 | $ | 34,000 | 31 | % | -6 | % | ||||||||||
| Stockholders’ equity and preferred stock |
$ | 94,181 | $ | 90,677 | $ | 84,696 | 4 | % | 7 | % | ||||||||||
| Net income (loss) attributable to common stock |
$ | 7,964 | $ | 1,780 | $ | (2,514 | ) | 347 | % | -171 | % | |||||||||
| Net income (loss) per common share: |
||||||||||||||||||||
| Basic |
$ | 0.71 | $ | 0.16 | $ | (0.25 | ) | 344 | % | 164 | % | |||||||||
| Diluted |
$ | 0.71 | $ | 0.16 | $ | (0.25 | ) | 344 | % | 164 | % | |||||||||
| Net cash provided by operating activities |
$ | 24,782 | $ | 25,044 | $ | 22,062 | -1 | % | 14 | % | ||||||||||
| Net cash used in investing activities |
$ | (23,946 | ) | $ | (21,858 | ) | $ | (21,461 | ) | 10 | % | 2 | % | |||||||
| Net cash (used in)/ provided by financing activities |
$ | 5,237 | $ | (6,263 | ) | $ | 5,081 | 184 | % | -223 | % | |||||||||
Net cash provided by operating activities
Operating activities provided cash of $24,782 in 2011, as compared to $25,044 for 2010 and $22,062 in 2009. The primary sources of cash during 2011 were $11,687 of net income, which was net of non-cash charges of $19,018 related to DD&A and accretion expense, and non-cash stock-based compensation expense of $1,153. We also had a $6,762 in the provision for deferred income taxes. The non-cash expenses were partially offset by the non-cash gain on derivative contracts of $13,760. Our cash flow from operations in 2011 included $10,525 of income from cash settlements on our derivative instruments. The majority of the settlement revenue was generated by our $7.07 CIG fixed price swap for 8,000 Mcf per day. We entered into this hedge in 2008, when the outlook for natural gas prices was significantly higher than it is today. While we do have 15,000 Mcf per day hedged in 2012, the prices we have secured are approximately $2 lower per Mcf than 2011. The difference in price will result in lower realized cash flow from operations in 2012. See Contracted Volumes for additional information about our outstanding derivative contracts. Cash flow from operations in the 2010 period included cash proceeds of $4,061 that we received from many of the defendants in a lawsuit brought by us through which we sought to recover either monetary damages or our respective share of natural gas produced by our interest in the Madden Deep Unit.
Net cash used in investing activities
Net cash used in investing activities was $23,946 for 2011, as compared to $21,858 in 2010 and $21,461 in 2009. Our capital expenditures in 2011 were primarily related in capital spending in the Catalina Unit and Pinedale Anticline, and our Niobrara exploration well in the Atlantic Rim. Our 2011 drilling program at the Catalina Unit,
42
Table of Contents
included 13 production wells and two injection wells. Twelve of the 13 new wells are located in an exploratory area of the Catalina Unit (outside the existing PA) and we hold a 100% working interest in these wells. The exploratory wells remain separate from the PA until the offsetting acreage is drilled and it is physically connected to the existing PA. We began drilling our Niobrara exploration well in the fourth quarter of 2011. We have a 95% working interest in this well.
In the third quarter of 2011, we sold 75% of our interest in our Nevada properties for cash proceeds of $371. We had impaired these properties in 2008, as we had no plans to develop the leases and there had been no oil and gas findings in the area. We retained a small overriding royalty interest in these Nevada properties.
In 2010, we purchased working interest in the Atlantic Rim for a total cost of approximately $7,868, and in 2009, we received cash of $7,733 from our purchase of Petrosearch.
Net cash used in financing activities
Our financing activities provided cash of $5,237 in 2011, as compared to cash used of $6,263 in 2010 and cash provided of $5,081 in 2009. We drew down $10,000 on our credit facility in the fourth quarter of 2011 to finance drilling costs associated with our 2011 drilling program. In contrast, we repaid $2,000 on our credit facility in 2010. In 2009, we drew $9,361 to pay for our 2008 drilling program. We also amended our credit facility in 2011 and paid financing costs of $450. In each of the periods presented, we expended a total of $3,723 for dividends on our Series A Preferred Stock. We expect to continue to pay dividends on a quarterly basis on the Series A Preferred Stock at a rate of $931 per quarter. On or after June 30, 2012, the Company may redeem the Series A Preferred Stock for cash at its option, in whole or from time to time in part, at a redemption price of $25.00 per share, plus accrued and unpaid dividends (whether or not earned or declared) to the redemption date. At this time, we have no plans to exercise our redemption option. We may draw further upon our credit facility in 2012 to partially finance our drilling program.
Contractual Obligations
The following table summarizes our contractual obligations as of December 31, 2011:
| Less than | 1 - 3 | 3- 5 | More than | |||||||||||||||||
| Total | one year | Years | Years | 5 Years | ||||||||||||||||
| Credit facility (a) |
$ | 42,000 | $ | — | $ | — | $ | 42,000 | $ | — | ||||||||||
| Interest on credit facility (b) |
5,945 | 1,314 | 2,427 | 2,204 | — | |||||||||||||||
| Operating leases |
4,439 | 2,683 | 1,665 | 91 | — | |||||||||||||||
|
|
|
|
|
|
|
|
|
|
|
|||||||||||
| Total contractual cash commitments |
$ | 52,384 | $ | 3,997 | $ | 4,092 | $ | 44,295 | $ | — | ||||||||||
|
|
|
|
|
|
|
|
|
|
|
|||||||||||
| (a) | The amount listed reflects the balance outstanding as of December 31, 2011. Any balance outstanding is due on October 24, 2016. |
| (b) | Assumes the interest rate on our credit facility is consistent with that of December 31, 2011, which includes the impact of our $30 million fixed rate swap through December 31, 2012. |
Off-Balance Sheet Arrangements
We do not participate in transactions that generate relationships with unconsolidated entities or financial partnerships. Such entities are often referred to as structured finance or special purpose entities (“SPEs”) or variable interest entities (“VIEs”). SPEs and VIEs can be established for the purpose of facilitating off-balance sheet arrangements or other contractually narrow or limited purposes. We were not involved in any unconsolidated SPEs or VIEs at any time during any of the periods presented in this Annual Report on Form 10-K.
CONTRACTED VOLUMES
Derivative Instruments
We have entered into various derivative instruments to mitigate the risk associated with downward fluctuations in the natural gas price. Historically, these derivative instruments have consisted of fixed delivery contracts, swaps, options and costless collars. The duration and size of our various derivative instruments varies, and depends on our view of
43
Table of Contents
market conditions, available contract prices and our operating strategy. Under our current credit agreement, we can hedge up to 90% of the projected proved developed producing reserves for the next 12 month period, and up to 80% of the projected proved producing reserves for the ensuing 24 month period.
Our outstanding derivative instruments as of December 31, 2011 are summarized below (volume and daily production are expressed in Mcf):
| Remaining | ||||||||||||||||
| Contractual | Daily | Price | ||||||||||||||
| Type of Contract |
Volume | Production | Term | Price | Index (1) | |||||||||||
| Fixed Price Swap |
1,830,000 | 5,000 | 01/12-12/12 | $5.10 | NYMEX | |||||||||||
| Fixed Price Swap |
3,660,000 | 10,000 | 01/12-12/12 | $5.05 | NYMEX | |||||||||||
| Fixed Price Swap |
2,190,000 | 6,000 | 01/13-12/13 | $5.16 | NYMEX | |||||||||||
| Costless Collar |
2,190,000 | 6,000 | 01/13-12/13 | $5.00 floor | NYMEX | |||||||||||
| $5.35 ceiling | ||||||||||||||||
|
|
|
|||||||||||||||
| Total |
9,870,000 | |||||||||||||||
|
|
|
|||||||||||||||
| (1) | NYMEX refers to quoted prices on the New York Mercantile Exchange. |
See Item 15, Note 5 to the Notes to the Consolidated Financial Statements for additional discussion of hedge accounting.
As with most derivative instruments, our derivative contracts contain provisions which may allow for another party to require security from the counterparty to ensure performance under the contract. The security may be in the form of, but not limited to, a letter of credit, security interest or a performance bond. Neither party in any of our derivative contracts has required any form of security guarantee as of December 31, 2011.
Interest rate swap
We have a $30 million fixed rate swap contract with a third party in place as a hedge against the floating interest rate on our credit facility. Under the hedge contract terms, we locked in the Eurodollar LIBOR portion of the interest calculation at approximately 0.578% for this tranche of our outstanding debt, which based on our current level of outstanding debt, translates to an interest rate on this tranche of approximately 3.08%. The contract is effective through December 31, 2012.
Other Volumes Contracted
We also have a transportation and gathering agreement for all production volumes through our pipeline, for which we receive a third party fee per Mcf of gas transported.
CRITICAL ACCOUNTING POLICIES AND ESTIMATES
This discussion and analysis of our financial condition and results of operations are based on the consolidated financial statements prepared in accordance with accounting principles generally accepted in the United States of America (“GAAP”). The preparation of our financial statements requires us to make estimates and judgments that affect the reported amounts of assets, liabilities, revenues and expenses. Our significant accounting policies are described in Note 1, “Business Description and Summary of Significant Accounting Policies”, of the Notes to the Consolidated Financial Statements, included in Item 15 of this Annual Report on Form 10-K. In the following discussion, we have identified the
44
Table of Contents
accounting estimates that we consider as the most critical to aid in fully understanding and evaluating our reported financial results. Estimates regarding matters that are inherently uncertain require difficult, subjective or complex judgments on the part of our management. We analyze our estimates, including those related to oil and gas reserves, oil and gas properties, income taxes, contingencies and litigation, and base our estimates on historical experience and various other assumptions that we believe reasonable under the circumstances. Actual results may differ from these estimates.
Successful Efforts Method of Accounting
We account for our natural gas and oil exploration and development activities utilizing the successful efforts method of accounting, which is one of two acceptable methods under GAAP. Under this method, costs of productive exploratory wells, development dry holes and productive wells, and undeveloped leases, and lease acquisition costs are capitalized. Exploration costs, including personnel costs, certain geological and geophysical expenses, and delay rentals for oil and gas leases are charged to expense as incurred. Exploratory drilling costs are initially capitalized but charged to expense if and when the well is determined not to have found reserves in commercial quantities. The sale of a partial interest in a proved property is accounted for as a cost recovery and no gain or loss is recognized as long as this treatment does not significantly affect the unit-of-production amortization rate. A gain or loss is recognized for all other sales of producing properties.
The application of the successful efforts method of accounting requires managerial judgment to determine the proper classification of wells designated as development or exploratory, which will ultimately determine the proper accounting treatment of the costs incurred. The results from a drilling operation can take considerable time to analyze and the determination that commercial reserves have been discovered requires both judgment and industry experience. Wells may be completed that are assumed to be productive and actually deliver oil and gas in quantities insufficient to be economic, which may result in the abandonment of the wells at a later date. Wells are drilled which have targeted geologic structures which are both development and exploratory in nature and an allocation of costs is required to properly account for the results. The evaluation of oil and gas leasehold acquisition costs may require managerial judgment to estimate the fair value of these costs with reference to drilling activity in a given area. Drilling activities in an area by other companies may also effectively condemn leasehold positions.
The successful efforts method of accounting can have a significant impact on the operational results reported when we are entering a new exploratory area in hopes of finding an oil and gas field that will be the focus of future development drilling activity. The initial exploratory wells may be unsuccessful and will be expensed.
Reserve Estimates
All of the reserve data in this Form 10-K are estimates. The estimates of our natural gas and oil reserves are projections made by qualified petroleum engineers in accordance with guidelines established by the SEC. In 2011, Netherland, Sewell & Associates, Inc. evaluated properties representing 99% of our reserves. Reserve engineering is a subjective process of estimating underground accumulations of oil and natural gas that are difficult to measure. The accuracy of any reserve estimate is a function of the quality of available data, engineering and geological interpretation and judgment. Uncertainties include the historical production from the area compared with production from other producing areas, the assumed effects of regulations by governmental agencies and assumptions governing future natural gas and oil prices, basis differentials, future operating costs, severance and excise taxes, development costs and workover costs, all of which may in fact vary considerably from actual results. In addition, economic producibility of reserves is dependent on the oil and gas prices used in the reserves estimate. Our reserves estimates are based on 12-month average commodity prices, unless contractual arrangements designate. For these reasons, estimates of the economically recoverable quantities of oil and natural gas attributable to any particular group of properties, classifications of such reserves based on risk of recovery, and estimates of the future net cash flows expected there from may vary substantially.
Estimates of proved natural gas and oil reserves significantly affect our DD&A expense. For example, if estimates of proved reserves decline, the DD&A rate will increase, resulting in a decrease in net income. A decline in estimates of proved reserves could also cause us to perform an impairment analysis to determine if the carrying amount of our natural gas and oil properties exceeds fair value and could result in an impairment charge, which would reduce earnings. For purposes of depletion, depreciation, and impairment, reserve quantities are adjusted at all interim periods for the estimated impact of additions and dispositions.
45
Table of Contents
Impairment of Long-Lived Assets
We review the carrying values of our oil and gas properties and undeveloped leaseholds, at least annually, or whenever events or changes in circumstances indicate that such carrying values may not be recoverable. If, upon review, the sum of the undiscounted pretax cash flows is less than the carrying value of the asset group, the carrying value is written down to estimated fair value. Individual assets are grouped for impairment review at the lowest level for which there are identifiable cash flows that are largely independent of the cash flows of other groups of assets, generally on a field-by-field basis. The fair value of impaired assets is determined based on quoted market prices in active markets, if available, or upon the present values of expected future cash flows. Estimated future cash flows are based on management’s expectations for the future and include estimates of natural gas and oil reserves and future commodity prices, revenues and operating and development costs. Negative revisions in estimates of reserves quantities or expectations of falling commodity prices or rising operating or development costs could result in a reduction in undiscounted future cash flows and could indicate property impairment.
We recorded non-cash impairment charges on properties included in developed properties of $0, $1,103, and $0 for the years ended December 31, 2011, 2010, and 2009, respectively. In 2010, the impairment loss related to the non-producing Waltman 34-24, as management determined it was not capable of economically producing reserves. We also wrote-off undeveloped leaseholds in the amount of $187, $480, and $417 for the years ended December 31, 2011, 2010 and 2009, respectively.
Asset Retirement Obligations
We recognize an estimated liability for future costs associated with the abandonment of our oil and gas properties. We base our estimate of the liability on our historical experience in abandoning oil and gas wells projected into the future based on our current understanding of federal and state regulatory requirements. Our present value calculations require us to estimate the economic lives of our properties, assume what future inflation rates apply to external estimates as well as determine what credit adjusted risk-free rate to use.
In periods subsequent to initial measurement of the asset retirement obligation (“ARO”), we recognize period-to-period changes in the liability resulting from the passage of time and revisions to either the timing or the amount of the original estimate of undiscounted cash flows. Revisions also result in increases or decreases in the carrying cost of the oil and gas asset. Increases in the ARO liability due to passage of time impact net income as accretion expense. The related capitalized cost, including revisions thereto, is charged to expense through production costs. The consolidated statement of operations impact of these estimates is reflected in our production costs and occurs over the remaining life of our oil and gas properties.
Derivative Instruments
We use derivative instruments to hedge our exposure to oil and gas production cash-flow risks caused by fluctuating commodity prices. All derivatives are measured at estimated fair value and recorded as liabilities or assets on the consolidated balance sheet. During 2011, one of our derivative instruments was designated as a cash flow hedge under which the change in fair value was recorded as a component of accumulated other comprehensive income and was subsequently reclassified into earnings as the contract settled. For derivative contracts that do not qualify, or for which we do not elect cash flow hedge accounting, changes in the estimated fair value of the contracts are recorded as unrealized gains and losses in the price risk management activities line item in the accompanying consolidated statement of operations.
We use our judgment to analyze which contracts meet the definition of a derivative instrument and to determine the fair value of each instrument identified. Changes in the estimated fair values of our mark-to-market derivative instruments have a significant impact on our net income. For the year ended December 31, 2011, we reported a $13,806 mark-to-market gain on commodity derivative instruments.
Fair Value of Measurements
Fair value is defined as the price that would be received to sell an asset or paid to transfer a liability in an orderly transaction between market participants at measurement date and establishes a three level hierarchy for measuring fair value. In determining the fair value of our derivative instruments, we consider quoted market prices in active markets and quotes from counterparties, the credit rating of each counterparty, and our own credit rating.
In consideration of counterparty credit risk, we assessed the possibility of whether each counterparty to the derivative would default by failing to make any contractually required payments. Additionally, we consider our company to be of substantial credit quality and believe we have the financial resources and willingness to meet its potential repayment obligations associated with the derivative transactions.
46
Table of Contents
Stock-Based Compensation
We measure and recognize compensation expense for all stock-based payment awards (including stock options and stock awards) made to employees and directors based on the estimated fair value at the grant date and recognize compensation expense in earnings over the requisite service period using a graded vesting method. Total stock-based compensation expense for equity-classified awards was $1,153 for the year ended December 31, 2011.
We use the Black-Scholes valuation model to determine the fair value of each stock option. Expected volatilities are based on the historical volatility of our stock over a period consistent with that of the expected terms of the options. The expected terms of the options are estimated based on factors such as vesting periods, contractual expiration dates, historical trends in our stock price and historical exercise behavior. The risk-free rates for periods within the contractual life of the options are based on the yields of U.S. Treasury instruments with terms comparable to the estimated option terms.
We measure the fair value of the stock awards based upon the fair market value of our common stock on the date of grant and recognize any resulting compensation expense ratably over the associated service period, which is generally the vesting term of the stock awards. Certain awards contain a performance condition, which requires management to estimate the probability of vesting based upon actual and expected future results. We recognize these compensation costs net of a forfeiture rate, if applicable, and recognize the compensation costs for only those shares expected to vest. If our actual forfeiture rate is materially different from our estimate, the stock-based compensation expense could be different from what we have recorded in the current period.
| 7A. | QUANTITATIVE AND QUALITATIVE DISCLOSURES ABOUT MARKET RISK |
Commodity Price Risks
Our major market risk exposure is in the pricing applicable to our natural gas and oil production. Pricing is primarily driven by the prevailing worldwide price for oil and spot market prices applicable to our U.S. natural gas production. Pricing for oil production and natural gas has been volatile and unpredictable for several years. The prices we receive for production depend on many factors outside of our control.
The primary objective of our commodity price risk management policy is to preserve and enhance the value of our equity gas production. We have entered into natural gas derivative contracts to manage our exposure to natural gas price volatility. Our derivative instruments typically consist of forward sales contracts, swaps and costless collars, which allow us to effectively “lock in” a portion of our future production of natural gas at prices that we consider favorable to us at the time we enter into the contract. These derivative instruments which have differing expiration dates, are summarized in the table presented above under Item 7. “Management’s Discussion and Analysis of Financial Condition and Results of Operations – Contracted Volumes.”
For the year ended December 31, 2011, our income before income taxes would have increased by $2,241 for each $0.50 increase per Mcf in natural gas prices and decreased by $1,238 for each $0.50 decrease per Mcf in natural gas prices due to the contracted volumes discussed above. Our income taxes would have increased $24 for each $1.00 change per Bbl in oil prices for the year ended December 31, 2011.
Interest Rate Risks
At December 31, 2011, we had a total of $42.0 million outstanding under our $150 million credit facility ($60 million borrowing availability). We pay interest on outstanding borrowings under our credit facility at interest rates that fluctuate based upon changes in our levels of outstanding debt and the prevailing market rates. We have a $30 million fixed rate swap contract with a third party in place as a hedge against the floating interest rate on our credit facility. Under the hedge contract terms, we locked in the Eurodollar LIBOR portion of the interest calculation at approximately 0.578% for a portion of our outstanding debt. Based upon our debt level at December 31, 2011, this resulted in a fixed interest rate of 3.08% for that $30 million tranche of our outstanding debt. The contract is effective through December 31, 2012.
47
Table of Contents
The average interest rate for the year ended December 31, 2011, calculated in accordance with the agreement, was 3.05%. Assuming no change in the amount outstanding at December 31, 2011, the annual impact on interest expense for every 1.0% change in the average interest rate would be approximately $120 before taxes.
| ITEM 8. | FINANCIAL STATEMENTS AND SUPPLEMENTARY DATA |
The information required by this item is included in Item 15, “Exhibits Financial Statements and Financial Statement Schedules.”
| ITEM 9. | CHANGES IN AND DISAGREEMENTS WITH ACCOUNTANTS ON ACCOUNTING AND FINANCIAL DISCLOSURE |
None.
| ITEM 9A. | CONTROLS AND PROCEDURES |
Evaluation of Disclosure Controls and Procedures
Our Chief Executive Officer and Chief Financial Officer have reviewed and evaluated the effectiveness of our disclosure controls and procedures (as defined in Exchange Act Rules 11a-15(e) and 15d-15(e)) as of the end of the period covered by this annual report on Form 10-K. Based upon this evaluation, our Chief Executive Officer and Chief Financial Officer concluded that our disclosure controls and procedures were effective in ensuring that material information required to be disclosed is included in the reports that we file with the Securities and Exchange Commission.
Management’s Annual Report on Internal Control Over Financial Reporting
Our management is responsible for establishing and maintaining adequate internal control over financial reporting as defined in Rules 13a-15(f) and 15d-15(f) under the Securities Exchange Act of 1934. The Company’s internal control over financial reporting is designed to provide reasonable assurance regarding the reliability of financial reporting and the preparation of financial statements for external purposes in accordance with U.S. generally accepted accounting principles.
Management assessed the effectiveness of the our internal control over financial reporting as of December 31, 2011. In making this assessment, management used the criteria set forth by the Committee of Sponsoring Organizations of the Treadway Commission (COSO) in Internal Control-Integrated Framework. Based on this evaluation, our management concluded that our internal control over financial reporting was effective as of December 31, 2011.
Our independent registered public accounting firm, Hein & Associates LLP, has issued a report on our internal control over financial reporting, which is included below.
Changes in Internal Control over Financial Reporting
There were no changes in our internal control over financial reporting during our fiscal quarter ended December 31, 2011 that have materially affected, or are reasonably likely to materially affect, our internal control over financial reporting.
48
Table of Contents
REPORT OF INDEPENDENT REGISTERED PUBLIC ACCOUNTING FIRM
To the Board of Directors and Stockholders
Double Eagle Petroleum Co.
We have audited Double Eagle Petroleum Co. and subsidiaries’(the “Company”) internal control over financial reporting as of December 31, 2011, based on criteria established in Internal Control — Integrated Framework issued by the Committee of Sponsoring Organizations of the Treadway Commission. Double Eagle Petroleum Co.’s management is responsible for maintaining effective internal control over financial reporting and for its assessment of the effectiveness of internal control over financial reporting included in the accompanying Management’s Report on Internal Control Over Financial Reporting. Our responsibility is to express an opinion on the Company’s internal control over financial reporting based on our audit.
We conducted our audit in accordance with the standards of the Public Company Accounting Oversight Board (United States). Those standards require that we plan and perform the audit to obtain reasonable assurance about whether effective internal control over financial reporting was maintained in all material respects. Our audit included obtaining an understanding of internal control over financial reporting, assessing the risk that a material weakness exists, and testing and evaluating the design and operating effectiveness of internal control based on the assessed risk. Our audit also included performing such other procedures as we considered necessary in the circumstances. We believe that our audit provides a reasonable basis for our opinion.
A company’s internal control over financial reporting is a process designed to provide reasonable assurance regarding the reliability of financial reporting and the preparation of financial statements for external purposes in accordance with generally accepted accounting principles. A company’s internal control over financial reporting includes those policies and procedures that (a) pertain to the maintenance of records that, in reasonable detail, accurately and fairly reflect the transactions and dispositions of the assets of the company; (b) provide reasonable assurance that transactions are recorded as necessary to permit preparation of financial statements in accordance with generally accepted accounting principles, and that receipts and expenditures of the company are being made only in accordance with authorizations of management and directors of the company; and (c) provide reasonable assurance regarding prevention or timely detection of unauthorized acquisition, use, or disposition of the company’s assets that could have a material effect on the financial statements.
Because of its inherent limitations, internal control over financial reporting may not prevent or detect misstatements. Also, projections of any evaluation of effectiveness to future periods are subject to the risk that controls may become inadequate because of changes in conditions, or that the degree of compliance with the policies or procedures may deteriorate.
In our opinion, Double Eagle Petroleum Co. maintained, in all material respects, effective internal control over financial reporting as of December 31, 2011, based on criteria established in Internal Control — Integrated Framework issued by the Committee of Sponsoring Organizations of the Treadway Commission.
We have also audited, in accordance with the standards of the Public Company Accounting Oversight Board (United States), the consolidated financial statements of Double Eagle Petroleum Co. and our report dated March 7, 2012 expressed an unqualified opinion.
Hein & Associates LLP
Denver, Colorado
March 7, 2012
49
Table of Contents
| ITEM 9B. | OTHER INFORMATION |
None.
Pursuant to instruction G(3) to Form 10-K, the following Items 10,11,12,13 and 14 will be included in an amendment to this Form 10-K or in Double Eagle’s definitive proxy statement for the 2012 annual meeting of stockholders to be filed within 120 days from December 31, 2011, and is incorporated by reference to this report
| ITEM 10. | DIRECTORS, EXECUTIVE OFFICERS AND CORPORATE GOVERNANCE |
Code of Conduct and Ethics
We maintain a code of ethics applicable to our Board of Directors, principal executive officer, and principal financial officer, as well as all of our other employees. A copy of the Code of Business Conduct and Ethics and our whistleblower procedures may be found on our website at http://www.dble.com in the Corporate Governance section.
| ITEM 11. | EXECUTIVE COMPENSATION |
Incorporated by reference from the definitive proxy statement for our 2012 annual meeting of stockholders, which will be filed no later than 120 days after December 31, 2011.
| ITEM 12. | SECURITY OWNERSHIP OF CERTAIN BENEFICIAL OWNERS AND MANAGEMENT AND RELATED STOCKHOLDER MATTERS |
Equity Compensation Plans. The following table provides information as of December 31, 2011 with respect to shares of common stock that may be issued under our existing equity compensation plans. We have four active equity compensation plans—The 2002 Stock Option Plan, the 2003 Stock Option and Compensation Plan, the 2007 Stock Incentive Plan and the 2010 Stock Incentive Plan.
| (a) | (b) | (c) | ||||||||||
| Number of securities | ||||||||||||
| remaining available | ||||||||||||
| Number of | for future issuance | |||||||||||
| securities to be | Weighted- | under equity | ||||||||||
| issued upon | average | compensation plans | ||||||||||
| exercise of | exercise price | (excluding securities | ||||||||||
| outstanding | of outstanding | reflected in column | ||||||||||
| Plan category |
options | options | (a)) | |||||||||
| Equity Compensation plans approved by security holders |
517,458 | $ | 12.02 | 1,678,598 | (1) | |||||||
|
|
|
|
|
|
|
|||||||
| Equity Compensation plans not approved by security holders |
— | — | — | |||||||||
|
|
|
|
|
|
|
|||||||
| (1) | Represents 98,000 shares available for issuance under the 2002 Stock Option Plan; 131,157 shares available for issuance under the 2003 Stock Option and Compensation Plan, 50,677 shares available for issuance under the 2007 Stock Incentive Plan and 1,398,764 shares available under the 2010 Stock Incentive Plan. |
50
Table of Contents
| ITEM 13. | CERTAIN RELATIONSHIPS, RELATED TRANSACTIONS AND DIRECTOR INDEPENDENCE |
Incorporated by reference from the definitive proxy statement for our 2012 annual meeting of stockholders, which will be filed no later than 120 days after December 31, 2011.
| ITEM 14. | PRINCIPAL ACCOUNTANT FEES AND SERVICES |
Incorporated by reference from the definitive proxy statement for our 2012 annual meeting of stockholders, which will be filed no later than 120 days after December 31, 2011.
| ITEM 15. | EXHIBITS AND FINANCIAL STATEMENT SCHEDULES |
(a)(1) and (a)(2) Financial Statements and Financial Statement Schedules
All other schedules are omitted because the required information is not applicable or is not present in amounts sufficient to require submission of the schedule or because the information required is included in the Consolidated Financial Statements and Notes thereto.
(b) Exhibits. The following exhibits are filed with or incorporated by reference into this report on Form 10-K:
51
Table of Contents
| Exhibit No. |
Description | |
| 2.1(a) | Agreement and Plan of Merger, dated March 30, 2009, by and among the Company, DBLE Acquisition Corporation, and Petrosearch Energy Corporation (incorporated by reference from Exhibit 2.1 of the Company’s Current Report of Form 8-K filed March 31, 2009) | |
| 3.1(a) | Articles of Incorporation filed with the Maryland Secretary of State on January 23, 2001 (incorporated by reference from Exhibit 3.1(a) of the Company’s Annual Report on Form 10-KSB for the year ended August 31, 2001). | |
| 3.1(b) | Certificate of Correction filed with the Maryland Secretary of State on February 15, 2001 concerning the Articles of Incorporation (incorporated by reference from Exhibit 3.1(b) of the Company’s Annual Report on Form 10-KSB for the year ended August 31, 2001). | |
| 3.1(c) | Certificate of Correction filed with the Maryland Secretary of State (incorporated by reference from Exhibit 3 of the Company’s Quarterly Report on Form 10-QSB for the quarter ended November 30, 2001). | |
| 3.1(e) | Certificate of Correction to the Articles of Incorporation, filed with the Maryland Department of Assessments and Taxation on June 1, 2007 (incorporated by reference from Exhibit 3.3 of the Company’s Current Report of Form 8-K filed June 29, 2007). | |
| 3.1(f) | Articles of Amendment, filed with the Maryland Department of Assessments and Taxation on June 26, 2007 (incorporated by reference from Exhibit 3.1 of the company’s Current Report on Form 8-K filed June 29, 2007). | |
| 3.1(g) | Articles Supplementary, filed with the Maryland Department of Assessments and Taxation on June 29, 2007 (incorporated by reference from Exhibit 3.2 of the Company’s Current Report of Form 8-K filed June 29, 2007). | |
| 3.1(h) | Articles Supplementary of Junior Participating Preferred Stock, Series B, dated as of August 21, 2007 (incorporated by reference from Exhibit 3.1 of the Company’s Current Report of Form 8-K filed August 28, 2007). | |
| 3.2(a) | Second Amendment and Restated Bylaws of the Company (incorporated by reference from Exhibit 3.2 of the Company’s Current Report on Form 8-K filed June 11, 2007). | |
| 4.1(a) | Articles Supplementary of Series A. Cumulative Preferred Stock, filed with the Maryland Department of Assessments and Taxation on June 29, 2007 (incorporated by reference from Exhibit 3.2 of the Company’s Current Report on Form 8-K filed June 29, 2007). | |
| 4.1(b) | Articles Supplementary of Junior Participating Preferred Stock, Series B, dated as of August 21, 2007 (incorporated by reference from Exhibit 3.1 of the Company’s Current Report of Form 8-K dated August 28, 2007). | |
| 10.1(a) | Double Eagle Petroleum Co. 2007 Stock Incentive Plan, including the Form of Incentive Stock Option Agreement and Form of Non-Qualified Stock Option Agreement (incorporated by reference from Exhibits 10.1, 10.2 and 10.3 to the Company’s Current Report on Form 8-K filed May 29, 2007). | |
| 10.1(b) | Employment Agreement between the Company and Richard Dole, dated September 4, 2008 (incorporated by reference from Exhibit 10.1 of the Company’s Current Report of Form 8-K filed September 9, 2008). | |
| 10.1(c) | Employment Agreement between the Company and Kurtis Hooley, dated September 4, 2008 (incorporated by reference from Exhibit 10.2 of the Company’s Current Report of Form 8-K filed September 9, 2008). | |
| 10.1(d) | Employment Agreement between the Company and D. Steven Degenfelder, dated September 4, 2008 (incorporated by reference from Exhibit 10.3 of the Company’s Current Report of Form 8-K filed September 9, 2008). | |
| 10.1(e) | Amended and restated credit agreement dated February 5, 2010, among the Company and Bank of Oklahoma, N.A., and the other lenders named therein (incorporated by reference from exhibit 10.1 of the Company’s Current Report on Form 8-K filed February 9, 2010). | |
52
Table of Contents
| Exhibit No. |
Description | |
| 10.1(f) | Employment Agreement between the Company and Ashley Jenkins, dated January 4, 2010 (incorporated by reference from Exhibit 10.1 of the Company’s Current Report of Form 8-K filed January 7, 2010). | |
| 10.1(g) | Double Eagle Petroleum Co. 2010 Stock Incentive Plan (incorporated by reference from Exhibit 10.1 to the Company’s Current Report on Form S-8 filed July 23, 2010). | |
| 10.1(h) | First Amendment to Amended and Restated Credit Agreement, dated August 6, 2010, between the Company and Bank of Oklahoma, N.A. et al (incorporated herein by reference from the Company’s Current Report on Form 8-K filed on August 9, 2010). | |
| 10.1(i) | Second Amendment to Amended and Restated Credit Agreement, dated March 7, 2011 between the Company and Bank of Oklahoma, N.A., et al (incorporated by reference from exhibit 10.1 of the Company’s Current Report on Form 8-K filed March 10, 2011). | |
| 10.1(j) | At Market Issuance Sales Agreement, dated August 23, 2011 by and between the Company and McNicoll, Lewis & Vlak LLC (incorporated by reference from Exhibit 10.1 of the Company’s Current Report on Form 8-K filed August 24, 2011). | |
| 10.1(k) | Third Amendment to Amended and Restated Credit Agreement, dated October 24 2011 between the Company and Bank of Oklahoma, N.A., et al (incorporated by reference from exhibit 10.1 of the Company’s Current Report on Form 8-K filed October 26, 2011). | |
| 10.1(l)* | 2010 Stock Incentive Plan adopted September 30, 2011. | |
| 14.1 | Code of Business Conduct and Ethics (incorporated by reference from exhibit 99.2 of the Company’s Annual Report on Form 10-KSB filed for the year ended December 31, 2004. | |
| 21.1* | Subsidiaries of registrant. | |
| 23.1* | Consent of Hein & Associates LLP. | |
| 23.2* | Consent of Netherland, Sewell & Associates, Inc. | |
| 31.1* | Certification of Principal Executive Officer and Chief Executive Officer pursuant to Section 302 of the Sarbanes-Oxley Act of 2002. | |
| 31.2* | Certification of Principal Accounting Officer and Chief Financial Officer pursuant to Section 302 of the Sarbanes-Oxley Act of 2002. | |
| 32* | Certification Pursuant to 18 U.S.C. Section 1150 as adopted pursuant to section 906 of the Sarbanes-Oxley Act of 2002. | |
| 99.1* | Report of Netherland, Sewell & Associates, Inc. dated February 6, 2012. | |
| 101.INS** | XBRL Instance Document | |
| 101.SCH** | XBRL Taxonomy Extension Scheme Document | |
| 101.CAL** | XBRL Taxonomy Extension Calculation Linkbase Document | |
| 101.LAB** | XBRL Taxonomy Extension Label Linkbase Document | |
| 101.PRE** | XBRL Taxonomy Extension Presentation Linkbase Document | |
53
Table of Contents
| * | Filed with this Form 10-K. |
| ** | Pursuant to Rule 406T of Regulation S-T, these Interactive Data Files are deemed not filed or part of a registration statement or prospectus for purposes of Sections 11 or 12 of the Securities Act of 1933, as amended, are deemed not filed for purposes of Section 18 of the Securities Exchange Act of 1934, as amended, and otherwise are not subject to the liability under these sections. |
54
Table of Contents
SIGNATURES
Pursuant to the requirements of Section 13 or 15(d) of the Securities Exchange Act of 1934, the registrant has duly caused this report to be signed on its behalf by the undersigned, thereunto duly authorized.
DOUBLE EAGLE PETROLEUM CO.
| Date: March 8, 2012 | /s/ Richard Dole | |||||
| Richard Dole | ||||||
| Chief Executive Officer |
| Date: March 8, 2012 | /s/ Kurtis S. Hooley | |||||
| Kurtis S. Hooley | ||||||
| Chief Financial Officer |
Pursuant to the requirements of the Securities Exchange Act Of 1934, this report has been signed below by the following persons on behalf of the registrant and in the capacities and on the dates indicated.
| Date: March 8, 2012 |
/s/ Richard Dole | |||||
| Principal Executive Officer | ||||||
| Chief Executive Officer |
| Date: March 8, 2012 |
/s/ Kurtis S. Hooley | |||||
| Principal Financial and Accounting Officer | ||||||
| Chief Financial Officer |
| Date: March 8, 2012 |
/s/ Sigmund Balaban | |||||
| Sigmund Balaban, Director |
| Date: March 8, 2012 |
/s/ Roy G. Cohee | |||||
| Roy G. Cohee, Director |
| Date: March 8, 2012 |
/s/ Brent Hathaway | |||||
| Brent Hathaway, Director |
| Date: March 8, 2012 |
/s/ David W. Wilson | |||||
| David W. Wilson, Director |
55
Table of Contents
REPORT OF INDEPENDENT REGISTERED PUBLIC ACCOUNTING FIRM
To the Board of Directors and Stockholders
Double Eagle Petroleum Co.
We have audited the accompanying consolidated balance sheets of Double Eagle Petroleum Co. and subsidiaries (the “Company”) as of December 31, 2011 and 2010, and the related consolidated statements of operations, stockholders’ equity, and cash flows for each of the three years in the period ended December 31, 2011. These financial statements are the responsibility of the Company’s management. Our responsibility is to express an opinion on these financial statements based on our audits.
We conducted our audits in accordance with the standards of the Public Company Accounting Oversight Board (United States). Those standards require that we plan and perform the audit to obtain reasonable assurance about whether the financial statements are free of material misstatement. An audit includes examining, on a test basis, evidence supporting the amounts and disclosures in the financial statements. An audit also includes assessing the accounting principles used and significant estimates made by management, as well as evaluating the overall financial statement presentation. We believe that our audits provide a reasonable basis for our opinion.
In our opinion, the consolidated financial statements referred to above present fairly, in all material respects, the financial position of Double Eagle Petroleum Co. and subsidiaries as of December 31, 2011 and 2010, and the results of their operations and their cash flows for each of the three years in the period ended December 31, 2011, in conformity with U.S. generally accepted accounting principles.
We have also audited, in accordance with the standards of the Public Company Accounting Oversight Board (United States), Double Eagle Petroleum Co. and subsidiaries’ internal control over financial reporting as of December 31, 2011, based on criteria established in Internal Control — Integrated Framework issued by the Committee of Sponsoring Organizations of the Treadway Commission, and our report dated March 7, 2012 expressed an unqualified opinion on the effectiveness of Double Eagle Petroleum Co.’s internal control over financial reporting.
Hein & Associates LLP
Denver, Colorado
March 7, 2012
F-1
Table of Contents
DOUBLE EAGLE PETROLEUM CO.
(Amounts in thousands of dollars except share and per share data)
| December 31, | December 31, | |||||||
| 2011 | 2010 | |||||||
| ASSETS |
||||||||
| Current assets: |
||||||||
| Cash and cash equivalents |
$ | 8,678 | $ | 2,605 | ||||
| Cash held in escrow |
564 | 615 | ||||||
| Accounts receivable, net |
4,869 | 5,396 | ||||||
| Assets from price risk management |
10,022 | 9,622 | ||||||
| Other current assets |
4,206 | 3,653 | ||||||
|
|
|
|
|
|||||
| Total current assets |
28,339 | 21,891 | ||||||
|
|
|
|
|
|||||
| Oil and gas properties and equipment, successful efforts method: |
||||||||
| Developed properties |
209,774 | 188,143 | ||||||
| Wells in progress |
8,182 | 4,039 | ||||||
| Gas transportation pipeline |
5,482 | 5,465 | ||||||
| Undeveloped properties |
2,921 | 3,062 | ||||||
| Corporate and other assets |
2,075 | 1,982 | ||||||
|
|
|
|
|
|||||
| 228,434 | 202,691 | |||||||
| Less accumulated depreciation, depletion and amortization |
(91,070 | ) | (72,226 | ) | ||||
|
|
|
|
|
|||||
| Net properties and equipment |
137,364 | 130,465 | ||||||
|
|
|
|
|
|||||
| Assets from price risk management |
4,812 | — | ||||||
| Other assets |
79 | 161 | ||||||
|
|
|
|
|
|||||
| TOTAL ASSETS |
$ | 170,594 | $ | 152,517 | ||||
|
|
|
|
|
|||||
| LIABILITIES, PREFERRED STOCK AND STOCKHOLDERS' EQUITY |
||||||||
| Current liabilities: |
||||||||
| Accounts payable and accrued expenses |
$ | 12,162 | $ | 10,830 | ||||
| Accrued production taxes |
2,590 | 2,757 | ||||||
| Capital lease obligations, current portion |
— | 545 | ||||||
| Other current liabilities |
47 | 282 | ||||||
|
|
|
|
|
|||||
| Total current liabilities |
14,799 | 14,414 | ||||||
| Credit facility |
42,000 | 32,000 | ||||||
| Asset retirement obligation |
6,300 | 5,848 | ||||||
| Deferred tax liability |
13,314 | 9,578 | ||||||
|
|
|
|
|
|||||
| Total liabilities |
76,413 | 61,840 | ||||||
|
|
|
|
|
|||||
| Preferred stock, $0.10 par value; 10,000,000 shares authorized; 1,610,000 shares issued and outstanding as of December 31, 2011 and December 31, 2010 |
37,972 | 37,972 | ||||||
|
|
|
|
|
|||||
| Stockholders’ equity: |
||||||||
| Common stock, $0.10 par value; 50,000,000 shares authorized; 11,232,542 issued and 11,215,658 outstanding at December 31, 2011 and 11,165,305 issued and 11,155,080 outstanding at December 31, 2010 |
1,122 | 1,116 | ||||||
| Additional paid-in capital |
45,685 | 44,583 | ||||||
| Retained earnings |
9,402 | 1,438 | ||||||
| Accumulated other comprehensive income, net |
— | 5,568 | ||||||
|
|
|
|
|
|||||
| Total stockholders’ equity |
56,209 | 52,705 | ||||||
|
|
|
|
|
|||||
| TOTAL LIABILITIES, PREFERRED STOCK AND STOCKHOLDERS’ EQUITY |
$ | 170,594 | $ | 152,517 | ||||
|
|
|
|
|
|||||
The accompanying notes are an integral part of the consolidated financial statements.
F-2
Table of Contents
DOUBLE EAGLE PETROLEUM CO.
CONSOLIDATED STATEMENTS OF OPERATIONS
(Amounts in thousands of dollars except share and per share data)
| Year ended December 31, | ||||||||||||
| 2011 | 2010 | 2009 | ||||||||||
| Revenues |
||||||||||||
| Oil and gas sales |
$ | 44,160 | $ | 33,610 | $ | 42,398 | ||||||
| Transportation and gathering revenue |
4,894 | 5,549 | 6,179 | |||||||||
| Price risk management activities |
14,740 | 11,512 | (4,295 | ) | ||||||||
| Proceeds from Madden Deep settlement |
— | 3,841 | — | |||||||||
| Other income |
909 | 472 | 509 | |||||||||
|
|
|
|
|
|
|
|||||||
| Total revenues |
64,703 | 54,984 | 44,791 | |||||||||
|
|
|
|
|
|
|
|||||||
| Costs and expenses |
||||||||||||
| Production costs |
11,047 | 9,708 | 7,754 | |||||||||
| Production taxes |
4,365 | 4,563 | 3,652 | |||||||||
| Exploration expenses including dry hole costs |
273 | 163 | 103 | |||||||||
| Pipeline operating costs |
4,114 | 4,152 | 3,701 | |||||||||
| Impairment and abandonment of equipment and properties |
187 | 1,583 | 417 | |||||||||
| General and administrative |
6,107 | 5,976 | 6,718 | |||||||||
| Depreciation, depletion and amortization |
18,844 | 18,574 | 18,562 | |||||||||
|
|
|
|
|
|
|
|||||||
| Total costs and expenses |
44,937 | 44,719 | 40,907 | |||||||||
|
|
|
|
|
|
|
|||||||
| Income from operations |
19,766 | 10,265 | 3,884 | |||||||||
| Interest expense, net |
(1,317 | ) | (1,538 | ) | (1,773 | ) | ||||||
|
|
|
|
|
|
|
|||||||
| Income before income taxes |
18,449 | 8,727 | 2,111 | |||||||||
| Provision for deferred income taxes |
(6,762 | ) | (3,224 | ) | (902 | ) | ||||||
|
|
|
|
|
|
|
|||||||
| NET INCOME |
$ | 11,687 | $ | 5,503 | $ | 1,209 | ||||||
|
|
|
|
|
|
|
|||||||
| Preferred stock dividends |
(3,723 | ) | (3,723 | ) | (3,723 | ) | ||||||
|
|
|
|
|
|
|
|||||||
| Net income (loss) attributable to common stock |
$ | 7,964 | $ | 1,780 | $ | (2,514 | ) | |||||
|
|
|
|
|
|
|
|||||||
| Net income (loss) per common share: |
||||||||||||
| Basic |
$ | 0.71 | $ | 0.16 | $ | (0.25 | ) | |||||
|
|
|
|
|
|
|
|||||||
| Diluted |
$ | 0.71 | $ | 0.16 | $ | (0.25 | ) | |||||
|
|
|
|
|
|
|
|||||||
| Weighted average shares outstanding: |
||||||||||||
| Basic |
11,191,496 | 11,123,131 | 9,955,582 | |||||||||
|
|
|
|
|
|
|
|||||||
| Diluted |
11,210,604 | 11,123,131 | 9,955,582 | |||||||||
|
|
|
|
|
|
|
|||||||
The accompanying notes are an integral part of the consolidated financial statements.
F-3
Table of Contents
DOUBLE EAGLE PETROLEUM CO.
CONSOLIDATED STATEMENT OF CASH FLOWS
(Amounts in thousands of dollars)
| Year ended December 31, | ||||||||||||
| 2011 | 2010 | 2009 | ||||||||||
| Cash flows from operating activities: |
||||||||||||
| Net income |
$ | 11,687 | $ | 5,503 | $ | 1,209 | ||||||
| Adjustments to reconcile net income to net cash provided by operating activities: |
||||||||||||
| Depreciation, depletion, amortization and accretion of asset retirement obligation |
19,018 | 18,714 | 18,693 | |||||||||
| Non-cash gain on transfer of ARO to a third party |
— | (164 | ) | — | ||||||||
| Settlement of asset retirement obligation |
— | — | (266 | ) | ||||||||
| Non cash revenue from carried interest |
(117 | ) | (2,123 | ) | (2,044 | ) | ||||||
| Impairment and abandonment of equipment and properties |
187 | 1,583 | 417 | |||||||||
| Provision for deferred taxes |
6,762 | 3,181 | 902 | |||||||||
| Change in fair value of derivative contracts |
(13,760 | ) | (6,196 | ) | 7,798 | |||||||
| Stock-based compensation expense |
1,153 | 956 | 1,484 | |||||||||
| Gain on sale of oil and gas properties and equipment |
(627 | ) | (290 | ) | (283 | ) | ||||||
| Changes in current assets and liabilities: |
||||||||||||
| Decrease (Increase) in deposit held in escrow |
51 | (4 | ) | (6 | ) | |||||||
| Decrease in accounts receivable |
527 | 2,049 | 13,884 | |||||||||
| Decrease (Increase) in other current assets |
612 | (179 | ) | (150 | ) | |||||||
| Increase (Decrease) in accounts payable and accrued expenses |
(544 | ) | 2,925 | (18,998 | ) | |||||||
| Decrease in accrued production taxes |
(167 | ) | (911 | ) | (578 | ) | ||||||
|
|
|
|
|
|
|
|||||||
| NET CASH PROVIDED BY OPERATING ACTIVITIES |
24,782 | 25,044 | 22,062 | |||||||||
|
|
|
|
|
|
|
|||||||
| Cash flows from investing activities: |
||||||||||||
| Additions of producing properties and equipment |
(23,958 | ) | (12,861 | ) | (28,542 | ) | ||||||
| Additions of corporate and non-producing properties |
(359 | ) | (1,135 | ) | (139 | ) | ||||||
| Proceeds from sales of properties and assets |
371 | 6 | — | |||||||||
| Net cash received from Petrosearch acquisition |
— | — | 7,733 | |||||||||
| Purchase of additional Atlantic Rim working interest |
— | (7,868 | ) | — | ||||||||
| Payment of Petrosearch transaction costs |
— | — | (513 | ) | ||||||||
|
|
|
|
|
|
|
|||||||
| NET CASH USED IN INVESTING ACTIVITIES |
(23,946 | ) | (21,858 | ) | (21,461 | ) | ||||||
|
|
|
|
|
|
|
|||||||
| Cash flows from financing activities: |
||||||||||||
| Dividends paid on preferred stock |
(3,723 | ) | (3,723 | ) | (3,723 | ) | ||||||
| Net borrowings/(payments) on credit facility |
10,000 | (2,000 | ) | 9,361 | ||||||||
| Deferred financing costs |
(450 | ) | — | — | ||||||||
| Principal payments on capital lease obligations |
(545 | ) | (533 | ) | (522 | ) | ||||||
| Tax withholdings related to net share settlement of restricted stock awards |
(45 | ) | (14 | ) | (39 | ) | ||||||
| Issuance of stock under Company stock plans |
— | 7 | 4 | |||||||||
|
|
|
|
|
|
|
|||||||
| NET CASH PROVIDED/(USED IN) BY FINANCING ACTIVITIES |
5,237 | (6,263 | ) | 5,081 | ||||||||
|
|
|
|
|
|
|
|||||||
| Change in cash and cash equivalents |
6,073 | (3,077 | ) | 5,682 | ||||||||
| Cash and cash equivalents at beginning of period |
2,605 | 5,682 | — | |||||||||
|
|
|
|
|
|
|
|||||||
| CASH AND CASH EQUIVALENTS AT END OF PERIOD |
$ | 8,678 | $ | 2,605 | $ | 5,682 | ||||||
|
|
|
|
|
|
|
|||||||
| Supplemental disclosure of cash and non-cash transactions: |
||||||||||||
| Cash paid for interest |
$ | 1,352 | $ | 1,894 | $ | 2,151 | ||||||
| Interest capitalized |
$ | 155 | $ | 192 | $ | 485 | ||||||
| Cash paid for income taxes |
$ | — | $ | 44 | $ | — | ||||||
| Additions to developed properties included in current liabilities |
$ | 6,489 | $ | 4,685 | $ | 10,245 | ||||||
| Additions to developed properties for retirement obligations |
$ | 277 | $ | 1,063 | $ | 94 | ||||||
| Issuance of common stock in connection with the acquisition of Petrosearch |
$ | — | $ | — | $ | 7,260 | ||||||
| Fair value of asset received in connection with the acquisition of Petrosearch |
$ | — | $ | — | $ | 9,151 | ||||||
| Fair value of liabilities assumed in connection with the acquisition of Petrosearch |
$ | — | $ | — | $ | 1,018 | ||||||
The accompanying notes are an integral part of the consolidated financial statements.
F-4
Table of Contents
DOUBLE EAGLE PETROLEUM CO.
CONSOLIDATED STATEMENT OF CHANGES IN STOCKHOLDERS’ EQUITY
(Amounts in thousands of dollars except share data)
| Accumulated | ||||||||||||||||||||||||
| Shares of | Other | Total | ||||||||||||||||||||||
| Common Stock | Additional Paid- | Retained | Comprehensive | Stockholders’ | ||||||||||||||||||||
| Outstanding | Common Stock | In Capital | Earnings | Income (loss) | Equity | |||||||||||||||||||
| Balance at January 1, 2009 |
9,192,356 | $ | 919 | $ | 35,122 | $ | 2,172 | $ | 16,690 | $ | 54,903 | |||||||||||||
| Comprehensive loss |
||||||||||||||||||||||||
| Net income |
— | — | — | 1,209 | — | 1,209 | ||||||||||||||||||
| Net change in derivative instrument fair value, net of tax |
— | — | — | — | 1,367 | 1,367 | ||||||||||||||||||
| Reclassification to earnings |
— | — | — | — | (15,740 | ) | (15,740 | ) | ||||||||||||||||
|
|
|
|||||||||||||||||||||||
| Total comprehensive loss |
(13,164 | ) | ||||||||||||||||||||||
|
|
|
|||||||||||||||||||||||
| Shares issued in connection with Petrosearch acquisition |
1,791,733 | 179 | 7,080 | — | — | 7,259 | ||||||||||||||||||
| Share-based compensation expense, exclusive of amount withheld for payroll taxes |
79,912 | 8 | 1,264 | — | — | 1,272 | ||||||||||||||||||
| Directors fees paid in stock |
26,724 | 3 | 174 | — | — | 177 | ||||||||||||||||||
| Dividends declared and paid on preferred stock |
— | — | — | (3,723 | ) | — | (3,723 | ) | ||||||||||||||||
|
|
|
|
|
|
|
|
|
|
|
|
|
|||||||||||||
| Balance at December 31, 2009 |
11,090,725 | 1,109 | 43,640 | (342 | ) | 2,317 | 46,724 | |||||||||||||||||
| Comprehensive income |
||||||||||||||||||||||||
| Net income |
— | — | — | 5,503 | — | 5,503 | ||||||||||||||||||
| Net change in derivative instrument fair value, net of tax |
— | — | — | — | 3,251 | 3,251 | ||||||||||||||||||
|
|
|
|||||||||||||||||||||||
| Total comprehensive income |
8,754 | |||||||||||||||||||||||
|
|
|
|||||||||||||||||||||||
| Share-based compensation expense, exclusive of amounts withheld for payroll taxes |
18,700 | 2 | 752 | — | — | 754 | ||||||||||||||||||
| Directors fees paid in stock |
45,655 | 5 | 191 | — | — | 196 | ||||||||||||||||||
| Dividends declared and paid on preferred stock |
— | — | — | (3,723 | ) | — | (3,723 | ) | ||||||||||||||||
|
|
|
|
|
|
|
|
|
|
|
|
|
|||||||||||||
| Balance at December 31, 2010 |
11,155,080 | $ | 1,116 | $ | 44,583 | $ | 1,438 | $ | 5,568 | $ | 52,705 | |||||||||||||
|
|
|
|
|
|
|
|
|
|
|
|
|
|||||||||||||
The accompanying notes are an integral part of the consolidated financial statements.
F-5
Table of Contents
DOUBLE EAGLE PETROLEUM CO.
CONSOLIDATED STATEMENT OF CHANGES IN STOCKHOLDERS' EQUITYCONSOLIDATED STATEMENT OF CHANGES IN STOCKHOLDERS’ EQUITY (CONTINUED)
(Amounts in thousands of dollars except share data)
| Accumulated | ||||||||||||||||||||||||
| Shares of | Other | Total | ||||||||||||||||||||||
| Common Stock | Additional Paid- | Retained | Comprehensive | Stockholders’ | ||||||||||||||||||||
| Outstanding | Common Stock | In Capital | Earnings | Income (loss) | Equity | |||||||||||||||||||
| Balance at December 31, 2010 |
11,155,080 | $ | 1,116 | $ | 44,583 | $ | 1,438 | $ | 5,568 | $ | 52,705 | |||||||||||||
| Comprehensive income |
||||||||||||||||||||||||
| Net income |
— | — | — | 11,687 | — | 11,687 | ||||||||||||||||||
| Net change in derivative instrument fair value, net of tax |
— | — | — | — | 556 | 556 | ||||||||||||||||||
| Reclassification to earnings, net of tax |
(6,124 | ) | (6,124 | ) | ||||||||||||||||||||
|
|
|
|||||||||||||||||||||||
| Total comprehensive income |
6,119 | |||||||||||||||||||||||
|
|
|
|||||||||||||||||||||||
| Stock-options exercised (cashless) |
1,088 | 1 | 1 | |||||||||||||||||||||
| Share-based compensation expense, exclusive of amounts withheld for payroll taxes |
21,603 | 2 | 885 | — | — | 887 | ||||||||||||||||||
| Directors fees paid in stock |
37,887 | 3 | 217 | — | — | 220 | ||||||||||||||||||
| Dividends declared and paid on preferred stock |
— | — | — | (3,723 | ) | — | (3,723 | ) | ||||||||||||||||
|
|
|
|
|
|
|
|
|
|
|
|
|
|||||||||||||
| Balance at December 31, 2011 |
11,215,658 | $ | 1,122 | $ | 45,685 | $ | 9,402 | $ | — | $ | 56,209 | |||||||||||||
|
|
|
|
|
|
|
|
|
|
|
|
|
|||||||||||||
The accompanying notes are an integral part of the consolidated financial statements.
F-6
Table of Contents
DOUBLE EAGLE PETROLEUM CO.
NOTES TO THE CONSOLIDATED FINANCIAL STATEMENTS
(Amounts in thousands of dollars except share and per share data)
1. Business Description and Summary of Significant Accounting Policies
Description of Operations
Double Eagle Petroleum Co. (“Double Eagle” or the “Company”) is an independent energy company engaged in the exploration, development, production and sale of natural gas and oil, primarily in the Rocky Mountain basins of the western United States. Double Eagle was incorporated in the State of Wyoming in January 1972 and reincorporated in the State of Maryland in February 2001.
Principles of Consolidation and Basis of Presentation
The consolidated financial statements include the accounts of the Company and its wholly-owned subsidiaries, Petrosearch Energy Corporation (“Petrosearch”) and Eastern Washakie Midstream LLC (“EWM”). In August 2009, the Company acquired Petrosearch, which has operations in Texas and Oklahoma. In 2006, the Company sold transportation assets located in the Catalina Unit, at cost, to EWM in exchange for an intercompany note receivable bearing interest of 5% per annum, maturing on January 31, 2028. The note and related interest are fully eliminated in consolidation. In addition, the Company has an agreement with EWM under which the Company pays a fee to EWM to gather and compress gas produced at the Catalina Unit. This fee related to gas gathering is also eliminated in consolidation.
The Company has no interests in any unconsolidated entities, nor does it have any unconsolidated special purpose entities.
Certain reclassifications have been made to amounts reported in previous years to conform to the 2011 presentation. Such reclassifications had no effect on net income. The Company has evaluated subsequent events through the date of issuance of its consolidated financial statements.
Cash and Cash Equivalents
Cash and cash equivalents include all cash balances and any highly liquid investments with an original maturity of 90 days or less. The carrying amount approximates fair value because of the short maturity of these instruments.
Cash Held in Escrow
The Company has received deposits representing partial prepayments of the expected capital expenditures from third party working interest owners in the Table Top Unit #1 exploration project. The unexpended portion of the deposits at December 31, 2011 and 2010 totaled $564 and $615, respectively.
Accounts Receivable
The Company records estimated oil and gas revenue receivable from third parties at its net revenue interest. The Company also reflects costs incurred on behalf of joint interest partners in accounts receivable. Management periodically reviews accounts receivable amounts for collectability and records its allowance for uncollectible receivables under the specific identification method. The Company did not record any allowance for uncollectible receivables in 2011, 2010, or 2009.
Use of Estimates in the Preparation of Financial Statements
The preparation of financial statements in conformity with accounting principles generally accepted in the United States requires management to make estimates and assumptions that affect the reported amounts of oil and gas reserves, assets and liabilities and disclosure on contingent assets and liabilities at the date of the financial statements and the reported amounts of revenues and expenses during the reporting period. Actual results could differ from those estimates. Estimates of oil and gas reserve quantities provide the basis for calculation of depletion, depreciation, and amortization, and impairment, each of which represents a significant component of the consolidated financial statements.
F-7
Table of Contents
Concentration of Credit Risk
Financial instruments which potentially subject the Company to credit risk consist of accounts receivable and derivative financial instruments. Substantially all of the Company’s receivables are within the oil and gas industry, including those from the Company’s third party marketing company. Collectability is dependent upon the financial wherewithal of each individual company as well as the general economic conditions of the industry. The receivables are not collateralized.
The Company currently has one counterparty for its derivative financial instruments. The Company continually reviews the credit worthiness of its counterparties, which are generally other energy companies. In addition, the Company uses master netting agreements that allow the Company, in the event of default, to elect early termination of all contracts with the defaulting counterparty. If the Company chooses to elect early termination, all asset and liability positions with the defaulting counterparty would be net settled at the time of election. Net settlement refers to a process by which all transactions between counterparties are resolved into a single amount owed by one party to the other.
Revenue Recognition and Gas Balancing
The Company recognizes oil and gas revenues for its ownership percentage of total production under the entitlement method, whereby the working interest owner records revenue based on its share of entitled production, regardless of whether the Company has taken its ownership share of such volumes. An over-produced owner would record the excess of the amount taken over its entitled share as a reduction in revenues and a payable while the under-produced owner records revenue and a receivable for the imbalance amount. The Company’s imbalance position with various third party operators at December 31, 2011 resulted in an imbalance receivable of 102 MMcf, or $305, and an imbalance payable of 226 MMcf, or $890.
Oil and Gas Producing Activities
The Company uses the successful efforts method of accounting for its oil and gas producing activities. Under this method of accounting, all property acquisition costs and costs of exploration and development wells are capitalized when incurred, pending determination of whether the well has found proved reserves. If an exploratory well does not find proved reserves, the costs of drilling the well are charged to expense. The costs of development wells are capitalized whether productive or nonproductive.
Geological and geophysical costs and the costs of carrying and retaining unproved leaseholds are expensed as incurred. The Company limits the total amount of unamortized capitalized costs for each property to the value of future net revenues, based on expected future prices and costs.
Depreciation, depletion and amortization (“DD&A”) of capitalized costs for producing oil and gas properties is calculated on a field-by-field basis using the units-of-production method, based on proved oil and gas reserves. DD&A takes into consideration restoration, dismantlement and abandonment costs and the anticipated proceeds for equipment salvage. The Company has historically based the fourth quarter depletion calculation on the respective year end reserve report and used this methodology in computing the fourth quarter 2011 depletion expense.
DD&A of oil and gas properties for the years ended December 31, 2011, 2010, and 2009, was $18,439, $18,159, and $18,136, respectively.
The Company invests in unevaluated oil and gas properties for the purpose of future exploration and development of proved reserves. The costs of unproved leases which become productive are reclassified to proved properties when proved reserves are discovered on the property. Unproved oil and gas interests are carried at the lower of cost or estimated fair market value and are not subject to amortization.
F-8
Table of Contents
The following table reflects the net changes in capitalized exploratory well costs during the years ended December 31, 2011, 2010 and 2009. Amounts include costs capitalized and subsequently expensed in the same period.
| 2011 | 2010 | 2009 | ||||||||||
| Beginning balance at January 1, |
$ | — | $ | — | $ | — | ||||||
| Additions to capitalized exploratory well costs pending the determination of proved reserves |
16,198 | — | — | |||||||||
| Reclassifications to wells, facilities and equipment based on the determination of proved reserves |
(12,028 | ) | — | — | ||||||||
| Capitalized exploratory well costs charged to expense |
— | — | — | |||||||||
|
|
|
|
|
|
|
|||||||
| Ending balance at December 31, |
$ | 4,170 | $ | — | $ | — | ||||||
|
|
|
|
|
|
|
|||||||
The capitalized exploratory well costs pending determination of proved reserves at December 31, 2011 are related to one well being drilled to the Niobrara formation in the Atlantic Rim. The well was spud in the fourth quarter of 2011 and was still in process as of December 31, 2011.
Asset Retirement Obligations
Legal obligations associated with the retirement of long-lived assets result from the acquisition, construction, development and normal use of the asset. The Company’s asset retirement obligations relate primarily to the retirement of oil and gas properties and related production facilities, lines and other equipment used in the field operations.
The Company estimates asset retirement obligations pursuant to the provisions of FASB ASC Topic 410, “Asset Retirement and Environmental Obligations.” The income valuation technique is utilized by the Company to determine the fair value of the liability at the point of inception by taking into account (1) the cost of abandoning oil and gas wells, which is based on the Company’s historical experience for similar work, or estimates from independent third-parties; (2) the economic lives of its properties, which is based on estimates from reserve engineers; (3) the inflation rate; and (4) the credit adjusted risk-free rate, which takes into account the Company’s credit risk and the time value of money. Given the unobservable nature of the inputs, the initial measurement of the asset retirement obligation liability is deemed to use Level 3 inputs. The fair value of the liability is capitalized as part of the related asset and is then depleted over the life of the asset. The liability is periodically adjusted to reflect (1) new liabilities incurred; (2) liabilities settled during the period; (3) accretion expense and (4) revisions to estimated future cash flow requirements. For the years ended December 31, 2011, 2010 and 2009, an expense of $174, $142, and $131, respectively, was recorded as accretion expense on the liability and included in production costs on the consolidated statement of operations.
Credit facility
The recorded value of the Company’s credit facility approximates fair value as it bears interest at a floating rate.
Impairment of Long-Lived Assets
The long-lived assets of the Company consist primarily of proved oil and gas properties and undeveloped leaseholds. The Company reviews the carrying values of its oil and gas properties and undeveloped leaseholds annually or whenever events or changes in circumstances indicate that such carrying values may not be recoverable. If, upon review, the sum of the undiscounted pretax cash flows is less than the carrying value of the asset group, the carrying value is written down to estimated fair value. Individual assets are grouped for impairment purposes at the lowest level for which there are identifiable cash flows that are largely independent of the cash flows of other groups of assets, generally on a field-by-field basis. The fair value of impaired assets is determined based on quoted market prices in active markets, if available, or upon the present values of expected future cash flows. The impairment analysis performed by the Company may utilize Level 3 inputs.
The Company recorded proved property impairment expense of $0, $1,103, and $0 for the years ended December 31, 2011, 2010 and 2009, respectively. The impairment expense in 2010 related to a write-off of the capital costs associated with the Waltman 34-24 well. The Company recognized a non-cash charge on undeveloped leaseholds during the years ended December 31, 2011, 2010 and 2009 of $187, $480, and $417, respectively.
F-9
Table of Contents
The Company’s pipeline facilities are recorded at cost, which totaled $5,482 as of December 31, 2011. Depreciation is recorded using the straight-line method over a 25 year estimated useful life, and totaled $219 for the year ended December 31, 2011. The useful life may be limited to the useful life of current and future recoverable reserves serviced by the pipeline. The Company evaluated the expected useful life of the pipeline assets as of December 31, 2011, and determined that the assets are expected to be utilized for at least the estimated useful life used in the depreciation calculation.
Corporate and Other Assets
Office facilities, equipment and vehicles are recorded at cost. Depreciation is recorded using the straight-line method over the estimated useful lives of 10 to 40 years for office facilities, 3 to 10 years for office equipment, and 7 years for vehicles. Depreciation expense for the years ended December 31, 2011, 2010 and 2009 was $186, $195, and $206, respectively.
Major Customers
The Company had sales to one major unaffiliated customer for years ended December 31, 2011, 2010, and 2009, totaling $35,032, $29,228 and $41,149, respectively. No other single customer accounted for 10% or more of revenues in 2011, 2010, and 2009. Although a substantial portion of the Company’s production is purchased by one customer, the Company does not believe the loss of this customer would have a material adverse effect on the Company’s business as there are other gas marketers in the area.
Industry Segment and Geographic Information
The Company operates in one industry segment, which is the exploration, development, production and sale of natural gas and oil. All of the Company’s operations are conducted in the continental United States. Consequently, the Company currently reports as a single industry segment. The Company’s transportation and gathering subsidiary provides services exclusively for its gas marketing company and all of the revenue generated by this subsidiary is related to volumes produced from the Catalina Unit. Segmentation of such net income would not provide a better understanding of the Company’s performance, and is not viewed by management as a discrete reporting segment. However, gross revenue and expense related to the transportation and gathering subsidiary are presented as separate line items in the accompanying consolidated statement of operations.
Employee Benefit Plan
The Company maintains a Simplified Employee Pension Plan covering substantially all employees meeting minimum eligibility requirements. Employer contributions are determined solely at management’s discretion. Employer contributions for years ended 2011, 2010, and 2009 were $221, $208, and $183, respectively.
Income Taxes
Income taxes are accounted for under the asset and liability method. Deferred tax assets or liabilities are recorded based on the difference between the tax basis of an asset or liability and its carrying amount in the financial statements. This difference will result in taxable income or deduction in future periods when the reported amount of the asset or liability is recovered or settled, respectively.
Earnings per Share
Basic earnings per share (“EPS”) is calculated by dividing net income (loss) attributable to common stock by the weighted average number of shares of common stock outstanding during the period. Diluted earnings per share incorporates the treasury stock method to measure the dilutive impact of potential common stock equivalents by including the effect of outstanding vested and unvested stock options and unvested stock awards in the average number of common shares outstanding during the period.
F-10
Table of Contents
The following table shows the calculation of basic and diluted weighted average shares outstanding and EPS for the periods indicated:
| For the year ended December 31, | ||||||||||||
| 2011 | 2010 | 2009 | ||||||||||
| Net income |
$ | 11,687 | $ | 5,503 | $ | 1,209 | ||||||
| Preferred stock dividends |
(3,723 | ) | (3,723 | ) | (3,723 | ) | ||||||
|
|
|
|
|
|
|
|||||||
| Income (loss) attributable to common stock |
$ | 7,964 | $ | 1,780 | $ | (2,514 | ) | |||||
|
|
|
|
|
|
|
|||||||
| Weighted average shares: |
||||||||||||
| Weighted average shares—basic |
11,191,496 | 11,123,131 | 9,955,582 | |||||||||
| Dilutive effect of stock options outstanding at the end of period |
19,108 | — | — | |||||||||
|
|
|
|
|
|
|
|||||||
| Weighted average shares—fully diluted |
11,210,604 | 11,123,131 | 9,955,582 | |||||||||
|
|
|
|
|
|
|
|||||||
| Earnings (loss) per share: |
||||||||||||
| Basic |
$ | 0.71 | $ | 0.16 | $ | (0.25 | ) | |||||
|
|
|
|
|
|
|
|||||||
| Diluted |
$ | 0.71 | $ | 0.16 | $ | (0.25 | ) | |||||
|
|
|
|
|
|
|
|||||||
The following options and stock awards that could be potentially dilutive in future periods were not included in the computation of diluted net income (loss) per share because the effect would have been anti-dilutive for the periods indicated:
| For the years ended December 31, | ||||||||||||
| 2011 | 2010 | 2009 | ||||||||||
| Potential common shares |
48,724 | 68,647 | 84,177 | |||||||||
|
|
|
|
|
|
|
|||||||
Stock-Based Compensation
The Company measures and recognizes compensation expense for all stock-based payment awards (including stock options and stock awards) made to employees and directors based on estimated fair value. Compensation expense for equity-classified awards is measured at the grant date based on the fair value of the award and is recognized as an expense in earnings over the requisite service period using a graded vesting method. Certain awards contain a performance condition, which is taken into account in estimating fair value.
Fair Value of Financial Instruments
The Company’s financial instruments including cash and cash equivalents, accounts receivable and accounts payable are carried at a cost, which approximates fair value due to the short-term maturity of these instruments. The recorded value of the Company’s credit facility approximates its fair value as it bears interest at a floating rate. The Company accounts for certain derivative contracts as cash flow hedges, with the effective portion of gains and losses related to the changes in the fair value recorded in accumulated other comprehensive income, a component of Stockholder’s equity. The Company also marks to market other derivative instruments not accounted for as cash flow hedges, with the change in fair values recorded within price risk management on the consolidated statement of operations. See Notes 4 and 5.
Derivative Financial Instruments
The Company uses derivative instruments, primarily forwards, swaps, and collars, to hedge risk associated with fluctuating commodity prices. Derivatives are recorded at fair value and included in the consolidated balance sheets as assets or liabilities and are accounted for as either cash flow hedges or mark to market derivative instruments.
In order to qualify as a cash flow hedge, the instrument must be designated as such at the inception of the contract and the changes in fair value must be highly correlated with the changes in sales prices received for our production volumes. The Company is required to formally document the hedging relationship and the risk management objective and strategy for undertaking the hedge. For derivative instruments designated as cash flow hedges, changes in fair value are recognized in accumulated other comprehensive income (“AOCI”) until the contract settles and is recognized in price risk management activities, net on the consolidated statement of operations.
F-11
Table of Contents
The Company also utilizes financial derivative instruments that have not been designated as cash flow hedges, but still protect the Company from changes in commodity prices. These instruments are marked to market with the resulting changes in fair value recorded in earnings. See Notes 4, 5 and 7 for additional discussion of derivative activities.
Other Comprehensive Income
Comprehensive income (loss) consists of net income (loss) and changes to the Company’s derivative instruments that are treated as cash flow hedges, including realized and unrealized gains and losses that result from changes to the fair value of these instruments, net of tax.
Accumulated other comprehensive income (“AOCI”) is reported as a separate component of stockholders’ equity and is made up of the change in the fair market value of cash flow hedges, net of tax. The Company’s AOCI related to cash flow hedges at December 31, 2011 was $0, as all of the Company’s cash flow hedges settled in 2011.
Recently Issued Accounting Pronouncements
In May 2011, the Financial Accounting Standards Board (“FASB”) issued Accounting Standards Update No. 2011-04 (“ASC 2011-04”), an update to ASC Topic 820, Fair Value Measurements and Disclosures. This update amends current guidance to achieve common fair value measurement and disclosure requirements in U.S. GAAP and International Financial Reporting Standards. The update also includes instances where a particular principle or requirement for measuring fair value or disclosing information about fair value measurements has changed. ASC Update 2011-04 is effective for interim and annual periods beginning after December 15, 2011. The adoption of ASC Update 2011-04 is not expected to have a material impact on the Company’s financial position, results of operations or cash flows.
In June 2011, the FASB issued Accounting Standards Update No. 2011-05 (“ASC No. 2011-05”), an update to ASC Topic 220, Comprehensive Income. The update amends current guidance to require companies to present total comprehensive income either in a single, continuous statement of comprehensive income or in two separate, but consecutive, statements. Under the single-statement approach, entities must include the components of net income, a total for net income, the components of other comprehensive income (“OCI”) and a total for comprehensive income. Under the two-statement approach, entities must report an income statement and, immediately following, a statement of OCI. ASC Update 2011-05 is effective for interim and annual periods beginning after December 15, 2011. The adoption of ASC Update 2011-05 will affect the Company’s financial statement presentation only, and will have no impact on the Company’s financial position, results of operations or cash flows.
In December 2011, the FASB issued Accounting Standards Update No. 2011-12 (“ASC No. 2011-12”), a deferral to one of the requirements of ASC No. 2011-05. ASC No. 2011-12 defers the specific requirement to present items that are reclassified from AOCI to net income separately with their respective components of net income and OCI. This requirement has been deferred indefinitely at this time.
2. Credit Facility
At December 31, 2011, the Company had a $150 million revolving line of credit in place with $60 million available for borrowing based on several factors, including the current borrowing base and the commitment levels by participating banks. The credit facility is collateralized by the Company’s oil and gas producing properties. Any balance outstanding on the credit facility is due October 24, 2016.
As of December 31, 2011, the balance outstanding of $42,000 on the credit facility has been used to fund the development of the Catalina Unit and other non-operated projects in the Atlantic Rim, as well as projects in the Pinedale Anticline.
Borrowings under the revolving line of credit bear interest at a daily rate equal to the greater of (a) the Federal Funds rate, plus 0.5%, the Prime Rate or the Eurodollar Rate plus 1%, plus (b) a margin ranging between 0.75% and 1.75% depending on the level of funds borrowed. As of December 31, 2011, the average interest rate on the outstanding debt was 3.05%. For the years ended December 31, 2011, 2010 and 2009, the Company incurred interest expense on the credit facility of $1,070, $1,510, and $1,778, respectively. Of the total interest incurred, the Company capitalized interest costs of $155, $192 and $485 for the years ended December 31, 2011, 2010 and 2009, respectively.
F-12
Table of Contents
The Company has a $30 million fixed rate swap contract with a third party in place as an economic hedge against the floating interest rate on its credit facility. Under the hedge contract terms, the Company locked in the Eurodollar LIBOR portion of the interest calculation at approximately 0.578% for this tranche of its outstanding debt, which based on the Company’s current level of outstanding debt, translates to an interest rate on this tranche of approximately 3.08%. The contract is effective through December 31, 2012.
Under the credit facility, the Company is subject to both financial and non-financial covenants. The financial covenants, as defined in the credit agreement, include maintaining (i) a current ratio of 1.0 to 1.0; (ii) a ratio of earnings before interest, taxes, depreciation, depletion, amortization, exploration and other non-cash items ("EBITDAX") to interest plus dividends, of greater than 1.5 to 1.0; and (iii) a funded debt to EBITDAX ratio of less than 3.5 to 1.0. As of December 31, 2011, the Company was in compliance with all financial and non-financial covenants. If the covenants are violated and the Company is unable to negotiate a waiver or amendment thereof, the lenders would have the right to declare an event of default, terminate the remaining commitment and accelerate all principal and interest outstanding.
3. Asset Retirement Obligation
The following table reflects a reconciliation of the Company’s asset retirement obligation liability:
| For the year ended December 31, | ||||||||
| 2011 | 2010 | |||||||
| Beginning asset retirement obligation |
$ | 5,848 | $ | 4,807 | ||||
| Liabilities incurred |
574 | 24 | ||||||
| Liabilities settled |
— | (164 | ) | |||||
| Accretion expense |
174 | 142 | ||||||
| Changes in ownership interest |
— | 1,041 | ||||||
| Revision to estimated cash flows |
(296 | ) | (2 | ) | ||||
|
|
|
|
|
|||||
| Ending asset retirement obligation |
$ | 6,300 | $ | 5,848 | ||||
|
|
|
|
|
|||||
4. Commitments and Contingencies
Derivative Instruments
To partially mitigate the Company’s exposure to adverse fluctuations in the prices of natural gas, the Company has entered into various derivative contracts. The terms of the Company’s derivative instruments outstanding at December 31, 2011 are summarized as follows (volume and daily production are expressed in Mcf):
| Remaining | ||||||||||||||||||||
| Contractual | Daily | Price | ||||||||||||||||||
| Type of Contract |
Volume | Production | Term | Price | Index (1) | |||||||||||||||
| Fixed Price Swap |
1,830,000 | 5,000 | 01/12-12/12 | $ | 5.10 | NYMEX | ||||||||||||||
| Fixed Price Swap |
3,660,000 | 10,000 | 01/12-12/12 | $ | 5.05 | NYMEX | ||||||||||||||
| Fixed Price Swap |
2,190,000 | 6,000 | 01/13-12/13 | $ | 5.16 | NYMEX | ||||||||||||||
| Costless Collar |
2,190,000 | 6,000 | 01/13-12/13 | $ | 5.00 floor | NYMEX | ||||||||||||||
| $ | 5.35 ceiling | |||||||||||||||||||
|
|
|
|||||||||||||||||||
| Total |
9,870,000 | |||||||||||||||||||
|
|
|
|||||||||||||||||||
| (1) | NYMEX refers to quoted prices on the New York Mercantile Exchange. |
F-13
Table of Contents
The Company also has a $30 million fixed rate swap contract with a third party in place as a hedge against the floating interest rate on its credit facility. Under the hedge contract terms, the Company locked in the Eurodollar LIBOR portion of the interest calculation at approximately 0.578% for this tranche of its outstanding debt, which based on the Company’s current level of outstanding debt, translates to an interest rate on this tranche of approximately 3.08%. The contract is effective through December 31, 2012.
Operating Lease Commitments
The Company has entered into an operating lease through August 2015 for approximately 7,470 square feet of office space in Denver, Colorado. The Company also maintains operating leases on certain compressor equipment in the Catalina Unit and various pieces of office equipment in both the Casper and Denver offices. The total annual minimum lease payments for the next five years and thereafter are:
| Lease | ||||
| Year ending December 31, |
Commitments | |||
| 2012 |
2,683 | |||
| 2013 |
1,535 | |||
| 2014 |
130 | |||
| 2015 and thereafter |
91 | |||
|
|
|
|||
| Total |
$ | 4,439 | ||
|
|
|
|||
Total expense from operating leases totaled $2,049, $1,935 and $2,575 in 2011, 2010, and 2009, respectively.
Capital Lease Commitments
During 2011, the Company had leased certain compressor equipment in the Catalina Unit under a noncancelable, 36-month term lease agreement that was accounted for as a capital lease. The lease expired in the fourth quarter of 2011. The property under capital lease at December 31, 2011 and 2010, totaled $0 and $1,600, respectively and is included in the developed properties line on the consolidated balance sheets. Related accumulated depreciation was approximately $0 and $1,067 at December 31, 2011 and 2010, respectively. The amortization of the capital lease balance is recorded within DD&A expense on the consolidated statement of operations.
Litigation and Contingencies
From time to time, the Company is involved in various legal proceedings, including the matters discussed below. These proceedings are subject to the uncertainties inherent in any litigation. The Company is defending itself vigorously in all such matters, and while the ultimate outcome and impact of any proceeding cannot be predicted with certainty, management believes that the resolution of any proceeding will not have a material adverse effect on the Company’s financial condition or results of operations.
On December 18, 2009, Tiberius Capital, LLC ("Plaintiff"), a stockholder of Petrosearch prior to the Company's acquisition (the “Acquisition”) of Petrosearch pursuant to a merger between Petrosearch and a wholly-owned subsidiary of the Company, filed a claim in the District Court for the Southern District of New York against Petrosearch, the Company, and the individuals who were officers and directors of Petrosearch prior to the Acquisition. In general, the claims against the Company and Petrosearch are that Petrosearch inappropriately denied dissenters' rights of appraisal under the Nevada Revised Statutes to its stockholders in connection with the Acquisition, that the defendants violated various sections of the Securities Act of 1933 and the Securities Exchange Act of 1934, and that the defendants caused other damages to the stockholders of Petrosearch. The plaintiff was seeking monetary damages. On March 31, 2011, the District Court judge dismissed the case. The plaintiff filed a notice of appeal on April 29, 2011 and filed its appellate brief with the Second Circuit Court of Appeals on August 11, 2011. The Company filed its brief on October 13, 2011 supporting the District Court's March 31, 2011 opinion and judgment dismissing the case.
F-14
Table of Contents
5. Derivative Instruments
Commodity Contracts
The Company’s primary market exposure is to adverse fluctuations in the prices of natural gas. The Company uses derivative instruments, primarily forward contracts, costless collars and swaps, to manage the price risk associated with its gas production, and the resulting impact on cash flow, net income, and earnings per share. The Company does not use derivative instruments for speculative purposes.
The extent of the Company’s risk management activities is controlled through policies and procedures that involve senior management and were approved by the Company’s Board of Directors. Senior management is responsible for proposing hedging recommendations, execution of the approved hedging plan, oversight of the risk management process including methodologies used for valuation and risk measurement and presenting policy changes to the Board. The Company’s Board of Directors is responsible for approving risk management policies and for establishing the Company’s overall risk tolerance levels. The duration of the various derivative instruments depends on senior management’s view of market conditions, available contract prices and the Company’s operating strategy. Under the Company’s credit agreement, the Company can hedge up to 90% of the projected proved developed producing reserves for the next 12 month period, and up to 80% of the projected proved producing reserves for the ensuing 24 month period.
The Company recognizes its derivative instruments as either assets or liabilities at fair value on its consolidated balance sheets, and accounts for the derivative instruments as either cash flow hedges or mark to market derivative instruments. On the statements of cash flow, the cash flows from these instruments are classified as operating activities.
Derivative instruments expose the Company to counterparty credit risk. The Company enters into these contracts with third parties and financial institutions that it considers to be creditworthy. In addition, the Company’s master netting agreements reduce credit risk by permitting the Company to net settle for transactions with the same counterparty.
As with most derivative instruments, the Company’s derivative contracts contain provisions which may allow for another party to require security from the counterparty to ensure performance under the contract. The security may be in the form of, but not limited to, a letter of credit, security interest or a performance bond. The Company was in an overall asset position with each of its counterparties at December 31, 2011, and no party in any of its derivative contracts has required any form of security guarantee.
Cash Flow Hedges
During 2011, the Company had one contract that was designated and qualified as a cash flow hedge. This contract had settled at December 31, 2011 and the Company had no more cash flow hedges in place. Cash flow hedges are recorded at fair value on the consolidated balance sheets and the effective portion of the change in fair value is reported as a component of AOCI and is subsequently reclassified into the oil and gas sales on the consolidated statement of operations as the contracts settle. In order to qualify as cash flow hedges, the instruments must be designated as such at the inception of the contract and the changes in fair value must be highly correlated with the changes in price of our equity production. The Company formally documents the relationship between the derivative instruments and the hedged production, as well as the Company’s risk management objective and strategy for the particular derivative contracts. This process includes linking all derivatives that are designated as cash flow hedges to the specific forecasted sale of gas at its physical location as well as routinely evaluating the effectiveness of the cash flow hedges. The Company seeks to minimize the ineffectiveness of the cash flow hedges by entering into contracts indexed to regional index prices associated with pipelines in proximity to the Company’s areas of production. As the Company’s cash flow hedges contain the same index as the Company’s sales contracts; this results in hedges that are highly correlated with the underlying hedged item
Mark-To-Market Hedging Instruments
Unrealized gains and losses resulting from derivatives not designated as cash flow hedges are recorded at fair value on the consolidated balance sheets and changes in fair value are recognized in price risk management activities, net on the consolidated statements of operations. Realized gains and losses resulting from the contract settlement of derivatives not designated as cash flow hedges also are recorded within price risk management activities, net in the consolidated statement of operations.
The Company had 9,870 MMcf hedged under derivative contracts as of December 31, 2011. Refer to Note 4 for a detailed breakout of the contracts.
F-15
Table of Contents
Interest Rate Swap
In July 2011, the Company entered into a $30 million fixed rate swap contract with a third party to manage the risk associated with the floating interest rate on its credit facility. The contract is effective through December 31, 2012. In accordance with its credit facility, the Company pays interest amounts based upon the Eurodollar LIBOR rate, plus 1%, and plus a spread ranging from 1.25% to 2.0% depending on its outstanding borrowings. Under the interest rate swap terms, the Company swapped its floating LIBOR interest rate for a fixed LIBOR rate of 0.578%. This contract was not designated as a fair value hedge or cash flow hedge and is recorded at fair value on the consolidated balance sheets. Changes in fair value, both realized and unrealized, are recognized in interest expense, net on the consolidated statements of operations. On the statements of cash flows, the cash flows from the interest rate swap are classified as operating activities.
The table below contains a summary of all the Company’s derivative positions reported on the consolidated balance sheet as of December 31, 2011, presented gross of any master netting arrangements:
| Derivatives not designated as | ||||||
| hedging instruments under ASC 815 |
Balance Sheet Location |
Fair Value | ||||
| Assets |
||||||
| Commodity derivatives |
Assets from price risk management - current | $ | 10,022 | |||
| Assets from price risk management - long term | 4,812 | |||||
| Interest rate swap |
Other current liabilities | (47 | ) | |||
|
|
|
|||||
| Total |
$ | 14,787 | ||||
|
|
|
|||||
The before-tax effect of derivative instruments in cash flow hedging relationships on the consolidated statement of operations for the years ended December 31, 2011, 2010 and 2009 was as follows:
Derivatives Designated as Cash Flow Hedging Instruments under ASC 815
| Amount of Gain (Loss) Recognized in OCI | ||||||||||||
| on Derivatives for theYear Ended December 31, | ||||||||||||
| 2011 | 2010 | 2009 | ||||||||||
| Commodity contracts |
$ | 997 | $ | 5,038 | $ | 2,616 | ||||||
| Location of Gain Reclassified | ||||||||||||
| from AOCI into | Amount of Gain Reclassified from | |||||||||||
| Income (effective portion) |
for the Year Ended December 31, | |||||||||||
| 2011 | 2010 | 2009 | ||||||||||
| Oil and gas sales |
$ | 9,592 | $ | — | $ | 15,740 | ||||||
| Year Ended December 31, | ||||||||||||
| 2011 | 2010 | 2009 | ||||||||||
| Location of Gain Recognized in Income (Ineffective) Portionand Amount Excluded from Effectiveness Testing |
$ | — | $ | — | $ | — | ||||||
F-16
Table of Contents
The before-tax effect of derivative instruments not designated as hedging instruments on the consolidated statement of operations for the years ended December 31, 2011, 2010 and 2009 was as follows:
| Amount of Gain Recognized in Income on | ||||||||||||
| Year Ended December 31, | ||||||||||||
| 2011 | 2010 | 2009 | ||||||||||
| Unrealized gain on commodity contracts 2 |
$ | 13,807 | $ | 6,196 | $ | (7,798 | ) | |||||
| Realized gain on commondity contracts 2 |
933 | 5,316 | 3,503 | |||||||||
| Unrealized loss on interest rate swap 3 |
(47 | ) | — | — | ||||||||
| Realized loss on interest rate swap 3 |
(52 | ) | — | — | ||||||||
|
|
|
|
|
|
|
|||||||
| Total activity for derivatives not designated as hedging instruments |
$ | 14,641 | $ | 11,512 | $ | (4,295 | ) | |||||
|
|
|
|
|
|
|
|||||||
| 2 | Included in price risk management activities, net on the consolidated statements of operations. Price risk management activities totaled $14,740, $11,512 and $(4,295), for the years ended December 31, 2011, 2010, and 2009, respectively. |
| 3 | Included in interest expense, net on the statements of operations. |
Refer to Note 7 for additional information regarding the valuation of the Company’s derivative instruments, Note 4 for the listing of the current contracts the Company had in place as of December 31, 2011.
6. Income Taxes
The provision for income taxes consists of:
| For the year ended December 31, | ||||||||||||
| 2011 | 2010 | 2009 | ||||||||||
| Current taxes |
$ | — | $ | — | $ | — | ||||||
| Deferred taxes |
6,762 | 3,224 | 902 | |||||||||
|
|
|
|
|
|
|
|||||||
| Total income tax expense |
$ | 6,762 | $ | 3,224 | $ | 902 | ||||||
|
|
|
|
|
|
|
|||||||
Included in the change in the net deferred tax liability from December 31, 2010 to December 31, 2011 of $3,735 was a deferred tax liability totaling $3,027 relating to the unrealized hedging gains recorded for book purposes. This temporary difference was recorded as a deferred tax liability and the offsetting entry was recorded in OCI.
F-17
Table of Contents
The tax effects of temporary differences that gave rise to the deferred tax liabilities and deferred tax assets as of December 31, 2011and 2010 were:
| As of December 31, | ||||||||
| 2011 | 2010 | |||||||
| Deferred tax assets: |
||||||||
| Net operating loss carry-forward |
$ | 15,647 | $ | 11,607 | ||||
| Asset retirement obligation |
2,226 | 2,059 | ||||||
| Stock-based compensation |
611 | 458 | ||||||
| Accrued compensation |
73 | 22 | ||||||
| Net gas imbalance |
135 | 146 | ||||||
| Other |
53 | 43 | ||||||
|
|
|
|
|
|||||
| 18,745 | 14,335 | |||||||
|
|
|
|
|
|||||
| Deferred tax liabilities: |
||||||||
| Derivative instruments |
(5,243 | ) | (3,389 | ) | ||||
| Net basis difference in oil and gas properties |
(26,815 | ) | (20,524 | ) | ||||
|
|
|
|
|
|||||
| Net deferred tax liability |
$ | (13,313 | ) | $ | (9,578 | ) | ||
|
|
|
|
|
|||||
In assessing the realizability of the deferred tax assets, management considers whether it is more likely than not that some or all of the deferred tax assets will not be realized. The ultimate realization of the deferred tax assets is dependent upon the generation of future taxable income during the periods in which the use of such net operating losses are allowed. Among other items, management considers the scheduled reversal of deferred tax liabilities, tax planning strategies and projected future taxable income.
At December 31, 2011, the Company had a net operating loss carry forward for regular income tax reporting purposes of approximately $44.2 million, which will begin expiring in 2021.
The following table shows the reconciliation of the Company’s effective tax rate to the expected federal tax rate for the years ended December 31, 2011 and 2010:
| For the year ended December 31, | ||||||||
| 2011 | 2010 | |||||||
| Expected federal tax rate |
35.00 | % | 35.00 | % | ||||
| Effect of permanent differences |
0.82 | % | 1.40 | % | ||||
| State tax rate |
0.34 | % | 0.22 | % | ||||
| Other |
0.50 | % | 0.33 | % | ||||
|
|
|
|
|
|||||
| Effective tax rate |
36.66 | % | 36.95 | % | ||||
|
|
|
|
|
|||||
ASC 740 guidance requires that the Company evaluate all monetary tax positions taken, and recognize a liability for any uncertain tax positions that are not more likely than not to be sustained by the tax authorities. The Company has not recorded any liabilities, or interest and penalties, as of December 31, 2011 related to uncertain tax positions.
The Company files income tax returns in the U.S. and various state jurisdictions. There are currently no federal or state income tax examinations underway for these jurisdictions. Furthermore, the Company is no longer subject to U.S. federal income tax examinations by the Internal Revenue Service for tax years before 2008 and for state and local tax authorities for years before 2007.
F-18
Table of Contents
7. Fair Value Measurements
The Company records certain of its assets and liabilities on the balance sheet at fair value. Fair value is defined as the price that would be received to sell an asset or paid to transfer a liability in an orderly transaction between market participants at the measurement date (exit price). A three-level valuation hierarchy has been established to allow readers to understand the transparency of inputs to the valuation of an asset or liability as of the measurement date. The three levels are defined as follows:
| • | Level 1 - | Quoted prices (unadjusted) for identical assets or liabilities in active markets. | ||
| • | Level 2 - | Quoted prices for similar assets or liabilities in active markets; quoted prices for identical or similar assets or liabilities in markets that are not active; and model-derived valuations whose inputs or significant value drivers are observable. | ||
| • | Level 3 - | Unobservable inputs that reflect the Company’s own assumptions | ||
The Company determines its estimate of the fair value of derivative instruments using a market approach based on several factors, including quoted market prices in active markets, quotes from third parties, the credit rating of each counterparty, and the Company’s own credit rating. The Company also performs an internal valuation to ensure the reasonableness of third party quotes.
In consideration of counterparty credit risk, the Company assessed the possibility of whether each counterparty to the derivative would default by failing to make any contractually required payments. Additionally, the Company considers that it is of substantial credit quality and has the financial resources and willingness to meet its potential repayment obligations associated with the derivative transactions.
At December 31, 2011, the Company had various types of derivative instruments utilized by the Company, which included costless collars and swaps. The natural gas derivative markets and interest rate swap markets are highly active. Although the Company’s cash flow and economic hedges are valued using public indices, the instruments themselves are traded with third party counterparties and are not openly traded on an exchange. As such, the Company has classified these instruments as Level 2.
The following table provides a summary of the fair values of assets and liabilities measured at fair value at December 31, 2011:
| Level 1 | Level 2 | Level 3 | Total | |||||||||||||
| Assets |
||||||||||||||||
| Derivative instruments - Commodity forward contracts |
$ | — | $ | 14,834 | $ | — | $ | 14,834 | ||||||||
|
|
|
|
|
|
|
|
|
|||||||||
| Total assets at fair value |
$ | — | $ | 14,834 | $ | — | $ | 14,834 | ||||||||
|
|
|
|
|
|
|
|
|
|||||||||
| Liabilities |
||||||||||||||||
| Derivative instruments - Interest rate swap |
$ | 47 | $ | — | $ | 47 | ||||||||||
|
|
|
|
|
|
|
|
|
|||||||||
| Total liabilities at fair value |
$ | — | $ | 47 | $ | — | $ | 47 | ||||||||
|
|
|
|
|
|
|
|
|
|||||||||
The Company did not have any transfers of assets or liabilities between Level 1, Level 2 or Level 3 of the fair value measurement hierarchy during the year ended December 31, 2011.
F-19
Table of Contents
8. Preferred Stock and Stockholder’s Equity
In 2007, the stockholders of the Company approved an amendment to the Company’s Articles of Incorporation to provide for the issuance of 10,000,000 shares of preferred stock, and the Company subsequently completed a public offering of 1,610,000 shares of 9.25% Series A Cumulative Preferred Stock at a price of $25.00 per share.
Holders of the Series A Preferred Stock are entitled to receive, when and as declared by the Board of Directors, dividends at a rate of 9.25% per annum ($2.3125 per annum per share). The Series A Preferred Stock does not have any stated maturity date and will not be subject to any sinking fund or mandatory redemption provisions, except, under certain circumstances upon a change of ownership or control. Except pursuant to the special redemption upon a change of ownership or control, the Company may not redeem the Series A Preferred Stock prior to June 30, 2012. On or after June 30, 2012, the Company may redeem the Series A Preferred Stock for cash at its option, in whole or from time to time in part, at a redemption price of $25.00 per share, plus accrued and unpaid dividends (whether or not earned or declared) to the redemption date. The shares of Series A Preferred Stock are classified outside of permanent equity on the consolidated balance sheets due to the following change of control redemption provision. Following a change of ownership or control of the Company by a person or entity, other than by a “Qualifying Public Company,” the Company will be required to redeem the Series A Preferred Stock within 90 days after the date on which the change of ownership or control occurred for cash. In the event of liquidation, the holders of the Series A Preferred Stock will have the right to receive $25.00 per share, plus all accrued and unpaid dividends, before any payments are made to the holders of the Company’s common stock.
Holders of the Series A Preferred Stock generally have no voting rights. However, if cash dividends on any outstanding Series A Preferred Stock are in arrears for any six consecutive or non-consecutive quarterly dividend periods, or if the Company fails to maintain a national market listing, the holders of the Series A Preferred Stock, voting separately as a class, will have the right to elect two directors to serve on the Company’s Board of Directors in addition to those directors then serving on the Board until such time as the national market listing is obtained or the dividend arrearage is eliminated.
Shareholder Rights Plan
In 2007, the Board of Directors of the Company adopted a Shareholder Rights Plan (“Rights Plan”). The Company could issue the rights that would become exercisable by all rights holders, except the acquiring person or group, for shares of the Company’s common stock having a value of twice the right’s then-current exercise price.
The Rights Plan entitles stockholders to purchase a fractional share of the Company’s Series B Junior Participating Preferred Stock at an exercise price of $45. If a person or group acquires, or announces a tender or exchange offer that would result in the acquisition of 20% or more of the Company’s common stock while the Rights Plan was effective, then, the Company could issue the rights that would become exercisable by all rights holders, except the acquiring person or group, for shares of the Company’s common stock having a value of twice the right’s then-current exercise price. The Rights Plan adopted in 2007 expired in 2010 but remains available to the Board of Directors to reinstate.
There are 75,000 shares of the Company’s Series B Junior Participating Preferred Stock, par value $.10, authorized with no shares outstanding at December 31, 2011.
ATM Offering
In August 2011, the Company entered into an at market issuance sales agreement (“ATM”), which allows the Company to offer and sell shares of its common stock from time to time at an aggregate offering price of up to $20 million. The Company’s sales agent may make sales of the Company’s common stock in privately negotiated transactions or in any method permitted by law deemed to be an ATM offering as defined in Rule 415 promulgated under the Securities Act of 1933, as amended, at negotiated prices, at prices prevailing at the time of sale or at prices related to such prevailing market prices, including sales made directly on the NASDAQ Global Select Market or sales made through a market maker other than on an exchange. The Company’s sales agent will make all sales using commercially reasonable efforts consistent with its normal sales and trading practices. The Company has no obligation to sell any shares in the ATM offering and may terminate the ATM offering at any time. No shares were sold in 2011. The ATM agreement expires in May 2012.
F-20
Table of Contents
9. Compensation Plans
The Company has outstanding stock options issued to employees under various stock option plans, approved by the Company’s stockholders (collectively “the Plans”). The options have been granted with an exercise price equal to the market price of the Company’s common stock on the date of grant, vest annually over various periods from two to five years of continuous service, and expire over various periods up to ten years from the date of grant. As of December 31, 2011, there were 98,000 and 131,157 options available for grant under the 2002 and 2003 Stock Option Plans, respectively.
The Company’s stockholders have also approved the 2007 Stock Incentive Plan (“2007 Plan”) and the 2010 Stock Incentive Plan, (“2010 Plan”) which allow both stock options and stock awards to be granted to the Company’s employees, directors, consultants, and other persons designated by the Compensation Committee of the Board of Directors. In 2008, the Company began granting stock awards and stock options under these plans. These awards vest annually over various periods of up to five years of continuous service. As of December 31, 2011, there were 50,677 and 1,398,764 shares available for grant under the 2007 and 2010 Plans, respectively.
The Company accounts for its stock compensation in accordance with the provisions of ASC 718, which requires the measurement and recognition of compensation expense for all share-based payment awards (including stock options and stock awards) made to employees and directors based on estimated fair value. During the years ended December 31, 2011, 2010 and 2009, total share-based compensation expense for equity-classified awards, was $1,153, $956, and $1,484, respectively, and is reflected in general and administrative expense in the consolidated statements of operations.
Stock Options
The Company uses the Black-Scholes valuation model to determine the fair value of each option award. Expected volatilities are based on the historical volatility of the Company’s common stock over a period consistent with that of the expected terms of the options. The expected terms of the options are estimated based on factors such as vesting periods, contractual expiration dates, historical trends in the Company’s common stock price and historical exercise behavior. The risk-free rates for periods within the contractual life of the options are based on the yields of U.S. Treasury instruments with terms comparable to the estimated option terms.
Assumptions used in estimating fair value of share-based awards for the periods indicated:
| For the year ended December 31, | ||||||
| 2011 | 2010 | 2009 | ||||
| Weighted-average volatility |
61% | 57-60% | 51% | |||
| Expected dividends |
0.00% | 0.00% | 0.00% | |||
| Expected term (in years) |
4.75 | 4-5 | 5 | |||
| Risk-free rate |
2.02% | 1.23%-2.65% | 1.72% | |||
| Expected forfeiture rate |
8.00% | 8-12% | 7.00% | |||
Summary of option activity during the year ended December 31, 2011:
| Weighted- | ||||||||||||||||
| Average | ||||||||||||||||
| Weighted- | Remaining | |||||||||||||||
| Average | Contractual | Aggregate | ||||||||||||||
| Exercise | Term (in | Intrinsic | ||||||||||||||
| Shares | Price | years) | Value | |||||||||||||
| Options: |
||||||||||||||||
| Outstanding at January 1, 2011 |
556,339 | $ | 12.94 | 4.4 | ||||||||||||
| Granted |
26,659 | $ | 5.10 | |||||||||||||
| Exercised |
(2,540 | ) | $ | 4.58 | ||||||||||||
| Cancelled/expired |
(63,000 | ) | $ | 17.47 | ||||||||||||
|
|
|
|||||||||||||||
| Outstanding at December 31, 2011 |
517,458 | $ | 12.02 | 3.5 | $ | 274 | ||||||||||
|
|
|
|
|
|
|
|
|
|||||||||
| Exercisable at December 31, 2011 |
332,515 | $ | 13.59 | 3.1 | $ | 89 | ||||||||||
|
|
|
|
|
|
|
|
|
|||||||||
F-21
Table of Contents
The weighted average grant date fair value price per share of options granted during the three years ended December 31, 2011, 2010, and 2009 was $5.10, $4.52 and $7.79, respectively. During the year ended December 31, 2011, the total intrinsic value, or the difference between the exercise price and the market price on the date of exercise, of all options exercised was $9. No options were exercised during 2010 or 2009. The Company issues new shares from its reserve upon exercise. As of December 31, 2011, 2010 and 2009, the intrinsic value of options vested and exercisable was $89, $5 and $0, respectively.
Stock options outstanding and currently exercisable at December 31, 2011 were as follows:
| Options | Options Exercisable | |||||||||||||||||||
| Outstanding | ||||||||||||||||||||
| Weighted Average | Weighted | Weighted | ||||||||||||||||||
| Number of | Remaining | Average | Number of | Average | ||||||||||||||||
| Range of Exercise | Options | Contractual Life | Exercise Price | Options | Exercise Price | |||||||||||||||
| Prices per Share |
Outstanding | (in years) | per Share | Exercisable | per Share | |||||||||||||||
| $4.33 - $ 5.10 |
121,998 | 5.2 | $ | 4.65 | 38,447 | $ | 4.59 | |||||||||||||
| $6.78- $ 7.79 |
57,000 | 4.3 | $ | 7.57 | 25,800 | $ | 7.49 | |||||||||||||
| $14.00 - $ 16.31 |
290,960 | 3.0 | $ | 14.78 | 228,768 | $ | 14.75 | |||||||||||||
| $18.41 - $ 23.61 |
47,500 | 0.8 | $ | 19.42 | 39,500 | $ | 19.65 | |||||||||||||
|
|
|
|
|
|||||||||||||||||
| 517,458 | 3.5 | $ | 12.02 | 332,515 | $ | 13.59 | ||||||||||||||
|
|
|
|
|
|||||||||||||||||
As of December 31, 2011, there was $477 of total unrecognized stock-based compensation expense related to stock options to be recognized over a weighted-average period of 1.7 years.
Stock Awards
The Company measures the fair value of the stock awards based upon the fair market value of its common stock on the date of grant and recognize the resulting compensation expense ratably over the associated service period, which is generally the vesting term of the stock awards. The Company recognizes these compensation costs net of a forfeiture rate, if applicable, and recognizes the compensation costs for only those shares expected to vest. The forfeiture rates are based on historical experience, while also considering the duration of the vesting term of the award.
Nonvested stock awards as of December 31, 2011 and changes for the year ended December 31, 2011 were as follows:
| Weighted- | ||||||||
| Average | ||||||||
| Grant Date | ||||||||
| Shares | Fair Value | |||||||
| Stock Awards: |
||||||||
| Outstanding at January 1, 2011 |
83,304 | $ | 8.40 | |||||
| Granted (1) |
525,195 | $ | 6.46 | |||||
| Vested |
(66,377 | ) | $ | 7.88 | ||||
| Forfeited/returned |
— | $ | — | |||||
|
|
|
|||||||
| Nonvested at December 31, 2011 |
542,122 | $ | 6.59 | |||||
|
|
|
|||||||
| (1) | Includes the performance shares discussed below. |
F-22
Table of Contents
As of December 31, 2011, there was $1,694 of unrecognized stock-based compensation expense related to nonvested stock awards. This cost is expected to be recognized over a weighted-average period of 1.8 years. This includes expense of $1,286 related to the Company’s Long Term Incentive Plan (discussed below), based on management’s current estimate of the shares that will vest.
Long-Term Incentive Plan
On September 30, 2011, the Company adopted a Long-Term Incentive Plan (“LTIP”), which operates under the Company’s 2010 Stock Incentive Plan. Under the LTIP, the executive officers of the Company may earn up to an aggregate of 486,657 shares of common stock of the Company. The executive officers may earn one-third of the shares by continued employment with the Company through December 31, 2013. The remaining two-thirds may be earned through increases in the Company’s implied net asset value, as defined. If the Company ultimately achieves the service requirements and performance objectives determined by the LTIP, the associated total share-based compensation expense is expected to be approximately $3.1 million, based on the grant date fair value. In 2011, the Company recognized expense totaling $161 related to the LTIP based on management’s current estimate of the implied net asset value growth. This estimate assumes that only a portion of the performance-based shares will vest.
Warrants
As part of the acquisition of Petrosearch, the Company assumed all outstanding warrants to purchase common stock that had been issued by Petrosearch prior to the merger. The final tranche of such warrants (8,660 warrants with an exercise price of $21.25) expired in December 2011.
10. Purchase of Additional Atlantic Rim Working Interests
In the third quarter of 2010, the Company purchased additional working interests in the Atlantic Rim area of southwestern Wyoming from a third party. The purchase increased the Company’s ownership in one of its existing core development properties. The table below shows the working interests acquired under the terms of the agreement and the Company’s post-transaction total ownership in each of the units within the Atlantic Rim:
| Working Interest Following (1) | ||||||||
| Unit |
Working Interest Acquired | Purchase | ||||||
| Catalina |
3.08 | % | 72.40 | % | ||||
| Sun Dog |
12.57 | % | 21.46 | % (2) | ||||
| Doty Mountain |
1.15 | % | 18.00 | % | ||||
| (1) | The Company’s working interest in the Unit will continue to change as additional wells are drilled and acreage is added to the Unit’s participating area. |
| (2) | Subsequently the Company’s working interest changed to 21.53%. |
The effective date of the transaction was January 1, 2010. The total cost of the asset purchase transaction was $8,417. The total cash paid by the Company was $7,868, net of revenue, expense and capital costs incurred from the effective date through the closing date.
The Company recorded an additional asset retirement obligation in conjunction with the asset acquisition, totaling $1,042.
11. Acquisition of Petrosearch
On August 6, 2009, the Company acquired 100% of the common and preferred shares of Petrosearch in exchange for approximately 1.8 million shares of the Company’s common stock, valued at approximately $7.3 million, and cash consideration of $873, for a total purchase price of approximately $8.1 million. Effective with the acquisition, each Petrosearch shareholder received .0433 shares of Double Eagle common stock and $0.0211 for each share of Petrosearch common stock and Petrosearch preferred stock, on an as converted basis, such shareholder held. As result of the merger, Petrosearch became a wholly-owned subsidiary of the Company. Petrosearch was an independent oil and natural gas exploration and production company, with properties in Texas and Oklahoma. The Company’s results of operations include the effect of the Petrosearch acquisition from the closing date.
F-23
Table of Contents
The aggregate purchase price was calculated as follows:
| Aggregrate value of Double Eagle common stock issued |
$ | 7,260 | ||
| Cash consideration given to Petrosearch shareholders |
873 | |||
|
|
|
|||
| Purchase price |
$ | 8,133 | ||
|
|
|
The acquisition of Petrosearch was accounted for under the purchase method of accounting. Under the purchase method of accounting, the purchase price is allocated to the assets acquired and liabilities assumed based on their estimated fair values. The purchase price was allocated as follows:
| Cash and cash equivalents |
$ | 8,606 | ||
| Accounts receivables, net of allowance |
5 | |||
| Prepaid expense and other current assets |
134 | |||
| Oil and gas properties |
350 | |||
| Goodwill |
56 | |||
| Accounts payable and other current liabilities |
(378 | ) | ||
| Asset retirement obligation |
(640 | ) | ||
|
|
|
|||
| $ | 8,133 | |||
|
|
|
Of the total estimated purchase price, approximately $56 was allocated to goodwill. Goodwill represents the excess of the purchase price of an acquired business over the fair value of the underlying net tangible and intangible assets. Goodwill is not amortized, rather, the goodwill will be tested for impairment, at least annually, or more frequently if there is an indication of impairment. The goodwill resulting from this acquisition was not deductible for tax purposes.
Transaction costs related to the merger totaled $513, and were recorded on the consolidated statement of operations within general and administrative expenses in the 2009 period.
12. Supplemental Information on Oil and Gas Producing Activities
Capitalized Costs Relating to Oil and Gas Producing Activities
The aggregate amount of capitalized costs relating to oil and natural gas producing activities and the aggregate amount of related accumulated depreciation, depletion and amortization at December 31, 2011, 2010, and 2009 are:
| As of December 31, | ||||||||||||
| 2011 | 2010 | 2009 | ||||||||||
| Developed properties |
$ | 209,774 | $ | 188,143 | $ | 165,279 | ||||||
| Wells in progress |
8,182 | 4,039 | 7,544 | |||||||||
| Undeveloped properties |
2,921 | 3,062 | 2,502 | |||||||||
|
|
|
|
|
|
|
|||||||
| 220,877 | 195,244 | 175,325 | ||||||||||
| Accumulated depletion and amortization |
(88,639 | ) | (70,200 | ) | (52,041 | ) | ||||||
|
|
|
|
|
|
|
|||||||
| Net capitalized costs |
$ | 132,238 | $ | 125,044 | $ | 123,284 | ||||||
|
|
|
|
|
|
|
|||||||
F-24
Table of Contents
Costs Incurred in Oil and Gas Property Acquisitions, Exploration and Development Activities
Costs incurred in property acquisitions, exploration, and development activities for the years ended December 31, 2011, 2010 and 2009 were:
| For the year ended December 31, | ||||||||||||
| 2011 | 2010 | 2009 | ||||||||||
| Property acquisitions - unproved |
$ | 266 | $ | 1,043 | $ | 16 | ||||||
| Exploration |
16,311 | 73 | 59 | |||||||||
| Development |
9,203 | 20,402 | 21,466 | |||||||||
|
|
|
|
|
|
|
|||||||
| Total |
$ | 25,780 | $ | 21,518 | $ | 21,541 | ||||||
|
|
|
|
|
|
|
|||||||
Results of Operations from Oil and Gas Producing Activities
The table below shows the results of operations for the Company’s oil and gas producing activities for the years ended December 31, 2011, 2010 and 2009. All production is from within the continental United States.
| For the year ended December 31, | ||||||||||||
| 2011 | 2010 | 2009 | ||||||||||
| Operating revenues (1) |
$ | 45,093 | $ | 38,926 | $ | 45,901 | ||||||
| Costs and expenses: |
||||||||||||
| Production |
15,412 | 14,271 | 11,406 | |||||||||
| Exploration |
273 | 163 | 103 | |||||||||
| Depletion, amortization and impairment |
18,439 | 19,262 | 18,136 | |||||||||
|
|
|
|
|
|
|
|||||||
| Total costs and expenses |
34,124 | 33,696 | 29,645 | |||||||||
|
|
|
|
|
|
|
|||||||
| Income before income taxes |
10,969 | 5,230 | 16,256 | |||||||||
| Income tax expense |
3,863 | 1,842 | 5,693 | |||||||||
|
|
|
|
|
|
|
|||||||
| Results of operations |
$ | 7,106 | $ | 3,388 | $ | 10,563 | ||||||
|
|
|
|
|
|
|
|||||||
| (1) | Operating revenues are comprised of the oil and gas sales from the consolidated statement of operations, plus settlements on the Company’s financial hedges during the period. For the years ended December 31, 2011, 2010 and 2009, the settlements on derivatives totaled $933, $5,316 and $3,503, respectively. |
Oil and Gas Reserves (Unaudited)
The reserves at December 31, 2011, 2010 and 2009 presented below were reviewed by the independent engineering firm, Netherland, Sewell & Associates, Inc. All reserves are located within the continental United States. The reserve estimates are developed using geological and engineering data and interests and burden information developed by the Company. Reserve estimates are inherently imprecise and are continually subject to revisions based on production history, results of additional exploration and development, prices of oil and gas, and other factors.
Estimated net quantities of proved developed reserves of oil and gas for the years ended December 31, 2011, 2010, and 2009 are:
F-25
Table of Contents
| For the year ended December 31, | ||||||||||||||||||||||||
| 2011 | 2010 | 2009 | ||||||||||||||||||||||
| Oil | Gas | Oil | Gas | Oil | Gas | |||||||||||||||||||
| (Bbl) | (Mcf) | (Bbl) | (Mcf) | (Bbl) | (Mcf) | |||||||||||||||||||
| Beginning of year |
381,251 | 112,768,514 | 419,213 | 89,776,670 | 420,189 | 86,330,820 | ||||||||||||||||||
| Revisions of estimates |
2,306 | (834,305 | ) | (48,196 | ) | (66,921 | ) | (42,417 | ) | (9,323,380 | ) | |||||||||||||
| Extensions and discoveries |
94,735 | 31,144,009 | 36,258 | 16,744,470 | 61,932 | 21,931,592 | ||||||||||||||||||
| Purchases of reserves |
— | — | — | 15,317,168 | 8,436 | — | ||||||||||||||||||
| Production |
(28,091 | ) | (9,174,655 | ) | (26,024 | ) | (9,002,873 | ) | (28,927 | ) | (9,162,362 | ) | ||||||||||||
|
|
|
|
|
|
|
|
|
|
|
|
|
|||||||||||||
| End of year |
450,201 | 133,903,563 | 381,251 | 112,768,514 | 419,213 | 89,776,670 | ||||||||||||||||||
|
|
|
|
|
|
|
|
|
|
|
|
|
|||||||||||||
| Proved developed reserves |
245,124 | 80,121,740 | 235,808 | 73,049,048 | 287,276 | 64,195,169 | ||||||||||||||||||
|
|
|
|
|
|
|
|
|
|
|
|
|
|||||||||||||
| Percentage of proved developed reserves |
54 | % | 60 | % | 62 | % | 65 | % | 69 | % | 72 | % | ||||||||||||
|
|
|
|
|
|
|
|
|
|
|
|
|
|||||||||||||
As of December 31, 2011, the Company had estimated proved reserves of 133.9 Bcf of natural gas and 450 MBbl of oil, or a total of 136.6 Bcfe. The proved reserves were estimated in accordance with SEC’s final rules on the Modernization of the Oil and Gas Reporting Requirements for all periods presented.
As of December 31, 2011, 60% of the proved gas reserves and 54% of the proved oil reserves were in producing status.
Standardized Measure of Discounted Future Net Cash Flows Relating to Proved Oil and Gas Reserves (Unaudited)
The following information has been developed utilizing procedures prescribed by ASC 932 Extractive Activities – Oil and Gas, and is based on natural gas and oil reserves and production volumes estimated by the Company. It may be useful for certain comparison purposes, but should not be solely relied upon in evaluating the Company or its performance. Further, information contained in the following table should not be considered as representative or realistic assessments of future cash flows, nor should the Standardized Measure of Discounted Future Net Cash Flows be viewed as representative of the current value of the Company.
The Company believes that the following factors should be taken into account in reviewing the following information: (1) future costs and selling prices will likely differ from those required to be used in these calculations; (2) due to future market conditions and governmental regulations, actual rates of production achieved in future years may vary significantly from the rate of production assumed in these calculations; (3) selection of a 10% discount rate, as required under the accounting codification, is arbitrary and may not be reasonable as a measure of the relative risk inherent in realizing future net oil and gas revenues; and (4) future net revenues may be subject to different rates of income taxation.
Under the Standardized Measure, future cash inflows were estimated by applying the 12-month average pricing of oil and gas relating to the Company’s proved reserves to the year-end quantities of those reserves. Future cash inflows were reduced by estimated future development and production costs based upon year-end costs in order to arrive at net cash flow before tax. Future income tax expense has been computed by applying year-end statutory rates to future pretax net cash flows and the utilization of net operating loss carry-forwards.
Management does not rely solely upon the following information to make investment and operating decisions. Such decisions are based upon a wide range of factors, including estimates of probable, as well as proved reserves, and varying price and cost assumptions considered more representative of a range of possible economic conditions that may be anticipated.
F-26
Table of Contents
Information with respect to the Company’s Standardized Measure is as follows:
| As of December 31, | ||||||||||||
| 2011 | 2010 | 2009 | ||||||||||
| Future cash inflows |
$ | 537,682 | $ | 441,761 | $ | 276,374 | ||||||
| Future production costs |
(199,369 | ) | (153,980 | ) | (105,161 | ) | ||||||
| Future development costs |
(43,569 | ) | (34,218 | ) | (16,777 | ) | ||||||
| Future income taxes |
(64,103 | ) | (50,732 | ) | (14,279 | ) | ||||||
|
|
|
|
|
|
|
|||||||
| Future net cash flows |
230,641 | 202,831 | 140,157 | |||||||||
| 10% annual discount |
(109,964 | ) | (87,887 | ) | (57,450 | ) | ||||||
|
|
|
|
|
|
|
|||||||
| Standardized Measure |
$ | 120,677 | $ | 114,944 | $ | 82,707 | ||||||
|
|
|
|
|
|
|
|||||||
Principal changes in the Standardized Measure for the years ended December 31, 2011, 2010 and 2009 is as follows:
| 2011 | 2010 | 2009 | ||||||||||
| Standard measure, as of January 1, |
$ | 114,944 | $ | 82,707 | $ | 122,055 | ||||||
| Sales of oil and gas produced, net of production costs |
(28,748 | ) | (19,339 | ) | (30,992 | ) | ||||||
| Extensions and discoveries |
28,130 | 22,726 | 22,506 | |||||||||
| Net change in prices and production costs related to future production |
(1,363 | ) | 42,308 | (62,838 | ) | |||||||
| Development costs incurred during the year |
6,014 | 277 | 13,043 | |||||||||
| Changes in estimated future development costs |
(1,145 | ) | (15,446 | ) | (3,516 | ) | ||||||
| Purchases of reserves in place |
— | 20,566 | 201 | |||||||||
| Revisions of quantity estimates |
(932 | ) | (1,592 | ) | (10,460 | ) | ||||||
| Accretion of discount |
12,815 | 7,360 | 13,257 | |||||||||
| Net change in income taxes |
(4,791 | ) | (20,324 | ) | 25,285 | |||||||
| Changes in timing and other |
(4,247 | ) | (4,299 | ) | (5,834 | ) | ||||||
|
|
|
|
|
|
|
|||||||
| Aggregate change |
5,733 | 32,237 | (39,348 | ) | ||||||||
|
|
|
|
|
|
|
|||||||
| Standardized measure, as of December 31, |
$ | 120,677 | $ | 114,944 | $ | 82,707 | ||||||
|
|
|
|
|
|
|
|||||||
13. Quarterly Financial Data (Unaudited)
The following table contains a summary of the unaudited financial data for each quarter for the years ended December 31, 2011 and 2010 (in thousands except per share data):
| Fourth | Second | First | ||||||||||||||
| Quarter | Third Quarter | Quarter | Quarter | |||||||||||||
| Year ended December 31, 2011 |
||||||||||||||||
| Oil and gas sales |
$ | 10,129 | $ | 11,540 | $ | 11,393 | $ | 11,098 | ||||||||
| Income from operations |
$ | 9,413 | $ | 6,409 | $ | 3,813 | $ | 131 | ||||||||
| Net income (loss) |
$ | 5,789 | $ | 3,836 | $ | 2,214 | $ | (152 | ) | |||||||
| Net income (loss) attributable to common stock |
$ | 4,858 | $ | 2,906 | $ | 1,283 | $ | (1,083 | ) | |||||||
| Basic net income (loss) per common share |
$ | 0.44 | $ | 0.26 | $ | 0.11 | $ | (0.10 | ) | |||||||
| Diluted net income (loss) per common share |
$ | 0.44 | $ | 0.26 | $ | 0.11 | $ | (0.10 | ) | |||||||
| Year ended December 31, 2010 |
||||||||||||||||
| Oil and gas sales |
$ | 7,352 | $ | 7,601 | $ | 7,608 | $ | 11,049 | ||||||||
| Income (loss) from operations |
$ | (3,520 | ) | $ | 4,870 | $ | (1,016 | ) | $ | 9,931 | ||||||
| Net income (loss) |
$ | (2,579 | ) | $ | 2,862 | $ | (889 | ) | $ | 6,109 | ||||||
| Net income (loss) attributable to common stock |
$ | (3,510 | ) | $ | 1,932 | $ | (1,820 | ) | $ | 5,178 | ||||||
| Basic net income (loss) per common share |
$ | (0.32 | ) | $ | 0.17 | $ | (0.16 | ) | $ | 0.47 | ||||||
| Diluted net income (loss) per common share |
$ | (0.32 | ) | $ | 0.17 | $ | (0.16 | ) | $ | 0.47 | ||||||
F-27