Attached files
| file | filename |
|---|---|
| 8-K - FORM 8-K - HANCOCK WHITNEY CORP | d396735d8k.htm |
 Raymond James
Bank Conference
August 14, 2012
Raymond James
Bank Conference
August 14, 2012
Exhibit 99.1 |
 2
Carl Chaney
President & CEO |
 Forward-Looking
Statements
Forward-Looking
Statements
Forward-looking statements provide projections of results of
operations or of financial condition or state other
forward-looking information, such as expectations about future
conditions and descriptions of plans and strategies for the future.
Hancock’s ability to accurately project results or predict
the effects of future plans or strategies is inherently
limited.
We believe that the expectations reflected in the forward-looking
statements are based on reasonable
assumptions,
but
actual
results
and
performance
could
differ
materially
from
those set forth in the forward-looking statements. Factors
that could cause actual results to differ from those expressed
in the Company's forward-looking statements include, but are
not limited to, those outlined in Hancock's SEC filings, including the “Risk Factors”
section of the Company’s form 10-K and 10-Q.
Hancock does not intend, and undertakes no obligation, to update
or revise any forward-
looking statements, and you are cautioned not to place undue reliance
on such forward- looking statements.
3 |
 Second Quarter 2012
Earnings Summary
Second Quarter 2012
Earnings Summary
* A reconciliation of net income to operating income and pre-tax,
pre-provision income is included in the appendix. ** Noninterest
expense
as
a
percent
of
total
revenue
(TE)
before
amortization
of
purchased
intangibles,
securities
transactions
and
merger
expenses.
4
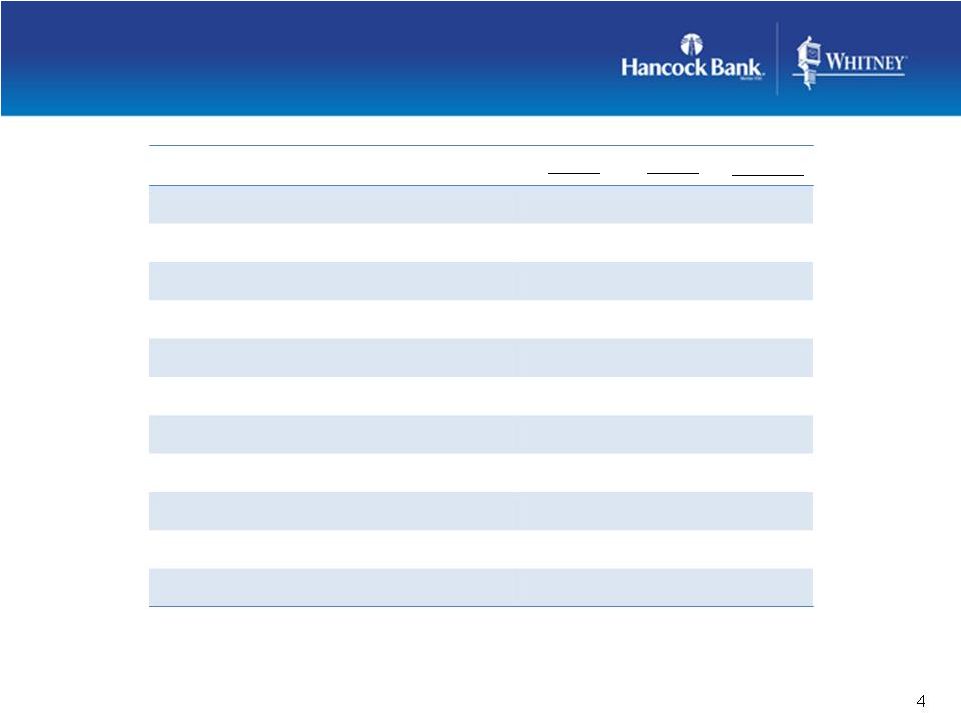
($s in millions; except per share data)
2Q12
1Q12
change
Operating Income*
(a)
$47.0
$40.5
+16%
Operating E.P.S.(diluted)
(a)
$.55
$.47
+17%
Return on
Assets (operating)
(a)
1.00%
0.85%
+15bps
Merger Costs
$11.9
$33.9
-65%
Net Income
$39.3
$18.5
+112%
Earnings Per Share
(diluted)
$.46
$.21
+119%
Pre-Tax, Pre-Provision Income*
$75.8
$69.2
+10%
Net Interest Margin
4.48%
4.43%
+5bps
Net Charge-offs non-covered
0.37%
0.25%
+12bps
Tangible Common Equity
8.72%
8.27%
+45bps
Efficiency Ratio**
65.67%
67.81%
-214bps
(a) Excludes tax-effected merger related expenses and securities
transactions. Management believes that this is a useful financial
measure because it enables investors to asses ongoing operations. |
 •
Operating earnings $47 million or $.55 per diluted
common share
•
Up 17% linked-quarter on a per share basis
•
Fundamentals remain solid
•
Operating ROA 1.00%
•
Committed to enhancing ROA
•
Loan growth opportunities
•
Developing revenue synergies
•
Gaining additional efficiencies
•
In line with our expectations and guidance
Second Quarter
2012 Results
As of June 30, 2012
5 |
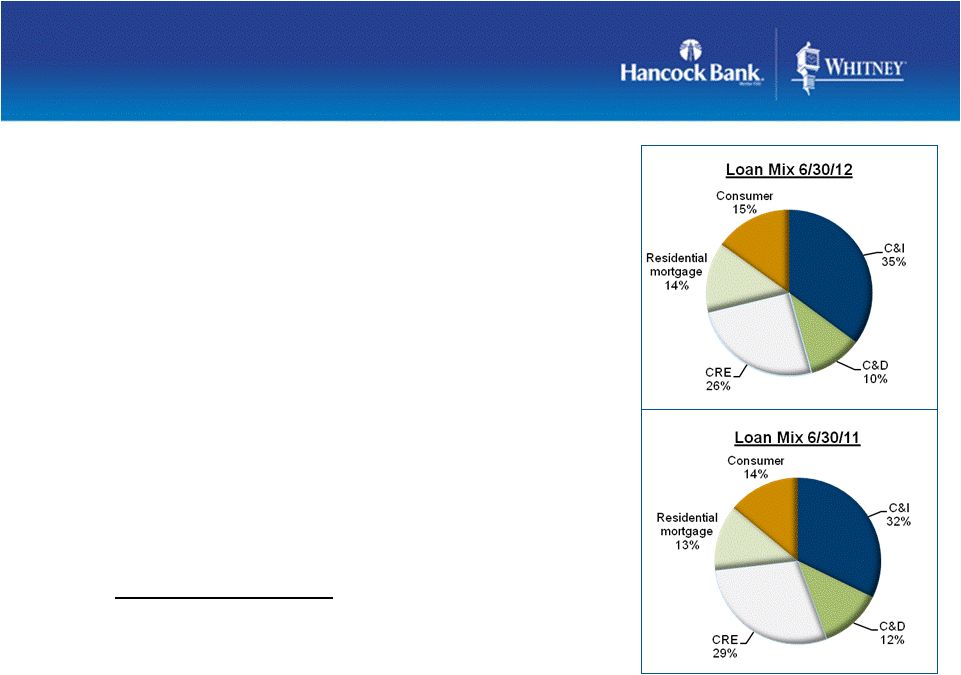 Better Mix, Less Risky
Loan Portfolio
•
Total loans $11 billion; virtually flat linked-quarter
(after adjusting for the decline in the covered Peoples First
portfolio) •
Compared to a year earlier loans are down
$171 million, or 1.5%
•
Growth in C&I (+7%), residential mortgage (+5%),
consumer loans (+6%) offset by declines in construction (-15%)
and commercial real estate (-13%)
•
Decline of $285 million from Whitney acquired-impaired portfolio;
$160 million from Peoples First covered portfolio; mainly
construction and CRE portfolios
•
Result is a better quality, more diverse portfolio
•
Cautiously optimistic there will be net loan growth
in the second half of 2012
Period-end balances. As of June 30, 2012
6 |
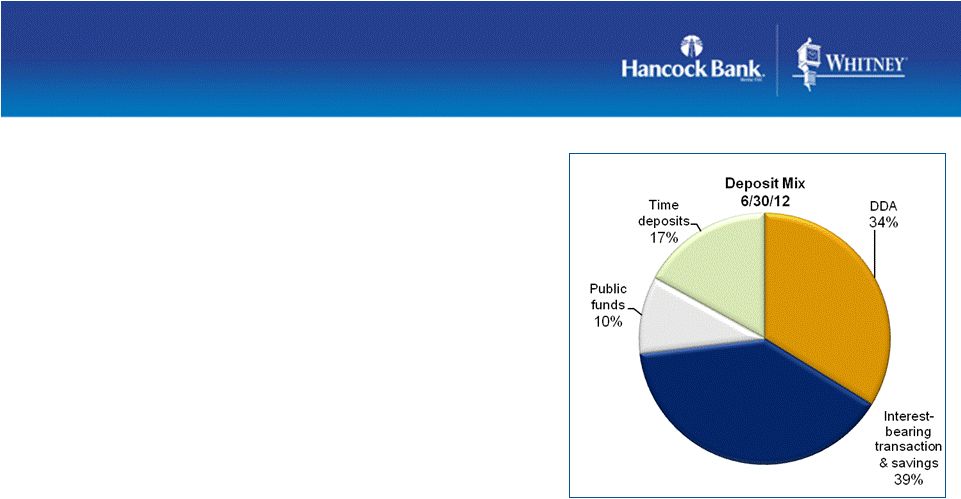 Strong Core Deposit
Funding
•
Total deposits $15 billion
•
Funding mix remained strong
–
Low cost of funds (32bps); down 6bps from 1Q12
–
Noninterest bearing demand deposits (DDA) comprised
34% of total period-end deposits
•
Linked-quarter decline related to expected CD
runoff, seasonal trends in public funds and
redeployment of temporary excess liquidity in a
few customer relationships
•
Opportunity to reprice CDs at significantly
lower rates has largely been eliminated
•
Approximately $1.0B in CDs maturing over the next 2 quarters
at average rate of .50%
Period-end balances. As of June 30, 2012
7 |
 8
Michael Achary
Chief Financial Officer |
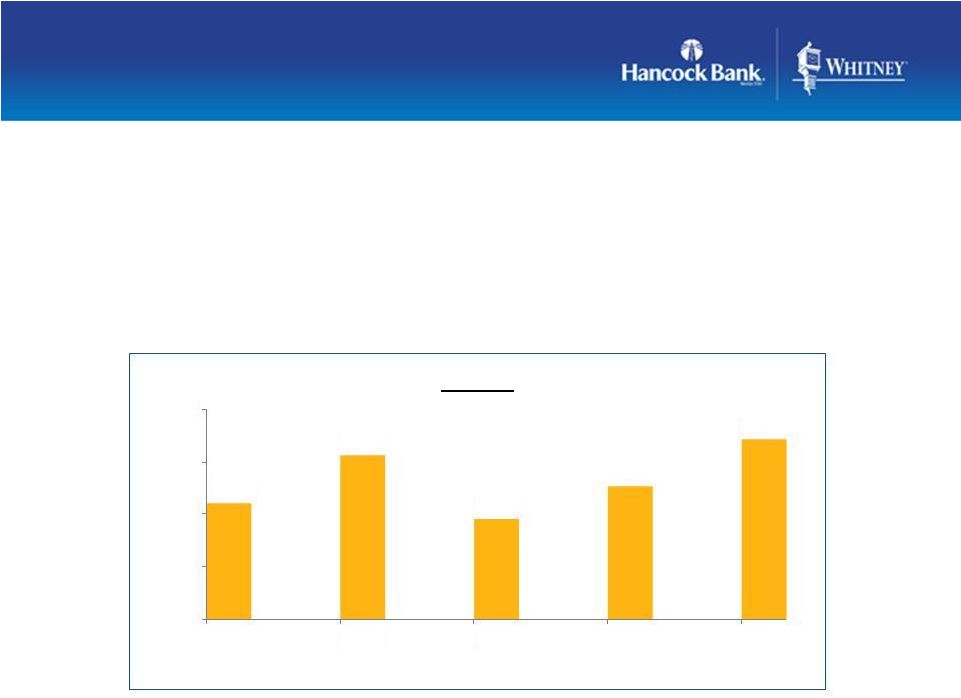
 Strong, Stable
Net Interest Margin
•
Net interest margin (NIM) 4.48%, up 5bps linked-quarter
–
Reflects a favorable shift in funding sources, a decline in funding
costs, offset by a decline in the securities portfolio
yield –
Core margin basically unchanged
•
Quarterly reviews of accretion levels
and portfolio performance will
impact reported margin
•
Expect the reported
NIM will
remain relatively stable in the
near term
As of June 30, 2012
9
4.32%
4.39%
4.43%
4.48%
3Q11
4Q11
1Q12
2Q12
NIM -
reported |
 Working To Enhance
Fee Growth
•
Noninterest income totaled $63.6 million, up 3%
linked-quarter •
New and standardized products and services offered across the footprint
after the systems conversion in March 2012
•
Conversion has enhanced opportunities for cross-selling
–
Private Banking
–
Treasury Management
–
International Banking
–
Insurance
•
Expect
the
overall
level
of
fee
income
to
decline
in
3Q12
reflecting,
in
part,
the
impact of the restrictions on interchange rates related to the Durbin
Amendment on Hancock Bank.
–
Expected
to
result
in
a
loss
of
fee
income
of
approximately
$2.5
million
from
current
levels
As of June 30, 2012
10 |
 Focused On Realization
Of Remaining Cost Synergies
•
Operating expense totaled $168 million, down $3.5 million from
1Q12* –
Amortization of intangibles totaled $7.9 million
–
Personnel expense decreased $2.5 million, primarily from declines in
quarterly payroll taxes and the
reduction
in
force
associated
with
the
systems
conversion
in
March
2012;
offset
by
the
Company’s annual merit increase and recent strategic new
hires •
Merger-related expenses totaled $12 million QTD; $133 million in
total •
Cost savings projected for the Whitney acquisition totaled $134 million
or $33.5 million quarterly
•
Efficiency ratio 65.67% in 2Q12**
–
Short term target: 62-63%
–
Longer term target: less than 60%
As of June 30, 2012
* Excludes merger costs
** Noninterest
expense
as
a
percent
of
total
revenue
(TE)
before
amortization
of
purchased
intangibles
and
securities
transactions
and
merger
expenses
11 |
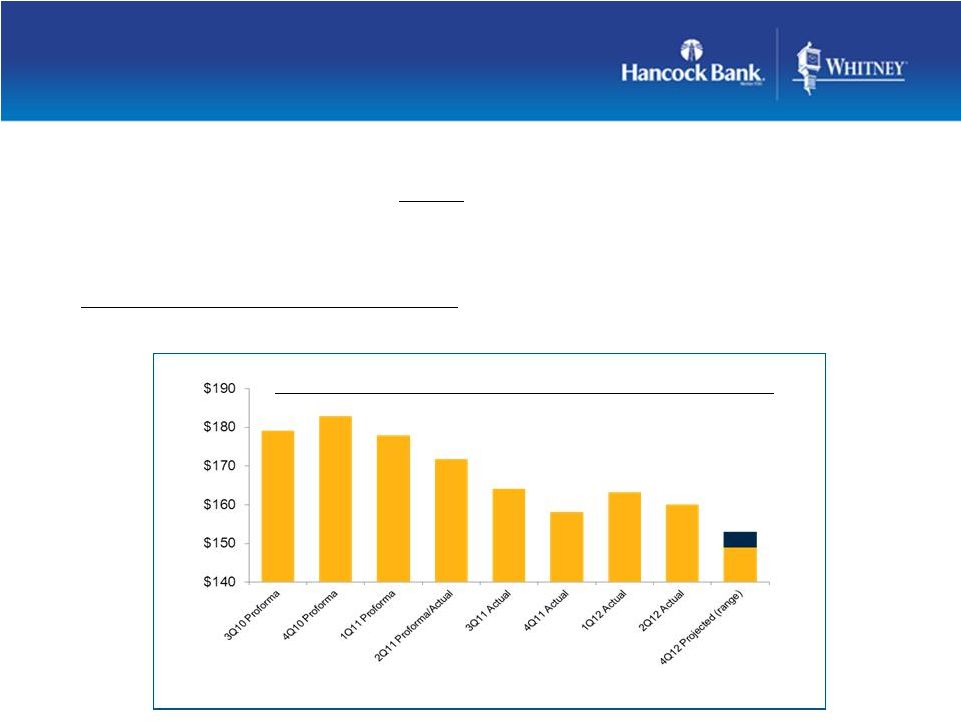 Reiterating Operating Expense
Guidance for 4Q12
•
Expect total operating expense, excluding amortization of intangibles,
of $149
million
-
$153
million
in
4Q12
•
Operating expense excludes merger costs
•
The
additional
$7
million
–
$11
million
in
cost
savings
are
expected
to
be
generated during second half of 2012
As of June 30, 2012
$s in millions
12
Operating expense (excluding amortization of intangibles)
|
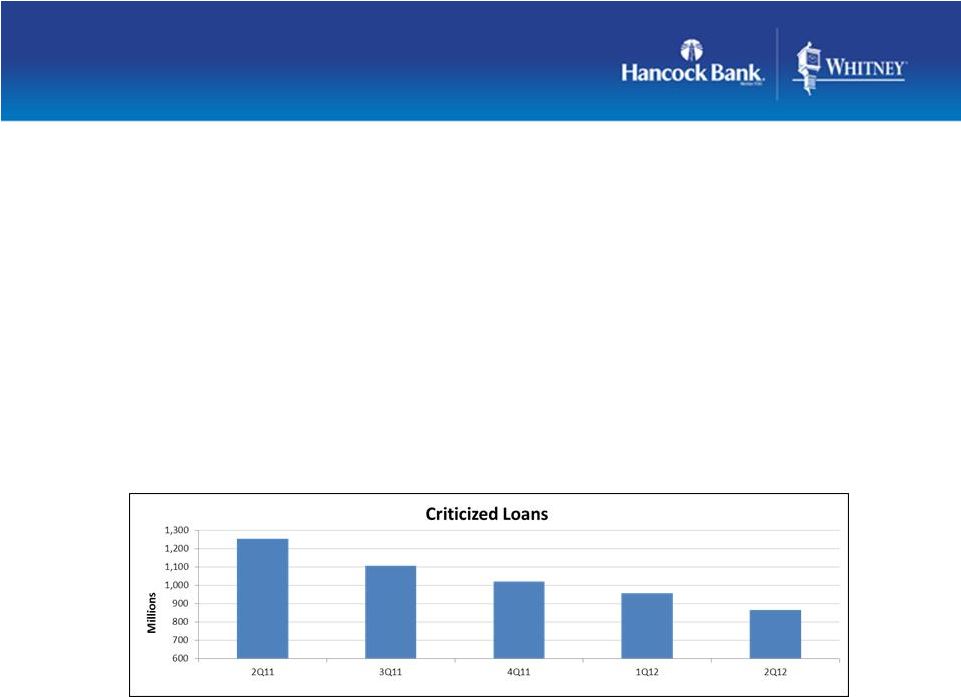 •
Provision for loan losses was $8 million, down from $10 million in
1Q12 •
Net charge-offs totaled $10 million, or 0.37%, related to the
non-covered portfolio •
ALLL/loans was 1.40%
•
Excluding the impact of the Whitney acquired loans and FDIC covered
loans •
Total nonperforming assets declined $17 million
linked-quarter •
Legacy Hancock NPLs stabilized
•
Decline primarily related to a reduction in ORE and foreclosed
assets •
Total criticized loans down $390 million compared to a year ago
Asset Quality To Remain In Line
With Previous Quarters’
Range
As of June 30, 2012
13 |
 •
Tangible Common Equity (TCE) ratio improved to 8.72%, up 45bps
linked-quarter –
Target: 8% minimum
•
Expect to continue building capital in the near term
•
Will
continue
to
look
for
opportunities
to
deploy
excess
capital
and
liquidity
in
the
best interest of the Company and the shareholders
As of June 30, 2012
14
Well-Capitalized
Company
8.11%
8.56%
7.96%
8.27%
8.72%
7.00%
7.50%
8.00%
8.50%
9.00%
11
Sep-11
Dec-
11
Mar-
12
Jun-
12
Jun-
Whitney
acquisition
TCE Ratio |
 15
Carl Chaney
President & CEO
|
 Whitney Subordinated
Notes Tender Offer
•
Capital position, combined with strong liquidity position allowed the
Company to initiate a tender offer on a portion of Whitney
subordinated notes •
Original issue by Whitney National Bank in March 2007 of $150 million
5.875% notes due 4-1-2017
•
Tender offer for up to 50% of the outstanding notes announced June 18,
2012 (expired July 16, 2012)
•
Repurchased approximately $52 million at a premium of $5.3 million
(pre-tax) •
Annual savings of approximately $3 million
•
The transaction will be included in 3Q12 results
16 |
 17
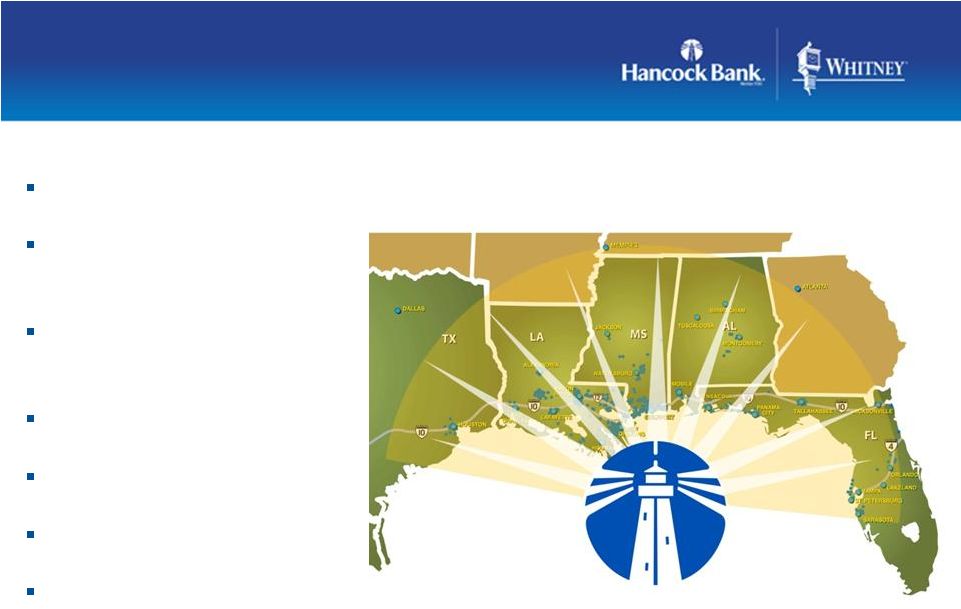
•
Diversified footprint across the Gulf South
•
2 well-known Gulf Coast brands
•
Loyal customer base and attractive deposit funding
•
Diversified revenue stream with strong earnings momentum
•
Leading market share in key MSAs
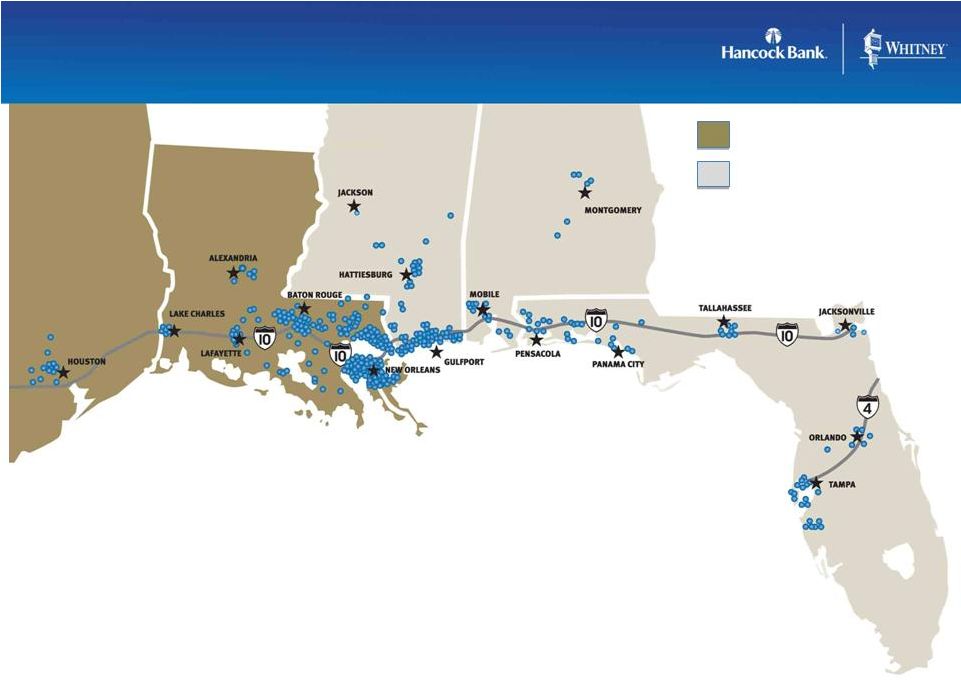
A Premier Gulf South
Financial Services Franchise
Whitney Bank
Hancock Bank |
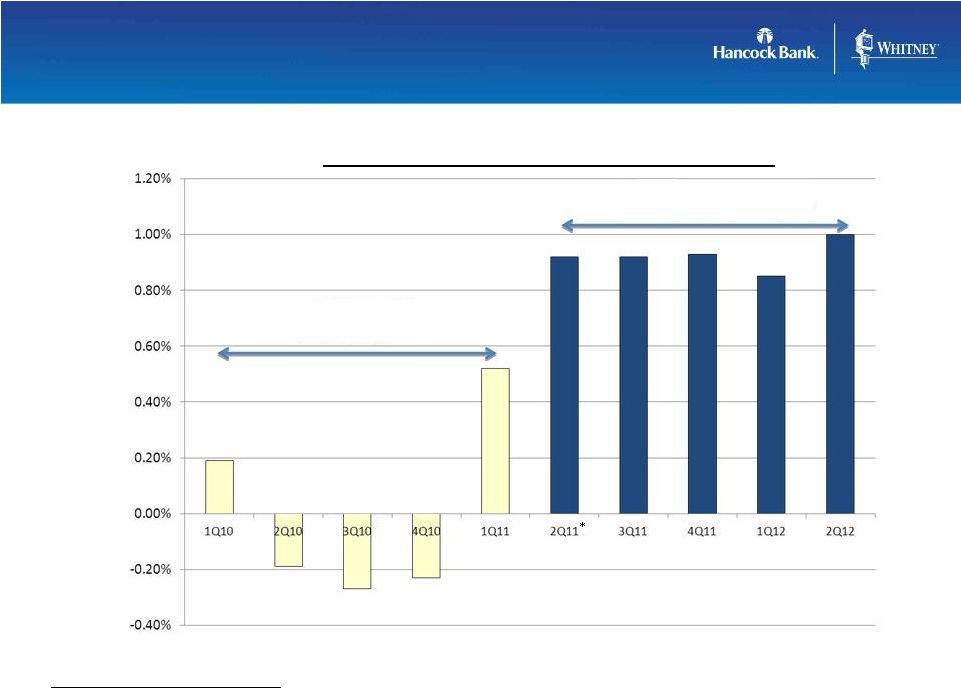 ROA Guidance of 1.10%
to 1.20% Within Reach
ROA Guidance of 1.10%
to 1.20% Within Reach
HBHC/WTNY
Proforma
HBHC post merger
*Whitney acquired June 4, 2011
*
Operating
ROA
(excludes
merger
costs)
18 |
 Well Positioned For
The Future
Premier Gulf South franchise
Opportunities for future
growth
History of effective capital
management
Superior liquidity
Conservative credit culture
Enhanced earnings potential
Focused on shareholder
value creation
19 |
 Raymond James
Bank Conference
August 14, 2012
Raymond James
Bank Conference
August 14, 2012 |
 21
Appendix
|
 Non-GAAP
Reconciliation
22
(d) Net income less tax-effected merger costs and securities gains/losses. Management believes
that this is a useful financial measure because it enables investors to assess ongoing
operations. (e) Pre-tax pre-provision profit (PTPP) is total revenue less noninterest
expense, merger items, and securities transactions. Management believes that PTPP profit is a
useful financial measure because it enables investors and others to assess the Company’s
ability to generate capital to cover credit losses through a credit cycle.
(amounts in thousands)
(unaudited)
6/30/2012
3/31/2012
06/30/011
6/30/2012
6/30/2011
Income Statement
Interest income
$190,489
$191,716
$115,477
$382,205
$198,010
Interest income (TE)
193,323
194,665
118,335
387,988
203,740
Interest expense
13,030
15,428
16,418
28,458
32,187
Net interest income (TE)
180,293
179,237
101,917
359,530
171,553
Provision for loan losses
8,025
10,015
9,144
18,040
17,966
Noninterest income excluding
securities transactions
63,552
61,494
46,715
125,046
80,899
Securities transactions gains/(losses)
-
12
(36)
12
(87)
Noninterest expense
179,972
205,463
121,366
385,435
194,385
Income before income taxes
53,014
22,316
15,228
75,330
34,284
Income tax expense
13,710
3,821
3,140
17,531
6,868
Net income
$39,304
$18,495
$12,088
$57,799
$27,416
Merger-related expenses
11,913
33,913
22,219
45,827
23,808
Securities transactions gains/(losses)
-
12
(36)
12
(87)
Taxes on adjustments
4,170
11,865
7,789
16,035
8,364
Operating income (d)
$47,047
$40,531
$26,554
$87,579
$42,947
Difference between interest income and interest income (TE)
$2,834
$2,949
$2,858
$5,783
$5,730
Provision for loan losses
8,025
10,015
9,144
18,040
17,966
Merger-related expenses
11,913
33,913
22,219
45,827
23,808
Less securities transactions gains/(losses)
-
12
(36)
12
(87)
Income tax expense
13,710
3,821
3,140
17,531
6,868
Pre-tax, pre-provision profit (PTPP) (e)
$75,786
$69,181
$49,485
$144,968
$81,875
Three Months Ended
Six Months Ended |