Attached files
| file | filename |
|---|---|
| 8-K - FORM 8-K - NOVANTA INC | d397406d8k.htm |
 CJS
Securities Summer Conference CJS Securities Summer Conference
August 14, 2012
August 14, 2012
Exhibit 99.1 |
 2
Factors affecting future performance…
Factors affecting future performance…
Forward-Looking Statements
The statements in this presentation that relate to guidance, future plans, business
opportunities, events or performance are forward-looking statements that
involve risks and uncertainties, including risks associated with business and economic
conditions, customer and/or supplier contract cancellations, manufacturing risks,
competitive factors, ability to successfully introduce new products,
uncertainties pertaining to customer orders, demand for products and services, growth and
development of markets for the Company's products and services, and other risks
identified in our filings made with the Securities and Exchange Commission,
including, most recently, our Form 10-K for the year ended December 31, 2011. Actual
results, events and performance may differ materially. Readers are cautioned not to
place undue reliance on these forward- looking statements, which speak only
as of the date of this presentation, August 14, 2012. The Company disclaims any obligation
to update these forward-looking statements as a result of developments occurring
after the date of this presentation. Readers are
encouraged
to
refer
to
the
risk
disclosures
described
in
the
Company’s
Form
10-K for the year ended December 31, 2011
and subsequent filings
with
the
SEC,
as
applicable.
Please
see
“Safe
Harbor
and
Forward-Looking Information”
in the Appendix
to this presentation for more information.
Non-GAAP Measurement
The Company’s statements regarding its projected revenues, adjusted EBITDA, free
cash flow, and net debt are non-GAAP financial
measures.
Please
see
“Use
of
Non-GAAP
Financial
Measures”
and
the
subsequent
slides
in
the
Appendix
to
this
presentation for the reasons we use these measures, a reconciliation of these
measures to the most directly comparable GAAP measures and other information
relating to these measures. The Company neither updates nor confirms any
guidance regarding the future operating results of the Company which may have
been given prior to this presentation.
Discontinued Operations
In June 2012, the Company committed to a plan for the sale of its Semiconductor
Systems and Laser Systems businesses. As a result, the Company began
accounting for these businesses as discontinued operations beginning in the second quarter of
2012. Unless otherwise noted, all financial results in this presentation are GAAP
measures for continuing operations. …and use of Non-GAAP financial
measures …and use of Non-GAAP financial measures
|
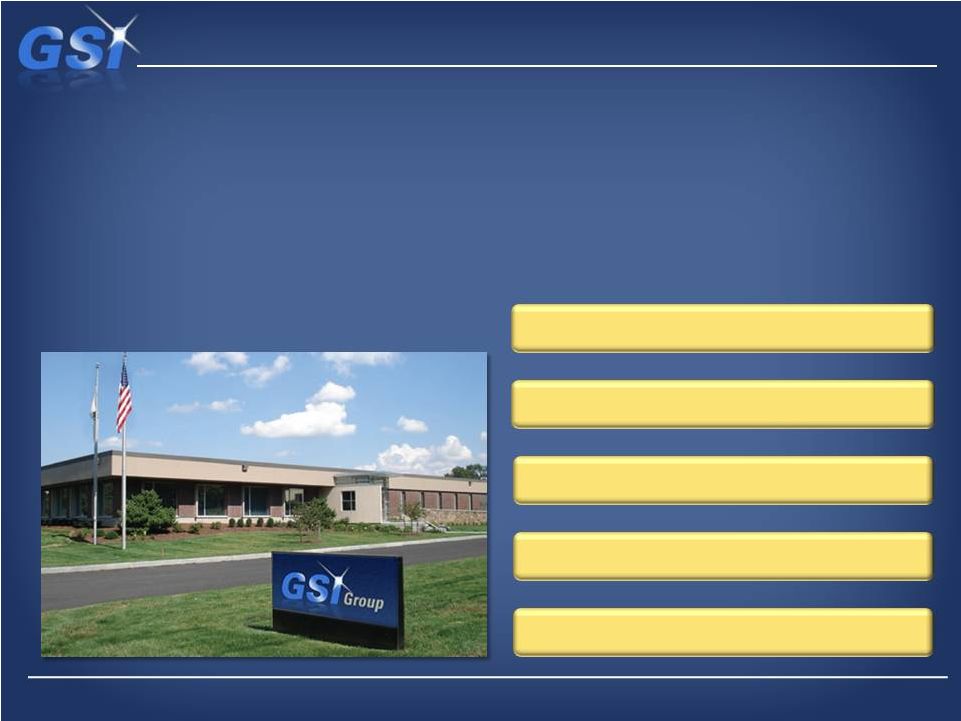 We
are a leading supplier… …of precision motion and laser
technology 3
Capabilities to Innovate & Grow
Global Presence and Reach
Expertise to Drive Results
Leading Technology Franchises
Positioned in Growth Segments
•
Leading
provider
of
precision
laser,
optical
and
motion
control
technology
•
Founded in 1968, headquartered in Bedford, MA -
major presence in North America,
Europe, and Asia-Pacific
•
$304M in revenue and $56M in Adjusted EBITDA in 2011
•
Approximately 1200 employees for continuing operations
•
Trade on NASDAQ (GSIG) |
 Our
aspirations… …are clear and achievable
Strategic Vision
•
Focus growth efforts on building out
key platforms (organic and M&A)
•
Improve mix (growth, volatility) –
more Medical, less Semiconductor
•
Simplify footprint and infrastructure
A leading provider of precision photonic and
A leading provider of precision photonic and
motion technologies for OEM’s in demanding
motion technologies for OEM’s in demanding
markets –
markets –
delivering attractive shareholder
delivering attractive shareholder
returns through sustained profitable growth
returns through sustained profitable growth
Strategic Priorities
Strategic Priorities
•
Organic growth mid to high
single digits
•
>20% EBITDA margins
•
Long term shareholder returns
above peer average
Performance Goals
Performance Goals
4 |
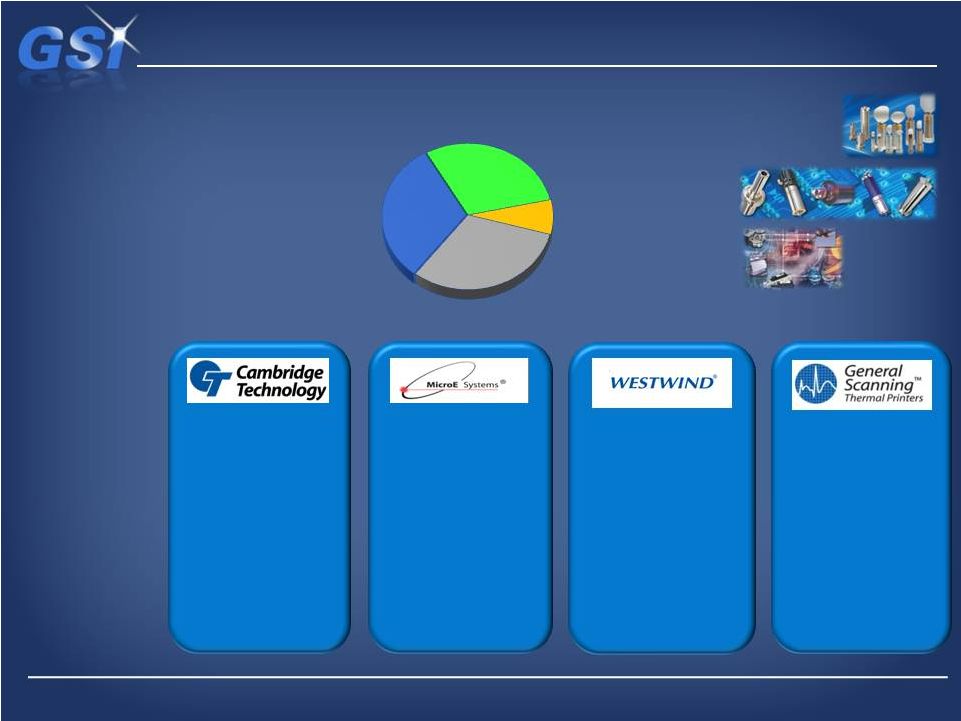
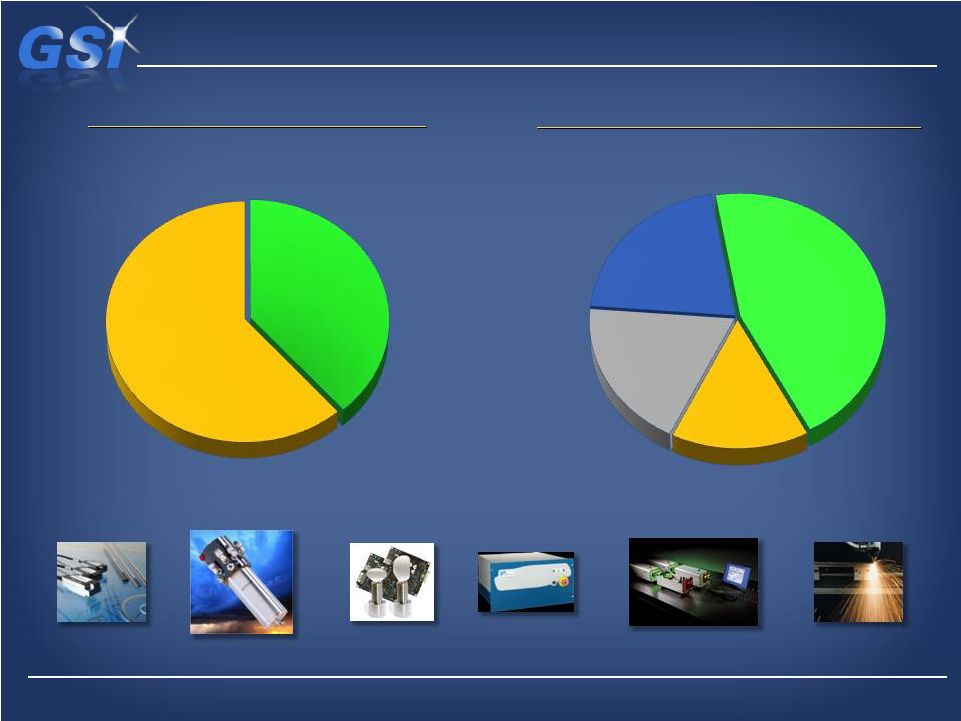 Medical revenue now makes up 19%…
…with Microelectronics down to 21%
Laser
Laser
Products
Products
End-Market Revenue*
End-Market Revenue*
Precision
Precision
Motion
Motion
5
* Continuing Operations, Last Twelve Months, ending Q2 2012
Industrial
Industrial
Scientific
Scientific
Medical
Medical
Microelectronics
Microelectronics
Segment Revenue*
Segment Revenue*
45%
15%
19%
21%
61%
39% |
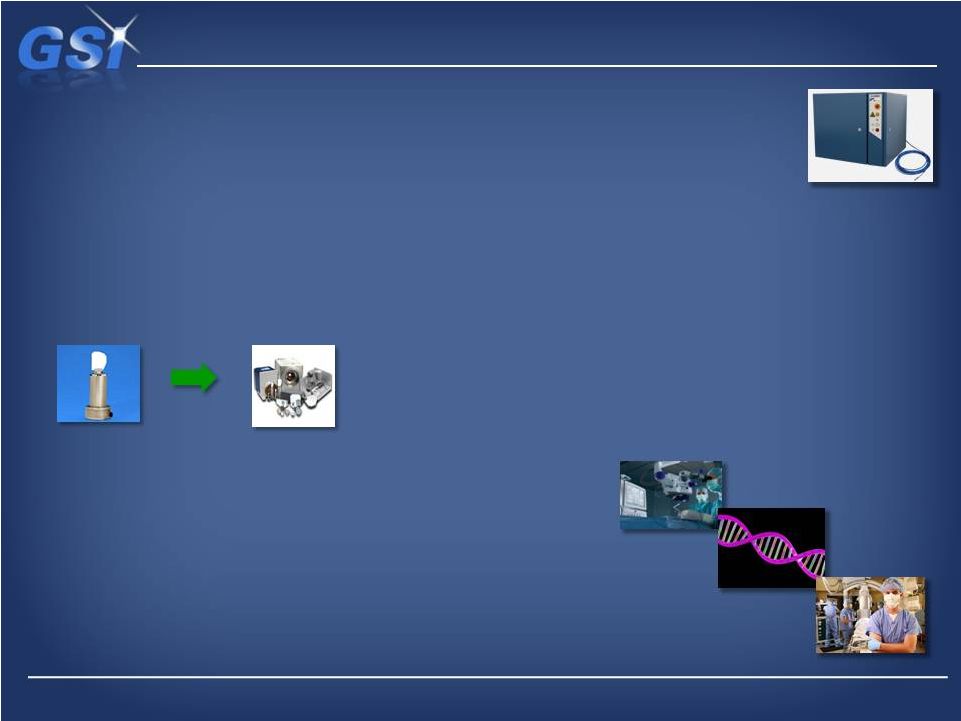
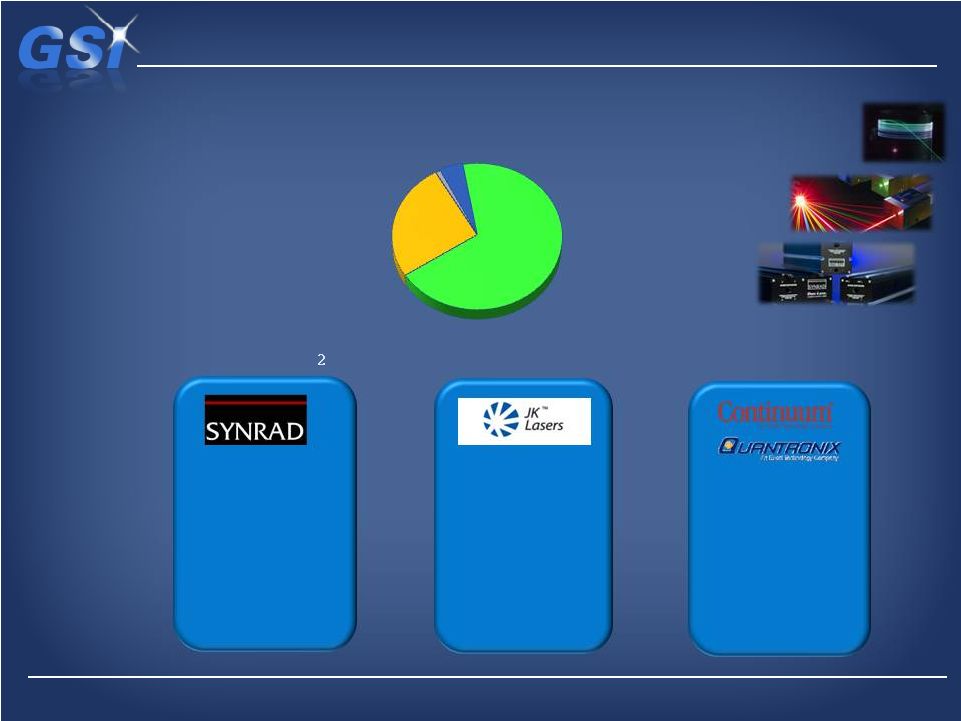 We
have a strong laser offering… …focused on industrial and scientific
markets Laser Products Overview
Laser Products Overview
Revenue*
Revenue*
$108M
$108M
Industrial
Industrial
Scientific
Scientific
Medical
Medical
Brands
Brands
Range
Range
Location
Location
Primary
Primary
Applications
Applications
Sealed CO
Sealed CO
Fiber Lasers
Fiber Lasers
50W to 2kW
50W to 2kW
Rugby, UK
Rugby, UK
Metal cutting,
Metal cutting,
welding, drilling
welding, drilling
Specialty
Specialty
High Speed/Power
High Speed/Power
Santa Clara, CA
Santa Clara, CA
Scientific Research
Scientific Research
Specialty Industrial
Specialty Industrial
6
Electronics
Electronics
* Continuing Operations, Last Twelve Months, ending Q2 2012
68%
26%
1%
5%
10W to 400W
10W to 400W
Mukilteo, WA
Mukilteo, WA
Marking, Engraving,
Marking, Engraving,
Date Coding of non
Date Coding of non
metals
metals
-
- |
 We
have strong franchises… …in
the
Precision
Motion
space
Precision Motion Overview
Precision Motion Overview
Brand
Brand
Technology
Technology
Location
Location
Primary
Primary
Applications
Applications
Galvanometers
Galvanometers
Scan Heads
Scan Heads
Lexington, MA
Lexington, MA
Material
Material
Processing
Processing
Marking
Marking
Ophthalmology
Ophthalmology
PCB Drilling
PCB Drilling
Optical Encoders
Optical Encoders
Bedford, MA
Bedford, MA
Robotic Surgery
Robotic Surgery
DNA Sequencing
DNA Sequencing
Wire Bonding
Wire Bonding
Disk Drives
Disk Drives
Air Bearing Spindles
Air Bearing Spindles
Poole, UK
Poole, UK
Suzhou, China
Suzhou, China
PCB Drilling
PCB Drilling
Semiconductor
Semiconductor
Thermal Printers
Thermal Printers
Bedford, MA
Bedford, MA
Patient Monitoring
Patient Monitoring
Defibrillators
Defibrillators
EKG
EKG
Revenue*
$172M
Industrial
Industrial
Scientific
Scientific
Electronics
Electronics
Medical
Medical
Scanners
Encoders
Spindles
Recorders
7
* Continuing Operations, Last Twelve Months, ending Q2 2012
30%
8%
31%
31% |
 We
are investing for growth… …in several attractive platforms
Attractive Growth Platforms
Attractive Growth Platforms
•
Beam
delivery
for
lasers
–
market
growth
~8%
•
•
Leverage our #1 position in Galvanometers to
Leverage our #1 position in Galvanometers to
enter Scan Head market (modules)
enter Scan Head market (modules)
•
•
Double addressable market up to ~$200M
Double addressable market up to ~$200M
•
Q2
growth
of
15%
-
numerous
new
design
wins
•
•
~$25M revenue opportunity by 2015
~$25M revenue opportunity by 2015
Scanning Solutions
Scanning Solutions
•
•
~$600M market growing ~20%
~$600M market growing ~20%
•
•
Products to 2kW, more 2012 releases planned
Products to 2kW, more 2012 releases planned
•
•
Converting our installed base to fiber
Converting our installed base to fiber
•
Q2 sales tripled year-over-year, $30M target by 2015
•
•
Major investments underway:
Major investments underway:
-
Multi-kilowatt products
-
-
Increased capacity
Increased capacity
-
-
BOM cost reductions
BOM cost reductions
-
-
New applications centers in U.S. and China
New applications centers in U.S. and China
Fiber Lasers
Fiber Lasers
•
•
~$50M business today
~$50M business today
•
•
Numerous design wins with leading
Numerous design wins with leading
OEM’s
•
•
Key Applications: Robotic Surgery, DNA Sequencing, OCT,
Key Applications: Robotic Surgery, DNA Sequencing, OCT,
Patient Monitoring, Defibrillation, EKG, Dermatology
Patient Monitoring, Defibrillation, EKG, Dermatology
•
•
Expansion into adjacent technologies & customer platforms
Expansion into adjacent technologies & customer platforms
•
•
Significant focus of our M&A efforts
Significant focus of our M&A efforts
Medical Components
Medical Components
8
Source: Strategies Unlimited, Management Estimates
|
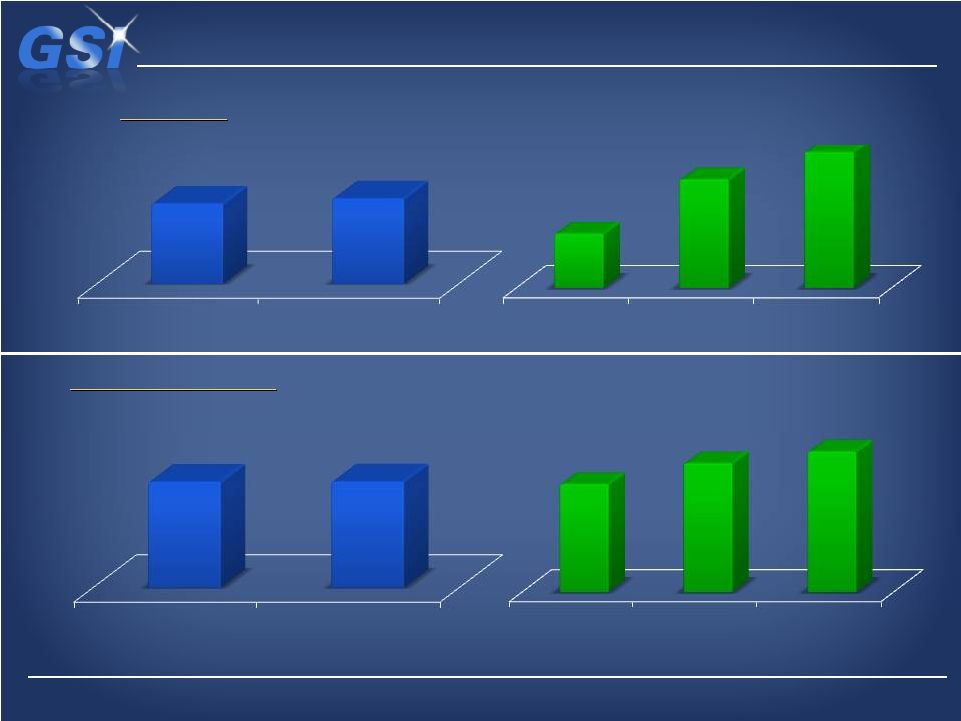 Delivering profitable revenue growth…
…despite the volatility in our markets & the economy
$304M
$304M
$286M
$286M
Revenue:
Revenue:
9
$56M
$56M
$56M
$56M
Adjusted EBITDA:
Adjusted EBITDA:
$65M
$65M
$70M
$70M
$10M
$10M
$12M
$12M
$68M $73M
$68M $73M
$10M $13M
$10M $13M
-
-
-
-
2010 A
2011 A
1Q12 A
2Q12 A
3Q12 F
2010 A
2011 A
1Q12 A
2Q12 A
3Q12 F |
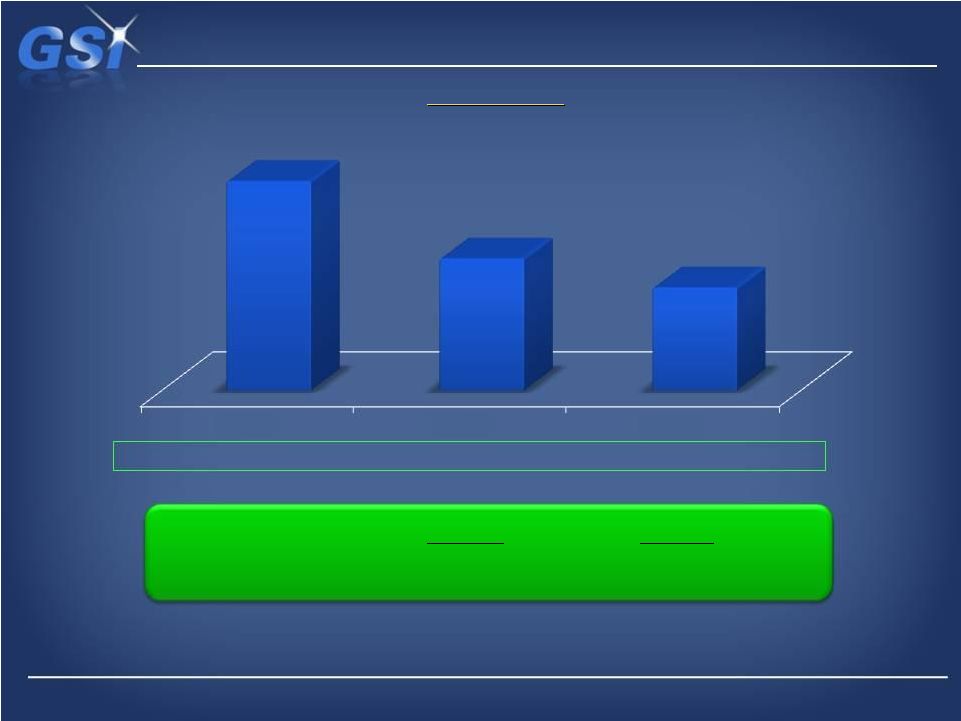 Demonstrated history of strong cash generation…
…demonstrate high quality of businesses
$108M
$108M
$68M
$68M
$53M
$53M
Gross Debt:
Gross Debt:
* See Non-GAAP Net Debt & Leverage Ratio Reconciliation
** Free Cash Flow includes the cash flows of Continuing and Discontinued
Operations 10
($50.8M)
($50.8M)
($13.2M)
($13.2M)
$2.8M
$2.8M
Net Debt*
Net Debt*
Free Cash Flow**
2011 A
2012 F
$41M
+$40M
2010A
2011A
2Q2012 |
 We
are establishing a continuous improvement culture…
…through formalized productivity programs / initiatives
Current
Current
12 x 12 Integration and Realignment Program
Target:
Up
to
$5
million
in
annualized
cost
savings,
with
a
goal of eliminating up to 12 facilities, including facilities that
will be exited as a consequence to the expected sale of our
Systems businesses
Future
Future
Operational Excellence
Target:
Consistent
margin
expansion
Pricing
Volume
Leverage
Lean & Six
Sigma
Global
Sourcing
Low-cost
Regional
Manufac-
turing
11
C
C
o
o
n
n
t
t
i
i
n
n
u
u
o
o
u
u
s
s
I
I
m
m
p
p
r
r
o
o
v
v
e
e
m
m
e
e
n
n
t
t
C
C
u
u
l
l
t
t
u
u
r
r
e
e
|
 We
have clear focus… …for success in 2012
Key Priorities for 2H of 2012
Key Priorities for 2H of 2012
•
•
Complete 12 X 12 plan
Complete 12 X 12 plan
•
•
2H 2012 Restructuring Plan
2H 2012 Restructuring Plan
•
•
Complete sale of Systems business lines
Complete sale of Systems business lines
•
•
Build momentum on Growth Platforms
Build momentum on Growth Platforms
•
•
Build pipeline of bolt-on acquisitions
Build pipeline of bolt-on acquisitions
•
•
Build core competencies (continuous improvement)
Build core competencies (continuous improvement)
12 |
 Appendix
13 |
 Safe
Harbor and Forward Looking Information 14
Certain statements in this presentation are “forward-looking statements” within the
meaning of the Private Securities Litigation Reform Act of 1995 and are based on current
expectations and assumptions that are subject to risks and uncertainties. All statements contained in this presentation that do not relate to
matters of historical fact should be considered forward-looking statements, and are generally
identified by words such as “expect,” “intend,” “anticipate,”
“estimate,” “plan,” and other similar expressions. These forward-looking
statements include, but are not limited to, statements related to: the Company’s
anticipated future financial performance; expected future product releases; expected consolidation of
our Massachusetts operations; the expected impact of the 12x12 Program and related charges;
expected timing of the divestitures of our discontinued operations; management’s plans and objectives for future
operations; anticipated sales performance; industry trends; market conditions; changes in actual or
assumed tax liabilities; expectations regarding tax exposure; future acquisitions and
dispositions; the Company’s optimism regarding its prospects for the future; and other statements that are not historical facts.
These forward-looking statements are neither promises nor guarantees, but involve risks and
uncertainties that may cause actual results to differ materially from those contained in the
forward-looking statements. Our actual results could differ materially from those anticipated in these forward-looking statements for many
reasons, including, but not limited to, the following: economic and political conditions and the
effects of these conditions on our customers’ businesses and level of business activity;
our significant dependence upon our customers’ capital expenditures, which are subject to cyclical market fluctuations; our dependence upon
our ability to respond to fluctuations in product demand; our ability to continually innovate; delays
in our delivery of new products; our reliance upon third party distribution channels subject to
credit, business concentration and business failure risks beyond our control; fluctuations in our quarterly results and our failure to
meet or exceed the expectations of securities analysts or investors; customer order timing and other
similar factors beyond our control; changes in interest rates, credit ratings or foreign
currency exchange rates; risk associated with our operations in foreign countries; our increased use of outsourcing in foreign countries;
our failure to comply with local import and export regulations in the jurisdictions in which we
operate; our history of operating losses and our ability to sustain our profitability; our
exposure to the credit risk of some of our customers and in weakened markets; violations of our intellectual property rights and our ability to
protect our intellectual property against infringement by third parties; risk of losing our
competitive advantage; our ability to make acquisitions or divestitures that provide business
benefits; our failure to successfully integrate future acquisitions into our business; our ability to retain key personnel; our restructuring and
realignment activities and disruptions to our operations as a result of consolidation of our
operations; product defects or problems integrating our products with other vendors’
products; disruptions in the supply of or defects in raw materials, certain key components or other goods from our suppliers; production difficulties
and product delivery delays or disruptions; changes in governmental regulation of our business or
products; disruption in our information technology systems or our failure to implement new
systems and software successfully; our failure to realize the full value of our intangible assets; any requirement to make additional
tax payments and/or recalculate certain of our tax attributes depending on the resolution of the
complaint we filed against the U.S. government; our ability to utilize our net operating loss
carryforwards and other tax attributes; fluctuations in our effective tax rates and audit of our estimates of tax liabilities; being subject
to U.S. federal income taxation even though we are a non-U.S. corporation; being subject to the
Alternative Minimum Tax for U.S. federal income tax purposes; any need for additional capital
to adequately respond to business challenges or opportunities and repay or refinance our existing indebtedness, which may not be
available on acceptable terms or at all; volatility in the market for our common shares; our
dependence on significant cash flow to service our indebtedness and fund our operations; our
ability to access cash and other assets of our subsidiaries; the influence over our business of several significant shareholders; provisions
of our articles of incorporation may delay or prevent a change in control; our significant existing
indebtedness and restrictions in our new senior secured credit agreement that may limit our
ability to engage in certain activities; our intention not to pay dividends in the near future; and our failure to maintain appropriate
internal controls in the future.
Other important risk factors that could affect the outcome of the events set forth in this
presentation and that could affect the Company’s operating results and financial condition
are discussed in Item 1A of our Annual Report on Form 10-K for the fiscal year ended December 31, 2011, and in the Company’s subsequent
filings with the SEC made prior to or after the date hereof. Such statements are based on the
Company’s management’s beliefs and assumptions and on information currently available
to the Company’s management. The Company disclaims any obligation to update any forward-looking statements as a result of
developments occurring after the date of this presentation except as required by law. |
 In
addition to the financial measures prepared in accordance with generally accepted accounting principles (GAAP), we use certain non-GAAP financial
measures, including adjusted EBITDA, free cash flow, and net debt. Non-GAAP
adjustments to adjusted EBITDA include: depreciation and amortization,
share-based compensation, restructuring and restatement costs, pre-petition
and post-emergence professional fees, Net income attributable to
noncontrolling interest, and other non-recurring items. Free cash flow is
defined as cash provided by (used in) operating activities less capital expenditures.
Net debt is defined as total debt less cash and cash equivalents.
Management believes non-GAAP financial measures provide meaningful supplemental
information regarding the Company’s operating results because it
excludes amounts that management does not consider part of operating results when
assessing and measuring the operational and financial performance of the
Company. Management believes non-GAAP measures allow a useful alternative for viewing operating trends and performing analytical comparisons.
Accordingly, the Company believes non-GAAP measures provide greater
transparency and insight into management’s method of analysis. While
management believes non-GAAP financial measures provide useful
information, these are not measures under U.S. GAAP, and therefore, should not be
considered in isolation from, or as a substitute for, GAAP financial measures such
as income from operations or net income. Non-GAAP
financial
measures
are
also
used
by
our
management
to
evaluate
our
operating
performance,
communicate
our
financial
results
to
our Board of
Directors, benchmark our operating results against our historical performance and
the performance of our peers, evaluate investment opportunities including
acquisitions and divestitures, and determine the bonus payments for senior
management and other employees. Use of Non-GAAP Financial Measures
15 |
 16
Six Months ended
Twelve Months Ended
June 29, 2012
December 31, 2011
December 31, 2010
(in thousands of dollars)
Income from operations (GAAP)
$ 7,918
$ 35,848
$ 36,027
Depreciation and amortization
6,930
14,467
14,687
Share-based compensation
2,323
3,276
1,871
Restructuring, restatement and other nonrecurring costs (a)
4,668
2,406
3,319
Net income attributable to noncontrolling interest
(26)
(28)
(48)
Adjusted EBITDA (Non-GAAP)
$ 21,813
$ 55,969
$ 55,856
Non-GAAP Adjusted EBITDA Reconciliation
(a)
Restructuring,
restatement
and
other
nonrecurring
costs
Includes
restructuring
costs,
pre-petition
and
post-emergence
professional
fees
associated
with
our
bankruptcy proceedings and fees related to third parties for services performed in
connection with the review and investigation of revenue transactions examined and
the restatement of the Company’s 2004 through 2008 financial statements.
|
 Non-GAAP Net Debt & Leverage Ratios Reconciliation
Six Months Ended
Six Months Ended
Twelve Months Ended
Twelve Months Ended
June 29, 2012
June 29, 2012
December 31, 2011
December 31, 2011
December 31, 2010
December 31, 2010
(in thousands of dollars, except ratio information)
(in thousands of dollars, except ratio information)
Debt
Debt
($53,000)
($53,000)
($68,000)
($68,000)
($107,575)
($107,575)
Less: cash and cash equivalents
Less: cash and cash equivalents
55,758
55,758
54,835
54,835
56,781
56,781
Net Debt (Non-GAAP) (a)
$2,758
$2,758
($13,165)
($13,165)
($50,794)
($50,794)
Total Debt
Total Debt
($53,000)
($53,000)
($68,000)
($68,000)
($107,575)
($107,575)
Adjusted EBITDA (non-GAAP) (b)
$21,813
$21,813
$55,969
$55,969
$55,856
$55,856
Total Debt/Adjusted EBITDA
Total Debt/Adjusted EBITDA
2.4
2.4
1.2
1.2
1.9
1.9
Total Equity
Total Equity
$218,280
$218,280
$209,360
$209,360
$178,678
$178,678
Total Debt/Total Equity
Total Debt/Total Equity
24%
24%
32%
32%
60%
60%
(a)
(a)
Net debt is defined as total debt less cash and cash equivalents.
(b)
(b)
For a definition of Adjusted EBITDA, refer to the Non-GAAP Adjusted EBITDA
Reconciliation page. 17 |
 Non-GAAP Free Cash Flow Reconciliation*
18
Six Months Ended
Twelve Months Ended
June 29, 2012
December 31, 2011
December 31, 2010
(in thousands of dollars)
Cash provided by (used in) operating activities
$18,851
$45,173
($4,738)
Less: Capital expenditures
2,625
4,217
2,659
Free Cash Flow (Non-GAAP)
$16,226
$40,956
($7,397)
* Free Cash Flow includes the cash flows of Continuing and Discontinued
Operations |