Attached files
| file | filename |
|---|---|
| 8-K - EXELIS INC. 8-K - Exelis Inc. | a50365851.htm |
| EX-99.1 - EXHIBIT 99.1 - Exelis Inc. | a50365851ex99-1.htm |
Exhibit 99.2

Second Quarter 2012
Earnings Call August 3, 2012 Dave Melcher Chief Executive Officer and
President Peter Milligan Chief Financial Officer SAFE HARBOR STATEMENT
Safe Harbor Statement under the Private Securities Litigation Reform Act
of 1995 (the “Act”): Certain material presented herein includes
forward-looking statements intended to qualify for the safe harbor from
liability established by the Act. These forward-looking statements
include, but are not limited to, statements about the separation of the
Company from ITT Corporation, the terms and the effect of the
separation, the nature and impact of such a separation, capitalization
of the Company, future strategic plans and other statements that
describe the Company’s business strategy, outlook, objectives, plans,
intentions or goals, and any discussion of future operating or financial
performance. Whenever used, words such as “anticipate,” “estimate,”
“expect,” “project,” “intend,” “plan,” “believe,” “target” and other
terms of similar meaning are intended to identify such forward-looking
statements. Forward-looking statements are uncertain and to some extent
unpredictable, and involve known and unknown risks, uncertainties and
other important factors that could cause actual results to differ
materially from those expressed or implied in, or reasonably inferred
from, such forward-looking statements. Factors that could cause results
to differ materially from those anticipated include, but are not limited
to: In addition, there are risks and uncertainties relating to the
separation including whether those transactions will result in any tax
liability, the operational and financial profile of the Company or any
of its businesses after giving effect to the separation, and the ability
of the Company to operate as an independent entity. The Company
undertakes no obligation to update any forward-looking statements,
whether as a result of new information, future events or otherwise,
except as required by law. In addition, forward-looking statements are
subject to certain risks and uncertainties that could cause actual
results to differ materially from the Company’s historical experience
and our present expectations or projections. These risks and
uncertainties include, but are not limited to, those described in Exelis
Inc.’s Annual Report on Form 10-K for the fiscal year ended December 31,
2011 and those described from time to time in our future reports filed
with the Securities and Exchange Commission. .. Our dependence on the
defense industry and the business risks peculiar to that industry,
including changing priorities or reductions in the U.S. Government or
international defense budgets; .. Government regulations and compliance
therewith, including changes to the Department of Defense procurement
process; .. Our international operations, including sales to foreign
customers; .. Competition, industry capacity and production rates; ..
Misconduct of our employees, subcontractors, agents and business
partners; .. The level of returns on postretirement benefit plan assets
and potential employee benefit plan contributions and other employment
and pension matters; .. Changes in interest rates and other factors that
affect earnings and cash flows; .. The mix of our contracts and
programs, our performance, and our ability to control costs; ..
Governmental investigations; .. Our level of indebtedness and our
ability to make payments on or service our indebtedness; ..
Subcontractor performance; .. Economic and capital markets conditions;
.. The availability and pricing of raw materials and components; ..
Ability to retain and recruit qualified personnel; .. Protection of
intellectual property rights; .. Changes in technology; .. Contingencies
related to actual or alleged environmental contamination, claims and
concerns; .. Security breaches and other disruptions to our information
technology and operations; and .. Unanticipated changes in our tax
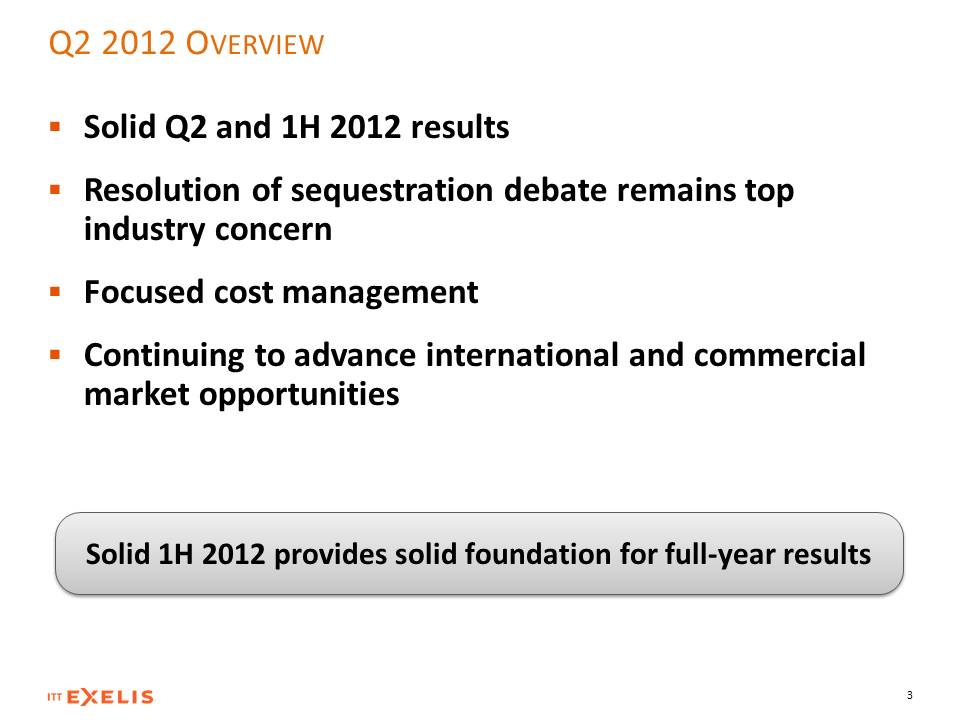
provisions or exposure to additional income tax liabilities. 2 Q2 2012
OVERVIEW .. Solid Q2 and 1H 2012 results .. Resolution of sequestration
debate remains top industry concern .. Focused cost management ..
Continuing to advance international and commercial market opportunities
3 Solid 1H 2012 provides solid foundation for full-year results ..
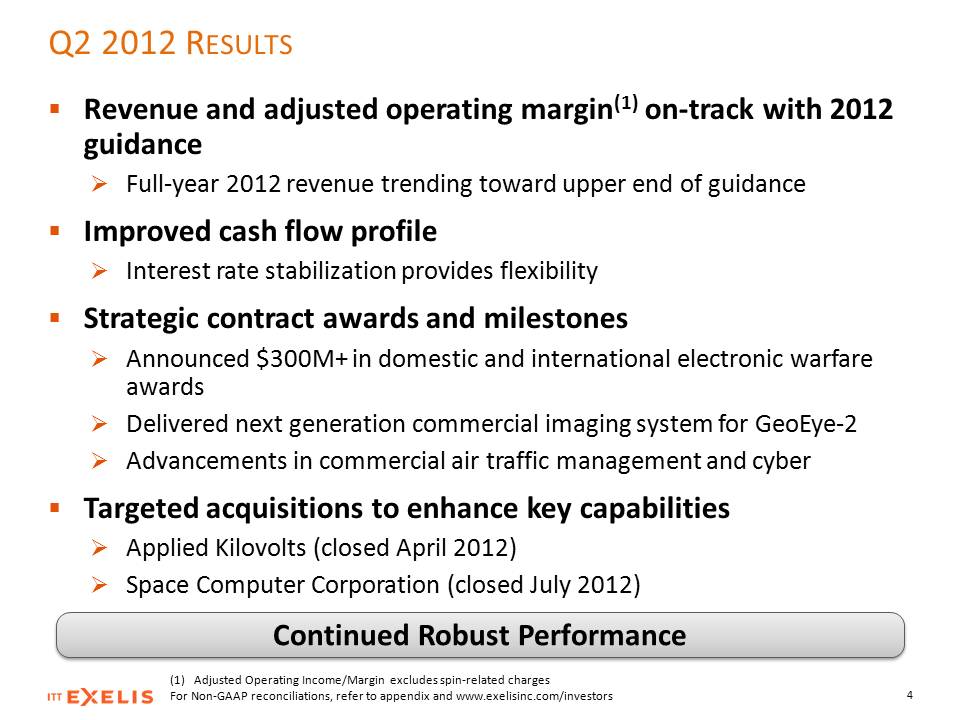
Revenue and adjusted operating margin(1) on-track with 2012 guidance ..
Full-year 2012 revenue trending toward upper end of guidance .. Improved
cash flow profile .. Interest rate stabilization provides flexibility ..
Strategic contract awards and milestones .. Announced $300M+ in domestic
and international electronic warfare awards .. Delivered next generation
commercial imaging system for GeoEye-2 .. Advancements in commercial air
traffic management and cyber .. Targeted acquisitions to enhance key
capabilities .. Applied Kilovolts (closed April 2012) .. Space Computer
Corporation (closed July 2012) Continued Robust Performance Q2 2012
RESULTS (1) Adjusted Operating Income/Margin excludes spin-related
charges For Non-GAAP reconciliations, refer to appendix and
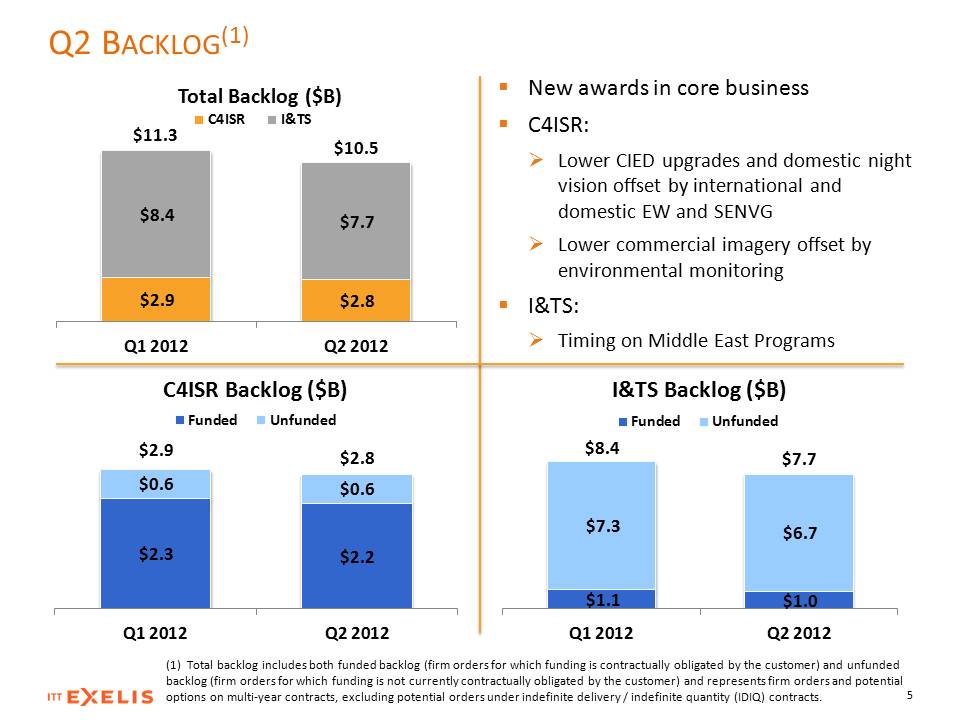
www.exelisinc.com/investors 4 $2.9 $2.8 $8.4 $7.7 Q1 2012 Q2 2012 Total
Backlog ($B) C4ISR I&TS $1.1 $1.0 $7.3 $6.7 Q1 2012 Q2 2012 I&TS Backlog
($B) Funded Unfunded .. New awards in core business .. C4ISR: .. Lower
CIED upgrades and domestic night vision offset by international and
domestic EW and SENVG .. Lower commercial imagery offset by
environmental monitoring .. I&TS: .. Timing on Middle East Programs $2.3
$2.2 $0.6 $0.6 Q1 2012 Q2 2012 C4ISR Backlog ($B) Funded Unfunded $11.3
$10.5 $2.9 $7.7 (1) Total backlog includes both funded backlog (firm
orders for which funding is contractually obligated by the customer) and
unfunded backlog (firm orders for which funding is not currently
contractually obligated by the customer) and represents firm orders and
potential options on multi-year contracts, excluding potential orders
under indefinite delivery / indefinite quantity (IDIQ) contracts. 5 $2.8
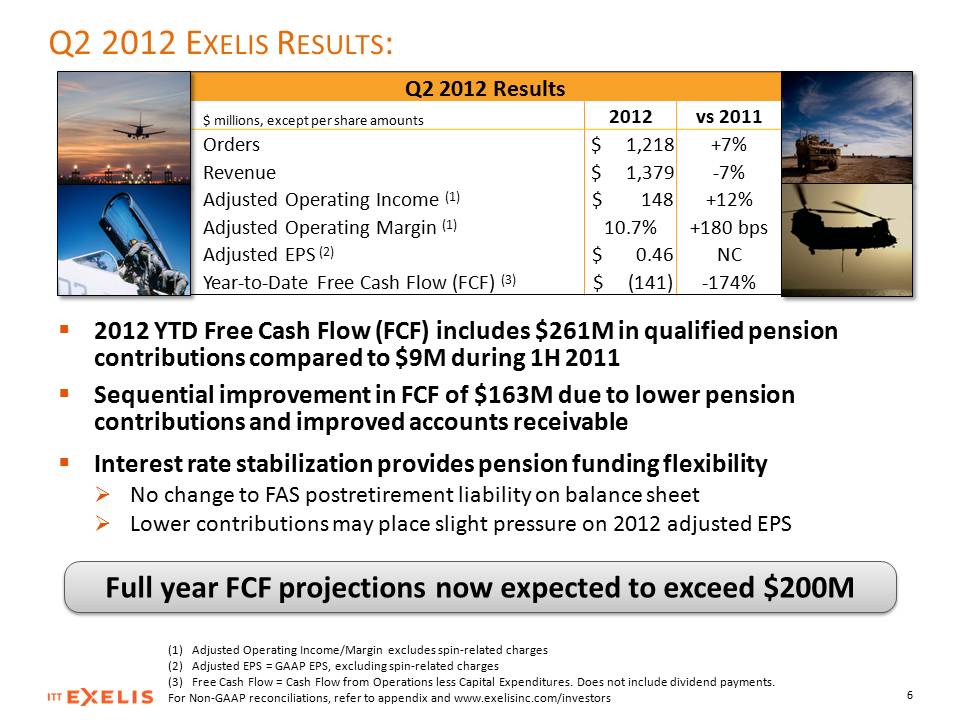
$8.4 Q2 BACKLOG(1) Q2 2012 EXELIS RESULTS: Q2 2012 Results $ millions,
except per share amounts 2012 vs 2011 Orders $ 1,218 +7% Revenue $ 1,379
-7% Adjusted Operating Income (1) $ 148 +12% Adjusted Operating Margin
(1) 10.7% +180 bps Adjusted EPS (2) $ 0.46 NC Year-to-Date Free Cash
Flow (FCF) (3) $ (141) -174% (1) Adjusted Operating Income/Margin
excludes spin-related charges (2) Adjusted EPS = GAAP EPS, excluding
spin-related charges (3) Free Cash Flow = Cash Flow from Operations less
Capital Expenditures. Does not include dividend payments. For Non-GAAP
reconciliations, refer to appendix and www.exelisinc.com/investors 6 ..
2012 YTD Free Cash Flow (FCF) includes $261M in qualified pension
contributions compared to $9M during 1H 2011 .. Sequential improvement
in FCF of $163M due to lower pension contributions and improved accounts
receivable .. Interest rate stabilization provides pension funding
flexibility .. No change to FAS postretirement liability on balance
sheet .. Lower contributions may place slight pressure on 2012 adjusted
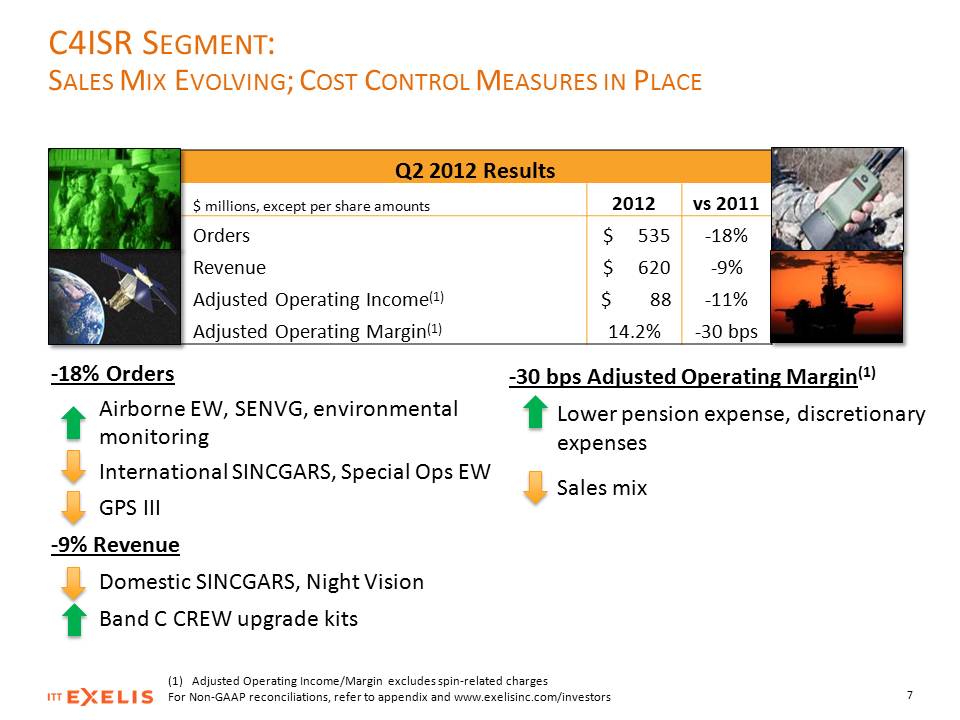
EPS Full year FCF projections now expected to exceed $200M -30 bps
Adjusted Operating Margin(1) Lower pension expense, discretionary
expenses Sales mix -18% Orders Airborne EW, SENVG, environmental
monitoring International SINCGARS, Special Ops EW GPS III -9% Revenue
Domestic SINCGARS, Night Vision Band C CREW upgrade kits C4ISR SEGMENT:
SALES MIX EVOLVING; COST CONTROL MEASURES IN PLACE (1) Adjusted
Operating Income/Margin excludes spin-related charges For Non-GAAP
reconciliations, refer to appendix and www.exelisinc.com/investors Q2
2012 Results $ millions, except per share amounts 2012 vs 2011 Orders $
535 -18% Revenue $ 620 -9% Adjusted Operating Income(1) $ 88 -11%
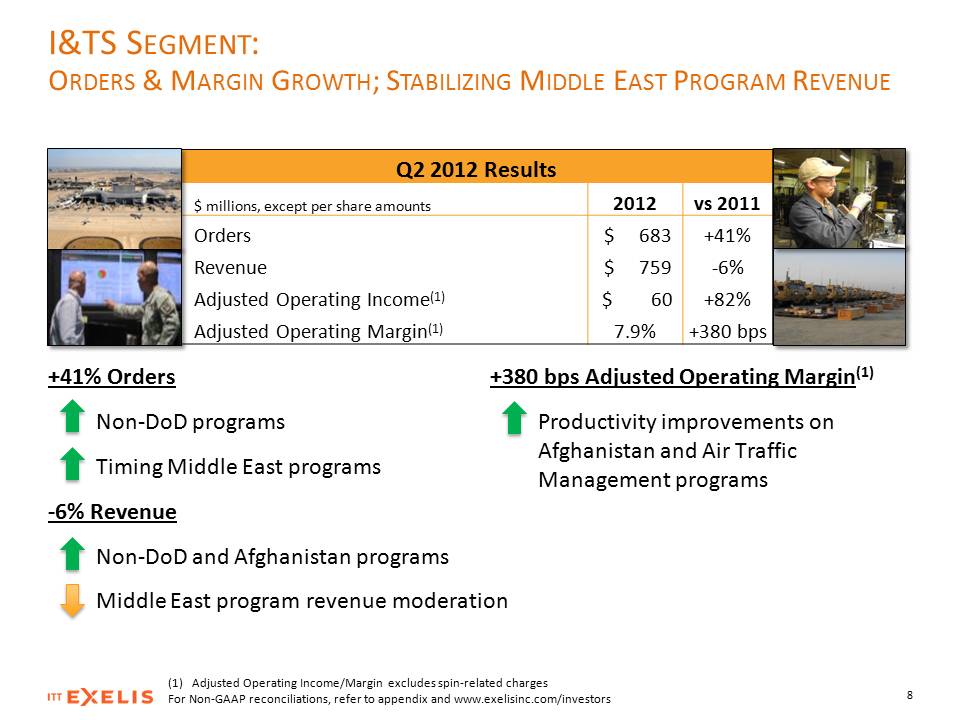
Adjusted Operating Margin(1) 14.2% -30 bps 7 +380 bps Adjusted
Operating Margin(1) Productivity improvements on Afghanistan and Air
Traffic Management programs +41% Orders Non-DoD programs Timing Middle
East programs -6% Revenue Non-DoD and Afghanistan programs Middle East
program revenue moderation I&TS SEGMENT: ORDERS & MARGIN GROWTH;
STABILIZING MIDDLE EAST PROGRAM REVENUE (1) Adjusted Operating
Income/Margin excludes spin-related charges For Non-GAAP
reconciliations, refer to appendix and www.exelisinc.com/investors Q2
2012 Results $ millions, except per share amounts 2012 vs 2011 Orders $
683 +41% Revenue $ 759 -6% Adjusted Operating Income(1) $ 60 +82%
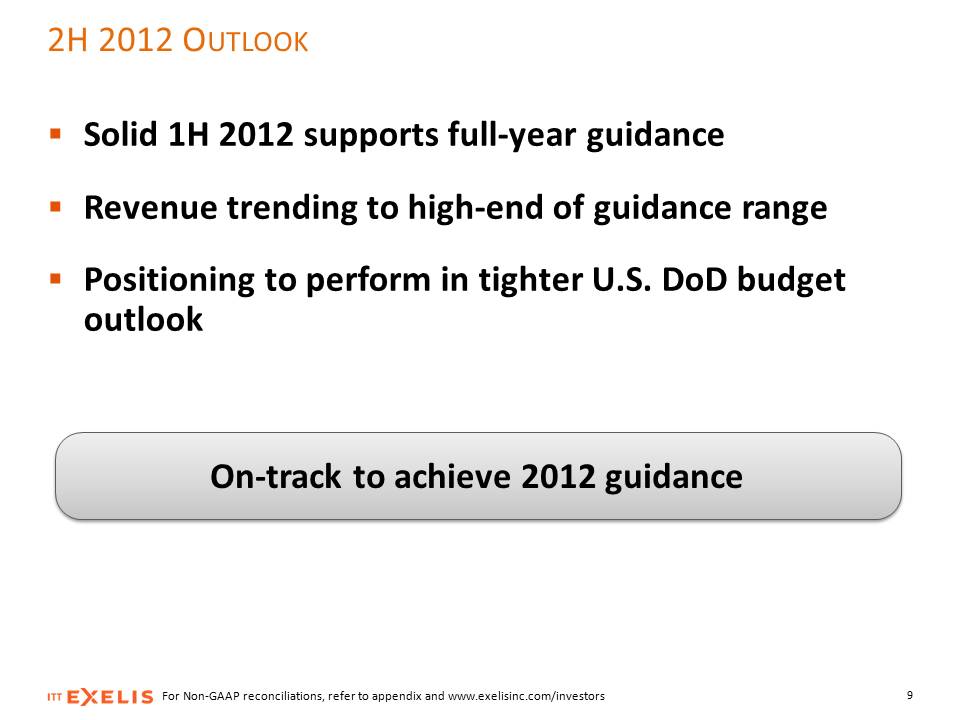
Adjusted Operating Margin(1) 7.9% +380 bps 8 2H 2012 OUTLOOK For
Non-GAAP reconciliations, refer to appendix and
www.exelisinc.com/investors On-track to achieve 2012 guidance .. Solid
1H 2012 supports full-year guidance .. Revenue trending to high-end of
guidance range .. Positioning to perform in tighter U.S. DoD budget
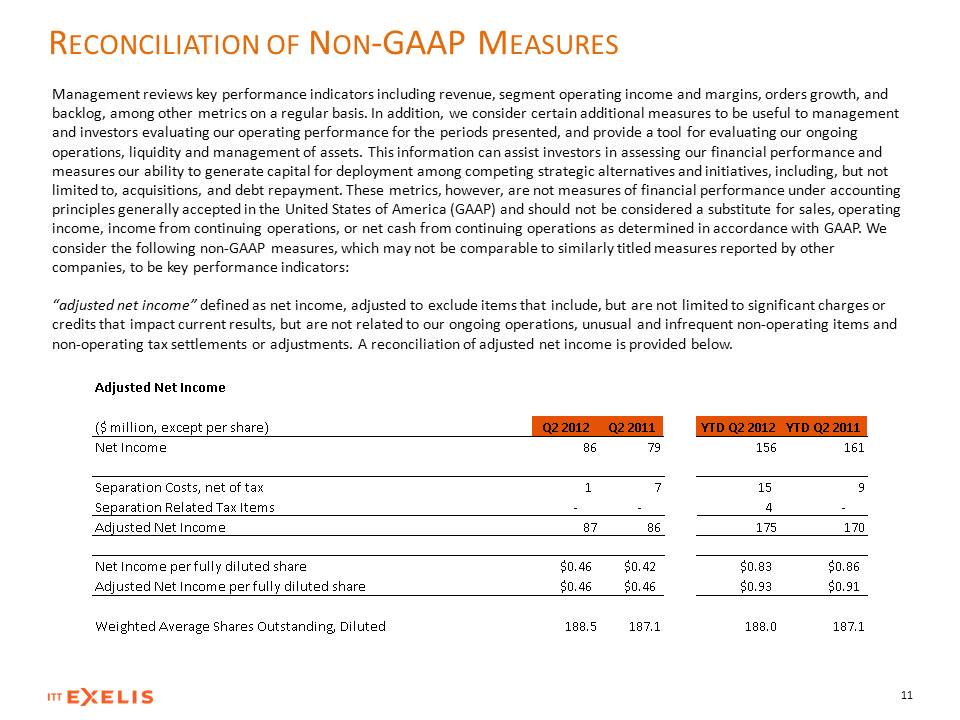
outlook 9 Appendix RECONCILIATION OF NON-GAAP MEASURES Management
reviews key performance indicators including revenue, segment operating
income and margins, orders growth, and backlog, among other metrics on a
regular basis. In addition, we consider certain additional measures to
be useful to management and investors evaluating our operating
performance for the periods presented, and provide a tool for evaluating
our ongoing operations, liquidity and management of assets. This
information can assist investors in assessing our financial performance
and measures our ability to generate capital for deployment among
competing strategic alternatives and initiatives, including, but not
limited to, acquisitions, and debt repayment. These metrics, however,
are not measures of financial performance under accounting principles
generally accepted in the United States of America (GAAP) and should not
be considered a substitute for sales, operating income, income from
continuing operations, or net cash from continuing operations as
determined in accordance with GAAP. We consider the following non-GAAP
measures, which may not be comparable to similarly titled measures
reported by other companies, to be key performance indicators: “adjusted
net income” defined as net income, adjusted to exclude items that
include, but are not limited to significant charges or credits that
impact current results, but are not related to our ongoing operations,
unusual and infrequent non-operating items and non-operating tax
settlements or adjustments. A reconciliation of adjusted net income is
provided below. 11 Adjusted Net Income ($ million, except per share) Q2
2012 Q2 2011 YTD Q2 2012 YTD Q2 2011 Net Income 86 79 156 161 Separation
Costs, net of tax 1 7 15 9 Separation Related Tax Items - - 4 - Adjusted
Net Income 87 86 175 170 Net Income per fully diluted share $0.46 $0.42
$0.83 $0.86 Adjusted Net Income per fully diluted share $0.46 $0.46
$0.93 $0.91 Weighted Average Shares Outstanding, Diluted 188.5 187.1
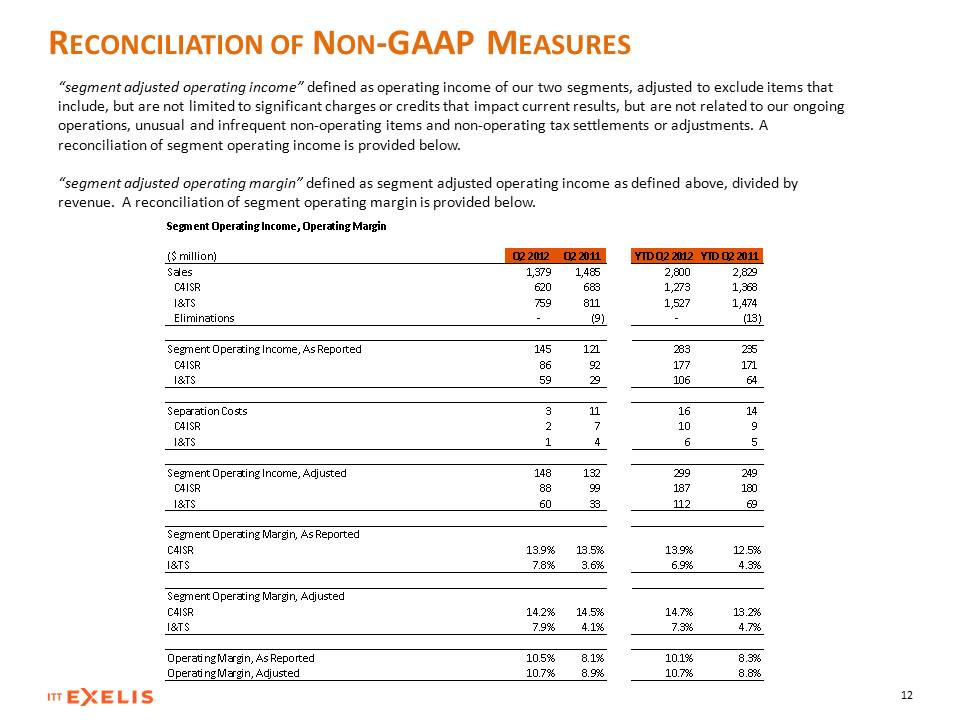
188.0 187.1 RECONCILIATION OF NON-GAAP MEASURES “segment adjusted
operating income” defined as operating income of our two segments,
adjusted to exclude items that include, but are not limited to
significant charges or credits that impact current results, but are not
related to our ongoing operations, unusual and infrequent non-operating
items and non-operating tax settlements or adjustments. A reconciliation
of segment operating income is provided below. “segment adjusted
operating margin” defined as segment adjusted operating income as
defined above, divided by revenue. A reconciliation of segment operating
margin is provided below. 12 Segment Operating Income, Operating Margin
($ million) Q2 2012 Q2 2011 YTD Q2 2012 YTD Q2 2011 Sales 1,379 1,485
2,800 2,829 C4ISR 620 683 1,273 1,368 I&TS 759 811 1,527 1,474
Eliminations - (9) - (13) Segment Operating Income, As Reported 145 121
283 235 C4ISR 86 92 177 171 I&TS 59 29 106 64 Separation Costs 3 11 16
14 C4ISR 2 7 10 9 I&TS 1 4 6 5 Segment Operating Income, Adjusted 148
132 299 249 C4ISR 88 99 187 180 I&TS 60 33 112 69 Segment Operating
Margin, As Reported C4ISR 13.9% 13.5% 13.9% 12.5% I&TS 7.8% 3.6% 6.9%
4.3% Segment Operating Margin, Adjusted C4ISR 14.2% 14.5% 14.7% 13.2%
I&TS 7.9% 4.1% 7.3% 4.7% Operating Margin, As Reported 10.5% 8.1% 10.1%
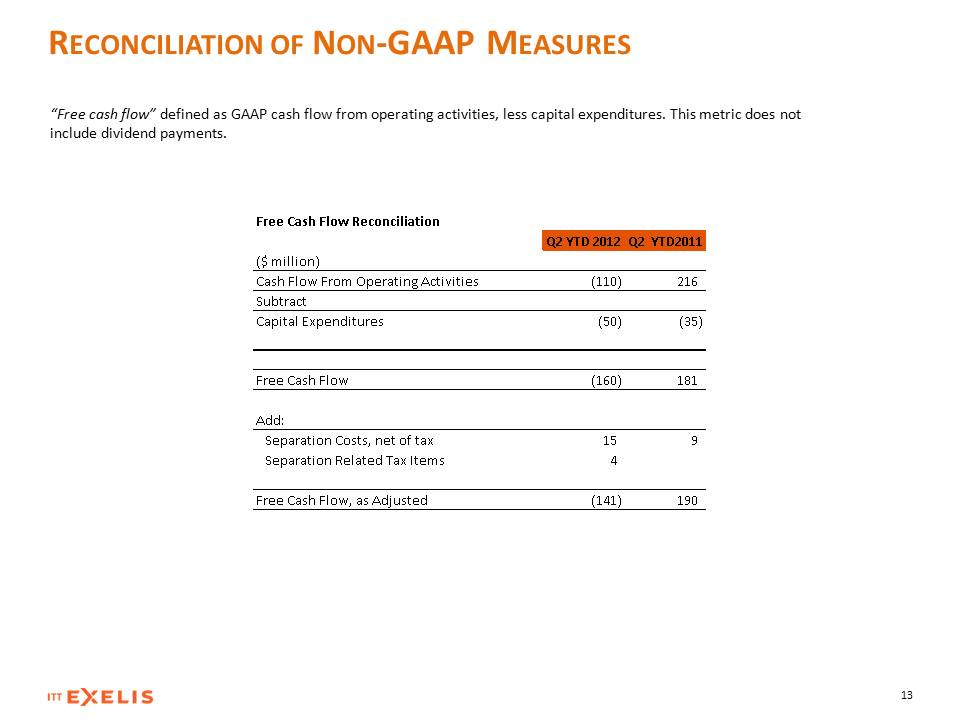
8.3% Operating Margin, Adjusted 10.7% 8.9% 10.7% 8.8% RECONCILIATION OF
NON-GAAP MEASURES “Free cash flow” defined as GAAP cash flow from
operating activities, less capital expenditures. This metric does not
include dividend payments. 13 Free Cash Flow Reconciliation Q2 YTD 2012
Q2 YTD2011 ($ million) Cash Flow From Operating Activities (110) 216
Subtract Capital Expenditures (50) (35) Free Cash Flow (160) 181 Add:
Separation Costs, net of tax 15 9 Separation Related Tax Items 4 Free
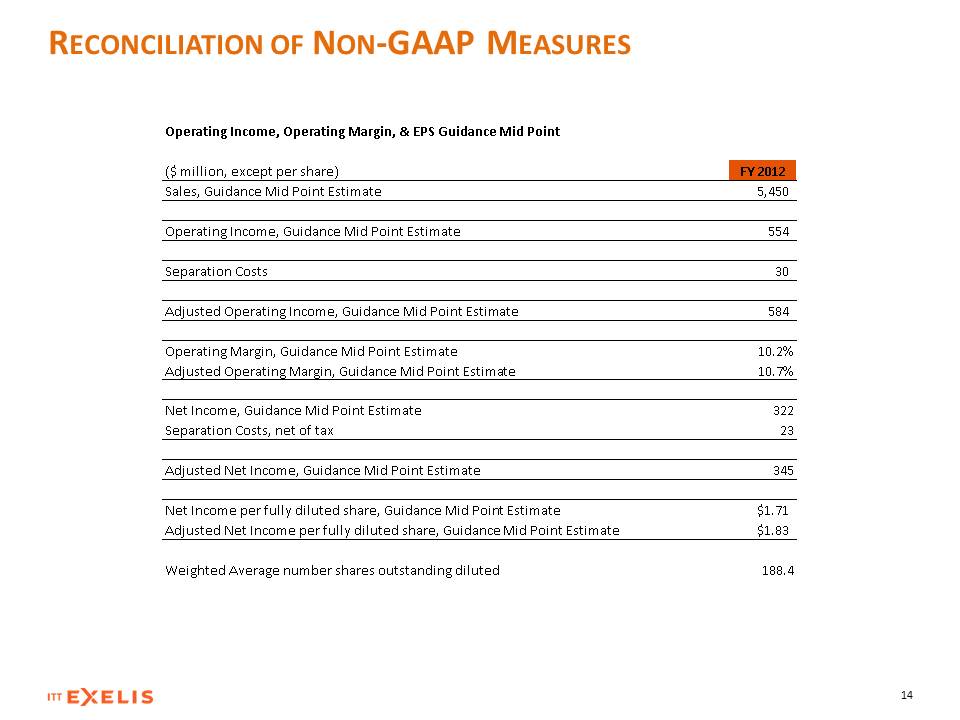
Cash Flow, as Adjusted (141) 190 14 RECONCILIATION OF NON-GAAP
MEASURES Operating Income, Operating Margin, & EPS Guidance Mid Point ($
million, except per share) FY 2012 Sales, Guidance Mid Point Estimate
5,450 Operating Income, Guidance Mid Point Estimate 554 Separation Costs
30 Adjusted Operating Income, Guidance Mid Point Estimate 584 Operating
Margin, Guidance Mid Point Estimate 10.2% Adjusted Operating Margin,
Guidance Mid Point Estimate 10.7% Net Income, Guidance Mid Point
Estimate 322 Separation Costs, net of tax 23 Adjusted Net Income,
Guidance Mid Point Estimate 345 Net Income per fully diluted share,
Guidance Mid Point Estimate $1.71 Adjusted Net Income per fully diluted
share, Guidance Mid Point Estimate $1.83 Weighted Average number shares
outstanding diluted 188.4