Attached files
| file | filename |
|---|---|
| 8-K - FORM 8-K - MUTUALFIRST FINANCIAL INC | v320261_8-k.htm |

MutualFirst Financial, Inc. KBW 2012 Community Bank Investor Conference July 31, 2012 Symbol: MFSF

MutualFirst Financial, Inc. David Heeter President and CEO Chris Cook Chief Financial Officer

MutualFirst Financial, Inc. Forward Looking Statement This presentation contains statements which constitute forward looking statements within the meaning of the Private Securities Litigation Reform Act of 1995. These statements may appear in a number of places in this presentation and include statements regarding the intent, belief, outlook, estimate or expectations of the company, its directors or its officers primarily with respect to future events and the future financial performance of the company, including but not limited to preliminary estimated ProForma combined financial information. Readers of this presentation are cautioned that any such forward looking statements are not guarantees of future events or performance and involve risk and uncertainties, and that actual results may differ materially from those in the forward looking statements as a result of various factors. These factors include, but are not limited to, the loss of deposits and loan demand to competitors; substantial changes in financial markets; changes in real estate values and the real estate market; regulatory changes; or other risk factors discussed in the latest SEC form 10 - k. The Company does not undertake – and specifically disclaims any obligation – to publicly release the result of any revisions which may be made to any forward - looking statements to reflect events or circumstances after the date of such statements or to reflect the occurrence of anticipated or unanticipated events.

MutualFirst Financial, Inc. David Heeter President and CEO

MutualFirst Financial, Inc. MutualBank Today • Headquartered in Muncie, Indiana • 123 years of continuous operations • $1.5 billion in total assets • $963 million in gross loans • $1.2 billion in deposits • 426 staff members • 130,000 total accounts
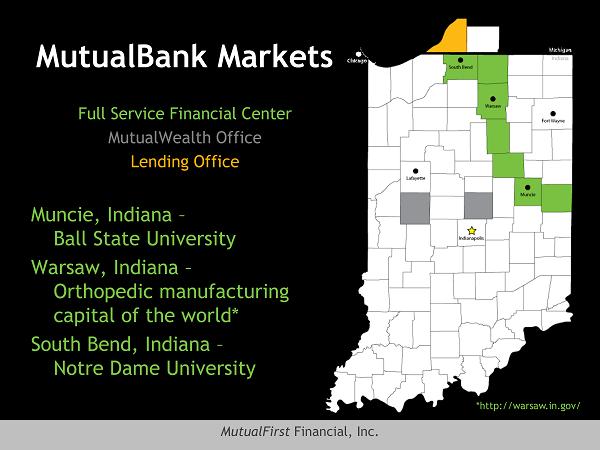
MutualFirst Financial, Inc. MutualBank Markets Muncie, Indiana – Ball State University Warsaw, Indiana – Orthopedic manufacturing capital of the world* South Bend, Indiana – Notre Dame University * http://warsaw.in.gov/ Full Service Financial Center MutualWealth Office Lending Office
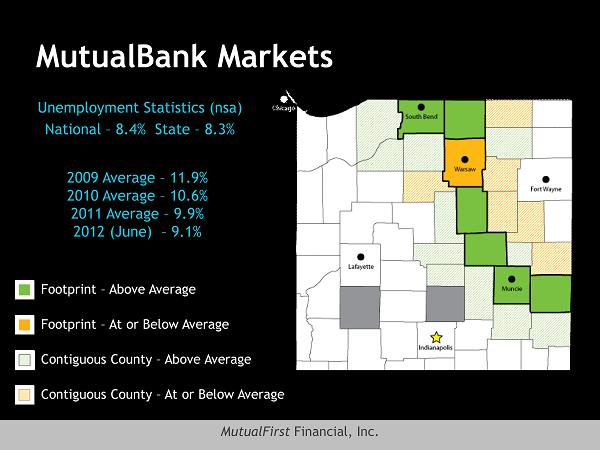
MutualFirst Financial, Inc. MutualBank Markets Unemployment Statistics ( nsa ) National – 8.4% State – 8.3% Footprint – Above Average Footprint – At or Below Average Contiguous County – Above Average Contiguous County – At or Below Average 2009 Average – 11.9% 2010 Average – 10.6% 2011 Average – 9.9% 2012 (June) – 9.1%

MutualFirst Financial, Inc. Charter Change Thrift Holding Company Bank Holding Company Washington Centric Attitude Examiners living in communities we serve $200,000+ of Savings Federal Savings Bank State Commercial Bank

MutualFirst Financial, Inc. Redeemed TARP Small Business Lending Fund

MutualFirst Financial, Inc. Vision & Values

MutualFirst Financial, Inc. Vision We help people live better lives. Values Character Compassion Class Competition

MutualFirst Financial, Inc. Strategic Plan To enhance Shareholder Value through: Credit Quality Earnings Capital Market Management

MutualFirst Financial, Inc. Chris Cook Chief Financial Officer

MutualFirst Financial, Inc. Total Assets $1,000,000 $1,050,000 $1,100,000 $1,150,000 $1,200,000 $1,250,000 $1,300,000 $1,350,000 $1,400,000 $1,450,000 $1,500,000 2009 2010 2011 2nd Qtr 2012 $1,400,885 $1,406,902 $1,427,193 $1,471,448 *In Thousands

MutualFirst Financial, Inc. Net Loan Balances $0 $200,000 $400,000 $600,000 $800,000 $1,000,000 $1,200,000 2009 2010 2011 2nd Qtr 2012 $1,062,215 $989,384 $901,900 $947,019 *In Thousands

MutualFirst Financial, Inc. Loan Mix 50% 21% 29% 2010 Mortgage Consumer Commercial June 2012

MutualFirst Financial, Inc. Credit Quality 3.03% 5.54% 6.39% 6.02% 4.81% 2.79% 3.29% 3.02% 2.86% 1.90% 1.90% 2.88% 3.19% 3.47% 2.61% 0.00% 1.00% 2.00% 3.00% 4.00% 5.00% 6.00% 7.00% Improving Credit Quality Classified Loans 30-89 Day Delinquency Non-Performing Loans * As Percent of Total Loans
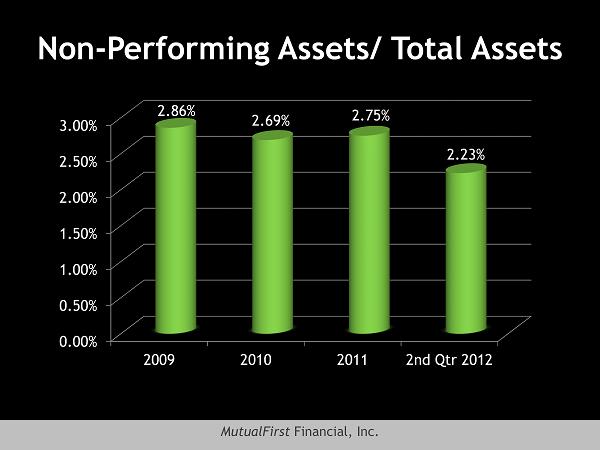
MutualFirst Financial, Inc. Non - Performing Assets/ Total Assets 0.00% 0.50% 1.00% 1.50% 2.00% 2.50% 3.00% 2009 2010 2011 2nd Qtr 2012 2.86% 2.69% 2.75% 2.23%

MutualFirst Financial, Inc. Allowance for Loan Loss / Non - Performing Loans 0.00% 10.00% 20.00% 30.00% 40.00% 50.00% 60.00% 70.00% 2009 2010 2011 2nd Qtr 2012 50.38% 51.60% 52.81% 64.36%
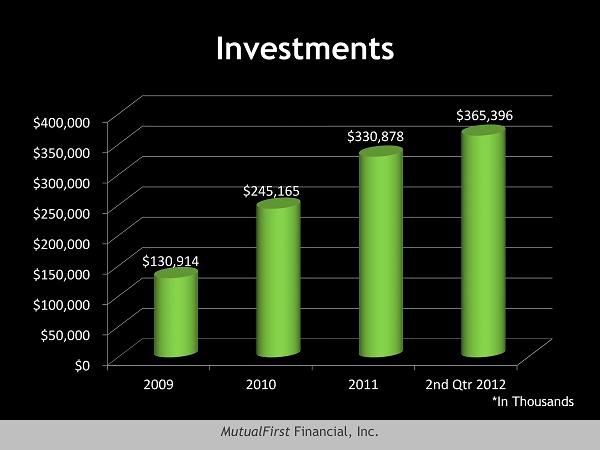
MutualFirst Financial, Inc. Investments $0 $50,000 $100,000 $150,000 $200,000 $250,000 $300,000 $350,000 $400,000 2009 2010 2011 2nd Qtr 2012 $130,914 $245,165 $330,878 $365,396 *In Thousands
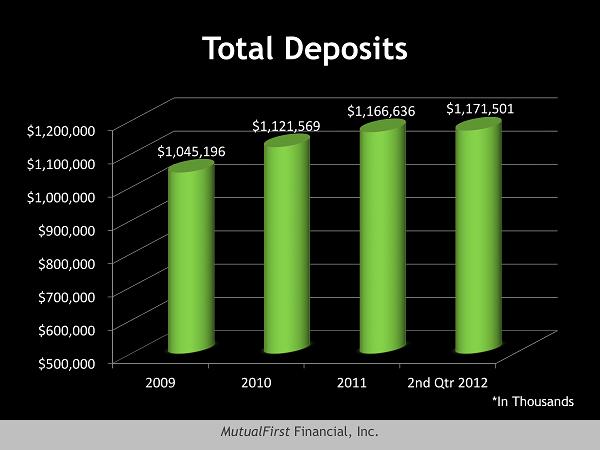
MutualFirst Financial, Inc. Total Deposits $500,000 $600,000 $700,000 $800,000 $900,000 $1,000,000 $1,100,000 $1,200,000 2009 2010 2011 2nd Qtr 2012 $1,045,196 $1,121,569 $1,166,636 $1,171,501 *In Thousands
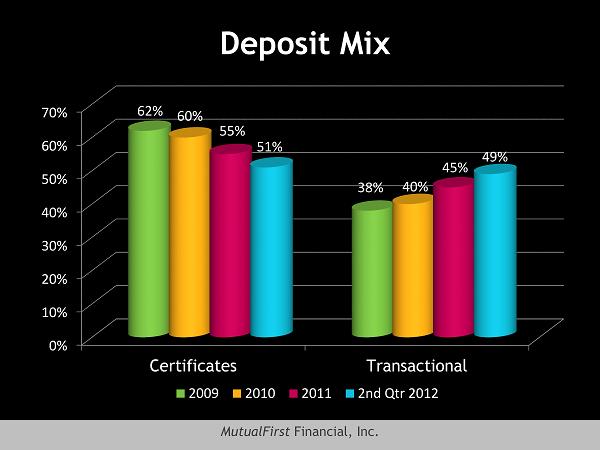
MutualFirst Financial, Inc. Deposit Mix 0% 10% 20% 30% 40% 50% 60% 70% Certificates Transactional 62% 38% 60% 40% 55% 45% 51% 49% 2009 2010 2011 2nd Qtr 2012

MutualFirst Financial, Inc. Total Stockholder’s Equity $100,000 $105,000 $110,000 $115,000 $120,000 $125,000 $130,000 $135,000 $140,000 2009 2010 2011 2nd Qtr 2012 $129,727 $131,140 $132,627 $136,641 *In Thousands

MutualFirst Financial, Inc. Tangible Book Value $100,000 $105,000 $110,000 $115,000 $120,000 $125,000 $130,000 $135,000 $140,000 2009 2010 2011 2nd Qtr 2012 $129,727 $131,140 $132,627 $136,641 $0.00 $2.00 $4.00 $6.00 $8.00 $10.00 $12.00 $14.00 $16.00 2009 2010 2011 2nd Qtr 2012 $13.09 $13.49 $14.38 $15.00
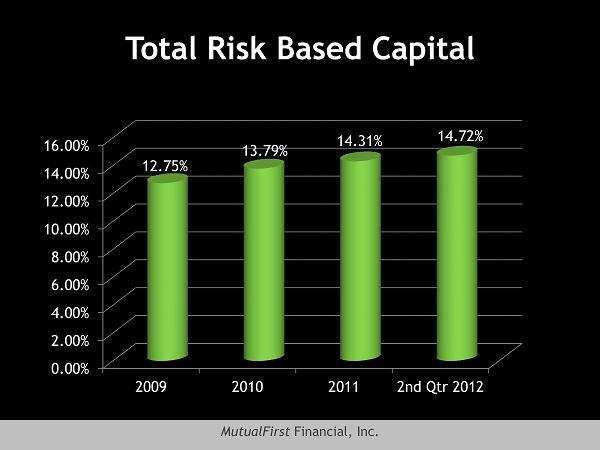
MutualFirst Financial, Inc. Total Risk Based Capital 0.00% 2.00% 4.00% 6.00% 8.00% 10.00% 12.00% 14.00% 16.00% 2009 2010 2011 2nd Qtr 2012 12.75% 13.79% 14.31% 14.72%

MutualFirst Financial, Inc. Financial Performance

MutualFirst Financial, Inc. Earnings Per Share $(0.20) $(0.15) $(0.10) $(0.05) $- $0.05 $0.10 $0.15 $0.20 1st Qtr 2011 2nd Qtr 2011 3rd Qtr 2011 4th Qtr 2011 1st Qtr 2012 2nd Qtr 2012 $(0.17) $0.18 $0.09 $0.10 $0.15 $0.18

MutualFirst Financial, Inc. Net Interest Income $5,000 $6,000 $7,000 $8,000 $9,000 $10,000 $11,000 1st Qtr 2011 2nd Qtr 2011 3rd Qtr 2011 4th Qtr 2011 1st Qtr 2012 2nd Qtr 2012 $10,315 $10,554 $10,395 $10,055 $9,869 $10,350 *In Thousands

MutualFirst Financial, Inc. Net Interest Margin 2.00% 2.20% 2.40% 2.60% 2.80% 3.00% 3.20% 1st Qtr 2011 2nd Qtr 2011 3rd Qtr 2011 4th Qtr 2011 1st Qtr 2012 2nd Qtr 2012 3.14% 3.19% 3.19% 3.09% 3.03% 3.10% *In Thousands

MutualFirst Financial, Inc. $0 $1,000 $2,000 $3,000 $4,000 $5,000 $6,000 1st Qtr 2011 2nd Qtr 2011 3rd Qtr 2011 4th Qtr 2011 1st Qtr 2012 2nd Qtr 2012 $2,648 $3,312 $4,664 $5,387 $2,928 $3,705 Income Non - Interest Income *In Thousands

MutualFirst Financial, Inc. Non - Interest Expense $5,000 $6,000 $7,000 $8,000 $9,000 $10,000 $11,000 1st Qtr 2011 2nd Qtr 2011 3rd Qtr 2011 4th Qtr 2011 1st Qtr 2012 2nd Qtr 2012 $10,201 $10,001 $10,036 $10,178 $9,594 $9,933 *In Thousands
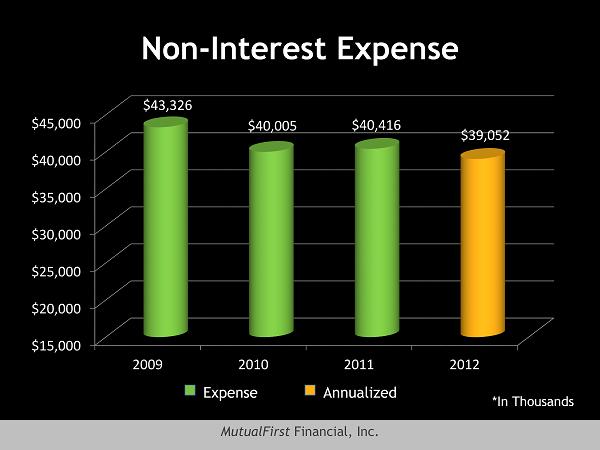
MutualFirst Financial, Inc. Non - Interest Expense $15,000 $20,000 $25,000 $30,000 $35,000 $40,000 $45,000 2009 2010 2011 2012 $43,326 $40,005 $40,416 $39,052 *In Thousands Expense Annualized

MutualFirst Financial, Inc. Trust Investment Retirement Plan Services

MutualFirst Financial, Inc. Assets Under Management $340,000 $360,000 $380,000 $400,000 $420,000 $440,000 $460,000 2009 2010 2011 2nd Qtr 2012 $379,050 $453,754 $437,969 $443,981 *In Thousands
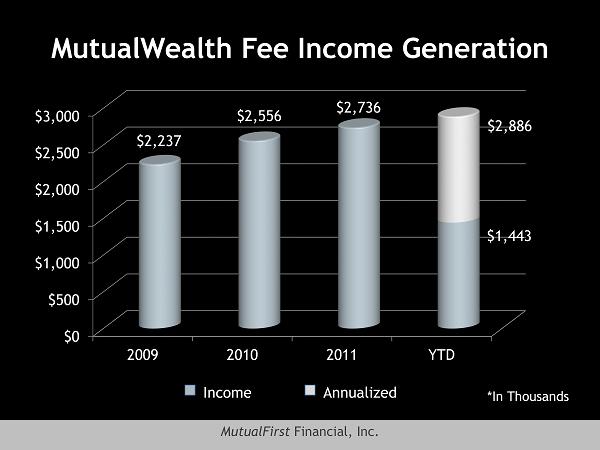
MutualFirst Financial, Inc. MutualWealth Fee Income Generation $0 $500 $1,000 $1,500 $2,000 $2,500 $3,000 2009 2010 2011 YTD $2,237 $2,556 $ 2,886 $1,443 $2,736 *In Thousands Income Annualized

MutualFirst Financial, Inc. Retirement Plans Mutual Funds Annuities 529 Plans Stocks & Bonds 401k Rollovers

MutualFirst Financial, Inc. MutualFinancial Gross Commission $0 $200 $400 $600 $800 $1,000 $1,200 2009 2010 2011 YTD $665 $1,115 $819 $543 $1,086 *In Thousands Income Annualized

MutualFirst Financial, Inc. Market Comparisons

MutualFirst Financial, Inc. YTD Stock Performance 0.00% 10.00% 20.00% 30.00% 40.00% 50.00% 60.00% 70.00% MFSF S&P KBW Bank Index

MutualFirst Financial, Inc. Price to Tangible Book 0.00% 10.00% 20.00% 30.00% 40.00% 50.00% 60.00% 70.00% 80.00% 90.00% 100.00% MFSF Indiana Banks National Banks 71.5% 93.8% 95.5% *KBW Price Performance Review – June 2012

MutualFirst Financial, Inc. Key Takeaways • Four consecutive quarters of EPS growth • Steady decline in expenses • Delinquency and problem loan trends improving • Value – 70% of Tangible Book Value

MutualFirst Financial, Inc. Thank You