Attached files
| file | filename |
|---|---|
| EX-99.1 - EXHIBIT 99.1 - CreXus Investment Corp. | a50364108ex99_1.htm |
| 8-K - CREXUS INVESTMENT CORP 8-K - CreXus Investment Corp. | a50364108.htm |
Exhibit 99.2
SUPPLEMENTAL INVESTMENT INFORMATION QUARTER ENDED JUNE 30, 2012 CREXUS INVESTMENT CORP. 1 ww.crexusinvestment.com
This presentation and our public documents to which we refer contain or incorporate by reference certain forward-looking statements within the meaning of Section 27A of the Securities Act of 1933 and Section 21E of the Securities Exchange Act of 1934. Forward-looking statements which are based on various assumptions (some of which are beyond our control) may be identified by reference to a future period or periods or by the use of forward-looking terminology, such as “believe,” “expect,” “anticipate,” “estimate,” “plan,” “continue,” “intend,” “should,” “may,” “would,” “will” or similar expressions, or variations on those terms or the negative of those terms. Actual results could differ materially from those set forth in forward-looking statements due to a variety of factors, including, but not limited to, our business and strategy; our ability to obtain and maintain financing arrangements and the terms of such arrangements; financing and advance rates for our targeted assets; general volatility of the markets in which we acquire assets; the implementation, timing and impact of, and changes to, various government programs; our expected assets; changes in the value of our assets; market trends in our industry, interest rates, the debt securities markets or the general economy; rates of default or decreased recovery rates on our assets; our continuing or future relationships with third parties; prepayments of the mortgage and other loans underlying our mortgage-backed or other asset-backed securities; the degree to which our hedging strategies may or may not protect us from interest rate volatility; changes in governmental regulations, tax law and rates, accounting guidance, and similar matters; our ability to maintain our qualification as a REIT for federal income tax purposes; ability to maintain our exemption from registration under the Investment Company Act of 1940, as amended; the availability of opportunities in real estate-related and other securities; the availability of qualified personnel; estimates relating to our ability to make distributions to our stockholders in the future; our understanding of our competition; interest rate mismatches between our assets and our borrowings used to finance purchases of such assets; changes in interest rates and mortgage prepayment rates; the effects of interest rate caps on our adjustable-rate mortgage-backed securities; our ability to integrate acquired assets into our existing portfolio; and our ability to realize our expectations of the advantages of acquiring assets. For a discussion of the risks and uncertainties which could cause actual results to differ from those contained in the forward-looking statements, see “Risk Factors” in our most recent annual report on Form 10-K and subsequent quarterly reports on Form 10-Q. We do not undertake, and specifically disclaim all obligations, to publicly release the result of any revisions which may be made to any forward-looking statements to reflect the occurrence of anticipated or unanticipated events or circumstances after the date of such statements. This presentation may contain statistics and other data that in some cases has been obtained from or compiled from information made available by third-party service providers. LTV ratios are based on third party appraisals, some of which were obtained when the loans were originated which in certain cases are prior to our acquiring the loans. Disclaimer CREXUS INVESTMENT CORP. 2
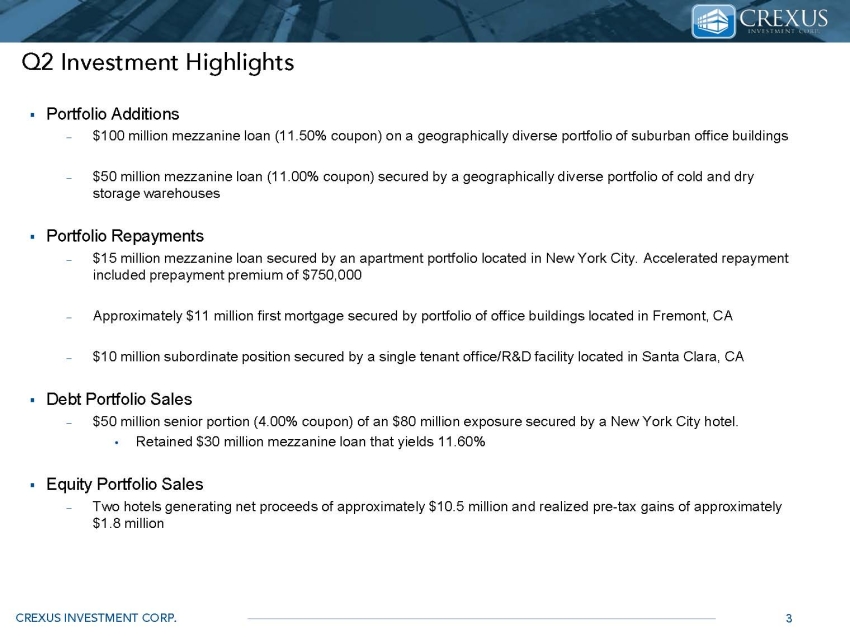
Q2 Investment Highlights Portfolio Additions –$100 million mezzanine loan (11.50% coupon) on a geographically diverse portfolio of suburban office buildings –$50 million mezzanine loan (11.00% coupon) secured by a geographically diverse portfolio of cold and dry storage warehouses Portfolio Repayments –$15 million mezzanine loan secured by an apartment portfolio located in New York City. Accelerated repayment included prepayment premium of $750,000 –Approximately $11 million first mortgage secured by portfolio of office buildings located in Fremont, CA –$10 million subordinate position secured by a single tenant office/R&D facility located in Santa Clara, CA Debt Portfolio Sales –$50 million senior portion (4.00% coupon) of an $80 million exposure secured by a New York City hotel. •Retained $30 million mezzanine loan that yields 11.60% Equity Portfolio Sales –Two hotels generating net proceeds of approximately $10.5 million and realized pre-tax gains of approximately $1.8 million CREXUS INVESTMENT CORP. 3
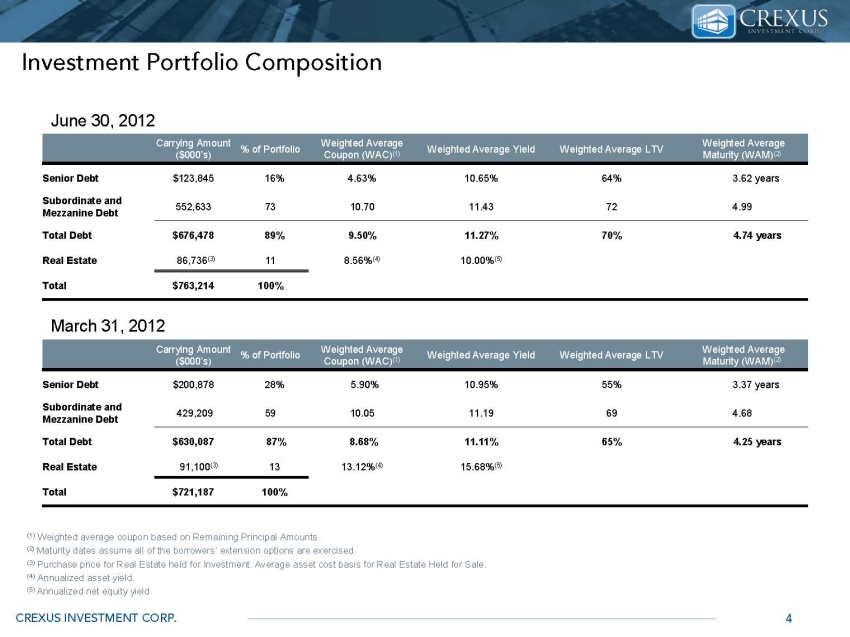
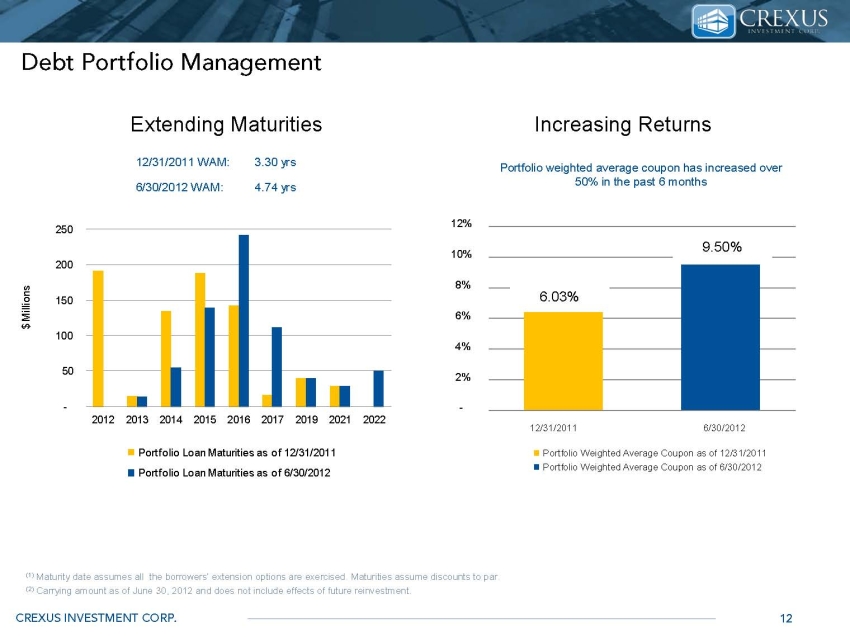
CREXUS INVESTMENT CORP. 4 Investment Portfolio Composition (1) Weighted average coupon based on Remaining Principal Amounts. (2) Maturity dates assume all of the borrowers’ extension options are exercised. (3) Purchase price for Real Estate held for Investment. Average asset cost basis for Real Estate Held for Sale. (4) Annualized asset yield. (5) Annualized net equity yield. Carrying Amount % of Portfolio Weighted Average Coupon (WAC)(1)($000’s) Weighted Average Yield Weighted Average LTV Weighted Average Maturity (WAM)(2) Senior Debt$123,84516%4.63%10.65%64%3.62 years Subordinate and Mezzanine Debt552,6337310.7011.43724.99 Total Debt$676,47889%9.50%11.27%70%4.74 years Real Estate86,736(3) 118.56%(4) 10.00%(5) Total$763,214100%June 30, 2012 March 31, 2012 Carrying Amount ($000’s) % of Portfolio Weighted Average Coupon (WAC)(1)Weighted Average Yield Weighted Average LTV Weighted Average Maturity (WAM)(2) Senior Debt$200,87828%5.90%10.95%55%3.37 years Subordinate and Mezzanine 429,209 Debt5910.0511.19694.68 Total Debt$630,08787%8.68%11.11%65%4.25 years Real Estate91,100(3) 1313.12%(4) 15.68%(5) Total$721,187100%TAL INVESTMENT INFORMATION QUARTER ENDED JUNE 30, 2012
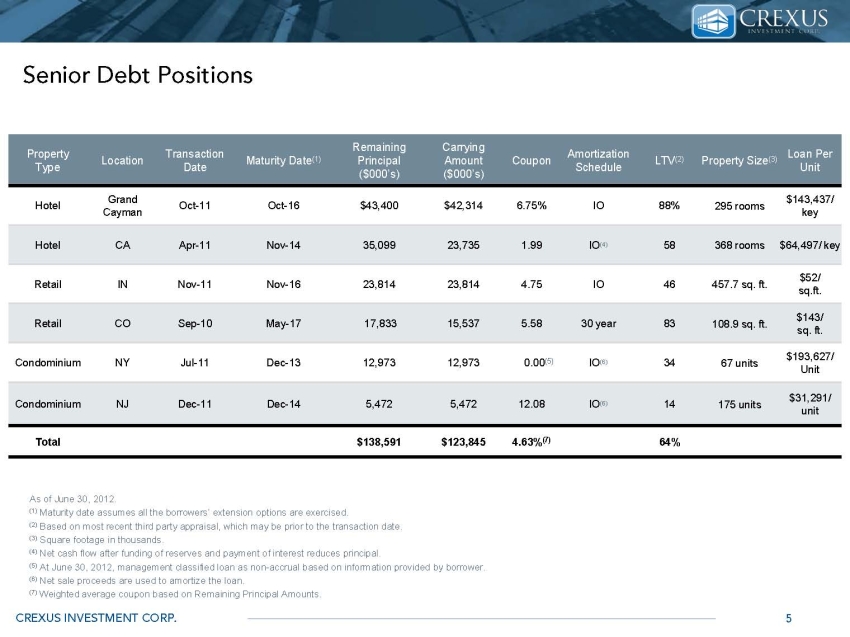
CREXUS INVESTMENT CORP. 5 Senior Debt Positions As of June 30, 2012. (1) Maturity date assumes all the borrowers’ extension options are exercised. (2) Based on most recent third party appraisal, which may be prior to the transaction date. (3) Square footage in thousands. (4) Net cash flow after funding of reserves and payment of interest reduces principal. (5) At June 30, 2012, management classified loan as non-accrual based on information provided by borrower. (6) Net sale proceeds are used to amortize the loan. (7) Weighted average coupon based on Remaining Principal Amounts. Property TypeLocation Transaction Maturity Date(1) Remaining Principal Carrying Amount Coupon Amortization Schedule LTV(2) Property Size(3)($000’s) Loan Per Unit($000’s) Hotel Grand Cayman Oct-11 Oct-16$43,400Date$42,3146.75% IO88%295 rooms$143,437/ key Hotel CA Apr-11 Nov-1435,09923,7351.99 IO(4) 58368 rooms$64,497/ key Retail IN Nov-11 Nov-1623,81423,814 IO4.7546457.7 sq. ft. $52/ sq.ft. Retail CO Sep-10 May-1717,83315,5375.5830 year83108.9 sq. ft. $143/ sq. ft. Condominium NY Jul-11 Dec-1312,97312,9730.00(5) IO(6) 3467 units$193,627/ 12.0814175 unitsUnit Condominium Total NJ Dec-11 Dec-145,4725,472 IO(6) $31,291/ unit$138,591$123,8454.63%(7) 64%
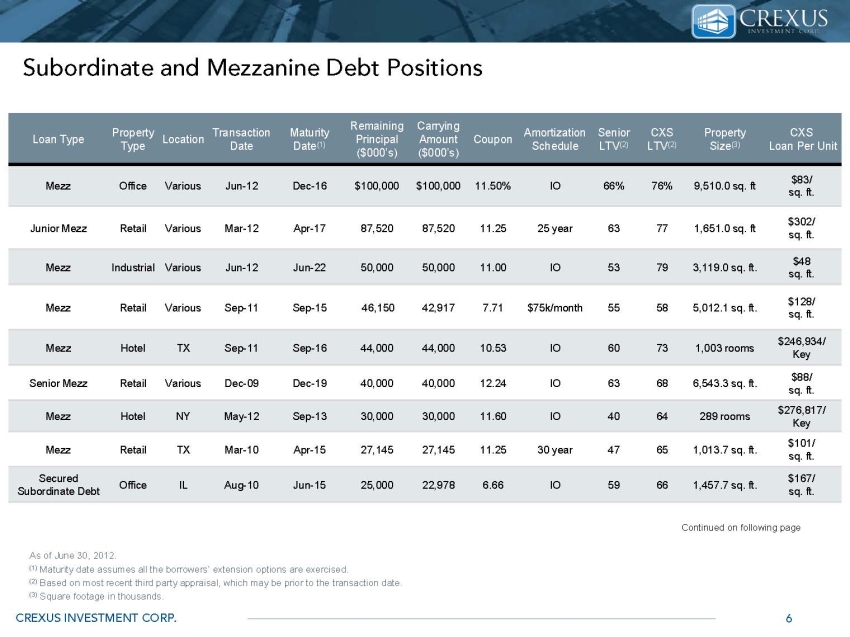
CREXUS INVESTMENT CORP. 6 Subordinate and Mezzanine Debt Positions As of June 30, 2012. (1) Maturity date assumes all the borrowers’ extension options are exercised. (2) Based on most recent third party appraisal, which may be prior to the transaction date. (3) Square footage in thousands. Loan Type Property LocationType Transaction Remaining Principal ($000’s)Date Maturity Date(1) Carrying Amount ($000’s) Coupon Amortization Schedule Senior LTV(2) CXS LTV(2) Property Size(3) CXS Loan Per Unit Mezz Office Various Jun-12 Dec-16$100,000$100,00011.50% IO66%76%9,510.0 sq. ft$83/ sq. ft. Junior Mezz Retail Various Mar-12 Apr-1787,52087,52011.2525 year63771,651.0 sq. ft$302/ sq. ft Industrial Various Jun-12 Jun-2250,00050,00011.00 IO53793,119.0 sq. ft. $48 sq. ft. Retail Various Sep-11 Sep-1546,15042,9177.71$75k/month55585,012.1 sq. ft. $128/ sq. ft. Hotel TX Sep-11 Sep-1644,00044,00010.53 IO60731,003 rooms$246,934/ Dec-09 Dec-1940,000Key40,00012.2463686,543.3 sq. ft. $88/ roomssq. ft. NY Senior Mezz May$276,81728911.60 Retail Mar-10 TX1,013.7 sq. ft$101/ sq. ft Apr-1527,14527,14530 year6511.25 Secured Subordinate Debt Office1,457.7 sq. ft. $167/ Continued on following page
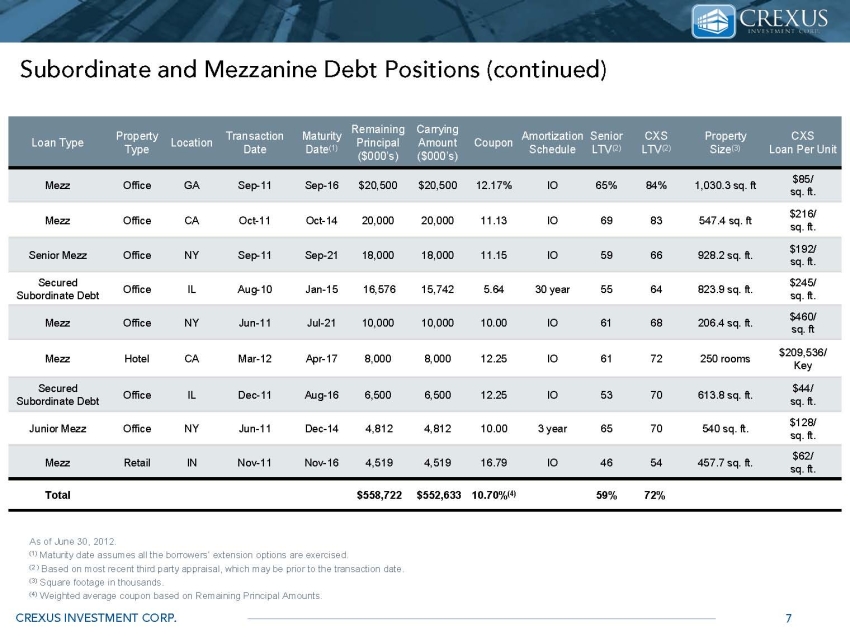
CREXUS INVESTMENT CORP. 7 Subordinate and Mezzanine Debt Positions (continued)As of June 30, 2012. (1) Maturity date assumes all the borrowers’ extension options are exercised. (2 ) Based on most recent third party appraisal, which may be prior to the transaction date. (3) Square footage in thousands. (4) Weighted average coupon based on Remaining Principal Amounts. Loan Type Property Type Location Transaction ($000’sCoup onDate Maturity Date(Remaining Principal 1) CarryingAmou ntAmortiza tionSeni or
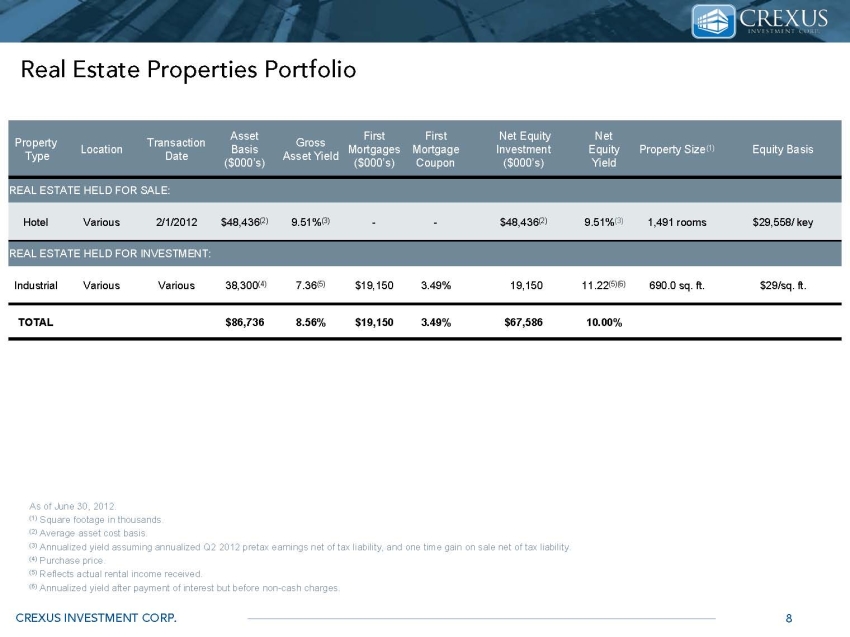
CREXUS INVESTMENT CORP. 8 Real Estate Properties Portfolio Property Type Location Transaction Date Asset Basis ($000’s) Gross Asset Yield First Mortgages ($000’s) First Mortgage Coupon Net Equity Investment ($000’s) Net EquityYield Property Size(1) Equity Basis REAL ESTATE HELD FOR SALE:REAL ESTATE HELD FOR INVESTMENT: As of June 30, 2012. (1) Square footage in thousands. (2) Average asset cost basis. (3) Annualized yield assuming annualized Q2 2012 pretax earnings net of tax liability, and one time gain on sale net of tax liability. (4) Purchase price. (5) Reflects actual rental income received. (6) Annualized yield after payment of interest but before non-cash charges.
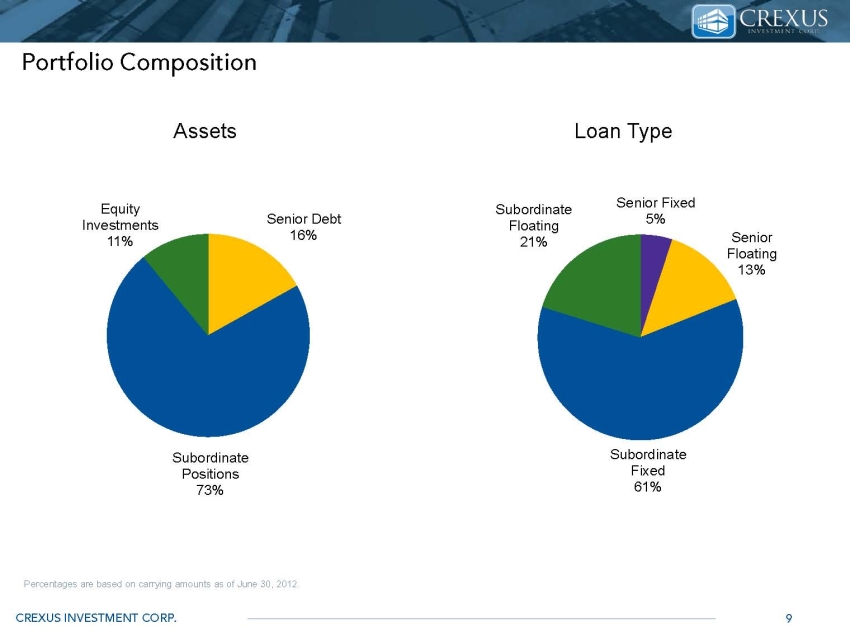
CREXUS INVESTMENT CORP. 9 Portfolio Composition Assets Loan Type Percentages are based on carrying amounts as of June 30, 2012.
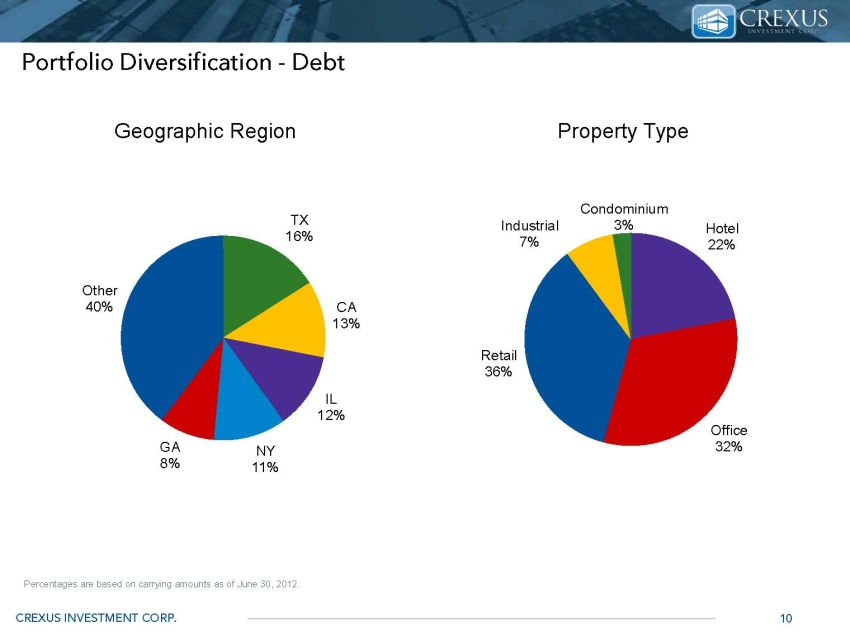
CREXUS INVESTMENT CORP. 10 Portfolio Diversification - Debt Percentages are based on carrying amounts as of June 30, 2012. Hotel, 31% Geographic Region Property Type
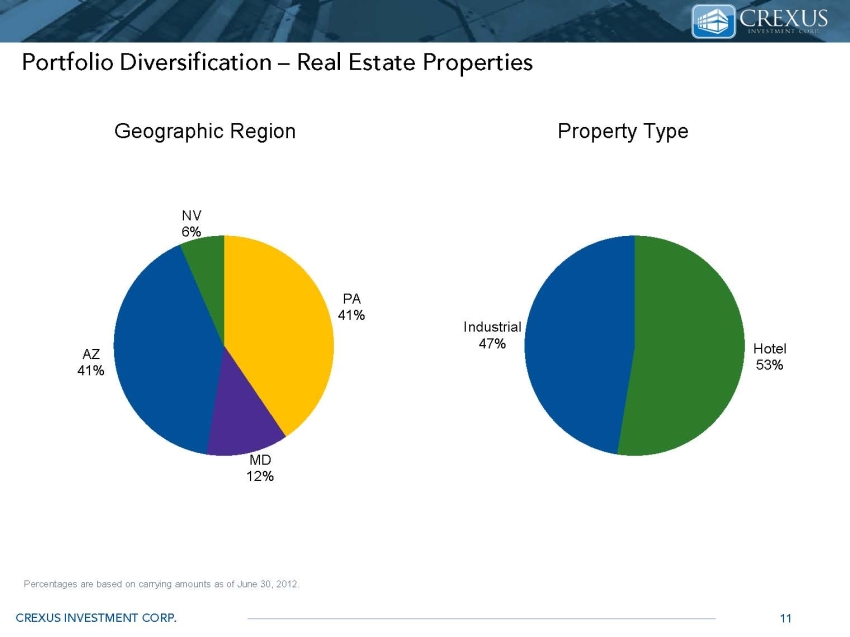
CREXUS INVESTMENT CORP. 11 Portfolio Diversification – Real Estate Properties Percentages are based on carrying amounts as of June 30, 2012. Geographic Region Property Type
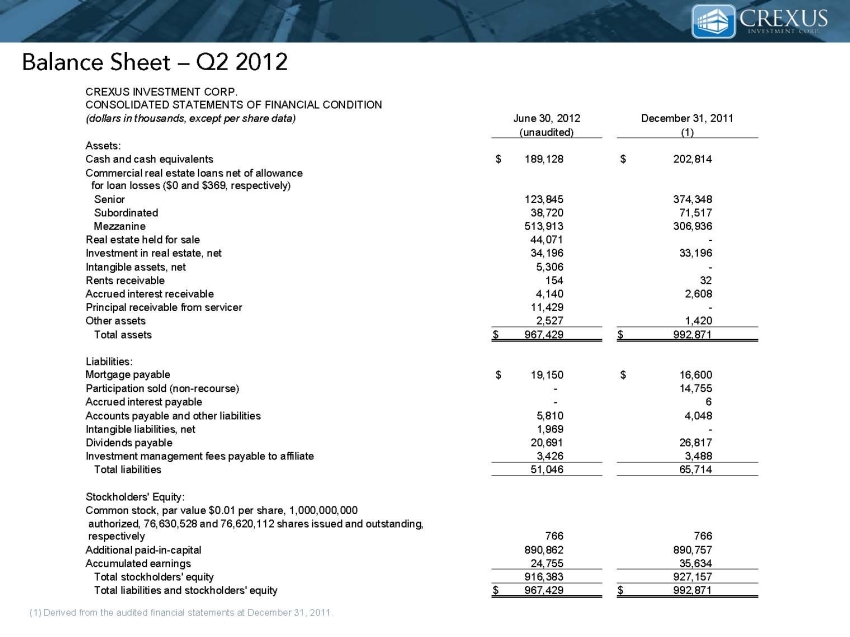
CREXUS INVESTMENT CORP. Balance Sheet – Q2 2012 (1) Derived from the audited financial statements at December 31, 2011. CONSOLIDATED STATEMENTS OF FINANCIAL CONDITION(dollars in thousands, except per share data) June 30, 2012 December 31, 2011 Commercial real estate loans net of allowance for loan losses ($0 and $369, respectively) (unaudited) Assets: Cash and cash equivalents$ 189,128$ 202,814 Senior123,845374,348 Subordinated38,72071,517 Mezzanine513,913306,936 Real estate held for sale44,071 Investment in real estate, net34,19633,196 Intangible assets, net5,306 Rents receivable15432 Accrued interest receivable4,1402,608 Principal receivable from servicer11,429 Other assets2,5271,420 Total assets$ 967,429$ 992,871 Liabilities: $ 19,150$ 16,600 Mortgage payable Participation sold (non-recourse) 14,755 Accrued interest payable5,8106 Accounts payable and other liabilities4,048 Intangible liabilities, net1,969 Dividends payable20,69126,817 Investment management fees payable to affiliate Total liabilities3,4263,48851,04665,714 Stockholders' Equity: Common stock, par value $0.01 per share, 1,000,000,000 authorized, 76,630,528 and 76,620,112 shares issued and outstanding, 766766respectively ional paid-in-capital Accumulated Total liabilities and stockholders' equity earnings Total stockholders' equity890,862890,75724,75535,634 Addit$ 992,871$ 967,429916,383927,15Financial Statements