Attached files
| file | filename |
|---|---|
| 8-K - FORM 8-K - TELEFLEX INC | d388235d8k.htm |

| 1 TELEFLEX INCORPORATED SECOND QUARTER 2012 EARNINGS CONFERENCE CALL Exhibit 99.1 |
| 2 Conference Call Logistics The release, accompanying slides, and replay webcast available online at www.teleflex.com (click on "Investors") Telephone replay available by dialing 888-286-8010 or for international calls, 617- 801-6888, pass code number 46362185 |
| 3 Introductions Benson Smith Chairman, President and CEO Thomas Powell Senior Vice President and CFO Jake Elguicze Treasurer and Vice President of Investor Relations |

| 4 4 4 4 4 4 4 Forward-Looking Statements/Additional Notes This presentation and our discussion contain forward-looking information and statements including, but not limited to, our expectation that the sale of the orthopedics business of our OEM Segment will close in the third quarter of 2012; anticipated benefits related to the consolidation of three of our U.S. based distribution centers into one centralized location, including expansion of future gross and operating margins and improved operating efficiencies and service to customers; and forecasted 2012 constant currency revenue growth, pricing growth, new product sales growth and increases in sales volume; forecasted 2012 adjusted earnings per share; and other matters which inherently involve risks and uncertainties which could cause actual results to differ from those projected or implied in the forward-looking statements. These risks and uncertainties are addressed in our SEC filings, including our most recent Form 10-K. This presentation includes certain non-GAAP financial measures, which include revenue growth on a constant currency basis; adjusted operating income and margin; adjusted earnings per share; adjusted selling, general and administrative expenses; and adjusted operating expenses. Adjusted earnings per share excludes depending on the period presented, the effect of charges associated with a goodwill impairment, our restructuring programs and asset impairments, losses and other charges related to acquisition costs, gain on sales of businesses and assets, refinancing transactions and costs associated with severance payments and benefits to be provided to our former chief executive officer, charges associated with the amortization of additional interest expense related to an interest rate swap terminated in 2011, intangible amortization expense, the amortization of debt discount on convertible notes and certain tax adjustments. Consistent with past practice, adjusted earnings per share has not been adjusted to exclude the benefit resulting from the forfeiture of equity awards. Constant currency revenue growth excludes the impact of translating the results of international subsidiaries at different currency exchange rates from period to period and the comparable activity of companies acquired or divested within the most recent twelve-month period. Adjusted selling, general and administrative expenses and adjusted operating expenses exclude costs associated with severance payments and benefits to be provided to our former chief executive officer and acquisition costs. Adjusted operating income and margin exclude costs associated acquisitions, restructuring and impairment charges and (gain) loss on sale of businesses and assets. Reconciliation of these non-GAAP measures to the most comparable GAAP measures is contained within this presentation. The following slides reflect continuing operations. |
| 5 SECOND QUARTER 2012 HIGHLIGHTS |

| 6 Financial Highlights Revenue of $383.3 million, up 4.7% constant currency Gross margin of 48.1%, up 50 bps vs. prior year Adjusted operating margins of 17.0%, up 150 bps vs. prior year Adjusted EPS of $1.23, up 34% vs. prior year |

| 7 Strategic Development Highlights Marketplace continues to accept pricing initiatives Up 132 bps versus prior year Up 25 bps sequentially Investment in research and development paying benefits Research & Development spending up 10% versus Q2'11 New product introductions contribute 94 bps to top-line growth |

| 8 Strategic Development Highlights Four acquisitions closed during the second quarter Semprus Biosciences Hotspur Technologies EFx EZ Blocker Technology acquisitions that position the Company for future growth |
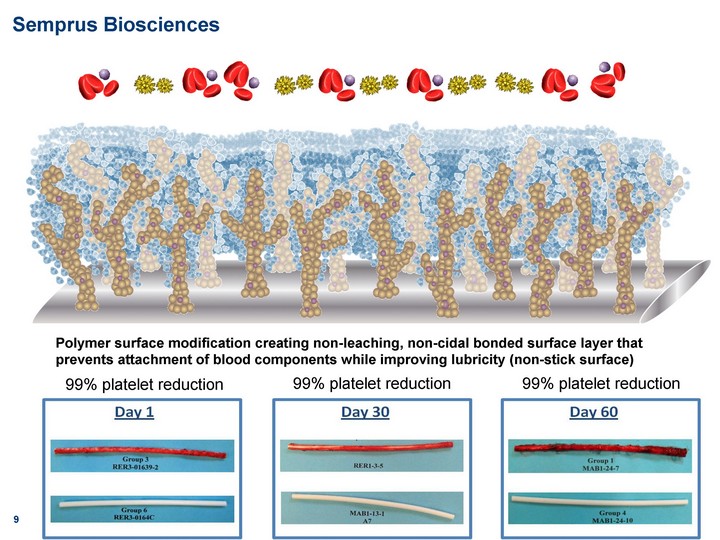
| 99% platelet reduction 99% platelet reduction 99% platelet reduction Polymer surface modification creating non-leaching, non-cidal bonded surface layer that prevents attachment of blood components while improving lubricity (non-stick surface) Semprus Biosciences 9 |
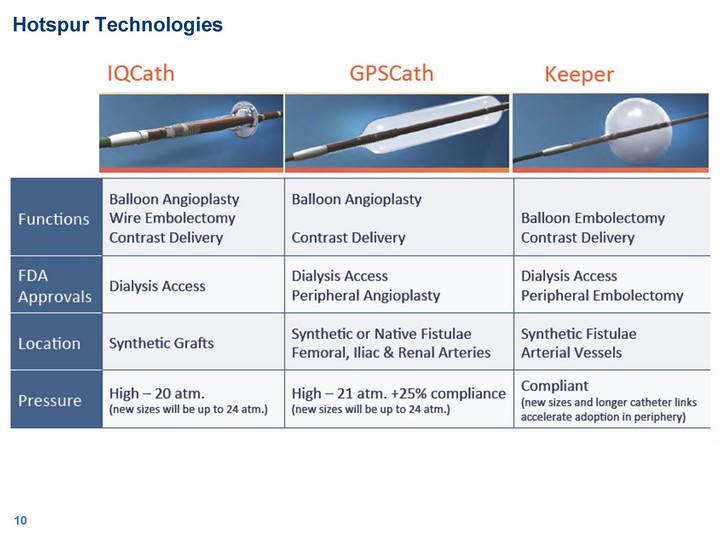
| 10 Hotspur Technologies |

| 11 EFx Acquired family of laparoscopic fascial closure system products 510(k) approved for standard and bariatric length devices More than 750 clinical cases have been performed with the device in the United States Being prepared for CE Mark review Opens new surgical procedure markets to Teleflex |

| 12 EZ-BlockerTM Acquired single-use catheter product line Patented bronchial blocker for lung isolation and one-lung ventilation Unique bifurcated distal end CE Mark approval in Europe 510(k) application submitted to FDA pending clearance Strengthens Anesthesia and Respiratory franchise |

| 13 Strategic Development Highlights Definitive agreement reached to divest OEM Orthopedics business for $45.2 million Consistent with strategy to achieve higher revenue growth and expand gross and operating margins Expected to close in third quarter of 2012 Remainder of OEM division will focus on expanding its leadership positions in custom extrusion, catheters, medical devices, sutures, and performance fibers |

| 14 Strategic Development Highlights Announced the consolidation of three U.S. based distribution centers into one centralized location Reduces operational footprint Expands future gross and operating margins Will lead to improved operating efficiencies and service to customers |
| 15 Group Purchasing Organization and Integrated Delivery Network Update Awarded 7 GPO contracts during the quarter 3 new awards 4 award renewals Awarded 11 IDN contracts during the quarter 5 new awards 6 award renewals |

| 16 SECOND QUARTER 2012 FINANCIAL REVIEW |

| 17 Second Quarter - Financial Results Revenue of $383.3 million Up 0.6% as-reported; up 4.7% constant currency Gross margin of 48.1% Up 50 bps vs. prior year Research & development spending up 10% from prior year Adjusted operating margin of 17.0% Up 150 bps vs. prior year Adjusted EPS of $1.23, up 34% vs. prior year |

| 18 SECOND QUARTER 2012 PRODUCT & GEOGRAPHIC REVENUE REVIEW |

| 19 Product Revenue Review Critical Care Surgical Care Cardiac Care OEM 0.66 0.19 0.05 0.1 Q2'12 Q2'11 Constant Currency Revenue Commentary Critical Care Surgical Care Cardiac Care OEM 0.67 0.19 0.06 0.08 Critical Care: $254.1 million, up 4.4% Surgical Care: $72.5 million, up 3.8% Anesthesia - up 7.8% Urology - up 6.9% Vascular access - up 3.8% Respiratory - down 0.4% Cardiac Care: $20.5 million, down 2.3% OEM: $36.0 million, up 13.6% Note: Increases and decreases in revenue referred to above are as compared to results for the second quarter of 2011. |

| 20 Segment Revenue Review North America EMEA Asia Pacific & Latin America OEM 0.42 0.33 0.15 0.1 Q2'12 Q2'11 Constant Currency Revenue Commentary North America EMEA Asia Pacific & Latin America OEM 0.41 0.36 0.15 0.08 North America: $160.3 million, up 2.7% EMEA: $126.9 million, up 2.3% Asia Pacific & Latin America: $60.1 million, up 11.1% OEM: $36.0 million, up 13.6% Note: Increases and decreases in revenue referred to above are as compared to results for the second quarter of 2011. |

| 21 2012 OUTLOOK |

| 22 2012 Outlook Constant currency revenue growth range of 4.0% to 6.0% Pricing growth of 50 to 75 bps New product sales growth of 100 to 150 bps Increased volume of 250 to 375 bps Adjusted earnings per share range of $4.25 to $4.45 Represents growth of between 11% to 16% |

| 23 QUESTION & ANSWER |

| 24 APPENDICES |

| 25 Appendix A - Reconciliation of Product Constant Currency Revenue Growth Dollars in Millions |

| 26 Appendix B - Reconciliation of Segment Constant Currency Revenue Growth Dollars in Millions |

| 27 Appendix C - Reconciliation of Critical Care Product Constant Currency Revenue Growth Dollars in Millions |

| 28 Appendix D - Reconciliation of Teleflex Selling, General and Administrative Expenses |

| 29 Appendix E - Reconciliation of Teleflex Operating Expenses |

| 30 Appendix F - Second Quarter Income Statement from Continuing Operations Dollars in millions, except per share |

| 31 Appendix G - EPS Reconciliation from Continuing Operations In 2012, losses and other charges include approximately $0.4 million, net of tax, or $0.01 per share, related to acquisition costs; and ($0.3) million, net of tax, or ($0.01) per share, related to a gain on sale of businesses and assets. In 2011, losses and other charges include approximately $0.5 million, net of tax, or $0.01 per share, related to the loss on extinguishment of debt. In 2011, the Company terminated our interest rate swap that, at the date of termination, had a notional amount of $350 million. The interest rate swap was designated as a cash flow hedge against the term loan under our senior credit facility. At the date of termination, the interest rate swap was in a liability position, resulting in a cash payment of approximately $14.8 million, which included $3.1 million of accrued interest. In accordance with GAAP, the Company is amortizing this amount as additional interest expense over the remainder of the original term of the interest rate swap, which was scheduled to expire in September 2012. In the second quarter of 2012, the non-cash, net of tax impact was approximately $2.3 million, or $0.06 per share. The tax adjustment represents a net benefit resulting from the resolution (including the expiration of statutes of limitations) of various prior years' U.S. federal, state and foreign tax matters. |

| 32 Appendix H - Reconciliation of Product Constant Currency Revenue Growth Dollars in Millions |

| 33 Appendix I - Reconciliation of Segment Constant Currency Revenue Growth Dollars in Millions |
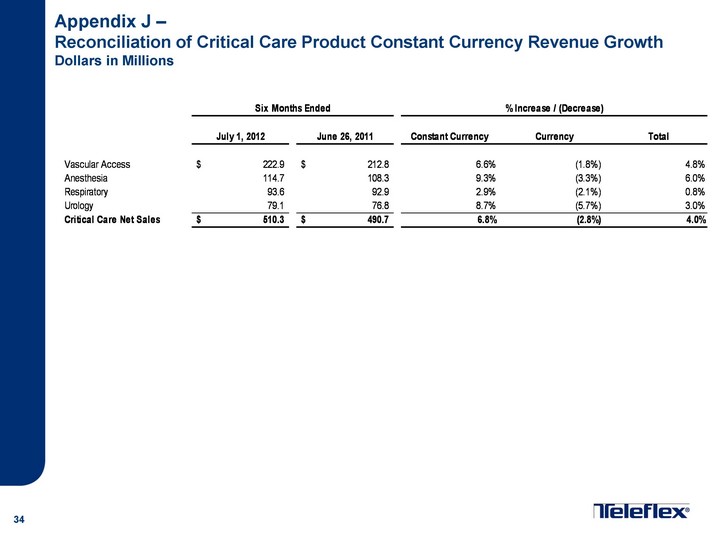
| 34 Appendix J - Reconciliation of Critical Care Product Constant Currency Revenue Growth Dollars in Millions |
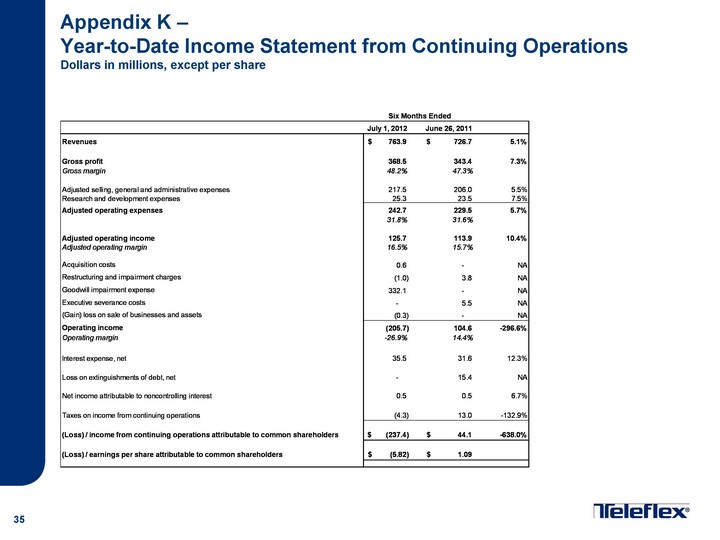
| 35 Appendix K - Year-to-Date Income Statement from Continuing Operations Dollars in millions, except per share |

| 36 Appendix L - EPS Reconciliation from Continuing Operations In 2012, losses and other charges include approximately $0.4 million, net of tax, or $0.01 per share, related to acquisition costs; and ($0.3) million, net of tax, or ($0.01) per share, related to a gain on sale of businesses and assets. In 2011, losses and other charges include approximately $9.8 million, net of tax, or $0.24 per share, related to the loss on extinguishment of debt; and $3.5 million, net of tax, or $0.09 per share, in charges related to severance payments and benefits provided to our former chief executive officer. In 2011, the Company terminated our interest rate swap that, at the date of termination, had a notional amount of $350 million. The interest rate swap was designated as a cash flow hedge against the term loan under our senior credit facility. At the date of termination, the interest rate swap was in a liability position, resulting in a cash payment of approximately $14.8 million, which included $3.1 million of accrued interest. In accordance with GAAP, the Company is amortizing this amount as additional interest expense over the remainder of the original term of the interest rate swap, which was scheduled to expire in September 2012. In the first six months of 2012, the non-cash, net of tax impact was approximately $4.7 million, or $0.12 per share. The tax adjustment represents a net benefit resulting from the resolution (including the expiration of statutes of limitations) of various prior years' U.S. federal, state and foreign tax matters. The Company has presented results using basic weighted average shares with the impact of dilution on adjusted income, separately. In accordance with ASC 260, if income from continuing operations is a loss no potential common shares are included in the computation of diluted per-share amounts because inclusion would result in an anti-dilutive per share amount. |

| 37 Appendix M - Reconciliation of 2012 Outlook Earnings per Share Guidance Note: In 2012, special items include approximately $7.0 million, net of tax, or $0.17 per share related to the acceleration of an interest rate swap; approximately $0.4 million, net of tax, or $0.01 per share related to acquisition costs; approximately ($7.7) million, net of tax, or ($0.19) per share related to tax adjustments; approximately ($0.3) million, net of tax, or ($0.01) per share related to a gain on sale of businesses and assets; approximately ($0.02) per share associated with using basic weighted average shares when computing expected full year earnings per share. |