Attached files
| file | filename |
|---|---|
| 8-K - FORM 8-K - PUBLIC SERVICE ELECTRIC & GAS CO | d388333d8k.htm |
| EX-99 - PRESS RELEASE DATED JULY 31, 2012 ANNOUNCING SECOND QUARTER 2012 RESULTS - PUBLIC SERVICE ELECTRIC & GAS CO | d388333dex99.htm |
 Public
Service Enterprise Group PSEG Earnings Conference Call
2 Quarter 2012
July 31, 2012
EXHIBIT 99.1
nd |
| 1
Forward-Looking Statement
Readers are cautioned that statements contained in this presentation about our
future performance, including future revenues, earnings, strategies, prospects,
consequences and all other statements that are not purely historical, are
forward-looking statements for purposes of the safe harbor provisions under The Private
Securities
Litigation
Reform
Act
of
1995.
When
used
herein,
the
words
“anticipate”,
“intend”,
“estimate”,
“believe”,
“expect”,
“plan”,
“should”,
“hypothetical”,
“potential”,
“forecast”, “project”, variations of such words and similar
expressions are intended to identify forward-looking statements. Although we believe that our expectations are
based
on
reasonable
assumptions, they
are
subject
to
risks
and
uncertainties
and
we
can
give
no
assurance
they
will
be
achieved.
The
results
or
developments
projected
or
predicted
in
these
statements
may
differ
materially
from
what
may
actually
occur.
Factors
which
could
cause
results
or
events
to
differ
from
current
expectations include, but are not limited to:
•
adverse changes in the demand for or price of the capacity and energy that we sell
into wholesale electricity markets, •
adverse changes in energy industry law, policies and regulation, including market
structures and a potential shift away from competitive markets toward subsidized market
mechanisms, transmission planning and cost allocation rules, including rules
regarding how transmission is planned and who is permitted to build transmission in the future,
and reliability standards,
•
any inability of our transmission and distribution businesses to obtain adequate
and timely rate relief and regulatory approvals from federal and state regulators,
•
changes in federal and state environmental regulations that could increase our
costs or limit our operations, •
changes in nuclear regulation and/or general developments in the nuclear power
industry, including various impacts from any accidents or incidents experienced at our
facilities or by others in the industry, that could limit operations of our
nuclear generating units, •
actions
or activities at one
of
our
nuclear
units
located
on
a
multi-unit
site
that
might
adversely
affect
our
ability
to
continue
to
operate
that
unit
or
other
units
located
at
the
same site,
•
any inability to balance our energy obligations, available supply and trading
risks, •
any deterioration in our credit quality, or the credit quality of our
counterparties, including in our leveraged leases, •
availability of capital and credit at commercially reasonable terms and conditions
and our ability to meet cash needs, •
any
inability
to
realize
anticipated
tax
benefits
or
retain
tax
credits,
•
changes in the cost of, or interruption in the supply of, fuel and other
commodities necessary to the operation of our generating units, •
delays in receipt of necessary permits and approvals for our construction and
development activities, •
delays or unforeseen cost escalations in our construction and development
activities, •
any inability to achieve or continue to sustain, our expected levels of operating
performance, •
increase in competition in energy supply markets as well as competition for certain
rate-based transmission projects, •
any
inability
to
realize
anticipated
tax
benefits
or
retain
tax
credits,
•
challenges associated with recruitment and/or retention of a qualified
workforce, •
adverse performance of our decommissioning and defined benefit plan trust fund
investments and changes in discount rates and funding requirements, and
•
changes in technology and customer usage patterns.
For further information, please refer to our Annual Report on Form 10-K,
including Item 1A. Risk Factors, and subsequent reports on Form 10-Q and Form 8-K filed with
the
Securities
and
Exchange
Commission.
These
documents
address
in
further
detail
our
business,
industry
issues
and
other
factors
that
could
cause
actual
results
to differ
materially
from those
indicated in
this
presentation.
In
addition,
any
forward-looking
statements
included
herein
represent
our
estimates
only
as
of
today
and
should not be relied upon as representing our estimates as of any subsequent
date. While we may elect to update forward-looking statements from time to time, we
specifically disclaim any obligation to do so, even if our internal estimates
change, unless otherwise required by applicable securities laws. |
| 2
GAAP Disclaimer
PSEG presents Operating Earnings in addition to its Net Income reported in
accordance with accounting principles generally accepted in the United
States (GAAP). Operating Earnings is a non-GAAP financial measure that
differs from Net Income because it excludes gains or losses associated with
Nuclear Decommissioning Trust (NDT), Mark-to-Market (MTM) accounting,
and other material one-time items. PSEG presents Operating Earnings
because
management
believes
that
it
is
appropriate
for
investors
to
consider results excluding these items in addition to the results reported in
accordance with GAAP. PSEG believes that the non-GAAP financial
measure of Operating Earnings provides a consistent and comparable
measure of performance of its businesses to help shareholders understand
performance
trends.
This
information
is
not
intended
to
be
viewed
as
an
alternative to GAAP information. The last slide in this presentation includes
a list of items excluded from Income from Continuing Operations to
reconcile to Operating Earnings, with a reference to that slide included on
each of the slides where the non-GAAP information appears.
|
| PSEG
2012 Q2 Review
Caroline Dorsa
EVP and Chief Financial Officer |
 4
Q2 Earnings Summary
$ millions (except EPS)
2012
2011
Operating Earnings
$ 215
$ 301
Reconciling Items, Net of Tax
(4)
19
Income from Continuing Operations
$ 211
$ 320
Discontinued Operations, Net of Tax
-
3
Net Income
$ 211
$ 323
EPS from Operating Earnings*
$ 0.43
$ 0.59
Quarter ended June
30 * See
Page A for Items excluded from Income from Continuing Operations to reconcile to Operating Earnings. |
 5
First Half 2012 Earnings Summary
$ millions (except EPS)
2012
2011
Operating Earnings
$ 647
$ 732
Reconciling Items, Net of Tax
57
50
Income from Continuing Operations
$ 704
$ 782
Discontinued Operations
-
67
Net Income
$ 704
$ 849
EPS from Operating Earnings
*
$ 1.28
$ 1.44
Six months ended June
30 * See
Page A for Items excluded from Income from Continuing Operations to reconcile to Operating Earnings. |
 6
PSEG –
Q2 2012 Highlights
Operating Earnings of $0.43 vs. $0.59 per share
in Q2 2011
Q2 results met operational and financial targets
Continued strong availability of CCGTs, strong production from Nuclear,
and Fossil’s control of O&M supported results
Focused on financially disciplined growth
North Central Reliability transmission project received BPU approval
Construction phase of $3.5 billion transmission projects underway
Added 400 MW of new peaking capacity in NJ and CT in time for summer
PSE&G seeking BPU approval to spend up to $883 million to expand
Solar 4 All and Solar Loan programs
Competitive market issues under review
US District Court action on LCAPP litigation
PJM reviewing future MOPR process |
 7
PSEG –
Maintaining 2012 Guidance
* See Page A for Items excluded from Income from Continuing Operations to reconcile to Operating
Earnings.
$2.25 -
$2.50E
$3.12
$2.74 |
| PSEG 2012 Q2 Operating Company Review |
 9
Q2 Operating Earnings by Subsidiary
Operating Earnings
Earnings per Share
$ millions (except EPS)
2012
2011
2012
2011
PSEG Power
$ 110
$ 186
$ 0.22
$ 0.36
PSE&G
101
105
0.20
0.21
PSEG Energy Holdings/
Enterprise
4
10
0.01
0.02
Operating Earnings
*
$ 215
$ 301
$0.43
$ 0.59
Quarter ended June 30
* See Page A for Items excluded from Income from Continuing Operations to reconcile to Operating
Earnings. |
 10
$0.43
(.01)
(.01)
(.14)
$0.59
0.00
0.25
0.50
0.75
PSEG EPS Reconciliation –
Q2 2012 versus Q2 2011
Lower Pricing (.05)
Lower Volume (.02)
Lower Capacity (.03)
O&M (.02)
Financing Costs .01
Other (.03)
Transmission .02
Weather (.01)
O&M (.03)
D&A (.01)
Other .02
Q2 2012
Operating
Earnings*
Q2 2011
Operating
Earnings*
PSEG Power
PSE&G
Energy
Holdings/
Enterprise
Lower Lease
Income
* See Page A for Items excluded from Income from Continuing Operations to reconcile to Operating
Earnings. |
 11
First Half Operating Earnings by Subsidiary
Operating Earnings
Earnings per Share
$ millions (except EPS)
2012
2011
2012
2011
PSEG Power
$ 306
$ 452
$ 0.60
$ 0.89
PSE&G
298
268
0.59
0.53
PSEG Energy Holdings/
Enterprise
43
12
0.09
0.02
Operating Earnings*
$ 647
$ 732
$ 1.28
$ 1.44
Six months ended June 30
•See Page A for Items excluded from Income from Continuing Operations to reconcile to
Operating Earnings. |
 12
$1.28
.07
.06
(.29)
$1.44
0.00
0.25
0.50
0.75
1.00
1.25
1.50
1.75
PSEG EPS Reconciliation –
YTD 2012 versus YTD 2011
YTD 2012
Operating
Earnings*
YTD 2011
Operating
Earnings*
Lower Pricing (.16)
Lower Volume (.03)
Lower Capacity (.11)
Financing Costs .03
O&M .02
Weather (.01)
Other (.03)
PSEG Power
O&M (.04)
PSE&G
PSEG Energy
Holdings/
Enterprise
Tax settlement
* See Page A for Items excluded from Income from Continuing Operations to reconcile to
Operating Earnings. Transmission .05
Renewables and
Other
Investments .01
D&A (.02)
Taxes .07
Other .01
Weather and
Demand (.02) |
| PSEG
Power 2012 Q2 Review |
 14
PSEG Power –
Q2 2012 EPS Summary
$ millions (except EPS)
Q2 2012
Q2 2011
Variance
Operating Revenues
$ 985
$ 1,285
$ (300)
Operating Earnings
110
186
(76)
NDT Funds Related
Activity,
Net of Tax
4
15
(11)
Mark-to-Market, Net of Tax**
(10)
4
(14)
Income from Continuing Operations
104
205
(101)
Discontinued Operations, Net of Tax
-
3
(3)
Net Income
104
208
(104)
EPS from Operating Earnings*
$ 0.22
$ 0.36
$ (0.14)
* See Page A for Items excluded from Income from Continuing Operations to reconcile to
Operating Earnings. **Includes the financial impact from positions with forward
delivery months. |
 15
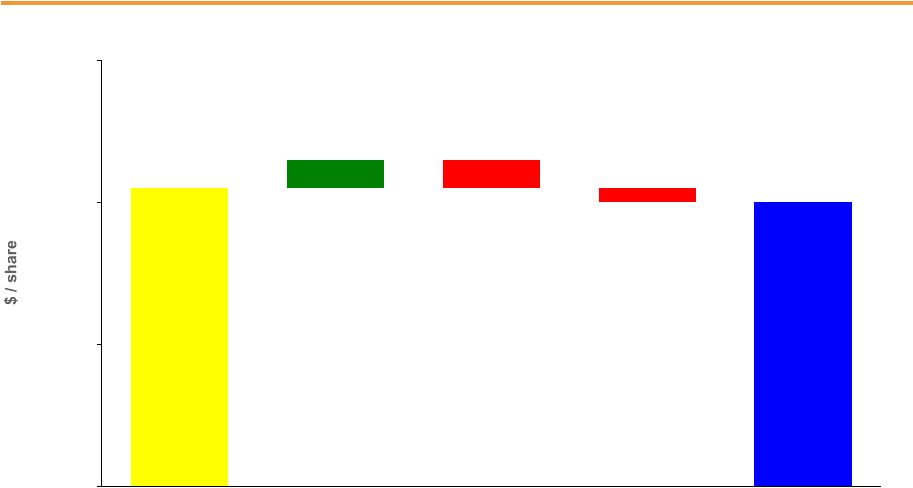
(.01)
(.13)
$0.22
$0.36
0.00
0.10
0.20
0.30
0.40
0.50
Lower Pricing (.05)
Lower Volume (.02)
Lower Capacity (.03)
Other (.03)
PSEG Power EPS Reconciliation –
Q2 2012 versus Q2 2011
Q2 2012
Operating
Earnings*
Q2 2011
Operating
Earnings*
O&M (.02)
Financing
Costs .01
* See Page A for Items excluded from Income from Continuing Operations to reconcile to
Operating Earnings. |
 16
PSEG Power –
Generation Measures
7,307
7,075
3,824
4,177
2,191
1,454
0
7,500
15,000
2011
2012
Quarter ended June 30
Total Nuclear
Total Coal*
Oil & Natural Gas
* Includes figures for Pumped Storage. Includes Hudson and Mercer with Gas.
PSEG Power –
Generation (GWh)
13,322
12,706
Quarter ended June 30
PSEG Power –
Capacity Factors (%)
2011
2012
Nuclear
90.3%
87.2%
Coal
NJ (Coal/Gas)
33%
14%
PA
77%
64%
CT
7%
3%
Combined
Cycle
PJM and NY
52%
57% |
 17
PSEG Power –
Generation Measures
15,236
15,045
8,219
4,503
2,585
7,614
0
10,000
20,000
30,000
2011
2012
Six Months ended June 30
Total Nuclear
Total Coal*
Oil & Natural Gas
* Includes figures for Pumped Storage. Includes Hudson and Mercer with Gas.
PSEG Power –
Generation (GWh)
27,353
25,849
Six Months ended June 30
PSEG Power –
Capacity Factors (%)
2011
2012
Nuclear
94.6%
92.7%
Coal
NJ (Coal/Gas)
31%
8%
PA
80%
63%
CT
15%
3%
Combined
Cycle
PJM and NY
53%
57% |
 18
PSEG Power –
Fuel Costs
Quarter ended June 30
($ millions)
2011
2012
Coal
83
39
Oil & Gas
155
113
Total Fossil
238
152
Nuclear
44
48
Total Fuel Cost
282
200
Total Generation
(GWh)
13,322
12,706
$ / MWh
21.17
15.74
PSEG
Power
–
Fuel
Costs*
* Based on Operating Earnings.
YTD ended June 30
($ millions)
2011
2012
Coal
173
77
Oil & Gas
345
241
Total Fossil
518
318
Nuclear
90
98
Total Fuel Cost
608
416
Total Generation
(GWh)
27,353
25,849
$ / MWh
22.23
16.09 |
 Regional
Performance Region
Q2 2012
Gross
Margin* ($M)
2012 Performance
PJM
$521
Lower pricing and lower volumes
continued to negatively impact
margin.
New
England
$14
Lower pricing and volumes
impacted margin.
New York
$14
Higher generation output and
realized margin.
19
$51
$49
$43
PSEG Power –
Gross Margin Performance
Margins declined with reduction in energy and capacity pricing
Migration volumes in line with expectations, margins influenced by
warmer-than-normal weather
Output influenced by weather and compression in PJM dark spreads
PSEG Power Gross Margin* ($/MWh)
Quarter ended
June 30
* Based on Operating Earnings.
$75
$50
$25
$0
2010
2011
2012 |
 20
Hedging Update…
Contracted Energy*
* Hedge
percentages
and
prices
as
of
June
30,
2012.
Revenues
of
full requirement load deals based on contract price, including renewable energy
credits, ancillary, and transmission components
but
excluding
capacity.
Hedges
include
positions
with
MTM
accounting
treatment
and
options.
Volume TWh
17
35
35
Base Load
% Hedged
100%
85-90%
45-50%
(Nuclear and Base Load Coal)
Price $/MWh
$58
$54
$54
Volume TWh
10
18
19
Intermediate Coal, Combined
% Hedged
30-35%
0%
0%
Cycle, Peaking
Price $/MWh
$58
$54
$54
Volume TWh
28-30
52-54
53-55
Total
% Hedged
70-75%
55-60%
25-30%
Price $/MWh
$58
$54
$54
Jul -Dec
2012
2013
2014 |
 21
PSEG Power –
Q2 2012 Operating Highlights
Q2 output down 4.6% on lower coal dispatch and a Hope Creek refueling outage
Planned Hope Creek outage moved capacity factor for the nuclear fleet to
87.2% for Q2, 92.7% for the YTD period
Combined cycle output up 10%; continued strong equivalent availability factor
Power brought 400 MW of new capacity in service in June
Operations
Regulatory and Market
Environment
Financial
Power cleared 9,000 MW in the 2015/2016 RPM auction at an average price
of $167/MW-day; preserving optionality of HEDD sites
2012 anticipated coal and nuclear base load output hedged at average price
of $58/MWh
Customer migration approximately 38% for the quarter
Power’s total debt as a percentage of capital at June 30 was 34%
Moody’s affirmed Power’s Baa1 senior credit rating with a Stable outlook
Fitch affirmed Power’s BBB+
senior credit rating with a Stable outlook
+ |
| PSE&G
2012 Q2 Review |
 23
PSE&G –
Q2 Earnings Summary
$ millions (except EPS)
Q2 2012
Q2 2011
Variance
Operating Revenues
$ 1,407
$ 1,571
$ (164)
Operating Expenses
Energy Costs
622
815
(193)
Operation & Maintenance
350
304
46
Depreciation & Amortization
188
172
16
Taxes Other than Income Taxes
20
28
(8)
Total Operating Expenses
1,180
1,319
(139)
Operating Earnings / Net Income
101
105
(4)
$ 0.20
$ 0.21
$ (0.01)
EPS from Operating Earnings |
 PSE&G EPS
Reconciliation – Q2 2012
versus Q2 2011
24
$0.20
(.01)
(.02)
.02
$0.21
0.00
0.10
0.20
0.30
Q2 2012
Operating
Earnings
Q2 2011
Operating
Earnings
Transmission
D&A (.01)
O&M (.03)
Other .02
Weather |
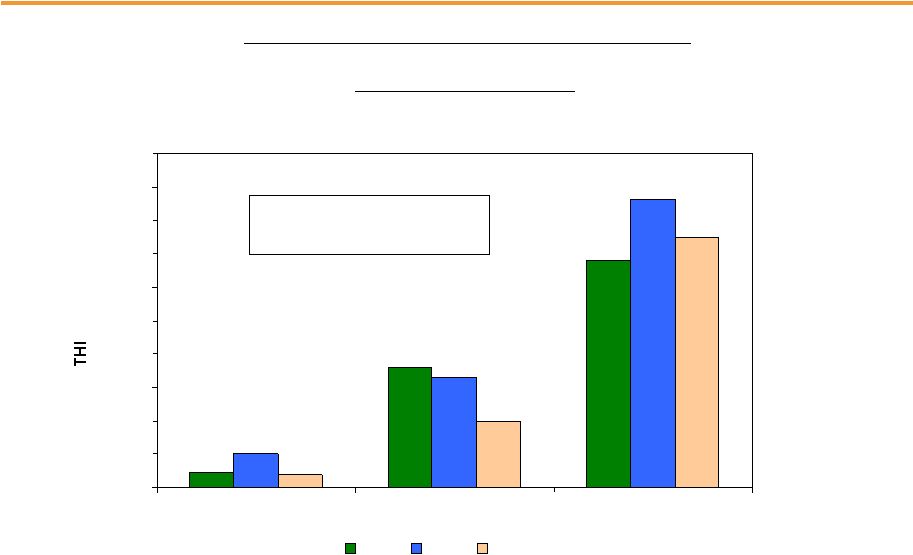 25
PSE&G –
Monthly Summer Weather Data
179
1,431
2,717
403
1,325
3,459
156
799
2,998
0
400
800
1,200
1,600
2,000
2,400
2,800
3,200
3,600
4,000
April
May
June
2012
2011
Normal
2012
vs.
2011
vs.
Normal
PSE&G
Monthly
Temperature
Humidity
Index
(THI)
-16.6% Q2 2012 vs. Q2 2011
+ 9.5% Q2 2012 vs. Normal |
 26
PSE&G –
Q2 Operating Highlights
NPS proceeding on Susquehanna-Roseland final EIS in October 2012
BPU approved North Central Reliability Project June 18; construction underway
PSE&G seeking BPU approval to spend up to $883 million to expand
Solar 4 All
and Solar Loan programs
PSE&G earned its authorized return
Issued $450 million of 30-year notes with 3.95% coupon due May 2042
Moody’s upgraded PSE&G’s secured debt rating to A1 with a Stable
outlook Fitch upgraded PSE&G’s secured debt rating to A+ with a Stable
outlook Operations
Regulatory and Market
Environment
Financial
Mild Winter and early Spring weather warmer than normal but below Q2 2011
O&M remains under control |
| PSEG Energy
Holdings/Enterprise 2012 Q2 Review |
 28
PSEG Energy Holdings/Enterprise –
Q2 2012 Earnings
Summary
$ millions (except EPS)
Operating Earnings
$ 4
$ 10
$ (6)
Lease Related Activity
2
-
2
Net Income
$ 6
$ 10
(4)
EPS from Operating Earnings*
$ 0.01
$ 0.02
$ (0.01)
* See Page A for Items excluded from Income from Continuing Operations to reconcile to Operating
Earnings. Q2 2012
Q2 2011
Variance |
 29
PSEG Energy Holdings/Parent –
Q2 Operating Highlights
Financial
10-year LIPA management services agreement approved by
New York State Office of the Comptroller, NYS Attorney General
and IRS
Payments on Holdings’
remaining lease portfolio are current
$75 million investment in Queen Creek Arizona solar farm scheduled
to be in service this fall |
| PSEG
|
 31
PSEG Financial Highlights
Maintaining 2012 Operating Earnings guidance of $2.25 -
$2.50
per share
Q2 and YTD operating EPS in-line with expectations
Focused on maintaining operating efficiency and customer reliability
Financial position remains strong
Debt as a percentage of capital at 41% at June 30
Proactively and aggressively investing in infrastructure at attractive utility
returns as a means of enhancing reliability, improving the environment and
supporting the NJ economy
Moody’s upgraded PSE&G’s secured debt rating to A1 with a Stable outlook
and affirmed ratings of PSEG and Power (Baa1) with Stable outlooks
Fitch upgraded PSE&G’s secured debt rating to A+ with a Stable outlook
and affirmed ratings of PSEG and Power (BBB+) with Stable outlooks
|
 32
PSEG 2012 Operating Earnings Guidance -
PSEG 2012 Operating Earnings Guidance -
By Subsidiary
By Subsidiary
$ millions (except EPS)
PSEG Power
$575 –
$665
$ 845
PSE&G
$530 –
$560
$ 521
PSEG Energy
Holdings/Enterprise
$35 –
$45
$ 23
Operating Earnings*
$1,140 –
$1,270
$ 1,389
Earnings per Share
$ 2.25 –
$ 2.50
$2.74
* See Page A for Items excluded from Income from Continuing Operations to reconcile to Operating
Earnings. 2012E
2011A |
 33
PSEG Liquidity as of June 30, 2012
Company
Facility
Date
Facility
Usage
Liquidity
($Millions)
PSE&G
5-year Credit Facility
Apr-16
$600
$16
$584
5-Year Credit Facility (Power)
Mar-17
$1,600
$121
$1,479
5-Year Credit Facility (Power)
Apr-16
$1,000
$0
$1,000
5-Year Bilateral - Credit Suisse (Power)
Sep-15
$100
$100
$0
5-year Credit Facility (PSEG)
Mar-17
$500
$12
$488
5-year Credit Facility (PSEG)
Apr-16
$500
$0
$500
Total
$4,300
$249
$4,051
$704
$0
$4,755
$4,171
PSEG /
Power
PSEG Money Pool ST Investment
PSE&G ST Investment
Total Liquidity Available
Total Parent / Power Liquidity |
 (Unaudited)
2012
2011
2012
2011
Gain (Loss) on Nuclear Decommissioning Trust (NDT)
Fund Related Activity (PSEG Power)
4
$
15
$
9
$
42
$
50
$
46
$
(10)
4
42
8
107
(1)
Lease Related Activity (PSEG Energy Holdings)
2
-
6
-
-
-
Market Transition Charge Refund (PSE&G)
-
-
-
-
-
(72)
Gain on Sale of Qwest Building (Energy Holdings)
-
-
-
-
34
-
Lease Transaction Loss (Energy Holdings)
-
-
-
-
(173)
-
Total Pro-forma adjustments
(4)
$
19
$
57
$
50
$
18
$
(27)
$
Fully Diluted Average Shares Outstanding (in Millions)
507
507
507
507
507
507
Gain (Loss) on NDT Fund Related Activity (PSEG Power)
0.01
$
0.03
$
0.02
$
0.08
$
0.10
$
0.09
$
Gain (Loss) on MTM
(a)
(0.02)
0.01
0.08
0.02
0.21
-
Lease Related Activity (PSEG Energy Holdings)
-
-
0.01
-
-
-
Market Transition Charge Refund (PSE&G)
-
-
-
-
-
(0.14)
Gain on Sale of Qwest Building (Energy Holdings)
-
-
-
-
0.06
-
Lease Transaction Loss (Energy Holdings)
-
-
-
-
(0.34)
-
Total Pro-forma adjustments
(0.01)
$
0.04
$
0.11
$
0.10
$
0.03
$
(0.05)
$
(a) Includes the financial impact from positions with forward delivery months.
June 30,
For the Twelve Months Ended
June 30,
Reconciling Items Excluded from Continuing Operations to Compute Operating Earnings
PUBLIC SERVICE ENTERPRISE GROUP INCORPORATED
For the Three Months Ended
For the Six Months Ended
December 31,
Pro-forma Adjustments, net of tax
2011
2010
Per
Share
Impact
(Diluted)
Items Excluded from Income from Continuing Operations to
Reconcile to Operating Earnings
Please see Page 2 for an explanation of PSEG’s use of Operating Earnings as a
non-GAAP financial measure and how it differs from Net Income.
A
(PSEG Power)
(PSEG Power)
Earnings
Impact
($
Millions)
Gain (Loss) on Mark-to-Market (MTM)
(a) |