Attached files
| file | filename |
|---|---|
| 8-K - FORM 8-K - PUBLIC SERVICE ELECTRIC & GAS CO | d388333d8k.htm |
| EX-99.1 - SLIDESHOW PRESENTATION - PUBLIC SERVICE ELECTRIC & GAS CO | d388333dex991.htm |
EXHIBIT 99

|
Investor News | NYSE:PEG |
| For further information, contact: | ||||
| • Kathleen A. Lally, Vice President - Investor Relations |
Phone: | 973-430-6565 | ||
| • Carlotta Chan Lane, Manager - Investor Relations |
Phone: | 973-430-6596 |
July 31, 2012
PSEG ANNOUNCES 2012 SECOND QUARTER RESULTS
$0.42 PER SHARE INCOME FROM CONTINUING OPERATIONS
$0.43 PER SHARE OF OPERATING EARNINGS
Company Maintains 2012 Operating Earnings Guidance of $2.25 - $2.50 Per Share
Public Service Enterprise Group (PSEG) reported today Second Quarter 2012 Income from Continuing Operations of $211 million or $0.42 per share as compared to $320 million or $0.63 per share for the Second Quarter of 2011. Operating Earnings for the Second Quarter of 2012 were $215 million or $0.43 per share compared to the Second Quarter of 2011 Operating Earnings of $301 million or $0.59 per share.
“PSEG reported earnings for the quarter in line with expectations” said Ralph Izzo, chairman, president and chief executive officer. He went on to say, “our quarterly results reflect a continued commitment to key fundamentals: people working together to provide reliable service at a reasonable cost as we also focus on the needs of our shareholders for growth. We received critical regulatory approval for our $3.5 billion transmission investment program. This planned increase in capital will improve the system’s reliability, and along with our investment in new peaking generation, will support jobs and growth in New Jersey.”
PSEG believes that the non-GAAP financial measure of “Operating Earnings” provides a consistent and comparable measure of performance of its businesses to help shareholders understand performance trends. Operating Earnings exclude the impact of returns/(losses) associated with Nuclear Decommissioning Trust (NDT), Mark-to-Market (MTM) accounting and other material one time items. The table below provides a reconciliation of PSEG’s Net Income to Operating Earnings for the second quarter. See Attachment 12 for a complete list of items excluded from Income from Continuing Operations in the determination of Operating Earnings.
Ralph Izzo said, “PSEG is a leader in providing safe, clean, and reliable service. New, efficient peaking capacity was placed in service on-time in early June, and was available to meet summer demands on the system. We received approval for the North Central Reliability transmission line, and we look to build on the success of the approximately $700 million of capital committed to solar under our Solar 4 All and Solar Loan Programs following Governor Christie’s recent signing into law of the Solar Energy bill. These investments support NJ’s economy by putting people to work. They help to maintain the state’s commitment to renewable energy and represent a continuation of our efforts to grow PSEG.”
PSEG CONSOLIDATED EARNINGS (unaudited)
Second Quarter Comparative Results
2012 and 2011
| Income ($ millions) |
Diluted Earnings Per Share |
|||||||||||||||
| 2012 | 2011 | 2012 | 2011 | |||||||||||||
| Operating Earnings |
$ | 215 | $ | 301 | $ | 0.43 | $ | 0.59 | ||||||||
| Reconciling Items |
(4 | ) | 19 | (0.01 | ) | 0.04 | ||||||||||
| Income from Continuing Operations |
$ | 211 | $ | 320 | $ | 0.42 | $ | 0.63 | ||||||||
| Income from Discontinued Operations |
— | 3 | — | — | ||||||||||||
|
|
|
|
|
|
|
|
|
|||||||||
| Net Income |
$ | 211 | $ | 323 | $ | 0.42 | $ | 0.63 | ||||||||
|
|
|
|
|
|
|
|
|
|||||||||
| Avg. Shares | 507M | 507M | ||||||||||||||
Izzo went on to say, “we continue to forecast operating earnings for the full year of $2.25 - $2.50 per share. A strong balance sheet and the operational focus of a dedicated workforce support our expanded capital program and help to position PSEG for long-term growth.”
Operating Earnings guidance by company for the full year (which is unchanged from prior disclosure) is as follows:
| Operating Earnings |
||||||
| ($ million, except EPS) |
||||||
| 2012E | 2011A | |||||
| PSEG Power |
$575 - $665 | $ | 845 | |||
| PSE&G |
$530 - $560 | $ | 521 | |||
| PSEG Energy Holdings/Parent |
$35 - $45 | $ | 23 | |||
| Total |
$1,140 - $1,270 | $ | 1,389 | |||
| Earnings Per Share |
$2.25 - $2.50 | $ | 2.74 | |||
Operating Earnings Review and Outlook by Operating Subsidiary
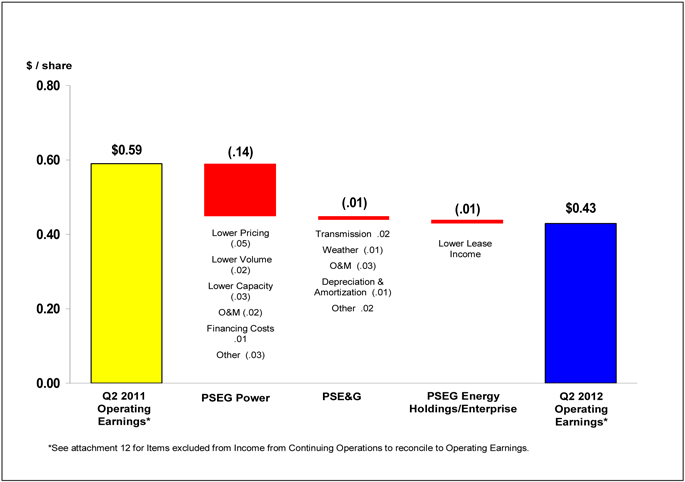
See Attachment 6 for detail regarding the quarter-over-quarter reconciliations for each of PSEG’s businesses.
PSEG Power
PSEG Power reported operating earnings of $110 million ($0.22 per share) for the second quarter of 2012 compared with operating earnings of $186 million ($0.36 per share) for the second quarter of 2011.
PSEG Power’s earnings declined in line with expectations during the quarter given lower prices for energy and capacity. Operations were aided by the availability and increased dispatch of the combined cycle natural gas fleet and the continued strong contribution from the nuclear fleet.
Lower realized prices for energy reduced Power’s earnings by $0.05 per share quarter-over-quarter. The decline in prices reflects lower prices under the Basic Generation Services (BGS) contract as well as lower wholesale prices. The contract price for one-third of the BGS related load declined to $84 per MWh on June 1, 2012 from $104 per MWh. The impact on earnings from the decline in price incorporates customer migration away from the BGS contract. Customer migration levels during the quarter were in line with expectations. A decline in average capacity prices reduced earnings in the quarter by $0.03 per share. Power’s margins in the quarter were also affected by warm weather which affected gas sendout under the BGSS contract as well as the absence of earnings in the year-ago quarter from the sale of coal which together reduced quarter-over-quarter earnings comparisons by $0.03 per share. An increase in O&M expense reduced earnings by $0.02 per share. The higher level of expenditures in the quarter reflects the impact of refueling related costs at Hope Creek. Power’s operating and maintenance continues to benefit from its ability to optimize its existing labor force and portfolio in reaction to market conditions. A decline in the level of debt at Power, and lower financing costs improved quarter-over-quarter earnings by $0.01 per share.
Production from Power’s combined cycle natural gas fleet increased 10% in the quarter to represent 32% of generation as the fleet’s capacity factor improved to approximately 57% from 52% as availability improved to 88%. Production from the nuclear fleet (56% of total generation) declined 3% from the year-ago quarter. A planned refueling outage at the Hope Creek nuclear station, 100%- owned by PSEG Power, more than offset the impact in the year-ago quarter of the refueling outage at the 57%-owned Salem 2 unit. The dispatch of the coal fleet continued to be affected by a decline in dark spreads. Output for Power’s generating fleet declined 4.6% from year-ago levels. The decline in generation reduced earnings by $0.02 per share.
PSEG Power’s nuclear fleet operated at an average capacity factor of 87.2% during the second quarter of 2012 compared to an average capacity factor of 90.3% in the year ago quarter. The performance for the quarter resulted in a capacity factor for the first half of 2012 of approximately 92.7% compared with an average capacity factor of 94.6% for the year ago period. Availability in the quarter was primarily affected by the planned refueling outage at the Hope Creek nuclear station.
Power continues to forecast output for 2012 of 53 - 54 TWh. Approximately 70 - 75% of output for the remainder of the year is hedged at an average price of $58 per MWh; for 2013, Power has hedged approximately 55-60% of its forecast output of 52-54 TWh at an average price of $54 per MWh; for 2014, Power has hedged approximately 25-30% of its forecast output of 53-55 TWh at an average price of $54 per MWh. (Average hedge prices exclude the price for capacity embedded in full requirement contracts.)
PSE&G
PSE&G reported operating earnings of $101 million ($0.20 per share) for the second quarter of 2012 compared with operating earnings of $105 million ($0.21 per share) for the second quarter of 2011.
PSE&G’s results were affected by an increase in transmission revenue and warmer than normal winter weather. An annualized increase in transmission revenue of $94 million effective on January 1,
2012 added $0.02 per share to earnings. Warmer than normal winter weather conditions in the quarter and weather, which was unfavorable compared to a year ago, reduced electric demand and earnings by $0.01 per share. Although a decline in demand for gas reduced earnings quarter-over-quarter by $0.01 per share, this was offset by revenues under the gas weather normalization charge. PSE&G experienced an increase in operating and maintenance expense which reduced earnings by $0.03 per share during the quarter. The increase, which was in line with expectations, reflects higher pension expense and the work associated with the company’s expanded investment program. An increase in depreciation expense, also associated with the expanded investment program, reduced earnings by $0.01 per share. Other miscellaneous items added $0.02 per share to quarter-over-quarter earnings comparisons.
PSE&G received regulatory approval from the NJ Board of Public Utilities (BPU) and the NJ Department of Environmental Protection (DEP) for construction of the 230 Kv North Central Reliability transmission line. The line represents a $390 million investment scheduled to enter service by mid-2014. It is one of several lines that comprise PSE&G’s $3.5 billion commitment to new transmission investment over 2012-2014.
PSEG Energy Holdings/Enterprise
PSEG Energy Holdings/Enterprise reported operating earnings of $4 million ($0.01 per share) for the second quarter of 2012 versus operating earnings of $10 million ($0.02 per share) during the second quarter of 2011. The decline in operating earnings for the quarter reflects expected lower earnings on leases.
Other Items - Long Island Power Authority
PSEG and the Long Island Power Authority (LIPA) received all necessary approvals for the 10-year contract that PSEG won in December 2011 to manage the transmission and distribution assets of LIPA. The contract, which is scheduled to begin in January 2014, represents an opportunity to improve returns and expand the capability of our business.
######
Forward-Looking Statement
Readers are cautioned that statements contained in this presentation about our future performance, including future revenues, earnings, strategies, prospects, consequences and all other statements that are not purely historical, are forward-looking statements for purposes of the safe harbor provisions under The Private Securities Litigation Reform Act of 1995. When used herein, the words “anticipate”, “intend”, “estimate”, “believe”, “expect”, “plan”, “should”, “hypothetical”, “potential”, “forecast”, “project”, variations of such words and similar expressions are intended to identify forward-looking statements. Although we believe that our expectations are based on reasonable assumptions, they are subject to risks and uncertainties and we can give no assurance they will be achieved. The results or developments projected or predicted in these statements may differ materially from what may actually occur. Factors which could cause results or events to differ from current expectations include, but are not limited to:
| • | adverse changes in the demand for or price of the capacity and energy that we sell into wholesale electricity markets, |
| • | adverse changes in energy industry law, policies and regulation, including market structures and a potential shift away from competitive markets toward subsidized market mechanisms, transmission planning and cost allocation rules, including rules regarding how transmission is planned and who is permitted to build transmission in the future, and reliability standards, |
| • | any inability of our transmission and distribution businesses to obtain adequate and timely rate relief and regulatory approvals from federal and state regulators, |
| • | changes in federal and state environmental regulations that could increase our costs or limit our operations, |
| • | changes in nuclear regulation and/or general developments in the nuclear power industry, including various impacts from any accidents or incidents experienced at our facilities or by others in the industry, that could limit operations of our nuclear generating units, |
| • | actions or activities at one of our nuclear units located on a multi-unit site that might adversely affect our ability to continue to operate that unit or other units located at the same site, |
| • | any inability to balance our energy obligations, available supply and trading risks, |
| • | any deterioration in our credit quality, or the credit quality of our counterparties, including in our leveraged leases, |
| • | availability of capital and credit at commercially reasonable terms and conditions and our ability to meet cash needs, |
| • | any inability to realize anticipated tax benefits or retain tax credits, |
| • | changes in the cost of, or interruption in the supply of, fuel and other commodities necessary to the operation of our generating units, |
| • | delays in receipt of necessary permits and approvals for our construction and development activities, |
| • | delays or unforeseen cost escalations in our construction and development activities, |
| • | any inability to achieve or continue to sustain, our expected levels of operating performance, |
| • | increase in competition in energy supply markets as well as competition for certain rate-based transmission projects, |
| • | any inability to realize anticipated tax benefits or retain tax credits, |
| • | challenges associated with recruitment and/or retention of a qualified workforce, |
| • | adverse performance of our decommissioning and defined benefit plan trust fund investments and changes in discount rates and funding requirements, and |
| • | changes in technology and customer usage patterns. |
For further information, please refer to our Annual Report on Form 10-K, including Item 1A. Risk Factors, and subsequent reports on Form 10-Q and Form 8-K filed with the Securities and Exchange Commission. These documents address in further detail our business, industry issues and other factors that could cause actual results to differ materially from those indicated in this presentation. In addition, any forward-looking statements included herein represent our estimates only as of today and should not be relied upon as representing our estimates as of any subsequent date. While we may elect to update forward-looking statements from time to time, we specifically disclaim any obligation to do so, even if our internal estimates change, unless otherwise required by applicable securities laws.
Attachment 1
PUBLIC SERVICE ENTERPRISE GROUP INCORPORATED
Operating Earnings and Per Share Results by Subsidiary
(Unaudited)
| For the Three Months Ended June 30, |
For the Six Months Ended June 30, |
|||||||||||||||
| 2012 | 2011 | 2012 | 2011 | |||||||||||||
| Earnings Results ($ Millions) | ||||||||||||||||
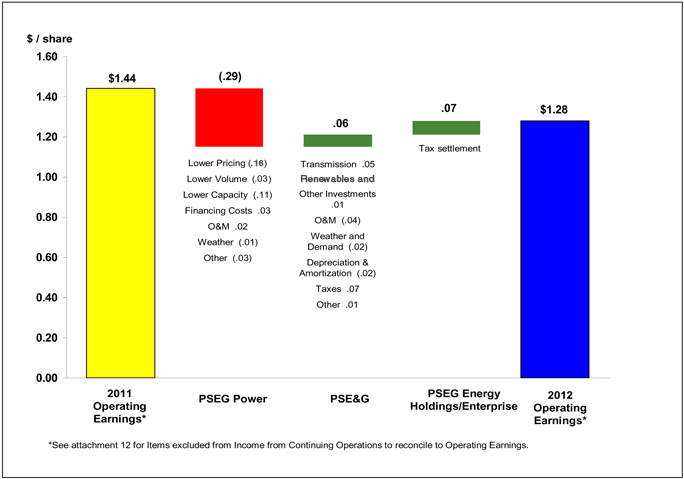
| PSEG Power |
$ | 110 | $ | 186 | $ | 306 | $ | 452 | ||||||||
| PSE&G |
101 | 105 | 298 | 268 | ||||||||||||
| PSEG Energy Holdings/Enterprise |
4 | 10 | 43 | 12 | ||||||||||||
|
|
|
|
|
|
|
|
|
|||||||||
| Operating Earnings |
$ | 215 | $ | 301 | $ | 647 | $ | 732 | ||||||||
|
|
|
|
|
|
|
|
|
|||||||||
| Reconciling Items(a) |
(4 | ) | 19 | 57 | 50 | |||||||||||
|
|
|
|
|
|
|
|
|
|||||||||
| Income from Continuing Operations |
$ | 211 | $ | 320 | $ | 704 | $ | 782 | ||||||||
|
|
|
|
|
|
|
|
|
|||||||||
| Discontinued Operations |
— | 3 | — | 67 | ||||||||||||
|
|
|
|
|
|
|
|
|
|||||||||
| Net Income |
$ | 211 | $ | 323 | $ | 704 | $ | 849 | ||||||||
|
|
|
|
|
|
|
|
|
|||||||||
| Fully Diluted Average Shares Outstanding (in Millions) |
507 | 507 | 507 | 507 | ||||||||||||
|
|
|
|
|
|
|
|
|
|||||||||
| Per Share Results (Diluted) | ||||||||||||||||
| PSEG Power |
$ | 0.22 | $ | 0.36 | $ | 0.60 | $ | 0.89 | ||||||||
| PSE&G |
0.20 | 0.21 | 0.59 | 0.53 | ||||||||||||
| PSEG Energy Holdings/Enterprise |
0.01 | 0.02 | 0.09 | 0.02 | ||||||||||||
|
|
|
|
|
|
|
|
|
|||||||||
| Operating Earnings |
$ | 0.43 | $ | 0.59 | $ | 1.28 | $ | 1.44 | ||||||||
|
|
|
|
|
|
|
|
|
|||||||||
| Reconciling Items(a) |
(0.01 | ) | 0.04 | 0.11 | 0.10 | |||||||||||
|
|
|
|
|
|
|
|
|
|||||||||
| Income from Continuing Operations |
$ | 0.42 | $ | 0.63 | $ | 1.39 | $ | 1.54 | ||||||||
|
|
|
|
|
|
|
|
|
|||||||||
| Discontinued Operations |
— | — | — | 0.13 | ||||||||||||
|
|
|
|
|
|
|
|
|
|||||||||
| Net Income |
$ | 0.42 | $ | 0.63 | $ | 1.39 | $ | 1.67 | ||||||||
|
|
|
|
|
|
|
|
|
|||||||||
| (a) | See attachment 12 for details of items excluded from Income from Continuing Operations to compute Operating Earnings. |
Attachment 2
PUBLIC SERVICE ENTERPRISE GROUP INCORPORATED
Consolidating Statements of Operations
(Unaudited, $ Millions)
| For the Three Months Ended June 30, 2012 | ||||||||||||||||
| PSEG | PSEG Energy Holdings/ Enterprise (a) |
PSEG POWER |
PSE&G | |||||||||||||
| OPERATING REVENUES |
$ | 2,098 | $ | (294 | ) | $ | 985 | $ | 1,407 | |||||||
| OPERATING EXPENSES |
||||||||||||||||
| Energy Costs |
761 | (308 | ) | 447 | 622 | |||||||||||
| Operation and Maintenance |
629 | (5 | ) | 284 | 350 | |||||||||||
| Depreciation and Amortization |
255 | 9 | 58 | 188 | ||||||||||||
| Taxes Other Than Income Taxes |
20 | — | 20 | |||||||||||||
|
|
|
|
|
|
|
|
|
|||||||||
| Total Operating Expenses |
1,665 | (304 | ) | 789 | 1,180 | |||||||||||
|
|
|
|
|
|
|
|
|
|||||||||
| OPERATING INCOME |
433 | 10 | 196 | 227 | ||||||||||||
| Income from Equity Method Investments |
2 | 2 | — | — | ||||||||||||
| Other Income and (Deductions) |
32 | 1 | 20 | 11 | ||||||||||||
| Other Than Temporary Impairments |
(7 | ) | — | (7 | ) | — | ||||||||||
| Interest Expense |
(103 | ) | 3 | (32 | ) | (74 | ) | |||||||||
|
|
|
|
|
|
|
|
|
|||||||||
| INCOME FROM CONTINUING OPERATIONS BEFORE INCOME TAXES |
357 | 16 | 177 | 164 | ||||||||||||
| Income Tax Benefit (Expense) |
(146 | ) | (10 | ) | (73 | ) | (63 | ) | ||||||||
|
|
|
|
|
|
|
|
|
|||||||||
| NET INCOME |
$ | 211 | $ | 6 | $ | 104 | $ | 101 | ||||||||
|
|
|
|
|
|
|
|
|
|||||||||
| OPERATING EARNINGS |
215 | $ | 4 | $ | 110 | $ | 101 | |||||||||
| Reconciling Items Excluded from Continuing Operations (b) |
(4 | ) | 2 | (6 | ) | — | ||||||||||
|
|
|
|
|
|
|
|
|
|||||||||
| INCOME FROM CONTINUING OPERATIONS |
$ | 211 | $ | 6 | $ | 104 | $ | 101 | ||||||||
|
|
|
|
|
|
|
|
|
|||||||||
| For the Three Months Ended June 30, 2011 | ||||||||||||||||
| PSEG | PSEG Energy Holdings/ Enterprise (a) |
PSEG POWER |
PSE&G | |||||||||||||
| OPERATING REVENUES |
$ | 2,469 | $ | (387 | ) | $ | 1,285 | $ | 1,571 | |||||||
| OPERATING EXPENSES |
||||||||||||||||
| Energy Costs |
1,010 | (408 | ) | 603 | 815 | |||||||||||
| Operation and Maintenance |
575 | — | 271 | 304 | ||||||||||||
| Depreciation and Amortization |
235 | 7 | 56 | 172 | ||||||||||||
| Taxes Other Than Income Taxes |
28 | — | — | 28 | ||||||||||||
|
|
|
|
|
|
|
|
|
|||||||||
| Total Operating Expenses |
1,848 | (401 | ) | 930 | 1,319 | |||||||||||
|
|
|
|
|
|
|
|
|
|||||||||
| OPERATING INCOME |
621 | 14 | 355 | 252 | ||||||||||||
| Income from Equity Method Investments |
4 | 4 | — | — | ||||||||||||
| Other Income and (Deductions) |
40 | 1 | 35 | 4 | ||||||||||||
| Other Than Temporary Impairments |
(1 | ) | — | (1 | ) | — | ||||||||||
| Interest Expense |
(117 | ) | 2 | (41 | ) | (78 | ) | |||||||||
|
|
|
|
|
|
|
|
|
|||||||||
| INCOME FROM CONTINUING OPERATIONS BEFORE INCOME TAXES |
547 | 21 | 348 | 178 | ||||||||||||
| Income Tax Benefit (Expense) |
(227 | ) | (11 | ) | (143 | ) | (73 | ) | ||||||||
|
|
|
|
|
|
|
|
|
|||||||||
| INCOME FROM CONTINUING OPERATIONS |
320 | 10 | 205 | 105 | ||||||||||||
| Discontinued Operations, net of tax |
3 | — | 3 | — | ||||||||||||
|
|
|
|
|
|
|
|
|
|||||||||
| NET INCOME |
$ | 323 | $ | 10 | $ | 208 | $ | 105 | ||||||||
|
|
|
|
|
|
|
|
|
|||||||||
| OPERATING EARNINGS |
$ | 301 | $ | 10 | $ | 186 | $ | 105 | ||||||||
| Reconciling Items Excluded from Continuing Operations (b) |
19 | — | 19 | — | ||||||||||||
|
|
|
|
|
|
|
|
|
|||||||||
| INCOME FROM CONTINUING OPERATIONS |
$ | 320 | $ | 10 | $ | 205 | $ | 105 | ||||||||
|
|
|
|
|
|
|
|
|
|||||||||
| (a) | Includes activities at Energy Holdings and the Parent as well as intercompany eliminations. |
| (b) | See attachment 12 for details of items excluded from Income from Continuing Operations to compute Operating Earnings. |
Attachment 3
PUBLIC SERVICE ENTERPRISE GROUP INCORPORATED
Consolidating Statements of Operations
(Unaudited, $ Millions)
| For the Six Months Ended June 30, 2012 | ||||||||||||||||
| PSEG | PSEG Energy Holdings/ Enterprise (a) |
PSEG POWER |
PSE&G | |||||||||||||
| OPERATING REVENUES |
$ | 4,973 | $ | (919 | ) | $ | 2,546 | $ | 3,346 | |||||||
| OPERATING EXPENSES |
||||||||||||||||
| Energy Costs |
1,940 | (953 | ) | 1,269 | 1,624 | |||||||||||
| Operation and Maintenance |
1,257 | 6 | 525 | 726 | ||||||||||||
| Depreciation and Amortization |
511 | 18 | 115 | 378 | ||||||||||||
| Taxes Other Than Income Taxes |
49 | — | — | 49 | ||||||||||||
|
|
|
|
|
|
|
|
|
|||||||||
| Total Operating Expenses |
3,757 | (929 | ) | 1,909 | 2,777 | |||||||||||
|
|
|
|
|
|
|
|
|
|||||||||
| OPERATING INCOME |
1,216 | 10 | 637 | 569 | ||||||||||||
| Income from Equity Method Investments |
2 | 2 | — | — | ||||||||||||
| Other Income and (Deductions) |
60 | 4 | 35 | 21 | ||||||||||||
| Other Than Temporary Impairments |
(12 | ) | — | (12 | ) | — | ||||||||||
| Interest Expense |
(204 | ) | 5 | (62 | ) | (147 | ) | |||||||||
|
|
|
|
|
|
|
|
|
|||||||||
| INCOME FROM CONTINUING OPERATIONS BEFORE INCOME TAXES |
1,062 | 21 | 598 | 443 | ||||||||||||
| Income Tax Benefit (Expense) |
(358 | ) | 28 | (241 | ) | (145 | ) | |||||||||
|
|
|
|
|
|
|
|
|
|||||||||
| NET INCOME |
$ | 704 | $ | 49 | $ | 357 | $ | 298 | ||||||||
|
|
|
|
|
|
|
|
|
|||||||||
| OPERATING EARNINGS |
$ | 647 | $ | 43 | $ | 306 | $ | 298 | ||||||||
| Reconciling Items Excluded from Continuing Operations (b) |
57 | 6 | 51 | — | ||||||||||||
|
|
|
|
|
|
|
|
|
|||||||||
| INCOME FROM CONTINUING OPERATIONS |
$ | 704 | $ | 49 | $ | 357 | $ | 298 | ||||||||
|
|
|
|
|
|
|
|
|
|||||||||
| For the Six Months Ended June 30, 2011 | ||||||||||||||||
| PSEG | PSEG Energy Holdings/ Enterprise (a) |
PSEG POWER |
PSE&G | |||||||||||||
| OPERATING REVENUES |
$ | 5,823 | $ | (1,306 | ) | $ | 3,252 | $ | 3,877 | |||||||
| OPERATING EXPENSES |
||||||||||||||||
| Energy Costs |
2,573 | (1,346 | ) | 1,738 | 2,181 | |||||||||||
| Operation and Maintenance |
1,226 | 6 | 548 | 672 | ||||||||||||
| Depreciation and Amortization |
476 | 15 | 110 | 351 | ||||||||||||
| Taxes Other Than Income Taxes |
71 | — | — | 71 | ||||||||||||
|
|
|
|
|
|
|
|
|
|||||||||
| Total Operating Expenses |
4,346 | (1,325 | ) | 2,396 | 3,275 | |||||||||||
|
|
|
|
|
|
|
|
|
|||||||||
| OPERATING INCOME |
1,477 | 19 | 856 | 602 | ||||||||||||
| Income from Equity Method Investments |
7 | 7 | — | — | ||||||||||||
| Other Income and (Deductions) |
103 | 2 | 93 | 8 | ||||||||||||
| Other Than Temporary Impairments |
(5 | ) | (1 | ) | (3 | ) | (1 | ) | ||||||||
| Interest Expense |
(244 | ) | 5 | (92 | ) | (157 | ) | |||||||||
|
|
|
|
|
|
|
|
|
|||||||||
| INCOME FROM CONTINUING OPERATIONS BEFORE INCOME TAXES |
1,338 | 32 | 854 | 452 | ||||||||||||
| Income Tax Benefit (Expense) |
(556 | ) | (20 | ) | (352 | ) | (184 | ) | ||||||||
|
|
|
|
|
|
|
|
|
|||||||||
| INCOME FROM CONTINUING OPERATIONS |
782 | 12 | 502 | 268 | ||||||||||||
| Discontinued Operations, net of tax |
67 | — | 67 | — | ||||||||||||
|
|
|
|
|
|
|
|
|
|||||||||
| NET INCOME |
$ | 849 | $ | 12 | $ | 569 | $ | 268 | ||||||||
|
|
|
|
|
|
|
|
|
|||||||||
| OPERATING EARNINGS |
$ | 732 | $ | 12 | $ | 452 | $ | 268 | ||||||||
| Reconciling Items Excluded from Continuing Operations (b) |
50 | — | 50 | — | ||||||||||||
|
|
|
|
|
|
|
|
|
|||||||||
| INCOME FROM CONTINUING OPERATIONS |
$ | 782 | $ | 12 | $ | 502 | $ | 268 | ||||||||
|
|
|
|
|
|
|
|
|
|||||||||
| (a) | Includes activities at Energy Holdings and the Parent as well as intercompany eliminations. |
| (b) | See attachment 12 for details of items excluded from Income from Continuing Operations to compute Operating Earnings. |
Attachment 4
PUBLIC SERVICE ENTERPRISE GROUP INCORPORATED
Capitalization Schedule
(Unaudited, $ Millions)
| June 30, 2012 |
December 31, 2011 |
|||||||
| DEBT |
||||||||
| Commercial Paper and Loans |
$ | 16 | $ | — | ||||
| Long-Term Debt |
7,426 | 7,060 | ||||||
| Securitization Debt |
837 | 939 | ||||||
| Project Level, Non-Recourse Debt |
45 | 95 | ||||||
|
|
|
|
|
|||||
| Total Debt |
8,324 | 8,094 | ||||||
| STOCKHOLDERS’ EQUITY |
||||||||
| Common Stock |
4,829 | 4,823 | ||||||
| Treasury Stock |
(605 | ) | (601 | ) | ||||
| Retained Earnings |
6,730 | 6,385 | ||||||
| Accumulated Other Comprehensive Loss |
(310 | ) | (337 | ) | ||||
|
|
|
|
|
|||||
| Total Common Stockholders’ Equity |
10,644 | 10,270 | ||||||
| Noncontrolling Interests - Equity Investments |
2 | 2 | ||||||
|
|
|
|
|
|||||
| Total Equity |
10,646 | 10,272 | ||||||
|
|
|
|
|
|||||
| Total Capitalization |
$ | 18,970 | $ | 18,366 | ||||
|
|
|
|
|
|||||
Attachment 5
PUBLIC SERVICE ENTERPRISE GROUP INCORPORATED
CONDENSED CONSOLIDATED STATEMENTS OF CASH FLOWS
(Unaudited, $ Millions)
| For the Six Months Ended June 30, |
||||||||
| 2012 | 2011 | |||||||
| CASH FLOWS FROM OPERATING ACTIVITIES |
||||||||
| Net Income |
$ | 704 | $ | 849 | ||||
| Adjustments to Reconcile Net Income to Net Cash Flows From Operating Activities |
674 | 546 | ||||||
|
|
|
|
|
|||||
| NET CASH PROVIDED BY OPERATING ACTIVITIES |
1,378 | 1,395 | ||||||
|
|
|
|
|
|||||
| NET CASH USED IN INVESTING ACTIVITIES |
(1,339 | ) | (673 | ) | ||||
|
|
|
|
|
|||||
| NET CASH USED IN FINANCING ACTIVITIES |
(108 | ) | (843 | ) | ||||
|
|
|
|
|
|||||
| Net Decrease in Cash and Cash Equivalents |
(69 | ) | (121 | ) | ||||
| Cash and Cash Equivalents at Beginning of Period |
834 | 280 | ||||||
|
|
|
|
|
|||||
| Cash and Cash Equivalents at End of Period |
$ | 765 | $ | 159 | ||||
|
|
|
|
|
|||||
Attachment 6
PUBLIC SERVICE ENTERPRISE GROUP INCORPORATED
Quarter-over-Quarter EPS Reconciliation
June 30, 2012 vs. June 30, 2011
(Unaudited)
Attachment 7
PUBLIC SERVICE ENTERPRISE GROUP INCORPORATED
Year-over-Year EPS Reconciliation
June 30, 2012 vs. June 30, 2011
(Unaudited)
Attachment 8
PSEG POWER LLC
Generation Measures
(Unaudited)
| GWhr Breakdown | GWhr Breakdown | |||||||||||||||
| Three Months Ended June 30, |
Six Months Ended June 30, |
|||||||||||||||
| 2012 | 2011 | 2012 | 2011 | |||||||||||||
| Nuclear - NJ |
4,599 | 4,842 | 10,035 | 10,307 | ||||||||||||
| Nuclear - PA |
2,476 | 2,465 | 5,010 | 4,929 | ||||||||||||
|
|
|
|
|
|
|
|
|
|||||||||
| Total Nuclear |
7,075 | 7,307 | 15,045 | 15,236 | ||||||||||||
| Fossil - Coal/Natural Gas - NJ* |
363 | 845 | 407 | 1,572 | ||||||||||||
| Fossil - Coal - PA |
1,069 | 1,289 | 2,133 | 2,666 | ||||||||||||
| Fossil - Coal - CT |
22 | 57 | 45 | 265 | ||||||||||||
|
|
|
|
|
|
|
|
|
|||||||||
| Total Coal |
1,454 | 2,191 | 2,585 | 4,503 | ||||||||||||
| Fossil - Oil & Natural Gas - NJ |
2,997 | 2,879 | 5,837 | 5,632 | ||||||||||||
| Fossil - Oil & Natural Gas - NY |
1,164 | 944 | 2,375 | 1,970 | ||||||||||||
| Fossil - Oil & Natural Gas - CT |
16 | 1 | 7 | 12 | ||||||||||||
|
|
|
|
|
|
|
|
|
|||||||||
| Total Oil & Natural Gas |
4,177 | 3,824 | 8,219 | 7,614 | ||||||||||||
|
|
|
|
|
|
|
|
|
|||||||||
| 12,706 | 13,322 | 25,849 | 27,353 | |||||||||||||
| % Generation by Fuel Type |
% Generation by Fuel Type |
|||||||||||||||
| Three Months Ended | Six Months Ended | |||||||||||||||
| June 30, | June 30, | |||||||||||||||
| 2012 | 2011 | 2012 | 2011 | |||||||||||||
| Nuclear - NJ |
36 | % | 36 | % | 39 | % | 38 | % | ||||||||
| Nuclear - PA |
20 | % | 19 | % | 19 | % | 18 | % | ||||||||
|
|
|
|
|
|
|
|
|
|||||||||
| Total Nuclear |
56 | % | 55 | % | 58 | % | 56 | % | ||||||||
| Fossil - Coal/Natural Gas - NJ* |
3 | % | 6 | % | 2 | % | 5 | % | ||||||||
| Fossil - Coal - PA |
8 | % | 10 | % | 8 | % | 10 | % | ||||||||
| Fossil - Coal - CT |
0 | % | 0 | % | 0 | % | 1 | % | ||||||||
|
|
|
|
|
|
|
|
|
|||||||||
| Total Coal |
11 | % | 16 | % | 10 | % | 16 | % | ||||||||
| Fossil - Oil & Natural Gas - NJ |
24 | % | 22 | % | 23 | % | 21 | % | ||||||||
| Fossil - Oil & Natural Gas - NY |
9 | % | 7 | % | 9 | % | 7 | % | ||||||||
| Fossil - Oil & Natural Gas - CT |
0 | % | 0 | % | 0 | % | 0 | % | ||||||||
|
|
|
|
|
|
|
|
|
|||||||||
| Total Oil & Natural Gas |
33 | % | 29 | % | 32 | % | 28 | % | ||||||||
|
|
|
|
|
|
|
|
|
|||||||||
| 100 | % | 100 | % | 100 | % | 100 | % | |||||||||
| * | Includes Pumped Storage. Pumped Storage accounted for <1% of total generation for the three and six months ended June 30, 2012 and 2011. Also, 2012 generation includes natural gas fuel switching intervals. |
Attachment 9
PUBLIC SERVICE ELECTRIC & GAS COMPANY
Retail Sales and Revenues
(Unaudited)
June 30, 2012
Electric Sales and Revenues
| Sales (millions kwh) |
Three Months Ended |
Change vs. 2011 |
Six Months Ended |
Change vs. 2011 |
||||||||||||
| Residential |
3,052 | -4.9 | % | 6,041 | -6.1 | % | ||||||||||
| Commercial & Industrial |
6,857 | -1.9 | % | 13,608 | -2.8 | % | ||||||||||
| Street Lighting |
67 | -11.6 | % | 157 | -12.0 | % | ||||||||||
| Interdepartmental |
2 | -35.9 | % | 4 | -20.0 | % | ||||||||||
|
|
|
|
|
|
|
|
|
|||||||||
| Total |
9,978 | -2.9 | % | 19,810 | -3.9 | % | ||||||||||
|
|
|
|
|
|
|
|
|
|||||||||
| Revenue (in millions) |
||||||||||||||||
| Residential |
$ | 478 | -8.7 | % | $ | 971 | -9.6 | % | ||||||||
| Commercial & Industrial |
530 | -8.7 | % | 1,020 | -7.9 | % | ||||||||||
| Street Lighting |
17 | -2.6 | % | 38 | 0.2 | % | ||||||||||
| Other Operating Revenues* |
83 | -16.1 | % | 174 | -7.1 | % | ||||||||||
|
|
|
|
|
|
|
|
|
|||||||||
| Total |
$ | 1,108 | -9.2 | % | $ | 2,203 | -8.5 | % | ||||||||
|
|
|
|
|
|
|
|
|
|||||||||
| Weather Data |
Three Months Ended |
Change vs. 2011 |
Six Months Ended |
Change vs. 2011 |
||||||||||||
| THI Hours - Actual |
4,327 | -16.6 | % | 4,408 | -15.3 | % | ||||||||||
| THI Hours - Normal |
3,953 | 3,977 | ||||||||||||||
| * | Primarily sales of Non-Utility Generator energy to PJM and Transmission related revenues. |
Attachment 10
PUBLIC SERVICE ELECTRIC & GAS COMPANY
Retail Sales and Revenues
(Unaudited)
June 30, 2012
Gas Sold and Transported
| Sales (millions therms) |
Three Months Ended |
Change vs. 2011 |
Six Months Ended |
Change vs. 2011 |
||||||||||||
| Residential Sales |
151 | -14.8 | % | 679 | -19.8 | % | ||||||||||
| Commercial & Industrial - Firm Sales |
52 | -19.3 | % | 243 | -21.7 | % | ||||||||||
| Commercial & Industrial - Interr. & Cogen |
18 | -58.4 | % | 42 | -46.2 | % | ||||||||||
|
|
|
|
|
|
|
|
|
|||||||||
| Total |
221 | -22.5 | % | 964 | -22.0 | % | ||||||||||
|
|
|
|
|
|
|
|
|
|||||||||
| Gas Transported - Firm Sales |
82 | -8.1 | % | 293 | -10.7 | % | ||||||||||
| Gas Transported - Non-Firm |
267 | -33.3 | % | 545 | 26.8 | % | ||||||||||
| Revenue (in millions) |
||||||||||||||||
| Residential Sales |
$ | 84 | -23.4 | % | $ | 355 | -32.6 | % | ||||||||
| Commercial & Industrial - Firm Sales |
22 | -44.1 | % | 119 | -40.0 | % | ||||||||||
| Commercial & Industrial - Interr. & Cogen |
7 | -72.1 | % | 18 | -60.0 | % | ||||||||||
| Other Operating Revenues* |
40 | 5.0 | % | 77 | 3.6 | % | ||||||||||
|
|
|
|
|
|
|
|
|
|||||||||
| Total |
$ | 153 | 27.7 | % | $ | 569 | -32.6 | % | ||||||||
|
|
|
|
|
|
|
|
|
|||||||||
| Gas Transported |
$ | 146 | 4.6 | % | $ | 574 | -8.4 | % | ||||||||
| Weather Data |
Three Months Ended |
Change vs. 2011 |
Six Months Ended |
Change vs. 2011 |
||||||||||||
| Degree Days - Actual |
382 | -8.0 | % | 2,408 | -19.1 | % | ||||||||||
| Degree Days - Normal |
509 | 3,067 | ||||||||||||||
| * | Primarily Appliance Service. |
Attachment 11
PUBLIC SERVICE ENTERPRISE GROUP INCORPORATED
Statistical Measures
(Unaudited)
| For the Three Months Ended June 30 |
For the Six Months Ended June 30 |
|||||||||||||||
| 2012 | 2011 | 2012 | 2011 | |||||||||||||
| Weighted Average Common Shares Outstanding (000’s) |
||||||||||||||||
| Basic |
505,903 | 505,988 | 505,956 | 505,984 | ||||||||||||
| Diluted |
506,969 | 506,761 | 506,999 | 506,945 | ||||||||||||
| Stock Price at End of Period |
$ | 32.50 | $ | 32.64 | ||||||||||||
| Dividends Paid per Share of Common Stock |
$ | 0.3550 | $ | 0.3425 | $ | 0.7100 | $ | 0.6850 | ||||||||
| Dividend Payout Ratio* |
54.3 | % | 44.6 | % | ||||||||||||
| Dividend Yield |
4.4 | % | 4.2 | % | ||||||||||||
| Price/Earnings Ratio* |
12.6 | 10.6 | ||||||||||||||
| Rate of Return on Average Common Equity* |
12.6 | % | 16.1 | % | ||||||||||||
| Book Value per Common Share |
$ | 21.04 | $ | 19.98 | ||||||||||||
| Market Price as a Percent of Book Value |
154 | % | 163 | % | ||||||||||||
| Total Shareholder Return |
7.4 | % | 4.7 | % | 0.7 | % | 4.8 | % | ||||||||
| * | Calculation based on Operating Earnings for the 12 month period ended. |
Attachment 12
PUBLIC SERVICE ENTERPRISE GROUP INCORPORATED
Reconciling Items Excluded from Continuing Operations to Compute Operating Earnings
(Unaudited)
| Pro-forma Adjustments, net of tax |
For the Three Months Ended June 30, |
For the Six Months Ended June 30, |
||||||||||||||
| 2012 | 2011 | 2012 | 2011 | |||||||||||||
| Earnings Impact ($ Millions) | ||||||||||||||||
| Gain (Loss) on Nuclear Decommissioning Trust (NDT) Fund Related Activity (PSEG Power) |
$ | 4 | $ | 15 | $ | 9 | $ | 42 | ||||||||
| Gain (Loss) on Mark-to-Market (MTM)(a) (PSEG Power) |
(10 | ) | 4 | 42 | 8 | |||||||||||
| Lease Related Activity (PSEG Energy Holdings) |
2 | — | 6 | — | ||||||||||||
|
|
|
|
|
|
|
|
|
|||||||||
| Total Pro-forma adjustments |
$ | (4 | ) | $ | 19 | $ | 57 | $ | 50 | |||||||
|
|
|
|
|
|
|
|
|
|||||||||
| Fully Diluted Average Shares Outstanding (in Millions) |
507 | 507 | 507 | 507 | ||||||||||||
|
|
|
|
|
|
|
|
|
|||||||||
| Per Share Impact (Diluted) | ||||||||||||||||
| Gain (Loss) on NDT Fund Related Activity (PSEG Power) |
$ | 0.01 | $ | 0.03 | $ | 0.02 | $ | 0.08 | ||||||||
| Gain (Loss) on MTM(a) (PSEG Power) |
(0.02 | ) | 0.01 | 0.08 | 0.02 | |||||||||||
| Lease Related Activity (PSEG Energy Holdings) |
— | — | 0.01 | — | ||||||||||||
|
|
|
|
|
|
|
|
|
|||||||||
| Total Pro-forma adjustments |
$ | (0.01 | ) | $ | 0.04 | $ | 0.11 | $ | 0.10 | |||||||
|
|
|
|
|
|
|
|
|
|||||||||
| (a) | Includes the financial impact from positions with forward delivery months. |