Attached files
| file | filename |
|---|---|
| 8-K - FORM 8-K - ONCOR ELECTRIC DELIVERY CO LLC | d388275d8k.htm |
Exhibit 99.1

|
ONCOR
Second Quarter 2012 Investor Call
July 31, 2012
Oncor Electric Delivery
|
Forward Looking Statements
This presentation contains forward-looking statements, which are subject to various risks and uncertainties. Discussion of risks and uncertainties that could cause actual results to differ materially from management’s current projections, forecasts, estimates and expectations is contained in filings made by Oncor Electric Delivery Company LLC (Oncor) with the Securities and Exchange Commission (SEC). Specifically, Oncor makes reference to the section entitled “Risk Factors” in its annual and quarterly reports. In addition to the risks and uncertainties set forth in Oncor’s SEC filings, the forward-looking statements in this presentation could be affected by, among other things: prevailing governmental policies and regulatory actions; legal and administrative proceedings and settlements, including the exercise of equitable powers by courts; weather conditions and other natural phenomena; acts of sabotage, wars or terrorist or cyber security threats or activities; economic conditions, including the impact of a recessionary environment; unanticipated population growth or decline, or changes in market demand and demographic patterns; changes in business strategy, development plans or vendor relationships; unanticipated changes in interest rates or rates of inflation; unanticipated changes in operating expenses, liquidity needs and capital expenditures; inability of various counterparties to meet their financial obligations to Oncor, including failure of counterparties to perform under agreements; general industry trends; hazards customary to the industry and the possibility that Oncor may not have adequate insurance to cover losses resulting from such hazards; changes in technology used by and services offered by Oncor; significant changes in Oncor’s relationship with its employees; changes in assumptions used to estimate costs of providing employee benefits, including pension and other post-retirement employee benefits, and future funding requirements related thereto; significant changes in critical accounting policies material to Oncor; commercial bank and financial market conditions, access to capital, the cost of such capital, and the results of financing and refinancing efforts, including availability of funds in the capital markets and the potential impact of disruptions in US credit markets; circumstances which may contribute to future impairment of goodwill, intangible or other long-lived assets; financial restrictions under Oncor’s revolving credit facility and indentures governing its debt instruments; Oncor’s ability to generate sufficient cash flow to make interest payments on its debt instruments; actions by credit rating agencies; and Oncor’s ability to effectively execute its operational strategy. Any forward-looking statement speaks only as of the date on which it is made, and Oncor undertakes no obligation to update any forward-looking statement to reflect events or circumstances after the date on which it is made or to reflect the occurrence of unanticipated events.
Regulation G
This presentation includes certain non-GAAP financial measures. A reconciliation of these measures to the most directly comparable GAAP measures is included in this presentation, which is available on Oncor’s website, www.oncor.com, under the ‘News’ tab in the Investor Information section, and also filed with the SEC.
Oncor Electric Delivery 1
|
2nd Quarter 2012 Investor Call Agenda
Financial Overview David Davis
Chief Financial Officer
Operational Review Bob Shapard
Chairman and CEO
Q&A
Oncor Electric Delivery 2
|
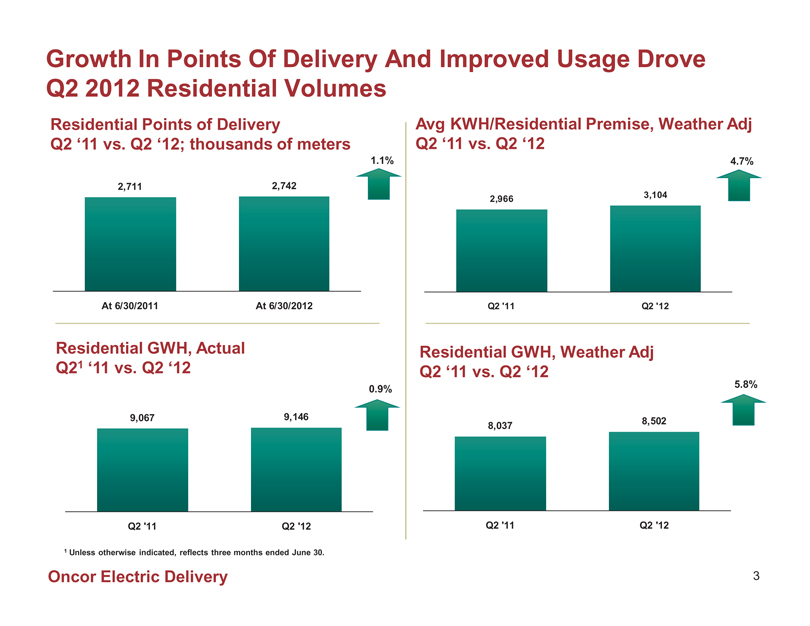
Growth In Points Of Delivery And Improved Usage Drove Q2 2012 Residential Volumes
Residential Points of Delivery
Q2 ‘11 vs. Q2 ‘12; thousands of meters
1.1%
2,711
2,742
At 6/30/2011 At 6/30/2012
Residential GWH, Actual Q21 ‘11 vs. Q2 ‘12
0.9%
9,067
9,146
Q2 ‘11 Q2 ‘12
1 Unless otherwise indicated, reflects three months ended June 30.
Avg KWH/Residential Premise, Weather Adj Q2 ‘11 vs. Q2 ‘12
4.7%
3,104 2,966
Q2 ‘11 Q2 ‘12
Residential GWH, Weather Adj Q2 ‘11 vs. Q2 ‘12
5.8%
8,502 8,037
Q2 ‘11 Q2 ‘12
Oncor Electric Delivery 3
|
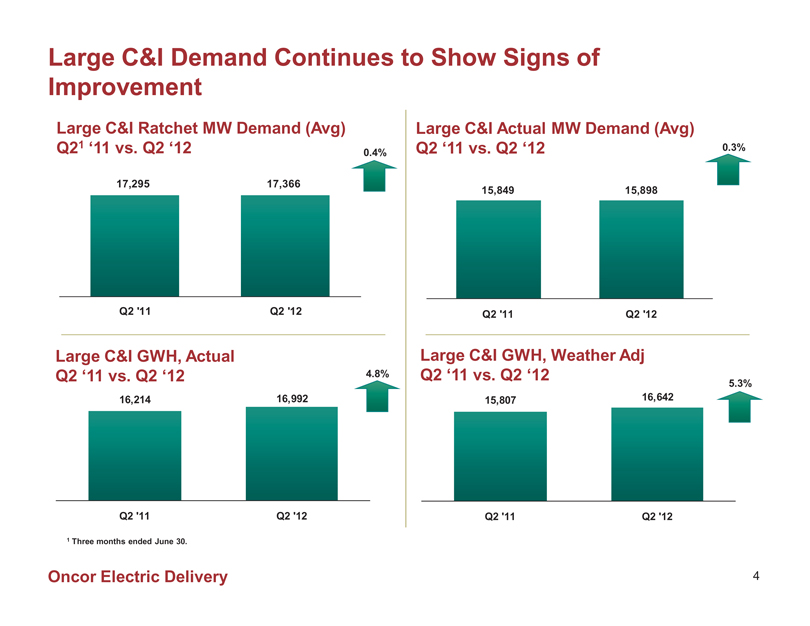
Large C&I Demand Continues to Show Signs of Improvement
Large C&I Ratchet MW Demand (Avg) Q21 ‘11 vs. Q2 ‘12
0.4%
17,295 17,366
Q2 ‘11 Q2 ‘12
Large C&I GWH, Actual Q2 ‘11 vs. Q2 ‘12
4.8%
16,214 16,992
Q2 ‘11 Q2 ‘12
1 Three months ended June 30.
Large C&I Actual MW Demand (Avg) Q2 ‘11 vs. Q2 ‘12
0.3%
15,849 15,898
Q2 ‘11 Q2 ‘12
Large C&I GWH, Weather Adj Q2 ‘11 vs. Q2 ‘12
5.3% 15,807 16,642
Q2 ‘11 Q2 ‘12
Oncor Electric Delivery 4
|
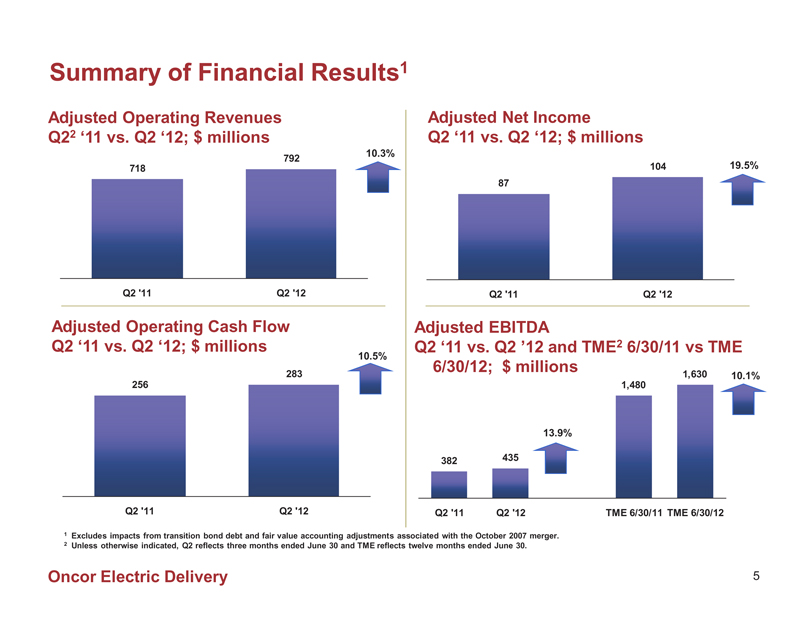
Summary of Financial Results1
Adjusted Operating Revenues Q22 ‘11 vs. Q2 ‘12; $ millions
10.3% 792 718
Q2 ‘11 Q2 ‘12
Adjusted Operating Cash Flow Q2 ‘11 vs. Q2 ‘12; $ millions
10.5%
283 256
Q2 ‘11 Q2 ‘12
Adjusted Net Income
Q2 ‘11 vs. Q2 ‘12; $ millions
104 19.5% 87
Q2 ‘11 Q2 ‘12
Adjusted EBITDA
Q2 ‘11 vs. Q2 ’12 and TME2 6/30/11 vs TME 6/30/12; $ millions
1,630 10.1% 1,480
13.9% 382 435
Q2 ‘11 Q2 ‘12 TME 6/30/11 TME 6/30/12
1 Excludes impacts from transition bond debt and fair value accounting adjustments associated with the October 2007 merger.
2 Unless otherwise indicated, Q2 reflects three months ended June 30 and TME reflects twelve months ended June 30.
Oncor Electric Delivery 5
|
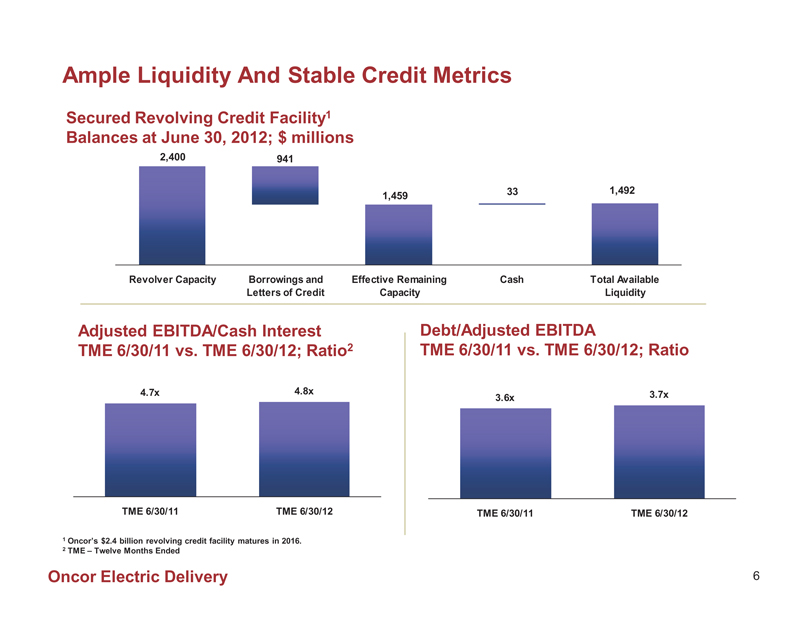
Ample Liquidity And Stable Credit Metrics
Secured Revolving Credit Facility1 Balances at June 30, 2012; $ millions
2,400
941
33
1,492
1,459
Revolver Capacity
Borrowings and Letters of Credit
Effective Remaining Capacity
Cash
Total Available Liquidity
Adjusted EBITDA/Cash Interest TME 6/30/11 vs. TME 6/30/12; Ratio2
4.7x 4.8x
TME 6/30/11 TME 6/30/12
Debt/Adjusted EBITDA
TME 6/30/11 vs. TME 6/30/12; Ratio
3.6x 3.7x
TME 6/30/11 TME 6/30/12
1 Oncor’s $2.4 billion revolving credit facility matures in 2016.
2 TME – Twelve Months Ended
Oncor Electric Delivery 6
|
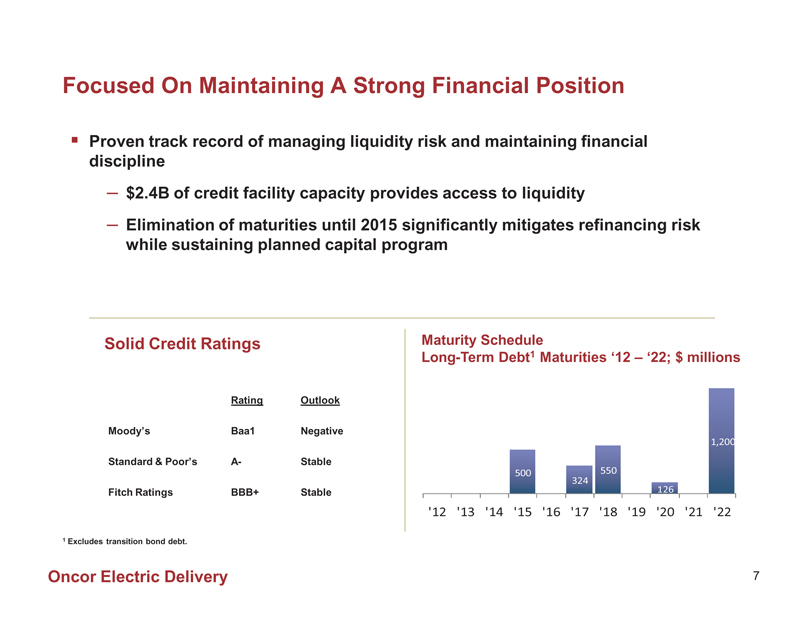
Focused On Maintaining A Strong Financial Position
Proven track record of managing liquidity risk and maintaining financial discipline
– $2.4B of credit facility capacity provides access to liquidity
– Elimination of maturities until 2015 significantly mitigates refinancing risk while sustaining planned capital program
Solid Credit Ratings
Rating Outlook
Moody’s Baa1 Negative
Standard & Poor’s A- Stable
Fitch Ratings BBB+ Stable
Maturity Schedule
Long-Term Debt1 Maturities ‘12 – ‘22; $ millions
500
324
550
126
1,200
‘12 ‘13 ‘14 ‘15 ‘16 ‘17 ‘18 ‘19 ‘20 ‘21 ‘22
1 Excludes transition bond debt.
Oncor Electric Delivery 7
|
2nd Quarter 2012 Investor Call Agenda
Financial Overview David Davis
Chief Financial Officer
Operational Review Bob Shapard
Chairman and CEO
Q&A
Oncor Electric Delivery 8
|
Appendix -
Regulation G Reconciliations and Supplemental Data
Oncor Electric Delivery 9
|
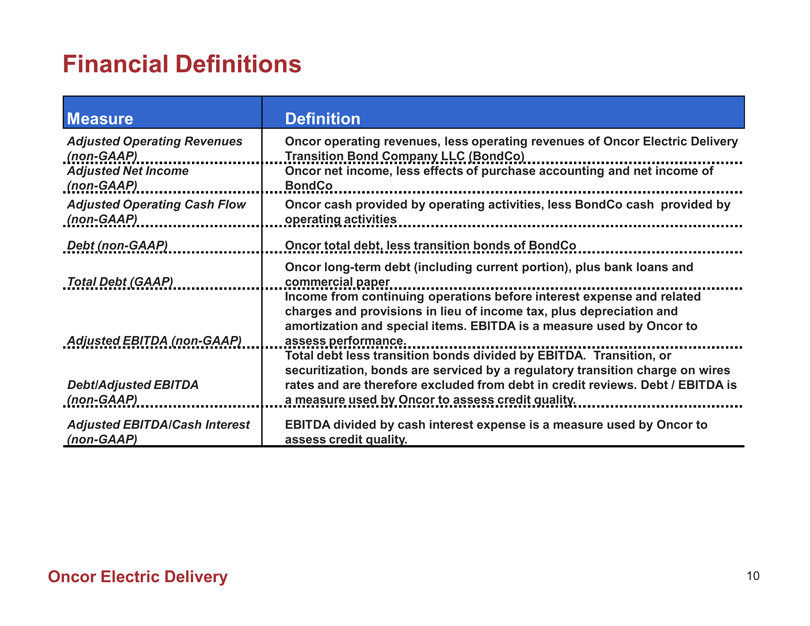
Financial Definitions
Measure Definition
Adjusted Operating Revenues (non-GAAP) Oncor operating revenues, less operating revenues of Oncor Electric Delivery Transition Bond Company LLC (BondCo)
Adjusted Net Income (non-GAAP) Oncor net income, less effects of purchase accounting and net income of BondCo
Adjusted Operating Cash Flow (non-GAAP) Oncor cash provided by operating activities, less BondCo cash provided by operating activities
Debt (non-GAAP) Oncor total debt, less transition bonds of BondCo
Total Debt (GAAP) Oncor long-term debt (including current portion), plus bank loans and commercial paper
Adjusted EBITDA (non-GAAP) Income from continuing operations before interest expense and related charges and provisions in lieu of income tax, plus depreciation and amortization and special items. EBITDA is a measure used by Oncor to assess performance.
Debt/Adjusted EBITDA (non-GAAP) Total debt less transition bonds divided by EBITDA. Transition, or securitization, bonds are serviced by a regulatory transition charge on wires rates and are therefore excluded from debt in credit reviews. Debt / EBITDA is a measure used by Oncor to assess credit quality.
Adjusted EBITDA/Cash Interest (non-GAAP) EBITDA divided by cash interest expense is a measure used by Oncor to assess credit quality.
Oncor Electric Delivery 10
|
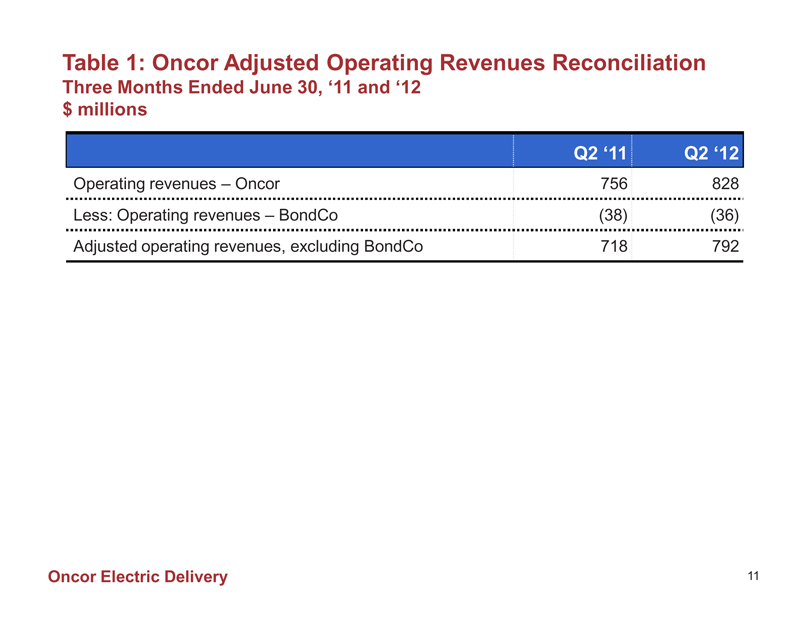
Table 1: Oncor Adjusted Operating Revenues Reconciliation
Three Months Ended June 30, ‘11 and ‘12 $ millions
Q2 ‘11 Q2 ‘12
Operating revenues – Oncor 756 828
Less: Operating revenues – BondCo (38) (36)
Adjusted operating revenues, excluding BondCo 718 792
Oncor Electric Delivery 11
|
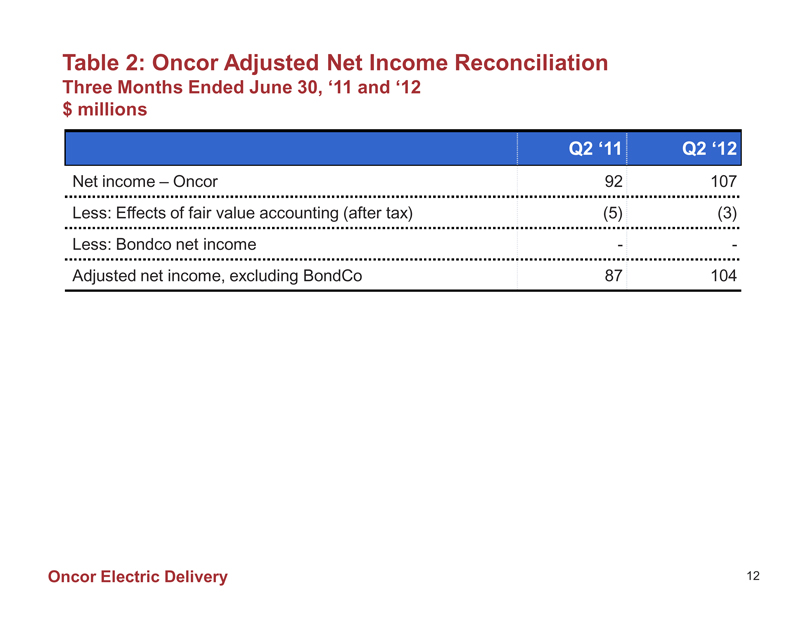
Table 2: Oncor Adjusted Net Income Reconciliation
Three Months Ended June 30, ‘11 and ‘12 $ millions
Q2 ‘11 Q2 ‘12
Net income – Oncor 92 107
Less: Effects of fair value accounting (after tax) (5) (3)
Less: Bondco net income - -
Adjusted net income, excluding BondCo 87 104
Oncor Electric Delivery 12
|
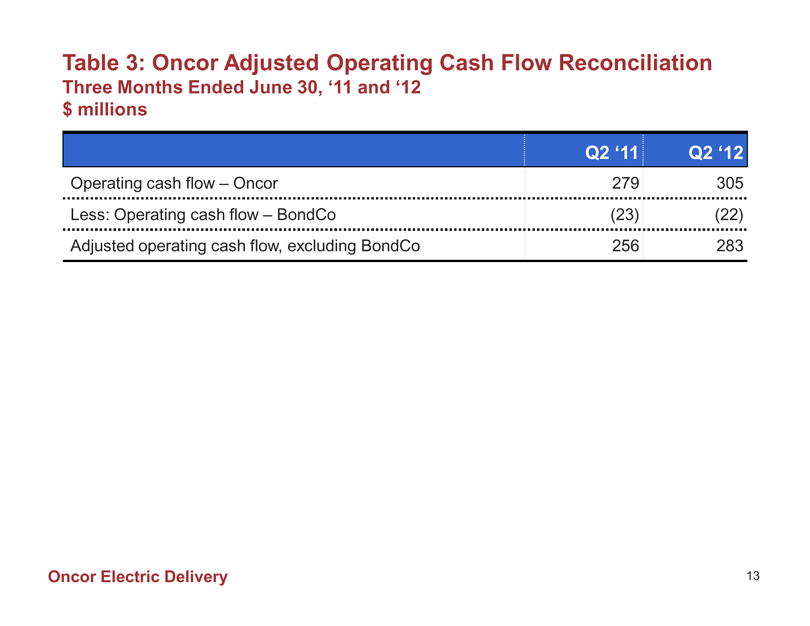
Table 3: Oncor Adjusted Operating Cash Flow Reconciliation
Three Months Ended June 30, ‘11 and ‘12 $ millions
Q2 ‘11 Q2 ‘12
Operating cash flow – Oncor 279 305
Less: Operating cash flow – BondCo (23) (22)
Adjusted operating cash flow, excluding BondCo 256 283
Oncor Electric Delivery 13
|
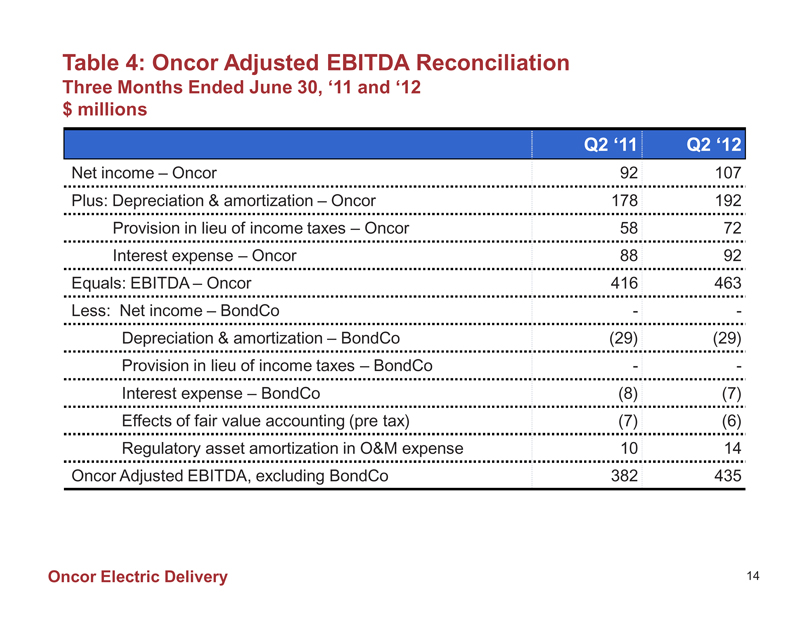
Table 4: Oncor Adjusted EBITDA Reconciliation
Three Months Ended June 30, ‘11 and ‘12 $ millions
Q2 ‘11 Q2 ‘12
Net income – Oncor 92 107
Plus: Depreciation & amortization – Oncor 178 192
Provision in lieu of income taxes – Oncor 58 72
Interest expense – Oncor 88 92
Equals: EBITDA – Oncor 416 463
Less: Net income – BondCo - -
Depreciation & amortization – BondCo (29) (29)
Provision in lieu of income taxes – BondCo - -
Interest expense – BondCo (8) (7)
Effects of fair value accounting (pre tax) (7) (6)
Regulatory asset amortization in O&M expense 10 14
Oncor Adjusted EBITDA, excluding BondCo 382 435
Oncor Electric Delivery 14
|
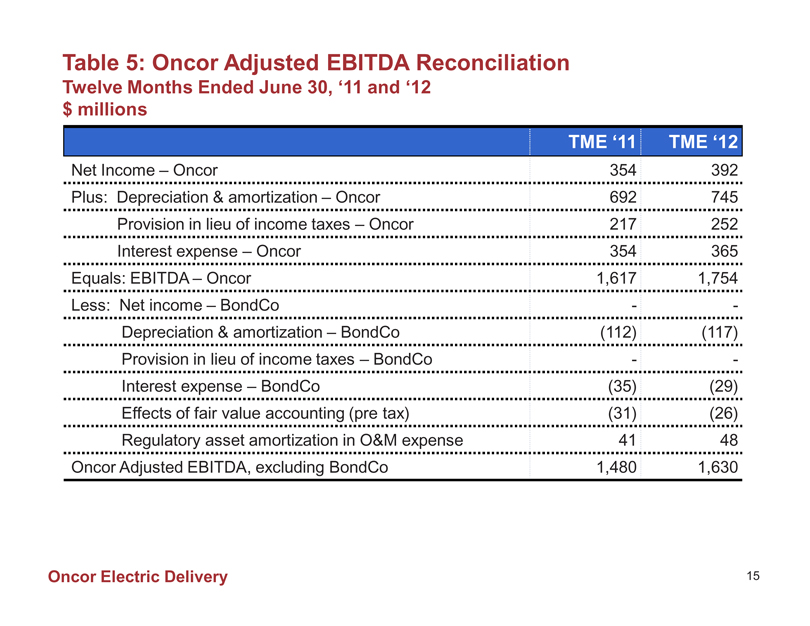
Table 5: Oncor Adjusted EBITDA Reconciliation
Twelve Months Ended June 30, ‘11 and ‘12 $ millions
TME ‘11 TME ‘12
Net Income – Oncor 354 392
Plus: Depreciation & amortization – Oncor 692 745
Provision in lieu of income taxes – Oncor 217 252
Interest expense – Oncor 354 365
Equals: EBITDA – Oncor 1,617 1,754
Less: Net income – BondCo - -
Depreciation & amortization – BondCo (112) (117)
Provision in lieu of income taxes – BondCo - -
Interest expense – BondCo (35) (29)
Effects of fair value accounting (pre tax) (31) (26)
Regulatory asset amortization in O&M expense 41 48
Oncor Adjusted EBITDA, excluding BondCo 1,480 1,630
Oncor Electric Delivery 15
|
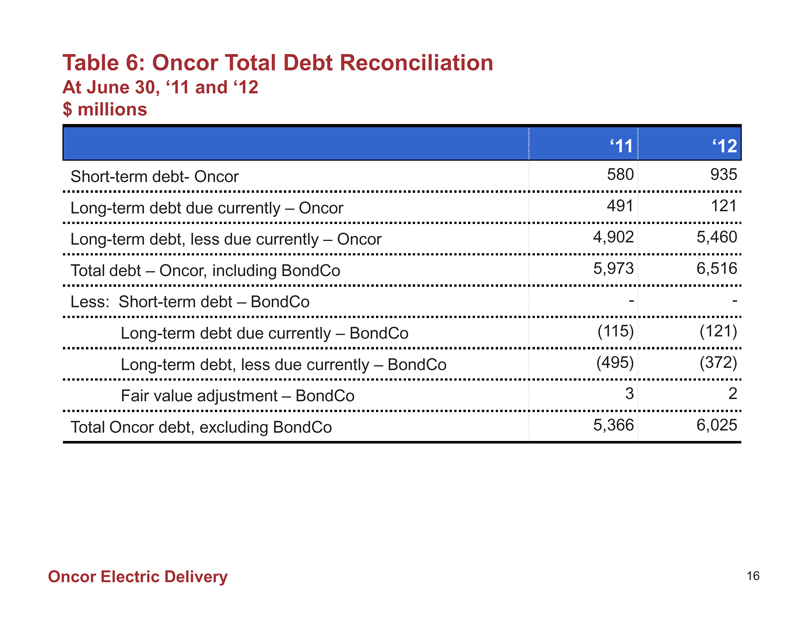
Table 6: Oncor Total Debt Reconciliation
At June 30, ‘11 and ‘12 $ millions
‘11 ‘12
Short-term debt- Oncor 580 935
Long-term debt due currently – Oncor 491 121
Long-term debt, less due currently – Oncor 4,902 5,460
Total debt – Oncor, including BondCo 5,973 6,516
Less: Short-term debt – BondCo - -
Long-term debt due currently – BondCo (115) (121)
Long-term debt, less due currently – BondCo (495) (372)
Fair value adjustment – BondCo 3 2
Total Oncor debt, excluding BondCo 5,366 6,025
Oncor Electric Delivery 16
|
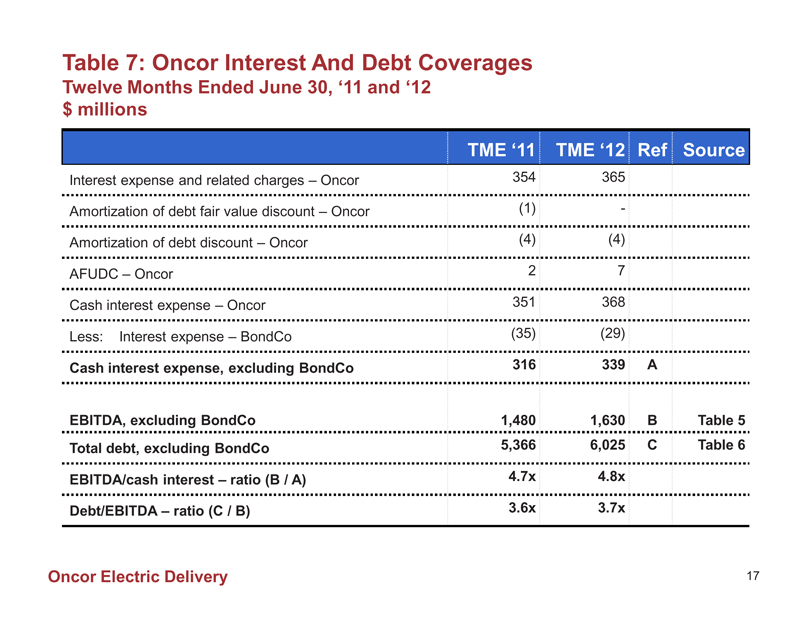
Table 7: Oncor Interest And Debt Coverages
Twelve Months Ended June 30, ‘11 and ‘12 $ millions
TME ‘11 TME ‘12 Ref Source
Interest expense and related charges – Oncor 354 365
Amortization of debt fair value discount – Oncor (1) -
Amortization of debt discount – Oncor (4) (4)
AFUDC – Oncor 2 7
Cash interest expense – Oncor 351 368
Less: Interest expense – BondCo (35) (29)
Cash interest expense, excluding BondCo 316 339 A
EBITDA, excluding BondCo 1,480 1,630 B Table 5
Total debt, excluding BondCo 5,366 6,025 C Table 6
EBITDA/cash interest – ratio (B / A) 4.7x 4.8x
Debt/EBITDA – ratio (C / B) 3.6x 3.7x
Oncor Electric Delivery 17