Attached files
| file | filename |
|---|---|
| 8-K - FORM 8-K - HD SUPPLY, INC. | d388696d8k.htm |
 Investor Presentation
July 30, 2012
Portfolio of Leading Industrial Distribution Companies
Portfolio of Leading Industrial Distribution Companies
Exhibit 99.1 |
 2
Disclaimer
This presentation includes forward-looking information. Forward-looking
statements are subject to known and unknown risks and uncertainties, many of
which may be beyond our control. We caution you that the forward-looking information presented
in this presentation is not a guarantee of future performance and that our actual
results of operations, financial condition and liquidity, and the development
of the industries in which we operate may differ materially from those made in or suggested by
the forward-looking information contained in this presentation. A number
of important factors could cause actual results to
differ materially from those contained in or implied by the forward-looking
statements, including those factors discussed in our annual report on Form
10K filed March 23, 2012 and subsequent filings with the SEC. Any forward-looking information
presented herein is made only as of the date of this presentation, and we do not
undertake any obligation to update or revise any forward-looking
information to reflect changes in assumptions, the occurrence of unanticipated events, changes in future
operating results over time or otherwise. Comparisons of results
for current and any prior periods are not intended to express
any future trends or indications of future performance, unless expressed as such,
and should only be viewed as historical data.
In addition to disclosing financial results that are determined in accordance with
U.S. generally accepted accounting principles (“GAAP”), the Company
also disclosed in this presentation certain non-GAAP financial information including Adjusted
EBITDA. These financial measures are not recognized measures under GAAP, and
are not intended to be and should not be considered in isolation or as a
substitute for, or superior to, the financial information prepared and presented in accordance
with GAAP. |
 3
Joe DeAngelo, HD Supply
Chief Executive Officer
Agenda
1.
Transaction Overview
3.
Financial Update
2.
Business Update
Ron Domanico, HD Supply
Chief Financial Officer
Ron Domanico, HD Supply
Chief Financial Officer |
 4
Transaction Overview
HD Supply,
Inc.
(“HDS”
or
the
“Company”)
is
Seeking
to
Issue
a
$200
million
add-
on to its 8.125% Senior Secured First Lien Notes due April 2019
Proceeds
from the add-on will be Used for General Corporate Purposes and,
Pending
Such
Allocation,
will
be
Applied
to
Repay
Revolver
Borrowings
-
Pro Forma for the add-on, HDS Will Have Approximately $800 million of
Available Liquidity The Company
Continues
to
Experience
Strong
Earnings
Growth.
LTM
EBITDA
has Grown from $508 Million at end of FY’11 to $545 Million for LTM
4/29/12 ($ in millions)
Sources of Funds
Uses of Funds
Add-on to 8.125% Senior Notes due 2019
$200.0
Pay down ABL Borrowings
$200.0
Total Sources
$200.0
Total Uses
$200.0
1
1
1
Does not include
premium
or
costs
attributable
to
the
offering,
which
will
correspondingly
increase
or
reduce
the
net
proceeds,
as
applicable. |
 5
New Debt Structure
Pro Forma Capitalization
($ in millions)
Note: At closing, after applying the $200 million in proceeds, approximately $430
million is expected to be outstanding under the ABL Facility. 1
Balances shown at face value
2
LTM as of 4/29/12
Capitalization
Rate
Maturity
Current
Adj.
Pro Forma
Cash And Cash Equivalents
$125.0
-
$125.0
ABL Revolver ($1,500M)
L+200 bps
4/12/17
370.0
($200.0)
170.0
Sr Sec First Lien Term Loan
L+600 bps
10/12/17
1,000.0
-
1,000.0
Sr Sec First Lien Notes
8.125%
4/15/19
950.0
$200.0
1,150.0
Total First Lien Debt
2,320.0
-
2,320.0
Sr Sec Second Lien Notes
11.000%
4/15/20
675.0
-
675.0
Total Secured Debt
2,995.0
-
2,995.0
Exchanged Senior Notes
14.875%
10/12/20
757.0
-
757.0
Senior Subordinated PIK Notes
13.500%
9/1/15
1,820.0
-
1,820.0
Total Debt
5,572.0
-
5,572.0
Shareholder's Equity
(780.0)
-
(780.0)
Total Capitalization
$4,792.0
-
$4,792.0
Operating Statistics
LTM
4/29/12
LTM
4/29/12
LTM Adj. EBITDA
2
$545.0
$545.0
Credit Statistics
Net First Lien Debt / Adj. EBITDA
4.0x
4.0x
Net Secured Debt / Adj. EBITDA
5.3x
5.3x
Total Debt / Adj. EBITDA
10.2x
10.2x
Net Debt / Adj. EBITDA
10.0x
10.0x
4/29/2012
1
1 |
 6
Issuer:
HD Supply, Inc.
Security:
Add-on to 8.125% Senior Secured First Lien Notes (the “Notes”)
Amount:
$200 million
Expected Issue Ratings:
B2 / B+
Guarantors:
Each Domestic Subsidiary that is a Borrower under the ABL Facility or that
guarantees debt of the Issuer under a Credit Facility and is a
Wholly-Owned Subsidiary or under certain Capital Markets Securities
Security:
First
priority
interest
in
substantially
all
assets
and
stock
of
the
Issuer
and
Guarantors,
other
than
the
ABL
Priority Collateral, and second priority interest in the ABL Priority
Collateral Maturity:
4/15/19, provided that if more than $450 million of the 13.500% Senior
Subordinated Notes due 9/1/15 are outstanding on a date that is 90 days
prior to their maturity, the Notes will have an event of default permitting
acceleration of maturity 90 days prior to the maturity of the Senior Subordinated
Notes Optional Redemption:
Non-callable until 4/15/15, then callable at 106.094 until 4/15/16, declining
ratably to par by 4/15/18 Equity Clawback:
On or prior to 4/15/15, up to 35% of the Notes may be redeemed with the proceeds
of certain equity issuances at par plus the coupon
Change of Control:
101% of the principal amount plus accrued interest
Covenants:
Same as the existing 8.125% Senior Secured First Lien Notes
Distribution Method:
Rule 144A with Registration Rights
Add-on 1
st
Lien Bond Summary Terms |
 7
Agenda
1.
Transaction Overview
3.
Financial Update
2.
Business Update
Ron Domanico, HD Supply
Chief Financial Officer
Joe DeAngelo, HD Supply
Chief Executive Officer
Ron Domanico, HD Supply
Chief Financial Officer |
 8
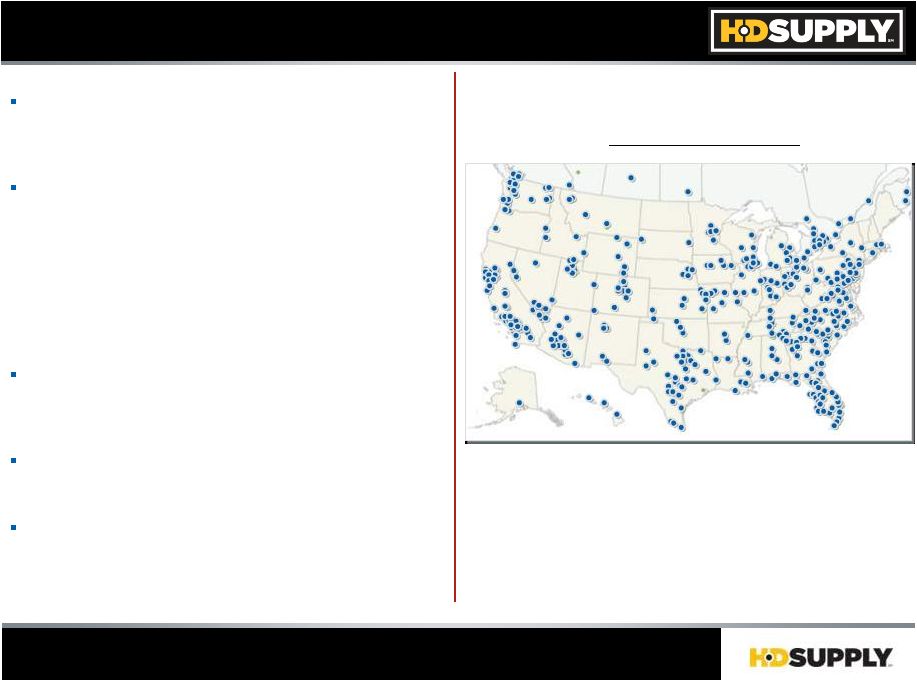
At A Glance
Market Leading Industrial Distributor
One of the Largest
Industrial
Distributors
Serving the
Highly Fragmented U.S. and Canadian Infrastructure,
MRO
and
Construction
Sectors
Diverse
Portfolio
of Distribution Businesses that Provide
Approximately 1 Million SKUs
to
440,000 Professional
Customers,
Including
Contractors,
Government
Entities,
Maintenance Professionals, Home Builders and Industrial
Businesses
–
Operate Approximately 640 Locations Across 45 U.S.
States and 9 Canadian Provinces
Broad Diversity in Product Portfolio, Customer Base
and Vendor Relationships Reduces the Company’s
Exposure
to Any Single Segment, Product or Customer
Size, Scale
and National Presence Drive Competitive
Advantage in Large, Fragmented Markets
$7.3 Billion of Sales and
$545M
(7.5%)
of
Adj.
EBITDA
for the Last Twelve Months Ended April 29, 2012
Geographic Footprint
Geographic Footprint
1
See Appendix for Reconciliation of Adjusted EBITDA
Note: HD Supply Operates a Sourcing Office in China
1
“Expansive Footprint” |
 9
End Market Overview
~$123B Market Opportunity, Solid Growth Drivers
1
Management Estimates
Infrastructure
Maintenance & Repair
Specialty Construction
“Endless, Critical Demand”
“Continual Demand”
“Niche Expertise”
2
Formerly Utilities/Electrical
2
Market
Opportunity
$42B
$42B
$64B
$64B
$17B
$17B
Demand
Drivers
Aging Overburdened
Infrastructure
Coverage for Population Growth
Cost-Effective Distribution of Water
and
Energy
Maintenance
Required for Existing
Stock
of U.S. Structures
Repair
and
Remodel
Construction
Single Family, Multi-Family,
Commercial, Municipal and Repair and
Remodel Construction
HD Supply
Businesses
Waterworks
Power
Solutions
Facilities Maintenance
Crown Bolt
Repair & Remodel
White Cap
Creative Touch Interiors
HD Supply
Competitive
Advantages
Scale, Information
Technology
and
Pricing
Rigor
Deep Customer Relationships
Industry Leading Management Talent
and Experience
Comprehensive Product Assortment,
Superior
Availability
and
Delivery
Time Differentiation
Superior
National
Distribution
Capabilities
Lean
Operating Cost
Structure
Leveraging ERP Technologies
Customer Service Differentiation
(i.e.,
Delivery Times, Sales Expertise, Value-
Added Product)
Product
Assortment
and
Knowledge
1 |
 10
Addressable Opportunities
Addressable Opportunity and HD Supply’s Position
1
Management Estimates
2
Sales for the Year Ending January 29, 2012
3
Facilities Maintenance is the Largest Distributor to Multifamily Properties.
Power Solutions is the Largest Utilities Distributor $1.8B
Waterworks
$8B
$1.9B
Facilities
$63B
$1.0B
White Cap
$12B
$1.6B
Power
Solutions
$34B
Est.
Market
Size
HD
Supply
Sales
Share¹
Rank
21%
#1
#1
3%
#1
#1
8%
#1
#1
5%
#1
#1
Maintenance
Leading Position, Large Opportunities
3
3
($ in billions)
10
2
1 |
 11
End Market Diversity
HD Supply Sales
HD Supply Sales
Estimated % of FYE Jan. ’12 Sales
Construction, 39%
Infrastructure
and Other
34%
MRO
27%
Residential
13%
Non-Residential
26%
39% Construction, 27% MRO, 34% Infrastructure |
 12
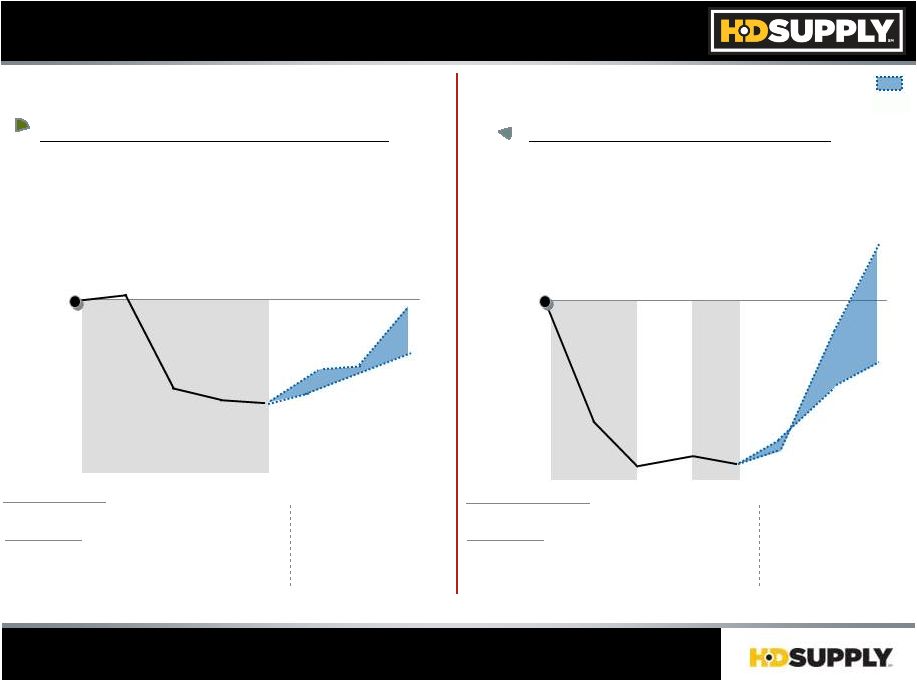
Construction End Market Outlook
Construction Market Growth Projected For ’12
Non-Residential Construction
(26%)
(Construction Spend Change, Index = ’07)
Residential
Construction
(13%)
(13%)
(SF Housing Starts Change, Index = ’07)
Third Party Forecast Range
Sources: Zelman and Associates, Economy.com, Dodge, Portland Cement
Association Spend ($ in billions)
High
$164
Low
$154
$170
$192
540
Annual
SF
Starts
(000s)
810
665
506
898
1,245
$160
$158
$165
$243
$239
Actual
$182
$226
Actual
1,035
429
471
445
616
-60%
-40%
-20%
0%
20%
40%
'07A
'08A
'09A
'10A
'11A
'13F
'14F
'07A
'08A
'09A
'10A
'11A
'12F
'13F
'14F
-60%
-40%
-20%
0%
20%
40%
'12F
High
Low
Forecast Range
Forecast Range |
 13
Vacancy Rate
U.S. Apartments
U.S. Apartments
National
Forecast
–
All
Hotels
National
Forecast
–
All
Hotels
63%
55%
64%
$66
$54
$74
+1.3Pts
+1.3Pts
’11 -
’14
Source: REIS (“United States Apartment 4Q 2011 MetroTrend Futures)
Source: Hotel
Horizons
–
Econometric
Forecasts
or
U.S.
Lodging
Markets
(March
–
May
2012
Edition)
’07A
’14F
’13F
’12F
’11A
’10A
’09A
’08A
5.7%
8.0%
4.5%
5.2%
0.7 Pts
0.7 Pts
’11 -
’14
’07A
’14F
’13F
’12F
’11A
’10A
’09A
’08A
’07A
’14F
’13F
’12F
’11A
’10A
’09A
’08A
’07A
’14F
’13F
’12F
’11A
’10A
’09A
’08A
4.8%
-4.3%
3.9%
4.5%
+0.7Pts
+0.7Pts
’11 -
’14
Multifamily
Multifamily
Hospitality
Hospitality
+6% CAGR
(’11 -
’14)
Rev. Per Occupied Stock
Occupancy Rate
Rev. Per Avail. Room
U.S. Apartment and Lodging Outlook
Favorable Outlook
13 |
 14
(Sales Growth Versus Market)
Outpace Market Growth…
’11A
Total HD Supply…
+9 Pts V Estimated Market Growth
Source:
3
Party
Market
Sources,
Management
Estimates
+2%
+2%
Market
WW
(3%)
(3%)
Market
PS
+11%
+11%
+14 Pts
+5%
+5%
(5%)
(5%)
Market
WC
+15%
+15%
+20 Pts
FM
+11%
+11%
+4%
+4%
+7 Pts
Market
+3 Pts
rd |
 15
Investment Thesis and Key Credit Highlights
Premier Portfolio
of Assets With
Leading
Positions in
Highly Fragmented Markets
Significant Business Diversity Supports Stability:
End
Markets…
27%
MRO,
26%
Non-Residential,
13%
Residential,
34%
Infrastructure
and
Other
Customers…
10
Largest
Represent
10%
of
FY
’11
Sales;
Largest
Customer
is
4%
of
Sales
Suppliers…
10
Largest
Represent
16%
of
FY
’11
Spend
Expansive
Product
Offering…
~ 1 Million SKUs
Robust
Liquidity
and
Financial
Flexibility
Favorable
Market
Outlook...
Poised
for
Accelerated
Growth
on
Rebound
With
Significant Cost Leverage
Low Capital Intensity Results in High Cash Conversion
Experienced, Motivated
Management
Team
and Strong
Equity
Sponsorship |
 16
Agenda
1.
Transaction Overview
3.
Financial Update
2.
Business Update
Ron Domanico, HD Supply
Chief Financial Officer
Ron Domanico, HD Supply
Chief Financial Officer
Joe DeAngelo, HD Supply
Chief Executive Officer |
 17
Operations
Adjusted EBITDA +48% Versus ’09
FY’11 Financial Highlights
Sales
$7.0B…+$579M (YOY Growth +9.0%)
Positive Sales Growth in Unfavorable Market:
-
Residential
: -10% (Zelman)
-
Non-
Residential : -
6% (Dodge)
-
Muni:
-16% (Dodge)
GM $2.0B…+$173M
VPY Rate 28.7%
+11bps VPY
SG&A
$1.5B…+$77M VPY
Productivity Offset 100% of Inflation
Adj. EBITDA $508M…
+$97M (YOY Growth +23.6%)
EBITDA
Growth 2x Sales Growth
Initiatives +$48M VPY
Trade Net Working Capital (WC)
$1.3B…+$319M
VPY Impacted by Timing of Inventory Purchases
CapEx
$115M…+$66M VPY
Maintenance $40M…~50/50 split bet. fac. and IT
Growth $25-30M
Projects: Fleet $30M, ERP/DR $16M
Cash Flow
$94M…($564M)
VPY Impacted by Timing of Inventory Purchases
1
Includes Trade Receivables, Net Inventory & Accounts Payables
2
See Appendix for reconciliation
Plan
PY
GM
$2,014
$1,768
$1,841
% of Sales
28.7%
28.0%
28.5%
SG&A
$1,532
$1,453
$1,455
% of Sales
21.8%
23.0%
22.6%
Adj. EBITDA
$508
$343
$411
% of Sales
7.2%
5.4%
6.4%
Balance Sheet
Cash Flow
$94
$261
$658
Trade Net WC
$1,313
$1,254
$994
Liquidity
$1,247
$897
$1,323
Net Debt
$5,350
$5,236
$4,956
Adj. EBITDA
Net Sales
$7,028
$6,313
$6,449
($ in millions)
CapEx
$115
$58
$49
1
2
2
1
$508M
$411
$343M
FY ’11
FY ’09
FY ’10
+$68M
+19.8%
+$97M
+23.6% |
 18
Financial Summary
1
Strong Operating Performance
Adjusted EBITDA
Adjusted EBITDA
Sales
Gross Margin %
Adj. EBITDA %
Cash Flow
See Reconciliation to GAAP in Appendix
Represents Unlevered,
Pre-Tax Cash flows including results of discontinued operations, See Reconciliation to GAAP in Appendix
Eight Consecutive Quarters of
Year-Over-Year Sales Growth;
LTM Growth
–
1Q12: 14.2%
–
4Q11: 13.6%
–
3Q11: 9.8%
–
2Q11: 9.1%
Refinancing of Nearly $4 Billion
in
Outstanding
Indebtedness.
No
Significant Debt Maturities Until
mid-2015
Completion of the Sale of the
Industrial Pipes, Valves and Fittings
Business for Approximately $464
Million After Transactions Costs
Net Sales and Adjusted EBITDA
Growth in all Four Core
Businesses:
Facilities
Maintenance, Waterworks, Power
Solutions and White Cap
LTM Q1
LTM Q1
2012
2012
$545M
$7,256M
28.6%
7.5%
$257M
$429M
$6,505M
28.6%
6.6%
$291M
+27%
$133M
$1,836M
28.5%
7.2%
$45M
$96M
$1,608M
28.6%
6.0%
($118M)
Q1 '11
Q1 '11
Q1 '12
Q1 '12
+39%
($ in millions)
LTM Q1
LTM Q1
2011
2011
Q1 2012 Comments
2
2
1 |
 19
Subsequent Event
June 29, 2012, Purchased Peachtree Business Products LLC
(“Peachtree”) for Approximately $196 million, Subject to a
Customary Working Capital Adjustment
Peachtree Specializes in Customizable Business and Property Marketing
Supplies, Serving Residential and Commercial Property Managers, Medical
Facilities,
Schools
and
Universities,
Churches
and
Funeral
Homes
Will be Operated as Part of Facilities Maintenance
|
 20
Accelerating Financial Performance
Financial Performance Validates the Strategy
Sales
and
Earnings
Momentum
Accelerating
Eight
Consecutive
Quarters
of
Year-Over-Year
Sales
Growth,
Gross
Profit
and
Operating
Profit…
with
Market
Headwind
Largest Percentage Sales Increase Since 2007
Gross
Profit
Rates
of
28.6%
are
Among
the
Strongest
Since
2007
Strong Operating Profit Improvement
Adjusted
EBITDA
Up
39%
Year-Over-Year
Liquidity
is
Robust
Management Team Driving Relentless Execution
1
For 1Q12
1
1 |
 Q&A |
 |
 23
Reconciliation to GAAP Financials
($ in Millions)
Note 1: Totals may not foot due to rounding
2010
2011
2012
LTM
LTM
Fiscal
Fiscal
Fiscal
Q1
Q2
Q3
Q4
Q1
Q2
Q3
Q4
Q1
Q1-11
Q1-12
2009
2010
2011
Adjusted EBITDA
78
$
124
$
130
$
79
$
96
$
155
$
155
$
102
$
133
$
429
$
545
$
343
$
411
$
508
$
Reconciling Items:
Depreciation and Amortization
(88)
(87)
(85)
(83)
(83)
(82)
(82)
(82)
(83)
(338)
(329)
(364)
(343)
(329)
Goodwill impairment
-
-
-
-
-
-
-
-
-
-
-
(219)
-
-
Restructuring
(5)
(3)
-
-
-
-
-
-
-
(3)
-
(21)
(8)
-
Stock Compensation
(4)
(4)
(5)
(4)
(4)
(5)
(7)
(4)
(5)
(17)
(21)
(18)
(17)
(20)
Management Fee
(1)
(2)
(1)
(1)
(1)
(2)
(1)
(1)
(1)
(5)
(5)
(5)
(5)
(5)
Other
-
-
-
(1)
-
-
-
1
(1)
(1)
-
-
(1)
1
GAAP Operating Income (Loss)
(20)
28
39
(10)
8
66
65
16
43
65
190
(284)
37
155
Interest Expense, net
(156)
(155)
(153)
(159)
(158)
(159)
(160)
(162)
(166)
(625)
(647)
(602)
(623)
(639)
Loss on extinguishment of debt
-
-
-
-
-
-
-
-
(220)
-
(220)
200
-
-
Other Income (Expense)
(4)
2
1
2
1
-
-
(1)
-
6
(1)
8
1
-
GAAP Pre-Tax Income (Loss)
(180)
(125)
(113)
(167)
(149)
(93)
(95)
(147)
(343)
(554)
(678)
(678)
(585)
(484)
Tax Benefit (Expense)
(22)
12
15
(33)
(20)
(15)
(24)
(20)
33
(26)
(26)
198
(28)
(79)
GAAP Net Income (Loss) Cont Ops
(202)
$
(113)
$
(98)
$
(200)
$
(169)
$
(108)
$
(119)
$
(167)
$
(310)
$
(580)
$
(704)
$
(480)
$
(613)
$
(563)
$ |
 24
Reconciliation to GAAP Financials (cont.)
($ in Millions)
Note 1: Totals may not foot due to rounding
2010
2011
2012
LTM
LTM
Fiscal
Fiscal
Fiscal
Q1
Q2
Q3
Q4
Q1
Q2
Q3
Q4
Q1
Q1 2011
Q1 2012
2009
2010
2011
Adjusted Cash Flow
249
$
55
$
116
$
238
$
(118)
$
(22)
$
173
$
61
$
45
$
291
$
257
$
261
$
658
$
94
$
Reconciling Items:
Interest Paid
(164)
(18)
(167)
(14)
(163)
(14)
(163)
(16)
(329)
(362)
(522)
(366)
(363)
(356)
Taxes (Paid) Received
218
(3)
(1)
2
1
(6)
1
(1)
-
(1)
(6)
127
216
(5)
Capital Expenditures
11
11
12
15
18
17
23
57
22
56
119
58
49
115
Proceeds from Sale of PPE
(1)
-
-
(3)
(2)
(2)
-
-
(1)
(5)
(3)
(8)
(4)
(4)
Management Fees & Expenses
(1)
(2)
(1)
(1)
(1)
(1)
(2)
(1)
(1)
(5)
(5)
(5)
(5)
(5)
Other
-
-
1
(1)
(4)
1
-
(1)
-
(4)
-
2
-
(4)
GAAP Operating Cash Flows
312
$
43
$
(40)
$
236
$
(269)
$
(27)
$
32
$
99
$
(264)
$
(30)
$
(160)
$
69
$
551
$
(165)
$ |