Attached files
| file | filename |
|---|---|
| 8-K - FORM 8-K - FIRST COMMUNITY BANKSHARES INC /VA/ | v319805_8k.htm |

KBW Community Bank Investors Conference July 31, 2012 www.fcbinc.com

Forward - Looking Disclosures This presentation may include forward - looking statements. These forward - looking statements are based on current expectations that involve risks, uncertainties and assumptions. Should one or more of these risks or uncertainties materialize or should underlying assumptions prove incorrect, actual results may differ materially. These risks include: changes in business or other market conditions; the timely development, production and acceptance of new products and services; the challenge of managing asset/liability levels; the management of credit risk and interest rate risk; the difficulty of keeping expense growth at modest levels while increasing revenues; and other risks detailed from time to time in the Company’s Securities and Exchange Commission reports, including but not limited to the Annual Report on Form 10 - K for the most recent year ended. Pursuant to the Private Securities Litigation Reform Act of 1995, the Company does not undertake to update forward - looking statements contained within this presentation. 2

First Community Bancshares 3
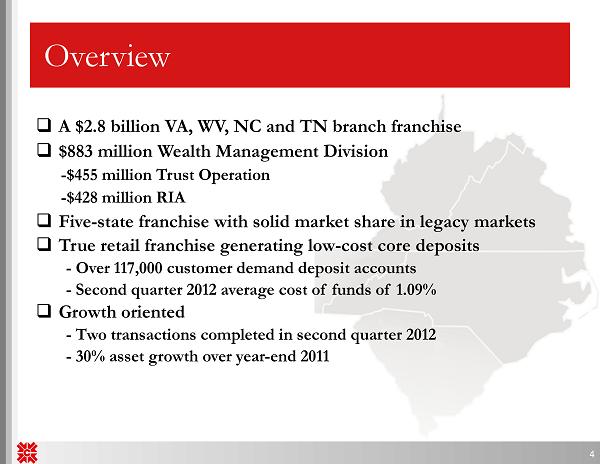
Overview □ A $2.8 billion VA, WV, NC and TN branch franchise □ $883 million Wealth Management Division - $455 million Trust Operation - $428 million RIA □ Five - state franchise with solid market share in legacy markets □ True retail franchise generating low - cost core deposits - Over 117,000 customer demand deposit accounts - Second quarter 2012 average cost of funds of 1.09% □ Growth oriented - Two transactions completed in second quarter 2012 - 30% asset growth over year - end 2011 4

Investment Highlights □ 138 years of success….. since 1874 □ Consolidator □ Attractive growth markets and stable legacy markets □ Superior Efficiency (57.6% in Q2 2012) □ Strong asset quality □ Strong non - margin, fee - based revenue diversification – 25% of revenues from non - spread sources 5
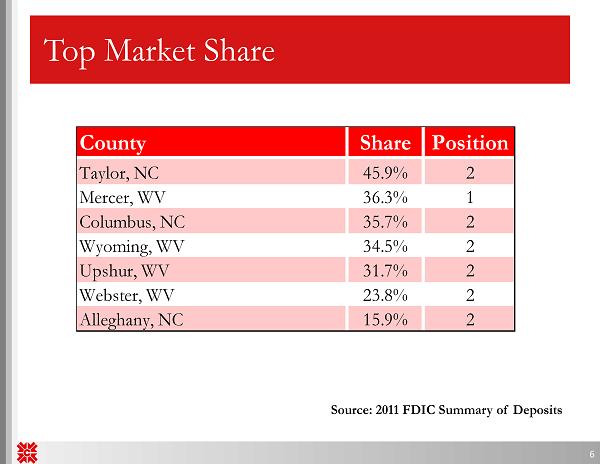
Top Market Share 6 Source: 2011 FDIC Summary of Deposits County Share Position Taylor, NC 45.9% 2 Mercer, WV 36.3% 1 Columbus, NC 35.7% 2 Wyoming, WV 34.5% 2 Upshur, WV 31.7% 2 Webster, WV 23.8% 2 Alleghany, NC 15.9% 2

Investment Highlights Stable, Low - Cost funding Strong Net Interest Margin No TARP or capital raise overhang Good legacy loan portfolio performance – Highly granular – average legacy loan balance of $75,587 – Virtually no A&D exposure – Well diversified – Total Delinquency of 2.64% – NPA’s/Total Assets of 1.55% 7

▪ 74 branches in WV, VA, NC, SC, and TN ▪ Mix of urban growth and stable legacy markets ▪ Growth targets in NC, Richmond VA and East TN ▪ Deposit breakout : - West Virginia $895 million - North Carolina $558 million - Virginia $541 million - Tennessee $ 57 million - South Carolina $ 54 million Franchise Branch Map Legacy Markets 8

▪ Substantial growth opportunity ▪ Targeted strategic bank acquisitions ▪ Fill in primary markets ▪ Attractive price levels ▪ FDIC - assisted transactions ▪ Possible larger transactions ▪ Primary and secondary markets ▪ Build presence in mid - Atlantic region ▪ Capitalize on in - market transactions ▪ Connect regional presence ▪ Enhance marketing capabilities ▪ Brand unification ▪ Re - positioning “Community of Experts” ▪ Continue diversification of revenues ▪ Acquisition of small insurance agencies and producers ▪ Populate primary markets ▪ Achieve greater integration with bank services ▪ Build wealth management organically ▪ Build premier financial services firm ▪ large bank capabilities ▪ community bank feel ▪ Technology upgrade ▪ Enhance efficiency ▪ Improve sales effort and customer relationship management Strategic Priorities 9

Peoples Bank of Virginia Transaction Rationale □ In market acquisition consistent with FCBC’s Merger & Acquisition strategy □ Creates 10 th largest Virginia - based bank by deposits in the Richmond market □ Strong cultural fit 10 Strategic Rationale Financially Attractive Low Risk Profile □ Exceeds Merger & Acquisition performance targets □ Immediately accretive to EPS □ Minimal tangible book value dilution with earnback period of 3 – 4 years □ Significant expense synergies □ Post - closing consolidated capital and liquidity ratios remain strong □ Comprehensive due diligence completed including rigorous review of loan and OREO portfolios □ Conservative credit mark

Peoples Bank of Virginia Pro Forma Branch Map 11 Peoples Market VA- based Rank Institution Branches Deposits ($mm) Market Share (%) 1 Union First Market Bkshs Corp. 44 1,516 4.98 2 Franklin Financial Corp. 8 667 2.19 3 Village Bank & Trust Finl Corp 15 508 1.67 4 First Capital Bancorp Inc. 7 419 1.38 5 C&F Financial Corp. 11 409 1.34 6 Bk of Southside Virginia Corp. 9 356 1.17 7 Eastern Virginia Bankshares 11 342 1.12 8 Central Virginia Bankshares 8 339 1.11 9 Community Bankers Trust Corp 9 331 1.09 10 Pro Forma 9 328 1.08 12 Peoples Bank of Virginia 4 251 0.83 18 First Community Bancshares Inc 5 77 0.25 Richmond Market Deposit Market Share (1) (1) Deposit market share data as of June 30, 2011; Virginia headquartered banks only Source: SNL Financial □ Advances objective of entry into previously identified targeted growth market of Richmond, VA □ Richmond’s superior market demographics complements FCBC’s current footprint ─ Projected population growth: 5.42% ─ Projected household income growth: 14.25%

Peoples Bank of Virginia Financial Impact of the Transaction 12 Transaction Assumptions Financial Impact □ EPS accretive in the first full year of combined operations □ Limited tangible book value dilution at closing □ Ability to leverage insurance business line and other product offerings increasing non - interest income □ Gross credit mark on total loans and OREO of $17.5 million or 9.4% ─ Reviewed 59% of total loans, 64% of non - performing loans, and 70% of land and ADC loans □ One - time merger expenses of approximately $3.5 million (before tax ) □ Cost savings of approximately 40% □ Closed May 31, 2012

Peoples Bank of Virginia Summary 13 □ Transaction drives EPS growth and shareholder value for both FCBC and Peoples shareholders □ Manageable transaction size and strong pro forma capital ratios allow for future opportunities □ M&A pipeline and organic growth opportunities in targeted growth markets remain attractive □ Low - risk structure □ Comprehensive due diligence □ Strong cultural fit □ Additional product capabilities with a strong sales opportunity for business and retail products □ Materially enhances retail network in targeted west Henrico and Chesterfield Counties

Waccamaw Bank Summary 14 □ Acquired 16 branches in FDIC - assisted deal • Added 12 branches to existing North Carolina franchise and expands presence into South Carolina with 4 branches □ Purchased approximately $500 million in total assets, including $338 million in loans • Most loan and REO covered by loss - share agreements at 80% • Loan and REO credit mark of approximately $69.5 million • Estimated goodwill of $10.1 million • Tangible book dilution of 3% - 5% - recover in approximately 2 years □ Assumed approximately $428 million in deposits • No deposit premium

County WB Branches WB Deposits in Market ($000) Market Rank Deposit Market Share (%) Total Deposits in Market ($000) Horry, SC 3 43,649 18 0.8 5,432,128 Bladen, NC 1 27,305 4 11.7 233,729 New Hanover, NC 1 22,658 17 0.6 3,859,990 Lancaster, SC 1 18,694 5 4.1 458,956 • Establishes top 3 market share positions in Columbus & Brunswick Counties 15 Source: SNL Financial; Deposit data as of June 30, 2011 Columbus County Brunswick County Deposits Market Branch in Market Share Rank Institution (ST) Count ($mm) (%) 1 BB&T Corp. (NC) 8 293 39.9 2 First Community Bancshares Inc (VA) 3 262 35.7 3 PNC Financial Services Group (PA) 1 114 15.5 4 First Bancorp (NC) 2 30 4.0 5 First Citizens BancShares Inc. (NC) 1 28 3.8 6 Woodforest Financial Group (TX) 1 0 0.1 Totals (1-6) 16 727 98.9 Deposits Market Branch in Market Share Rank Institution (ST) Count ($mm) (%) 1 BB&T Corp. (NC) 12 771 48.7 2 Security Savings Bank SSB (NC) 7 236 14.9 3 First Community Bancshares Inc (VA) 7 117 7.4 4 First Citizens BancShares Inc. (NC) 4 113 7.1 5 First Financial Holdings Inc. (SC) 3 88 5.5 6 Bank of America Corp. (NC) 2 78 4.9 7 First Bancorp (NC) 4 74 4.7 8 PNC Financial Services Group (PA) 2 53 3.4 9 Wells Fargo & Co. (CA) 1 23 1.5 10 ECB Bancorp Inc. (NC) 2 17 1.1 Totals (1-10) 44 1,570 99.1 Totals (1-12) 47 1,584 100.0 Additional Counties of Operation Waccamaw Bank Deposit Market Share

16 • Consistent with our acquisition strategy – Extends footprint to a target growth market – Significantly accretive to core earnings per share – Deploys excess capital – No raise necessary – Minimal tangible book value dilution – Earnback dilution in approximately 2 years – Strong IRR in excess of 15% – Low - risk transaction due to FDIC loss coverage – Financially attractive even under stress case modeling scenarios Waccamaw Bank Strategically and Financially Compelling

Deposit Composition June 30, 2012 Key Franchise Differentiator Retail Franchise with Core, Low Cost Deposits ▪ Over 144,300 retail and business accounts ▪ No brokered deposits ▪ Significantly lower cost of funding Account Balances as of June 30, 2012 Accounts Balance Period End W.A.R. Demand 44,139 $340,895 0.00% Interest-Bearing Demand 44,338 335,686 0.07% Savings 29,418 494,516 0.10% Total DDA 117,895 1,171,097 0.06% Time 14,599 417,944 1.58% Time Jumbo 6,643 386,444 1.37% IRA 4,068 78,476 1.45% IRA Jumbo 1,138 51,246 1.86% Total Non-DDA 26,448 934,110 1.50% Total Retail Funds 144,343 $2,105,207 0.70% 17 Demand 32% Savings/ MMDA 25% Time 44% Non - DDA period end rates do not reflect purchase accounting marks associated with acquisitions.

Key Franchise Differentiator Stable Geographies for Loans and Deposits 18 June 30, 2012 NC $558,322 TN $56,714 SC $53,667 VA $541,223 WV $895,281 Deposits by State (in thousands) NC $404,090 SC $252,433 TN $37,737 VA $386,656 WV $698,795 Loans by State (in thousands)

2Q 2012 Update Pre - Tax, Pre - Credit and Core Earnings Increasing Three Months Ended June 30, March 31, December 31, September 30, June 30, 2012 2012 2011 2011 2011 Pre-Tax, Pre-Credit Core Earnings 11,393$ 10,708$ 11,273$ 11,273$ 9,898$ Core Net Income 6,210 6,071 4,957 5,375 3,713 Core EPS (diluted) 0.31$ 0.32$ 0.26$ 0.28$ 0.20$ Core ROA 1.06% 1.12% 0.91% 0.97% 0.68% Core Common ROE 8.19% 8.37% 6.83% 7.41% 5.25% 19 ▪ Peoples and Waccamaw acquisitions began adding to second quarter 2012 results. ▪ Continue to expect high single digit accretion with Peoples and low double digit accretion with Waccamaw.

Summary of 2Q 2012 Earnings Three Months Ended Six Months Ended June 30, June 30, 2012 2011 Change 2012 2011 Change Net Interest Income 19,484$ 17,754$ 9.7% 37,461$ 36,029$ 4.0% Provision for Loan Losses 1,620 3,079 -47.4% 2,542 4,691 -45.8% Net Interest Income (after provision) 17,864 14,675 21.7% 34,919 31,338 11.4% Securities gains (9) 3,224 NM 42 3,504 NM Other Income 8,352 8,139 2.6% 16,292 17,885 -8.9% Total Noninterest Income 8,343 11,363 -26.6% 16,334 21,389 -23.6% Salaries and employee benefits 8,892 8,685 2.4% 17,114 17,814 -3.9% FDIC costs 290 414 -30.0% 612 520 17.7% Other Noninterest Expense 10,950 8,639 26.8% 18,599 17,467 6.5% Total Noninterest Expense 20,132 17,738 13.5% 36,325 35,801 1.5% Tax Expense 1,997 2,572 -22.4% 4,849 4,920 -1.4% Net Income 4,078 5,728 -28.8% 10,079 12,006 -16.1% Dividends on Preferred Stock 283 131 566 131 Net Income Available to Common Shareholders 3,795 5,597 -32.2% 9,513 11,875 -19.9% EPS (diluted) 0.20$ 0.31$ -35.5% 0.52$ 0.63$ -17.5% Dividends Declared 0.11$ 0.10$ 10.0% 0.21$ 0.20$ 5.0% 20

Balance Sheet Summary June 30, March 31, December 31, 2012 2012 2011 Cash & Securities 684,067$ 590,838$ 533,214$ Total Loans 1,807,373 1,390,047 1,401,887 Allowance for Loan Losses 26,171 25,800 26,205 Total Loans (net) 1,781,202 1,364,247 1,375,682 Other 345,052 248,184 255,893 Total Assets 2,810,321$ 2,203,269$ 2,164,789$ Noninterest Bearing Deposits 340,895$ 253,352$ 240,268$ Interest Bearing Deposits 1,764,312 1,326,398 1,303,199 Total Deposits 2,105,207 1,579,750 1,543,467 Borrowings 340,938 290,191 295,141 Other 22,465 23,203 20,452 Equity 341,711 310,125 305,729 Total Liabilities & Equity 2,810,321$ 2,203,269$ 2,164,789$ ▪ Total assets grew 29.8% (not annualized) since year - end 2011 ▪ Total deposits have grown 36.4% (not annualized) since year - end 2011 ▪ Levering existing capital through the latest acquisitions 21

0.00% 0.20% 0.40% 0.60% 0.80% 1.00% 1.20% 1.40% 1.60% 1.80% 2008 2009 2010 2011 Q1 12 Q2 12 0.45% 0.70% 0.90% 0.67% 0.38% 0.36% 0.35% 1.07% 1.75% 1.31% 1.22% 0.67% FCBC Peer 0.50% 1.00% 1.50% 2.00% 2.50% 3.00% 3.50% 4.00% 4.50% 5.00% 2008 2009 2010 2011 Q1 12 Q2 12 0.99% 1.49% 2.06% 2.42% 2.47% 2.43% 1.38% 3.06% 4.43% 4.62% 4.05% 3.57% FCBC Peer Asset Quality Ratios Non - Performing Loans / Total Loans Peers include publicly traded banks with assets between $1 and $4 billion in NC, SC, East TN, VA, and WV (AMNB, BNCN , CFNL , CHCO, EVBS , FBNC, FFCH, FNBN, FSGI, HMPR , MBRG, NBBC , PEBK, PFBI , SCMF, SMMF, STEL , UBSH, VCBI, YAVY ). Asset quality ratios are for non - covered assets. Source: SNL Financial as of July 27, 2012 Net Charge - Offs / Average Loans 22 ▪ Non - performing loans have fared very well compared to the geographical peer group throughout the cycle. ▪ Net charge - offs are trending lower in 2011 and 2012.

Asset Quality Ratios Reserves / Non - Performing Loans Reserves / Total Loans Peers include publicly traded banks with assets between $1 and $4 billion in NC, SC, East TN, VA, and WV (AMNB, BNCN , CFNL , CHCO, EVBS , FBNC, FFCH, FNBN, FSGI, HMPR , MBRG, NBBC , PEBK, PFBI , SCMF, SMMF, STEL, UBSH , VCBI, YAVY) . Asset quality ratios are for non - covered assets. Source: SNL Financial as of July 27, 2012 - 20 40 60 80 100 120 140 2008 2009 2010 2011 Q1 12 Q2 12 138 116 92 77 75 68 99 61 49 49 53 52 FCBC Peer 23 1.00% 1.20% 1.40% 1.60% 1.80% 2.00% 2.20% 2008 2009 2010 2011 Q1 12 Q2 12 1.37% 1.73% 1.90% 1.87% 1.86% 1.66% 1.40% 1.70% 2.10% 2.07% 2.11% 1.93% FCBC Peer ▪ Throughout the cycle, FCBC has kept a strong non - performing coverage ratio ▪ In addition to high performance compared to peer in non - performers, the reserve has remained steady and only a small amount of release.

50% 55% 60% 65% 70% 2008 2009 2010 2011 Q1 12 Q2 12 59.23% 59.40% 59.10% 59.56% 57.18% 57.58% 65.22% 66.42% 64.88% 65.47% 65.56% 66.48% FCBC Peer Financial Performance Highlights Efficiency Peers include publicly traded banks with assets between $1 and $4 billion in NC, SC, East TN, VA, and WV (AMNB, BNCN , CFNL , CHCO, EVBS , FBNC, FFCH, FNBN, FSGI, HMPR , NBBC, PEBK, PFBI, SCMF , SMMF, STEL, UBSH , VCBI, YAVY) Source: SNL Financial as of July 27, 2012 24 ▪ Consistently outperform peer ▪ Trending downward

0.75% 1.00% 1.25% 1.50% 1.75% 2.00% 2.25% 2.50% 2.75% 3.00% 2008 2009 2010 2011 Q1 12 Q2 12 2.46% 1.97% 1.50% 1.17% 1.02% 0.93% 2.79% 2.05% 1.57% 1.23% 0.93% 0.87% FCBC Peer Financial Performance Highlights Cost of Funds and Net Interest Margin Peers include publicly traded banks with assets between $1 and $4 billion in NC, SC, East TN, VA, and WV (AMNB, BNCN , CFNL , CHCO, EVBS , FBNC, FFCH, FNBN, FSGI, HMPR , NBBC, PEBK, PFBI, SCMF , SMMF, STEL, UBSH , VCBI, YAVY) Source: SNL Financial as of July 27, 2012 25 ▪ Highly retail - oriented deposit base in legacy markets makes for low cost of funds ▪ Strong net interest margin has provided a stable earnings base throughout the cycle 3.25% 3.50% 3.75% 4.00% 2008 2009 2010 2011 Q1 12 Q2 12 3.88% 3.74% 3.90% 3.87% 3.91% 3.93% 3.66% 3.54% 3.63% 3.81% 3.72% 3.80% FCBC Peer Cost of Funds Net Interest Margin

▪ A $ 2.81 billion VA, WV, NC and TN branch franchise – Robust market share in legacy markets and attractive expansion into growth markets ▪ Positioned as regional consolidator – Continued growth via strategic and opportunistic FDIC - assisted deals ▪ True retail franchise generating low cost core deposits – Over 144,300 customer accounts ▪ Exceptional loan quality – Low NPLs / Loans of 2.43% at June 30, 2012 * – NPA’s to total assets of 1.55% at June 30, 2012 * * Includes all restructured loans Why buy FCBC? 26

▪ Strong pre - tax, pre - provision core income ▪ Resilient net interest margin of 3.93% for 2Q 2012 ▪ Strong non - margin, fee - based revenue diversification ▪ Strong dividend yield of over 3% ▪ Positioned to emerge as one of the strongest players in the region and build one of the best franchises in the Mid - Atlantic ▪ Attractive valuation on forward earnings potential Why buy FCBC? 27

Contact Information First Community Bancshares, Inc. NASDAQ: FCBC One Community Place Bluefield, VA 24605 For More Information Contact: David D. Brown Chief Financial Officer First Community Bancshares, Inc. (276) 326 - 9000 28