Attached files
| file | filename |
|---|---|
| EX-32 - EX-32 - FIRST COMMUNITY BANKSHARES INC /VA/ | d318707dex32.htm |
| EX-31.2 - EX-31.2 - FIRST COMMUNITY BANKSHARES INC /VA/ | d318707dex312.htm |
| EX-31.1 - EX-31.1 - FIRST COMMUNITY BANKSHARES INC /VA/ | d318707dex311.htm |
| EX-23 - EX-23 - FIRST COMMUNITY BANKSHARES INC /VA/ | d318707dex23.htm |
| EX-21 - EX-21 - FIRST COMMUNITY BANKSHARES INC /VA/ | d318707dex21.htm |
| EX-12 - EX-12 - FIRST COMMUNITY BANKSHARES INC /VA/ | d318707dex12.htm |
Table of Contents
UNITED STATES
SECURITIES AND EXCHANGE COMMISSION
Washington, D.C. 20549
FORM 10-K
ANNUAL REPORT PURSUANT TO SECTION 13 OR 15(d) OF
THE SECURITIES EXCHANGE ACT OF 1934
For the fiscal year ended December 31, 2016
Commission file number 000-19297
FIRST COMMUNITY BANCSHARES, INC.
(Exact name of registrant as specified in its charter)
| Nevada | 55-0694814 | |
| (State or other jurisdiction of incorporation or organization) |
(I.R.S. Employer Identification No.) |
P.O. Box 989
Bluefield, Virginia 24605-0989
(Address of principal executive offices) (Zip Code)
Registrant’s telephone number, including area code: (276) 326-9000
Securities registered pursuant to Section 12(b) of the Act:
| Title of each class |
Name of each exchange on which registered | |
| Common Stock, $1.00 par value | NASDAQ Global Select |
Securities registered pursuant to Section 12(g) of the Act: None
Indicate by check mark if the registrant is a well-known seasoned issuer, as defined in Rule 405 of the Securities
Act. ☐ Yes ☒ No
Indicate by check mark if the registrant is not required to file reports pursuant to Section 13 or Section 15(d) of the Act. ☐ Yes ☒ No
Indicate by check mark whether the registrant (1) has filed all reports required to be filed by Section 13 or 15(d) of the Securities Exchange Act of 1934 during the preceding 12 months (or for such shorter period that the registrant was required to file such reports), and (2) has been subject to such filing requirements for the past 90 days. ☒ Yes ☐ No
Indicate by check mark whether the registrant has submitted electronically and posted on its corporate Web site, if any, every Interactive Data File required to be submitted and posted pursuant to Rule 405 of Regulation S-T (§ 232.405 of this chapter) during the preceding 12 months (or for such shorter period that the registrant was required to submit and post such files). ☒ Yes ☐ No
Indicate by check mark if disclosure of delinquent filers pursuant to Item 405 of Regulation S-K (§ 229.405 of this chapter) is not contained herein, and will not be contained, to the best of registrant’s knowledge, in definitive proxy or information statements incorporated by reference in Part III of this Form 10-K or any amendment to this Form 10-K. ☐
Indicate by check mark whether the registrant is a large accelerated filer, an accelerated filer, a non-accelerated filer, or a smaller reporting company. See the definitions of “large accelerated filer,” “accelerated filer” and “smaller reporting company” in Rule 12b-2 of the Exchange Act.
| Large accelerated filer | ☐ | Accelerated filer | ☒ | |||
| Non-accelerated filer | ☐ (Do not check if a smaller reporting company) | Smaller reporting company | ☐ | |||
Indicate by check mark whether the registrant is a shell company (as defined in Rule 12b-2 of the Act). ☐ Yes ☒ No
As of June 30, 2016, the aggregate market value of the registrant’s voting and non-voting common stock held by non-affiliates was $294.92 million.
As of February 28, 2017, there were 16,994,616 shares outstanding of the registrant’s Common Stock, $1.00 par value.
DOCUMENTS INCORPORATED BY REFERENCE
Portions of the Proxy Statement for the Annual Meeting of Stockholders to be held on April 25, 2017, are incorporated by reference in Part III of this Form 10-K.
Table of Contents
FIRST COMMUNITY BANCSHARES, INC.
2016 FORM 10-K
| Page | ||||||
| PART I | ||||||
| Item 1. |
4 | |||||
| Item 1A. |
13 | |||||
| Item 1B. |
22 | |||||
| Item 2. |
22 | |||||
| Item 3. |
22 | |||||
| Item 4. |
22 | |||||
| PART II | ||||||
| Item 5. |
23 | |||||
| Item 6. |
26 | |||||
| Item 7. |
Management’s Discussion and Analysis of Financial Condition and Results of Operations. |
27 | ||||
| Item 7A. |
57 | |||||
| Item 8. |
58 | |||||
| Item 9. |
Changes in and Disagreements With Accountants on Accounting and Financial Disclosure. |
127 | ||||
| Item 9A. |
127 | |||||
| Item 9B. |
127 | |||||
| PART III | ||||||
| Item 10. |
128 | |||||
| Item 11. |
130 | |||||
| Item 12. |
Security Ownership of Certain Beneficial Owners and Management and Related Stockholder Matters. |
130 | ||||
| Item 13. |
Certain Relationships and Related Transactions, and Director Independence. |
130 | ||||
| Item 14. |
130 | |||||
| PART IV | ||||||
| Item 15. |
131 | |||||
| 132 | ||||||
| 133 | ||||||
2
Table of Contents
CAUTIONARY STATEMENT REGARDING FORWARD-LOOKING STATEMENTS
Forward-looking statements in filings with the Securities and Exchange Commission, including this Annual Report on Form 10-K and the accompanying Exhibits, filings incorporated by reference, reports to shareholders, and other communications that represent the Company’s beliefs, plans, objectives, goals, guidelines, expectations, anticipations, estimates, and intentions are made in good faith pursuant to the safe harbor provisions of the Private Securities Litigation Reform Act of 1995. These statements are not guarantees of future performance and involve certain risks, uncertainties, and assumptions that are difficult to predict. The words “may,” “could,” “should,” “would,” “believe,” “anticipate,” “estimate,” “expect,” “intend,” “plan,” and other similar expressions identify forward-looking statements. The following factors, among others, could cause financial performance to differ materially from that expressed in such forward-looking statements:
| • | the strength of the U.S. economy in general and the strength of the local economies in which we conduct operations; |
| • | the effects of, and changes in, trade, monetary, and fiscal policies and laws, including interest rate policies of the Federal Reserve System; |
| • | inflation, interest rate, market and monetary fluctuations; |
| • | timely development of competitive new products and services and the acceptance of these products and services by new and existing customers; |
| • | the willingness of customers to substitute competitors’ products and services for the Company’s products and services and vice versa; |
| • | the impact of changes in financial services laws and regulations, including laws about taxes, banking, securities, and insurance, and the impact of the Dodd-Frank Wall Street Reform and Consumer Protection Act; |
| • | the impact of the U.S. Department of the Treasury and federal banking regulators’ continued implementation of programs to address capital and liquidity in the banking system; |
| • | further, future, and proposed rules, including those that are part of the process outlined in the Basel Committee on Banking Supervision’s “Basel III: A Global Regulatory Framework for More Resilient Banks and Banking Systems,” which are require banking institutions to increase levels of capital; |
| • | technological changes; |
| • | the effect of acquisitions, including, without limitation, the failure to achieve the expected revenue growth and/or expense savings from such acquisitions; |
| • | the growth and profitability of noninterest, or fee, income being less than expected; |
| • | unanticipated regulatory or judicial proceedings; |
| • | changes in consumer spending and saving habits; and |
| • | the Company’s success at managing the risks mentioned above. |
The list of important factors is not exclusive. If one or more of the factors affecting these forward-looking statements proves incorrect, actual results, performance, or achievements could differ materially from those expressed in, or implied by, forward-looking statements contained in this Annual Report on Form 10-K and other reports we file with the Securities and Exchange Commission. Therefore, the Company cautions you not to place undue reliance on forward-looking information and statements. The Company does not intend to update any forward-looking statements, whether written or oral, to reflect changes. These cautionary statements expressly qualify all forward-looking statements that apply to the Company including the risk factors presented in Part I, Item 1A of this report.
3
Table of Contents
PART I
| Item 1. | Business. |
General
First Community Bancshares, Inc. (the “Company”), a financial holding company, was founded in 1989 and incorporated under the laws of Nevada in 1997. The Company’s principal executive office is located at One Community Place, Bluefield, Virginia. The Company provides commercial banking products and services through its wholly owned subsidiary First Community Bank (the “Bank”), a Virginia-chartered banking institution founded in 1874. The Bank operates as First Community Bank in Virginia, West Virginia, and North Carolina and People’s Community Bank, a Division of First Community Bank, in Tennessee. The Bank provides insurance services through its wholly owned subsidiary First Community Insurance Services and offers wealth management and investment advice through its Trust Division and wholly owned subsidiary First Community Wealth Management. The Company is the sole common stockholder of FCBI Capital Trust (the “Trust”), which was created in October 2003 to issue trust preferred securities to raise capital for the Company. Unless the context suggests otherwise, the terms “First Community,” “Company,” “we,” “our,” and “us” in this Annual Report on Form 10-K refer to First Community Bancshares, Inc. and its subsidiaries as a consolidated entity.
We focus on building financial partnerships and creating enduring and complete relationships with businesses and individuals through a personal and local approach to banking and financial services. We strive to be the bank of choice in the markets we serve by offering impeccable service and a complete line of competitive products that include:
| • | demand deposit accounts, savings and money market accounts, certificates of deposit, and individual retirement arrangements; |
| • | commercial, consumer, and real estate mortgage loans and lines of credit; |
| • | various credit card, debit card, and automated teller machine card services; |
| • | corporate and personal trust services; |
| • | investment management services; and |
| • | life, health, and property and casualty insurance products. |
Our operations are guided by a strategic plan that focuses on organic growth supplemented by strategic acquisitions of complementary financial institutions. For a summary of our financial performance, see Item 6, “Selected Financial Data,” in Part II of this report.
Employees
As of December 31, 2016, we had 580 full-time equivalent employees. Our employees are not represented by collective bargaining agreements and we consider employee relations to be excellent.
Market Area
As of December 31, 2016, we operated 45 branch locations in Virginia, West Virginia, North Carolina, and Tennessee through our sole operating segment, Community Banking. Economic indicators in our market areas show relatively stable employment and business conditions. We serve a diverse base of individuals and businesses across a variety of industries such as education, government, and health services; coal mining and gas extraction; retail trade; construction; manufacturing; tourism; and transportation.
Competition
The financial services industry is highly competitive and constantly evolving. We encounter strong competition in attracting and retaining deposit, loan, and other financial relationships in our market areas. We compete with
4
Table of Contents
other commercial banks, thrifts, savings and loan associations, credit unions, consumer finance companies, mortgage banking firms, commercial finance and leasing companies, securities firms, brokerage firms, and insurance companies. We have positioned ourselves as a regional community bank that provides an alternative to larger banks, which often place less emphasis on personal relationships, and smaller community banks, which lack the capital and resources to efficiently serve customer needs. Factors that influence our ability to remain competitive include the ability to develop, maintain, and build long-term customer relationships; the quality, variety, and pricing of products and services; the convenience of banking locations and office hours; technological developments; and industry and general economic conditions. We seek to mitigate these pressures with our relationship style of banking, competitive pricing, cost efficiencies, and disciplined approach to loan underwriting.
Supervision and Regulation
Overview
We are subject to extensive examination, supervision, and regulation under applicable federal and state laws and various regulatory agencies. These regulations are intended to protect consumers, depositors, borrowers, deposit insurance funds, and the stability of the financial system and are not for the protection of stockholders or creditors.
Applicable laws and regulations restrict our permissible activities and investments and impose conditions and requirements on the products and services we offer and the manner in which they are offered and sold. They also restrict our ability to repurchase stock or pay dividends, or to receive dividends from our banking subsidiary, and impose capital adequacy requirements on the Company and the Bank. The consequences of noncompliance with these laws and regulations can include substantial monetary and nonmonetary sanctions.
The following discussion summarizes significant laws and regulations applicable to the Company and the Bank. These summaries are not intended to be complete and are qualified in their entirety by reference to the applicable statute or regulation. Changes in laws and regulations may have a material effect on our business, financial condition, or results of operations.
First Community Bancshares, Inc.
The Company is a bank holding company registered under the Bank Holding Company Act of 1956, as amended, (“BHC Act”) and a financial holding company under the Gramm-Leach-Bliley Act of 1999 (“GLB Act”). The Company elected financial holding company status in December 2006. The Company and its subsidiaries are subject to supervision, regulation, and examination by the Board of Governors of the Federal Reserve System (“Federal Reserve”). The BHC Act generally provides for umbrella regulation of financial holding companies, such as the Company, by the Federal Reserve, as well as functional regulation of financial holding company subsidiaries by applicable regulatory agencies. The Federal Reserve is granted the authority, in certain circumstances, to require reports of, examine, and adopt rules applicable to any bank holding company subsidiary.
The Company is also subject to the disclosure and regulatory requirements of the Securities Act of 1933, as amended, and the Securities Exchange Act of 1934, as amended, (“Exchange Act”), as administered by the Securities and Exchange Commission (“SEC”). The Company’s common stock is listed on the NASDAQ Global Select Market under the trading symbol FCBC and is subject to NASDAQ’s rules for listed companies.
First Community Bank
The Bank is a Virginia state-chartered bank and a member of the Federal Reserve subject to supervision, regulation, and examination by the Virginia Bureau of Financial Institutions and the Federal Reserve Bank (“FRB”) of Richmond. The Bank is a member of the Federal Deposit Insurance Corporation (“FDIC”), and its deposits are insured by the FDIC to the extent provided by law. The regulations of these agencies govern most aspects of the Bank’s business, including requirements concerning the allowance for loan losses, lending and
5
Table of Contents
mortgage operations, interest rates received on loans and paid on deposits, the payment of dividends, loans to affiliates, mergers and acquisitions, capital, and the establishment of branches. Various consumer and compliance laws and regulations also affect the Bank’s operations.
As a member bank, the Bank is required to hold stock in the FRB of Richmond in an amount equal to 6% of their capital stock and surplus (half paid to acquire the stock with the remainder held as a cash reserve). Member banks do not have any control over the Federal Reserve as a result of owning the stock and the stock cannot be sold or traded.
Regulatory Reform
The Dodd-Frank Wall Street Reform and Consumer Protection Act (“Dodd-Frank Act”) of 2010 significantly restructured the financial regulatory regime in the U.S. The Dodd-Frank Act is extensive, complicated, and comprehensive legislation that impacts practically all aspects of a banking organization, including the following provisions:
| • | centralizes responsibility for consumer financial protection by creating a new agency, the Consumer Financial Protection Bureau (“CFPB”), responsible for implementing, examining and enforcing compliance with federal consumer financial laws; |
| • | requires financial holding companies, such as the Company, to be well-capitalized and well managed as of July 21, 2011 (bank holding companies and banks must also be well-capitalized and well managed to engage in interstate bank acquisitions); |
| • | imposes comprehensive regulation of the over-the-counter derivatives market, which would include certain provisions that would effectively prohibit insured depository institutions from conducting certain derivatives businesses in the institutions themselves; |
| • | implements corporate governance revisions, including executive compensation and proxy access by shareholders; |
| • | makes permanent the $250 thousand limit for federal deposit insurance; |
| • | repeals the federal prohibitions on the payment of interest on demand deposits, thereby permitting depository institutions to pay interest on business transaction and other accounts; |
| • | amends the Electronic Fund Transfer Act to, among other things, give the Federal Reserve the authority to establish rules about interchange fees charged for electronic debit transactions by payment card issuers having assets over $10 billion and enforces a new statutory requirement that such fees be reasonable and proportional to the actual cost of a transaction to the issuer; and |
| • | increases the authority of the Federal Reserve to examine bank holding companies, such as the Company, and their non-bank subsidiaries. |
Many of the provisions of the Dodd-Frank Act and other laws are subject to further rulemaking, guidance, and interpretation by applicable federal regulators. We continue to evaluate the impact of any new regulations.
Permitted Activities under the BHC Act
The BHC Act limits the activities of bank holding companies, such as the Company, to the business of banking, managing or controlling banks and other activities the Federal Reserve determines to be closely related to banking. A bank holding company that elects treatment as a financial holding company under the GLB Act, such as the Company, may engage in a broader range of activities that are financial in nature or complementary to a financial activity and does not pose a substantial risk to the safety and soundness of depository institutions or the financial system. These activities include securities underwriting, dealing, and market making; sponsoring mutual funds and investment companies; insurance underwriting and agency; merchant banking activities; and other activities that the Federal Reserve determines to be closely related to banking.
6
Table of Contents
In order to maintain financial holding company status, the Company and the Bank must be well-capitalized and well-managed under applicable Federal Reserve regulations and have received at least a satisfactory rating under the Community Reinvestment Act (“CRA”). See “Prompt Corrective Action” and “Community Reinvestment Act” below. If we fail to meet these requirements, the Federal Reserve may impose corrective capital and managerial requirements and place limitations or conditions on our ability to conduct activities permissible for financial holding companies. If the deficiencies persist, the Federal Reserve may require the Company to divest the Bank or divest investments in companies engaged in activities permissible only for financial holding companies.
The company is required to give the Federal Reserve prior notice of any redemption or repurchase of its own equity securities, subject to certain exemptions, if the consideration to be paid, together with the consideration paid for any repurchases or redemptions in the preceding 12 months, is equal to 10% or more of the Company’s consolidated net worth. The Federal Reserve may oppose the transaction if it believes that the transaction would constitute an unsafe or unsound practice or would violate any law or regulation.
The BHC Act requires that bank holding companies obtain the Federal Reserve’s approval before acquiring direct or indirect ownership or control of more than 5% of the voting shares or all, or substantially all, of the assets of a bank. The regulatory authorities are required to consider the financial and managerial resources and future prospects of the bank holding company and the target bank, the convenience and needs of the communities to be served, and various competitive factors when approving acquisitions. The BHC Act also prohibits a bank holding company from acquiring direct or indirect control of more than 5% of the outstanding voting stock of any company engaged in a non-banking business unless the Federal Reserve determines it to be closely related to banking.
Capital Requirements
We are subject to various regulatory capital requirements administered by the Federal Reserve. The current risk-based capital requirements applicable to the Company and the Bank, parts of which are currently in the process of being phased in, are based on the December 2010 international capital standards of the Basel Committee on Banking Supervision (“Basel Committee”), known as Basel III.
Prior to January 1, 2015, the risk-based capital requirements that applied to the Company and the Bank were based on the 1988 capital accord of the Basel Committee, known as Basel I. Under Basel I, the Company was required to maintain a minimum Tier 1 capital ratio of 4.0%, a total capital ratio of 8.0%, and Tier 1 capital to average consolidated assets (“Tier 1 leverage ratio”) of 3.0%. Certain highly rated bank holding companies could maintain a minimum Tier 1 leverage ratio of 3.0%, but other bank holding companies were required to maintain a Tier 1 leverage ratio of 4.0% or more, depending on their condition.
On July 2, 2013, the Federal Reserve approved capital rules for U.S. banking organizations implementing Basel III (“Basel III Capital Rules”) and certain requirements of the Dodd-Frank Act to remove references to credit ratings from the federal banking agencies’ rules. Basel III Capital Rules (1) introduced a new Common Equity Tier 1 (“CET1”) capital measure, (2) specified that Tier 1 capital consist of CET1 and additional Tier 1 capital instruments meeting specified requirements, (3) defined CET1 narrowly by requiring that most deductions/adjustments to regulatory capital measures be made to CET1 and not to the other components of capital, and (4) expanded the scope of the deductions/adjustments to capital as compared to prior regulations. The following initial minimum capital ratios became effective, subject to a phase-in period, for the Company and the Bank under Basel III Capital Rules on January 1, 2015:
| • | 4.5% CET1 to risk-weighted assets |
| • | 6.0% Tier 1 capital (CET1 plus additional Tier 1 capital) to risk-weighted assets |
| • | 8.0% Total capital (Tier 1 plus Tier 2 capital) to risk-weighted assets |
| • | 4.0% Tier 1 leverage ratio |
7
Table of Contents
Basel III Capital Rules introduced a capital conservation buffer designed to absorb losses during periods of economic stress. The capital conservation buffer was implemented on January 1, 2016, at 0.625% and will be phased in over a four-year period (increasing by an additional 0.625% each year until it reaches 2.5% on January 1, 2019). Basel III Capital Rules also provide for a countercyclical capital buffer that applies to certain covered institutions; however, the buffer does not apply to the Company or the Bank. Banking institutions with a CET1 to risk-weighted assets ratio above the minimum but below the conservation buffer (or below the combined capital conservation buffer and countercyclical capital buffer, if applicable) face constraints on dividends, equity repurchases, and compensation based on the amount of the shortfall.
When fully phased in on January 1, 2019, Basel III Capital Rules will require the Company and the Bank to maintain an additional capital conservation buffer of 2.5% of CET1, effectively resulting in the following minimum ratios:
| • | 7.0% CET1 to risk-weighted assets |
| • | 8.5% Tier 1 capital to risk-weighted assets |
| • | 10.5% Total capital to risk-weighted assets |
| • | 4.0% Tier 1 leverage ratio |
Management believes that the Company and the Bank would meet all capital adequacy requirements under Basel III Capital Rules on a fully phased-in basis, if such requirements were in effect, as of December 31, 2016.
Basel III Capital Rules provide for a number of deductions from and adjustments to CET1. These include, for example, the requirement that mortgage servicing rights, certain deferred tax assets, and significant investments in non-consolidated financial entities be deducted from CET1 to the extent that any one such category exceeds 10% of CET1 or all such categories, in the aggregate, exceed 15% of CET1. Implementation of the deductions and other adjustments to CET1 began on January 1, 2015, at 40% and will be phased in over a four-year period (increasing by an additional 20% each year until it reaches 100% on January 1, 2018).
Basel III Capital Rules prevent certain hybrid securities, such as trust preferred securities, as Tier 1 capital of bank holding companies, subject to phase-out. The rules do not require a phase-out of trust preferred securities issued before May 19, 2010, for holding companies of depository institutions with less than $15 billion in consolidated total assets, as of December 1, 2009, which includes the Company. Therefore, the Company’s trust preferred securities that were issued before May 19, 2010, are permanently grandfathered in as Tier 1 or Tier 2 capital instruments.
Basel III Capital Rules prescribe a standardized approach for risk weightings that expand the risk-weighting categories from the four Basel I categories (0%, 20%, 50% and 100%) to a larger and more risk-sensitive number of categories, depending on the nature of the assets, generally ranging from 0% for U.S. government and agency securities, to 600% for certain equity exposures, and resulting in higher risk weights for a variety of asset categories.
Prompt Corrective Action
The federal banking regulators are required to take prompt corrective action with respect to capital-deficient institutions. Agency regulations define, for each capital category, the levels at which institutions are well-capitalized, adequately capitalized, undercapitalized, significantly undercapitalized, or critically undercapitalized. An institution may be downgraded to, or deemed to be in, a capital category that is lower than indicated by its capital ratios if the appropriate federal regulators determine that it is engaging in an unsafe or unsound practice or is in an unsafe or unsound condition. A bank’s capital category is determined solely for applying prompt corrective action regulations, and the capital category may not constitute an accurate representation of the bank’s financial condition or prospects for other purposes.
8
Table of Contents
The Bank was classified as well-capitalized under prompt corrective action regulation as of December 31, 2016. In order to be considered a well-capitalized institution under Basel III Capital Rules, an organization must not be subject to any written agreement, order, capital directive, or prompt corrective action directive and must maintain the following minimum capital ratios:
| • | 6.5% CET1 to risk-weighted assets |
| • | 8.0% Tier 1 capital to risk-weighted assets |
| • | 10.0% Total capital to risk-weighted assets |
| • | 5.0% Tier 1 leverage ratio |
Undercapitalized institutions are required to submit a capital restoration plan to federal banking regulators. Under the Federal Deposit Insurance Act, as amended (“FDIA”), in order for the capital restoration plan to be accepted by the appropriate federal banking agency, a bank holding company must provide appropriate assurances of performance and guarantee that its subsidiary bank will comply with its capital restoration plan, subject to certain limitations. Agency regulations contain broad restrictions on certain activities of undercapitalized institutions, including asset growth, acquisitions, establishing branches, and engaging in new lines of business. With certain exceptions, a depository institution is prohibited from making capital distributions, including dividends, and is prohibited from paying management fees to its parent holding company if the institution would be undercapitalized after such distribution or payment.
A significantly undercapitalized institution is subject to various requirements and restrictions, including orders to sell sufficient voting stock to become adequately capitalized, requirements to reduce total assets, and ending deposits from correspondent banks. The FDIC has limited discretion in dealing with a critically undercapitalized institution and is generally required to appoint a receiver or conservator.
Safety and Soundness Standards
Guidelines adopted by federal bank regulatory agencies establish general standards relating to internal controls and information systems, internal audit systems, loan documentation, credit underwriting, interest rate exposure, asset growth, and compensation fees and benefits. In general, the guidelines require, among other things, appropriate systems and practices to identify and manage risks and exposures. If an institution fails to meet safety and soundness standards, the regulatory agencies may require the institution to submit a written compliance plan describing the steps they would take to correct the situation and the time that such steps would be taken. If an institution fails to submit or implement an acceptable compliance plan, after being notified, the agency must issue an order directing action to correct the deficiency and may issue an order directing other actions, such as those applicable to undercapitalized institutions under the prompt corrective action provisions of the FDIA. An institution may be subject to judicial proceedings and civil money penalties if it fails to follow such an order.
Payment of Dividends
The Company is a legal entity that is separate and distinct from its subsidiaries. The Company’s principal source of cash flow is derived from dividends paid by the Bank. There are various restrictions by regulatory agencies related to dividends paid by the Bank to the Company and dividends paid by the Company to its shareholders. The payment of dividends by the Company and the Bank may be limited by certain factors, such as requirements to maintain capital above regulatory guideline minimums.
Prior FRB approval is required for the Bank to declare or pay a dividend to the Company if the total of all dividends declared in any given year exceed the total of the Bank’s net profits for that year and its retained profits for the preceding two years, less any required transfers to surplus or to fund the retirement of preferred stock. Dividends paid by the Company to shareholders are subject to oversight by the Federal Reserve. Federal Reserve policy states that bank holding companies generally should pay dividends on common stock only from income available over the past year if prospective earnings retention is consistent with the organization’s expected future needs, asset quality, and financial condition.
9
Table of Contents
Regulatory agencies have the authority to limit or prohibit the Company and the Bank from paying dividends if the payments are deemed to constitute an unsafe or unsound practice. The appropriate regulatory authorities have stated that paying dividends that deplete a bank’s capital base to an inadequate level would be an unsafe and unsound banking practice and that banking organizations should generally pay dividends only from current operating earnings. In addition, the Bank may not declare or pay a dividend if, after paying the dividend, the Bank would be classified as undercapitalized. In the current financial and economic environment, the FRB has discouraged payment ratios that are at maximum allowable levels, unless both asset quality and capital are very strong, and has noted that bank holding companies should carefully review their dividend policy. Bank holding companies should not maintain dividend levels that undermine their ability to be a source of strength to their banking subsidiaries.
Source of Strength
Federal Reserve policy and federal law requires the Company to act as a source of financial and managerial strength to the Bank. Under this requirement, the Company is expected to commit resources to support the Bank even when it may not be in a financial position to provide such resources. Because the Company is a legal entity separate and distinct from its subsidiaries, any capital loans it makes to the Bank are subordinate in right of payment to depositors and to certain other indebtedness of the Bank. In the event of the Company’s bankruptcy, any commitment by the Company to a federal bank regulatory agency to maintain the capital of the Bank will be assumed by the bankruptcy trustee and entitled to priority of payment.
Transactions with Affiliates
The Federal Reserve Act (“FRA”) and Federal Reserve Regulation W place restrictions on “covered transactions” between the Bank and its affiliates, including the Company. The term “covered transactions” includes making loans, purchasing assets, issuing guarantees, and other similar transactions. The Dodd-Frank Act expanded the definition of “covered transactions” to include derivative activities, repurchase agreements, and securities lending or borrowing activities. These restrictions limit the amount of transactions with affiliates, require certain levels of collateral for loans to affiliates, and require that all transactions with affiliates be on terms that are consistent with safe and sound banking practices. In addition, these transactions must be on terms that are substantially the same, or at least as favorable to the Bank, as those prevailing at the time for similar transactions with non-affiliates.
The FRA and Federal Reserve Regulation O place restrictions on loans between the Company and the Bank and their directors, executive officers, principal shareholders, affiliates, and interests of those directors, executive officers, and principal shareholders. These restrictions limit the amount of loans to one borrower and require that loans are on terms that are substantially the same as, and follow underwriting procedures that are not less stringent than, those prevailing at the time for similar loans with non-insiders. In addition, the aggregate limit of loans to all insiders, as a group, cannot exceed the Bank’s total unimpaired capital and surplus.
Deposit Insurance and Assessments
Substantially all of the Bank’s deposits are insured up to applicable limits by the Deposit Insurance Fund (“DIF”) of the FDIC and are subject to quarterly deposit insurance assessments to maintain the DIF. FDIC deposit insurance premiums are assessed using a risk-based system that places FDIC-insured institutions into one of four risk categories based on capital, supervisory ratings and other factors. The assessment rate determined by considering such information is then applied to the institution’s average assets minus average tangible equity to determine the institution’s insurance premium. The FDIC may change assessment rates or revise its risk-based assessment system if deemed necessary to maintain an adequate reserve ratio for the DIF. The Dodd-Frank Act required that the minimum reserve ratio for the DIF increase from 1.15% to 1.35% by September 30, 2020. Under the FDIA, the FDIC may terminate deposit insurance if it determines that the institution has engaged in unsafe and unsound practices, is in an unsafe or unsound condition to continue operations, or has violated any applicable law, regulation, rule, order, or condition imposed by the FDIC. The Bank’s FDIC deposit insurance assessments totaled $1.25 million in 2016, $1.42 million in 2015, and $1.59 million in 2014.
10
Table of Contents
In addition, all FDIC-insured institutions must pay annual assessments to fund interest payments on bonds issued by the Financing Corporation (“FICO”). The FICO is a mixed-ownership government corporation that was formed to borrow the money necessary to carry out the closing and ultimate disposition of failed thrift institutions by the Resolution Trust Corporation. The Bank’s FICO assessments, which are set quarterly, totaled $124 thousand in 2016, $139 thousand in 2015, and $147 thousand in 2014.
The Volcker Rule
The Dodd-Frank Act amended the BHC Act to prohibit depository institutions and their affiliates from engaging in proprietary trading and from investing in, sponsoring, or having certain relationships with hedge funds or private equity funds, known as the Volcker Rule. These prohibitions are subject to a number of statutory exemptions, restrictions, and definitions. The Volcker Rule became effective on April 1, 2014, but the Federal Reserve extended the conformance period for certain requirements to July 21, 2017. Although we continue to evaluate the impact of the Volcker Rule, we do not expect it to have a material effect on the operations of the Company and subsidiaries, as the Company does not engage in the businesses prohibited by the Volcker Rule. The Company may incur costs to adopt additional policies and systems to ensure compliance with the Volcker Rule, but any such costs are not expected to be material.
Community Reinvestment Act
The CRA of 1977, as amended, requires depository institutions to help meet the credit needs of their market areas, including low- and moderate-income individuals and communities, consistent with safe and sound banking practices. Federal banking regulators periodically examine depository institutions and assign ratings based on CRA compliance. A rating of less than satisfactory may restrict certain operating activities, delay or deny certain transactions, or result in an institution losing its financial holding company status. The Bank received a rating of satisfactory in its most recent CRA examination.
Incentive Compensation
Federal regulatory agencies have issued comprehensive guidance intended to ensure that the incentive compensation policies of banking organizations do not undermine the safety and soundness of such organizations by encouraging excessive risk-taking. The guidance is based on the key principles that a banking organization’s incentive compensation arrangements should (1) provide incentives that do not encourage risk-taking beyond the organization’s ability to effectively identify and manage risks, (2) be compatible with effective internal controls and risk management, and (3) be supported by strong corporate governance, including active and effective oversight by the organization’s board of directors.
Federal banking regulators periodically examine the incentive compensation arrangements of banking organizations and incorporate any deficiencies in the organization’s supervisory ratings, which can affect certain operating activities. The guidance also provides that enforcement actions may be taken against a banking organization if its incentive compensation arrangements or related risk management, control or governance processes pose a risk to the organization’s safety and soundness. The FRB may initiate enforcement actions if the organization’s incentive compensation arrangements or related risk management, control, or governance processes pose a risk to the organization’s safety and soundness and the organization is not taking prompt and effective measures to correct the deficiencies. The scope and content of the U.S. banking regulators’ policies on incentive compensation are continuing to develop. It cannot be determined at this time if or when a final rule will be adopted or if compliance with such a final rule will adversely affect the ability of the Company and its subsidiaries to hire, retain and motivate their key employees.
Anti-Tying Restrictions
The Bank and its affiliates are prohibited from tying the provision of certain services, such as extensions of credit, to other services offered by the Company.
11
Table of Contents
Consumer Protection and Privacy
We are subject to certain consumer laws and regulations that are designed to protect consumers in transactions with banks. These laws and regulations include the Mortgage Reform and Anti-Predatory Lending Act, the Truth in Lending Act, the Truth in Savings Act, the Home Mortgage Disclosure Act, the Electronic Funds Transfer Act, the Expedited Funds Availability Act, the Equal Credit Opportunity Act, the Fair Credit Reporting Act, the Right to Financial Privacy Act, the Fair Housing Act, and various state law counterparts. These laws and regulations contain extensive customer privacy protection provisions that limit the ability of financial institutions to disclose non-public information about consumers to non-affiliated third parties and require financial institutions to disclose certain policies to consumers.
The CFPB is a federal agency with broad authority to implement, examine, and enforce compliance with federal consumer protection laws that relate to credit card, deposit, mortgage, and other consumer financial products and services. The CFPB may enforce actions to prevent and remedy unfair, deceptive, or abusive acts and practices related to consumer financial products and services. The agency has authority to impose new disclosure requirements for any consumer financial product or service. The CFPB may impose a civil penalty or injunction against an entity in violation of federal consumer financial laws.
Cybersecurity
In March 2015, federal regulators issued two related statements about cybersecurity. One statement indicates that financial institutions should design multiple layers of security controls to establish lines of defense and to ensure that their risk management processes also address the risk posed by compromised customer credentials, including security measures to reliably authenticate customers accessing internet-based services of the financial institution. The other statement indicates that a financial institution’s management is expected to maintain sufficient business continuity planning processes to ensure the rapid recovery, resumption, and maintenance of the institution’s operations after a cyber-attack involving destructive malware. A financial institution is also expected to develop appropriate processes to enable recovery of data and business operations and address rebuilding network capabilities and restoring data if the institution or its critical service providers fall victim to this type of cyber-attack. If the Bank fails to observe the regulatory guidance, the Bank could be subject to various regulatory sanctions, including financial penalties.
Bank Secrecy Act and Anti-Money Laundering
The Bank is subject to the requirements of the Bank Secrecy Act and the Uniting and Strengthening America by Providing Appropriate Tools Required to Intercept and Obstruct Terrorism Act (“USA PATRIOT Act”) of 2001. The USA PATRIOT Act broadened existing anti-money laundering legislation by imposing new compliance and due diligence obligations focused on detecting and reporting money laundering transactions. These laws and regulations require the Bank to implement policies, procedures, and controls to detect, prevent, and report money laundering and terrorist financing and to verify the identity of our customers. Violations can result in substantial civil and criminal sanctions. In addition, provisions of the USA PATRIOT Act require the federal financial regulatory agencies to consider the effectiveness of a financial institution’s anti-money laundering activities when reviewing mergers and acquisitions.
Office of Foreign Assets Control Regulation
The U.S. Department of the Treasury’s (“Treasury”) Office of Foreign Assets Control (“OFAC”) administers and enforces economic and trade sanctions against targeted foreign countries and regimes, under authority of various laws, including designated foreign countries, nationals, and others. OFAC publishes lists of specially designated targets and countries. We are responsible for, among other things, blocking accounts of, and transactions with, such targets and countries, prohibiting unlicensed trade and financial transactions with them, and reporting blocked transactions after their occurrence. Failure to comply with these sanctions could have serious legal,
12
Table of Contents
financial, and reputational consequences, including causing applicable bank regulatory authorities to not approve merger or acquisition transactions when regulatory approval is required or to prohibit such transactions even if approval is not required.
Sarbanes-Oxley Act
The Sarbanes-Oxley Act (“SOX Act”) of 2002 addresses a broad range of corporate governance, auditing and accounting, executive compensation, and disclosure requirements for public companies and their directors and officers. The SOX Act requires our Chief Executive Officer and Chief Financial Officer to certify the accuracy of certain information included in our quarterly and annual reports. The rules require these officers to certify that they are responsible for establishing, maintaining, and regularly evaluating the effectiveness of our financial reporting and disclosure controls and procedures; that they have made certain disclosures to the auditors and to the Audit Committee of the board of directors about our controls and procedures; and that they have included information in their quarterly and annual filings about their evaluation and whether there have been significant changes to the controls and procedures or other factors which would significantly impact these controls subsequent to their evaluation. Section 404 of the SOX Act requires management to undertake an assessment of the adequacy and effectiveness of our internal controls over financial reporting and requires our auditors to attest to and report on the effectiveness of these controls.
Available Information
We file annual, quarterly, and current reports; proxy statements; and other information with the SEC. You may read and copy any document we file with the SEC at the SEC’s Public Reference Room at 100 F Street, N.E., Washington, DC 20549. Please call the SEC at 1-800-SEC-0330 for information about the public reference room. The SEC maintains a website at www.sec.gov that contains reports, proxy and information statements, and other information that issuers file electronically with the SEC. We maintain a website at www.fcbinc.com that makes available, free of charge, our Annual Reports on Form 10-K, Quarterly Reports on Form 10-Q, Current Reports on Form 8-K, and other information, including any amendments to those reports as soon as reasonably practicable after such reports are filed with, or furnished to, the SEC. You are encouraged to access these reports and other information about our business from the Investor Relations section of our website. The Investor Relations section contains information about our Board of Directors, executive officers, and corporate governance policies and principles, which include the charters of the standing committees of the Board of Directors, the Insider Trading Disclosure Policy, and the Standards of Conduct governing our directors, officers, and employees. Information on our website is not incorporated by reference in this report.
| Item 1A. | Risk Factors. |
The risk factors described below discuss potential events, trends, or other circumstances that could adversely affect our business, financial condition, results of operations, cash flows, liquidity, access to capital resources, and, consequently, cause the market value of our common stock to decline. These risks could cause our future results to differ materially from historical results and expectations of future financial performance. If any of the risks occur and the market price of our common stock declines significantly, individuals may lose all, or part, of their investment in our Company. Individuals should carefully consider our risk factors and information included, or incorporated by reference, in this report before making an investment decision. There may be risks and uncertainties that we have not identified or that we have deemed immaterial that could adversely affect our business; therefore, the following risk factors are not intended to be an exhaustive list of all risks we face.
Risks Related to Our Business
The current economic environment poses significant challenges.
Our financial performance is generally highly dependent on the business environment in the markets we operate in and of the U.S. as a whole, which includes the ability of borrowers to pay interest, repay principal on
13
Table of Contents
outstanding loans, the value of collateral securing those loans, and demand for loans and other products and services we offer. A favorable business environment is generally characterized by, among other factors, economic growth, efficient capital markets, low inflation, low unemployment, high business and investor confidence, and strong business earnings. Unfavorable or uncertain economic and market conditions can be caused by declines in economic growth, business activity, investor or business confidence; limitations on the availability, or increases, in the cost of credit and capital; increases in inflation or interest rates; high unemployment; natural disasters; or a combination of these or other factors.
Although economic conditions have improved since the financial crisis of 2007-2009, economic growth for many households and industries has been slow in the U.S. and worldwide. There can be no assurance that these conditions will continue to improve nor that these conditions will not worsen. Economic pressure on consumers and uncertainty about continuing economic improvement may result in changes in consumer and business spending, borrowing, and savings habits. In addition, oil price volatility, the level of U.S. debt, and global economic conditions have had a destabilizing effect on financial markets. Such conditions could adversely affect the credit quality of the Bank’s loans and the Company’s business, financial condition, and results of operations.
We operate in a highly regulated industry subject to examination, supervision, enforcement, and other legal actions by various federal and state governmental authorities, laws, and judicial and administrative decisions.
Congress and federal regulatory agencies continually review banking laws, regulations, and policies. Changes to these statutes, regulations, and regulatory policies, including changes in the interpretation or implementation, may cause substantial and unpredictable effects, require additional costs, limit the types of financial services and products offered, or allow non-banks to offer competing financial services and products. The Dodd-Frank Act, enacted in July 2010, instituted major changes to banking and financial institutions’ regulatory regimes. For additional information, see “Supervision and Regulation” in Item 1 of this report. Failure to follow laws, regulations, and policies may result in sanctions by regulatory agencies and civil money penalties, which could have material adverse effects on our reputation, business, financial condition, and results of operations. We have policies and procedures designed to prevent violations; however, there is no assurance that violations will not occur. Existing and future laws, regulations, and policies yet to be adopted may make compliance more difficult or expensive; restrict our ability to originate, broker, or sell loans; further limit or restrict commissions, interest, and other charges earned on loans we originate or sell; and adversely affect our business, financial condition, and results of operations.
The Bank’s ability to pay dividends is subject to regulatory limitations that may affect the Company’s ability to pay expenses and dividends to shareholders.
The Company is a legal entity that is separate and distinct from its subsidiaries. The Company depends on the Bank and its other subsidiaries for cash, liquidity, and the payment of dividends to the Company to pay operating expenses and dividends to stockholders. There is no assurance that the Bank will have the capacity to pay dividends to the Company in the future or that the Company will not require dividends from the Bank to satisfy obligations. The Bank’s dividend payment is governed by various statutes and regulations. For additional information, see “Payment of Dividends” in Item 1 of this report. The Company may not be able to service obligations as they become due if the Bank is unable to pay dividends sufficient to satisfy the Company’s obligations, including required payments to the Trust or our common stock. Consequently, the inability to receive dividends from the Bank could adversely affect the Company’s financial condition, results of operations, cash flows, and prospects.
We face strong competition from other financial institutions, financial service companies, and organizations that offer services similar to our offerings.
Our larger competitors may have substantially greater resources and lending limits, name recognition, and market presence that allow them to offer products and services that we do not offer and to price loans and deposits more
14
Table of Contents
aggressively than we do. The expansion of non-bank competitors, which may have fewer regulatory constraints and lower cost structures, over recent years has intensified competitive pressures on core deposit generation and retention. For additional information, see “Competition” in Item 1 of this report. Our success depends, in part, on our ability to attract and retain customers by adapting our products and services to evolving customer needs and industry and economic conditions. Failure to perform in any of these areas could weaken our competitive position, reduce deposits and loan originations, and adversely affect our financial condition, results of operations, cash flows, and prospects.
We may require additional capital in the future that may not be available when needed.
We may need to raise additional capital to strengthen our capital position, increase our liquidity, satisfy obligations, or pursue growth objectives. Our ability to raise additional capital depends on current conditions in capital markets, which are outside our control, and our financial performance. Certain economic conditions and declining market confidence may increase our cost of funds and limit our access to customary sources of capital, such as borrowings with other financial institutions, repurchase agreements, and availability under the FRB’s Discount Window. Events that limit access to capital markets and the inability to obtain capital may have a materially adverse effect on our business, financial condition, results of operations, and market value of common stock. We cannot provide any assurance that additional capital will be available, on acceptable terms or at all, in the future.
Liquidity risk could impair our ability to fund operations.
Liquidity is essential to our business and the inability to raise funds through deposits, borrowings, equity and debt offerings, or other sources could have a materially adverse effect on our liquidity. Company specific factors such as a decline in our credit rating, an increase in the cost of capital from financial capital markets, a decrease in business activity due to adverse regulatory action or other company specific event, or a decrease in depositor or investor confidence may impair our access to funding with acceptable terms adequate to finance our activities. General factors related to the financial services industry such as a severe disruption in financial markets, a decrease in industry expectations, or a decrease in business activity due to political or environmental events may impair our access to liquidity.
We are subject to interest rate risk.
Interest rate risk results principally from interest-earning assets and interest-bearing liabilities repricing at differing times, when underlying rates change at different levels or in varying degrees, when there is an unequal change in the spread between two or more rates for different maturities, and when embedded options, if any, are exercised. Our earnings and cash flows are largely dependent upon net interest income. Interest rates are highly sensitive to many factors that are beyond our control, including general economic conditions and policies of various governmental and regulatory agencies, particularly, the Federal Reserve. Changes in monetary policy and interest rates could influence the interest we receive on loans and securities and the amount of interest we pay on deposits and borrowings. Further, such changes could also affect our ability to originate loans and obtain deposits and the fair value of our financial assets and liabilities. If the interest rates paid on deposits and other borrowings increase at a faster rate than the interest rates received on loans and other investments, our net interest income and earnings could be adversely affected. Conversely, if interest rates received on loans and other investments fall more quickly than interest rates paid on deposits and other borrowings, our net interest income and earnings could also be adversely affected.
Our accounting estimates and risk management processes rely on analytical and forecasting models.
The processes we use to estimate probable loan losses and to measure the fair value of financial instruments, as well as the processes used to estimate the effects of changing interest rates and other market measures on our financial condition and results of operations, depend upon analytical and forecasting models. These models
15
Table of Contents
reflect assumptions that may not be accurate, particularly in times of market stress or other unforeseen circumstances. Even if these assumptions are adequate, the models may prove to be inadequate or inaccurate because of other flaws in their design or their implementation. If the models we use for interest rate risk and asset/liability management are inadequate, we may incur increased or unexpected losses upon changes in market interest rates or other market measures. If the models used for determining probable loan losses are inadequate, the allowance for loan losses may not be sufficient to cover actual loan losses and an increase in the loan loss provision could materially and adversely affect our operating results. Federal regulatory agencies regularly review our loans and allowance for loan losses as an integral part of the examination process. There is no assurance that we will not, or that regulators will not require us to, increase our allowance in future periods, which could materially and adversely affect our earnings and profitability. If the models we use to measure the fair value of financial instruments are inadequate, the fair value of such financial instruments may fluctuate unexpectedly or may not accurately reflect what we could realize upon the sale or settlement of such financial instruments. Any such failure in our analytical or forecasting models could have a material adverse effect on our business, financial condition, and results of operations. For additional information, see “Fair Value Measurements” and “Allowance for Loan Losses” in the “Critical Accounting Estimates” section in Part II, Item 7 and Note 1, “Basis of Presentation and Accounting Policies,” to the Consolidated Financial Statements in Part II, Item 8 of this report.
Changes in the fair value of our investment securities may reduce stockholders’ equity and net income.
A decline in the estimated fair value of the investment portfolio may result in a decline in stockholders’ equity, book value per common share, and tangible book value per common share. Unrealized losses are recorded even though the securities are not sold or held for sale. If a debt security is never sold and no credit impairment exists, the decrease is recovered at the security’s maturity. Equity securities have no stated maturity; therefore, declines in fair value may or may not be recovered over time. We conduct quarterly reviews of our securities portfolio to determine if unrealized losses are temporary or other than temporary. No assurance can be given that we will not need to recognize other-than-temporary impairment (“OTTI”) charges in the future. Additional OTTI charges may materially affect our financial condition and earnings. For additional information, see “Investment Securities” in the “Critical Accounting Estimates” section in Part II, Item 7 and Note 1, “Basis of Presentation and Accounting Policies,” and Note 3, “Investment Securities,” to the Consolidated Financial Statements in Part II, Item 8 of this report.
We are subject to credit risk associated with the financial condition of other financial institutions.
Credit risk is the risk of not collecting payments pursuant to the contractual terms of loans, leases and investment securities. Financial institutions are interrelated as a result of trading, clearing, counterparty, and other relationships. We have exposure to different industries and counterparties, and we routinely execute transactions with counterparties in the financial services industry, including brokers and dealers, commercial banks, investment banks, investment companies, and other institutional clients. Our ability to engage in routine funding transactions could be adversely affected by the failure, actions, and commercial soundness of other financial institutions. These transactions may expose us to credit risk if our counterparty or client defaults on their contractual obligation. Our credit risk may increase if the collateral we hold cannot be realized or liquidated at prices sufficient to recover the full amount of the loan or derivative exposure due to us. In the event of default, we may be required to provide collateral to secure the obligation to the counterparties. In the event of a bankruptcy or insolvency proceeding involving one of such counterparties, we may experience delays in recovering the assets posted as collateral or may incur a loss to the extent that the counterparty was holding collateral in excess of the obligation to such counterparty. Losses from routine funding transactions could have a material adverse effect on our financial condition and results of operations.
Our commercial loan portfolio may expose us to increased credit risk.
Commercial business and real estate loans generally have a higher risk of loss because loan balances are typically larger than residential real estate and consumer loans and repayment is usually dependent on cash flows from the
16
Table of Contents
borrower’s business or the property securing the loan. Our commercial business loans are primarily made to small business and middle market customers. As of December 31, 2016, commercial business and real estate loans totaled $1.02 billion, or 54.81%, of our total loan portfolio. As of the same date, our largest outstanding commercial business loan was $6.40 million and largest outstanding commercial real estate loan was $11.40 million. Commercial construction loans generally have a higher risk of loss due to the assumptions used to estimate the value of property at completion and the cost of the project, including interest. If the assumptions and estimates are inaccurate, the value of completed property may fall below the related loan amount. As of December 31, 2016, commercial construction loans totaled $61.52 million, or 3.32% of our total loan portfolio. As of the same date, our largest outstanding commercial construction loan was $5.57 million. Losses from our commercial loan portfolio could have a material adverse effect on our financial condition and results of operations.
We are subject to environmental liability risk associated with lending activities.
A significant portion of our loan portfolio is secured by real property. In the ordinary course of business, we foreclose on and take title to properties that secure certain loans. Hazardous or toxic substances could be found on properties we own. If substances are present, we may be liable for remediation costs, personal injury claims, and property damage and our ability to use or sell the property would be limited. We have policies and procedures in place that require environmental reviews before initiating foreclosure actions on real property; however, these reviews may not detect all potential environmental hazards. Environmental laws that require us to incur substantial remediation costs, which could materially reduce the affected property’s value, and other liabilities associated with environmental hazards could have a material adverse effect on our financial condition and results of operations.
Potential acquisitions may disrupt our business and dilute stockholder value.
We may seek merger or acquisition partners that are culturally similar, have experienced management, and possess either significant market presence or the potential for improved profitability through financial management, economies of scale, or expanded services. Risks inherent in acquiring other banks, businesses, and banking branches may include the following:
| • | potential exposure to unknown or contingent liabilities of the target company; |
| • | exposure to potential asset quality issues of the target company; |
| • | difficulty, expense, and delays of integrating the operations and personnel of the target company; |
| • | potential disruption to our business; |
| • | potential diversion of management’s time and attention; |
| • | loss of key employees and customers of the target company; |
| • | difficulty in estimating the value of the target company; |
| • | potential changes in banking or tax laws or regulations that may affect the target company; |
| • | unexpected costs and delays; |
| • | the target company’s performance does not meet our growth and profitability expectations; |
| • | limited experience in new markets or product areas; |
| • | increased time, expenses, and personnel as a result of strain on our infrastructure, staff, internal controls, and management; and |
| • | potential short-term decreases in profitability. |
17
Table of Contents
We regularly evaluate merger and acquisition opportunities and conduct due diligence activities related to possible transactions with other financial institutions and financial services companies. As a result, merger or acquisition discussions and, in some cases, negotiations may take place and future mergers or acquisitions involving the payment of cash or the issuance of debt or equity securities may occur at any time. Acquisitions typically involve goodwill, a purchase premium over the acquired company’s book and market values; therefore, dilution of our tangible book value and net income per common share may occur. If we are unable to realize revenue increases, cost savings, geographic or product presence growth, or other projected benefits from acquisitions, our financial condition and results of operations may be adversely affected.
We are subject to certain obligations under FDIC loss share agreements that specify how to manage, service, report, and request reimbursement for losses incurred on covered assets.
Our ability to receive benefits under FDIC loss share agreements is subject to compliance with certain requirements, oversight and interpretation, and contractual term limitations. Our obligations under loss share agreements are extensive, and failure to follow any obligations could result in a specific asset, or group of assets, losing loss share coverage. Reimbursement requests are subject to FDIC review and may be delayed or disallowed if we do not comply with our obligations. Losses projected to occur during the loss share term may not be realized until after the expiration of the applicable agreement; consequently, those losses may have a material adverse impact on our results of operations. Our current loss estimates only include those projected to occur during the loss share period and for which we expect reimbursement from the FDIC at the applicable reimbursement rate. We are subject to FDIC audits to ensure compliance with the loss share agreements. The loss share agreements are subject to interpretation by the FDIC and us; therefore, disagreements about the coverage of losses, expenses, and contingencies may arise. The realization of benefits to be received from the FDIC ultimately depends on the performance of the underlying covered assets, the passage of time, claims paid by the FDIC, and interpretation; therefore, the amount received could differ materially from the carrying value of expected reimbursements and have a material effect on our financial condition and results of operations. For additional information, see “FDIC Indemnification Asset” in the “Critical Accounting Estimates” section in Part II, Item 7 and Note 1, “Basis of Presentation and Accounting Policies,” and Note 7, “FDIC Indemnification Asset,” to the Consolidated Financial Statements in Part II, Item 8 of this report.
Attractive acquisition opportunities may not be available in the future.
We expect banking and financial companies, which may have significantly greater resources, to compete for the acquisition of financial service businesses. This competition could increase the price of potential acquisitions that we believe are attractive. If we fail to receive proper regulatory approval, we will not be able to consummate an acquisition. Our regulators consider our capital, liquidity, profitability, regulatory compliance, level of goodwill and intangible assets, and other factors when considering acquisition and expansion proposals. Future acquisitions may be dilutive to our earnings and equity per share of our common stock.
We may experience future goodwill impairment.
We test goodwill for impairment annually, or more often if necessary, using quantitative and qualitative factors. Impairment charges may cause an adverse effect on our earnings and financial position. For additional information, see “Intangible Assets” in the “Critical Accounting Estimates” section in Part II, Item 7 and Note 1, “Basis of Presentation and Accounting Policies,” and Note 9, “Goodwill and Other Intangible Assets,” to the Consolidated Financial Statements in Part II, Item 8 of this report.
We may be required to pay higher FDIC insurance premiums or special assessments.
Our deposits are insured up to applicable limits by the DIF of the FDIC and we are subject to deposit insurance assessments to maintain the DIF. For additional information, see “Deposit Insurance and Assessments” in Item 1 of this report. We are unable to predict future insurance assessment rates; however, deterioration in our risk-
18
Table of Contents
based capital ratios or adjustments to base assessment rates may result in higher insurance premiums or special assessments. The deterioration of banking and economic conditions and financial institution failures deplete the FDIC’s DIF and reduce the ratio of reserves to insured deposits. If the DIF is unable to meet funding requirements, increases in deposit insurance premium rates or special assessments may be required. Future assessments, increases, or required prepayments related to FDIC insurance premiums may negatively affect our financial condition and results of operations.
The repeal of the federal prohibitions on payment of interest on demand deposits could increase our interest expense.
All federal prohibitions on the ability of financial institutions to pay interest on demand deposit accounts were repealed as part of the Dodd-Frank Act beginning on July 21, 2011. As a result, some financial institutions have begun offering interest on demand deposits to compete for customers. We do not know what interest rates other institutions may offer as market interest rates begin to increase. Our interest expense will increase and net interest margin will decrease if we offer interest on demand deposits to attract additional customers or maintain current customers, which could have a material adverse effect on our business, financial condition, and results of operations.
We may lose members of our management team and have difficulty attracting skilled personnel.
Our success depends, in part, on our ability to attract and retain key employees. Competition for the best people can be intense. The unexpected loss of key personnel could have a material adverse impact on our business due to the loss of certain skills, market knowledge, and industry experience and the difficulty of promptly finding qualified replacement personnel. Certain existing and proposed regulatory guidance on compensation may also negatively affect our ability to retain and attract skilled personnel.
Our controls and procedures may fail or be circumvented.
We review our internal controls over financial reporting quarterly and enhance controls in response to these assessments, internal and external audit, and regulatory recommendations. A control system, no matter how well conceived and operated, includes certain assumptions and can only provide reasonable assurance that the objectives of the control system are met. These controls may be circumvented by individual acts, collusion, or management override. Any failure or circumvention related to our controls and procedures or failure to follow regulations related to controls and procedures could have a material adverse effect on our business, reputation, results of operations, and financial condition.
We continue to encounter technological change and are subject to information security risks associated with technology.
The financial services industry continues to experience rapid technological change with the introduction of new, and increasingly complex, technology-driven products and services. The effective use of technology increases operational efficiency that enables financial service institutions to reduce costs. Our future success depends, in part, on our ability to provide products and services that satisfactorily meet the financial needs of our customers, as well as to realize additional efficiencies in our operations. We may fail to use technology-driven products and services effectively to better serve our customers and increase operational efficiency or sufficiently invest in technology solutions and upgrades to ensure systems are operating properly. Further, many of our competitors have substantially greater resources to invest in technology, which may adversely affect our ability to compete.
We rely on electronic communications and information systems, including those provided by third-party vendors, to conduct our business operations. Our security risks increase as our reliance on technology increases; consequently, the expectation to safeguard information by monitoring systems for potential failures, disruptions, and breakdowns has also increased. Risks associated with technology include security breaches, operational
19
Table of Contents
failures and service interruptions, and reputational damages. These risks also apply to our third-party service providers. Our third-party vendors include large entities with significant market presence in their respective fields; therefore, their services could be difficult to replace quickly if there are operational failures or service interruptions.
We rely on our technology-driven systems to conduct daily business and accounting operations that include the collection, processing, and retention of confidential financial and client information. We may be vulnerable to security breaches, such as employee error, cyber-attacks, and viruses, beyond our control. In addition to security breaches, programming errors, vandalism, natural disasters, terrorist attacks, and third-party vendor disruptions may cause operational failures and service interruptions to our communication and information systems. Further, our systems may be temporarily disrupted during implementation or upgrade. Security breaches and service interruptions related to our information systems could damage our reputation, which may cause us to lose customers, subject us to regulatory scrutiny, or expose us to civil litigation and financial liability.
Our customers and employees have been, and will continue to be, targeted by parties using fraudulent e-mails and other communications in attempts to misappropriate passwords, bank account information or other personal information, or to introduce viruses or other malware through “Trojan horse” programs to our information systems and/or our customers’ computers. Though we endeavor to mitigate these threats through product improvements, use of encryption and authentication technology, and customer and employee education, such cyber-attacks against us or our merchants and our third party service providers remain a serious issue. The pervasiveness of cybersecurity incidents in general and the risks of cyber-crime are complex and continue to evolve. More generally, publicized information about security and cyber-related problems could inhibit the use or growth of electronic or web-based applications or solutions as a means of conducting commercial transactions.
While we have not experienced a significant compromise, significant data loss, or any material financial losses related to cybersecurity attacks, our systems and those of our customers and third-party service providers are under constant threat and it is possible that we could experience a significant event in the future. Although we make significant efforts to maintain the security and integrity of our information systems and have implemented various measures to manage the risk of a security breach or disruption, there can be no assurance that our security efforts and measures will be effective or that attempted security breaches or disruptions would not be successful or damaging. Even the most well protected information, networks, systems and facilities remain potentially vulnerable because attempted security breaches, particularly cyber-attacks and intrusions, or disruptions will occur in the future, and because the techniques used in such attempts are constantly evolving and generally are not recognized until launched against a target, and in some cases are designed not to be detected and, in fact, may not be detected. Accordingly, we may be unable to anticipate these techniques or to implement adequate security barriers or other preventative measures, and thus it is virtually impossible for us to entirely mitigate this risk. A security breach or other significant disruption of our information systems or those related to our customers, merchants and our third party vendors, including as a result of cyber-attacks, could (1) disrupt the proper functioning of our networks and systems and therefore our operations and/or those of our customers; (2) result in the unauthorized access to, and destruction, loss, theft, misappropriation or release of confidential, sensitive or otherwise valuable information of ours or our customers; (3) result in a violation of applicable privacy, data breach and other laws, subjecting us to additional regulatory scrutiny and expose us to civil litigation, governmental fines and possible financial liability; (4) require significant management attention and resources to remedy the damages that result; or (5) harm our reputation or cause a decrease in the number of customers who choose to do business with us. The occurrence of any of the foregoing could have a material adverse effect on our business, financial condition and results of operations.
We may be subject to claims and litigation pertaining to intellectual property.
Banking and other financial services companies, such as the Company, rely on technology companies to provide information technology products and services necessary to support the Company’s day-to-day operations. Technology companies often enter into litigation based on allegations of patent infringement or other violations
20
Table of Contents
of intellectual property rights. In addition, patent holding companies seek to monetize patents they have purchased or otherwise obtained. Competitors of the Company’s vendors, or other individuals or companies, have from time to time claimed to hold intellectual property sold to the Company by its vendors. Such claims may increase in the future as the financial services sector becomes more reliant on information technology vendors. The plaintiffs in these actions often seek injunctions and substantial damages.
Regardless of the scope or validity of such patents or other intellectual property rights, or the merits of any claims by potential or actual litigants, the Company may have to engage in protracted litigation. Such litigation is often expensive, time consuming, disruptive to the Company’s operations, and distracting to management. If the Company is found to have infringed on one or more patents or other intellectual property rights, it may be required to pay substantial damages or royalties to a third party. In certain cases, the Company may consider entering into licensing agreements for disputed intellectual property, although no assurance can be given that such licenses can be obtained on acceptable terms or that litigation will not occur. These licenses may also significantly increase the Company’s operating expenses. If legal matters related to intellectual property claims were resolved against the Company or settled, the Company could be required to make payments in amounts that could have a material adverse effect on its business, financial condition, and results of operations.
Risks Related to Our Common Stock
The market price of our common stock may be volatile.
Stock price volatility may make it more difficult for our stockholders to resell their common stock when desired. Our common stock price may fluctuate significantly due to a variety of factors that include the following:
| • | actual or expected variations in quarterly results of operations; |
| • | recommendations by securities analysts; |
| • | operating and stock price performance of comparable companies, as deemed by investors; |
| • | news reports relating to trends, concerns, and other issues in the financial services industry; |
| • | perceptions in the marketplace about our Company or competitors; |
| • | new technology used, or services offered, by competitors; |
| • | significant acquisitions or business combinations, strategic partnerships, joint ventures, or capital commitments by, or involving, our Company or competitors; |
| • | failure to integrate acquisitions or realize expected benefits from acquisitions; |
| • | changes in government regulations; and |
| • | geopolitical conditions, such as acts or threats of terrorism or military action. |
General market fluctuations; industry factors; political conditions; and general economic conditions and events, such as economic slowdowns, recessions, interest rate changes, or credit loss trends, could also cause our common stock price to decrease regardless of operating results.
The trading volume in our common stock is less than that of other larger financial services companies.
Although our common stock is listed for trading on the NASDAQ, the trading volume in our common stock is less than that of other, larger financial services companies. A public trading market having the desired characteristics of depth, liquidity, and orderliness depends on the presence in the marketplace of willing buyers and sellers of our common stock at any given time. This presence depends on the individual decisions of investors and general economic and market conditions over which we have no control. Given the lower trading volume of our common stock, significant sales of our common stock or the expectation of these sales could cause our stock price to fall.
21
Table of Contents
We may not continue to pay dividends on our common stock in the future.
Our common stockholders are only entitled to receive dividends when declared by our Board of Directors from funds legally available for such payments. Although we have historically declared cash dividends on our common stock, we are not required to do so, and may reduce or eliminate our common stock dividend in the future. This could adversely affect the market price of our common stock. As a financial holding company, the Company’s ability to declare and pay dividends is dependent on certain federal regulatory considerations, including the guidelines of the Federal Reserve about capital adequacy and dividends. For additional information, see “Payment of Dividends” in Item 1 of this report.
| Item 1B. | Unresolved Staff Comments. |
None.
| Item 2. | Properties. |
We own our corporate headquarters located at One Community Place, Bluefield, Virginia. As of December 31, 2016, the Bank provided financial services through a network of 45 branch locations in West Virginia (18 branches), Virginia (20 branches), North Carolina (5 branches), and Tennessee (2 branches). We own 42 of these branches and lease the remaining 3 branches. We also lease 2 loan production offices and own 1 wealth management office and 1 call center location. As of December 31, 2016, there were no mortgages or liens against any properties. We believe that our properties are suitable and adequate to serve as financial services facilities. A list of all branch and ATM locations is available on our website at www.fcbinc.com. Information contained on our website is not part of this report. For additional information, see Note 8, “Premises, Equipment, and Leases,” to the Consolidated Financial Statements in Part II, Item 8 of this report.
| Item 3. | Legal Proceedings. |
We are currently a defendant in various legal actions and asserted claims in the normal course of business. Although we are unable to assess the ultimate outcome of each of these matters with certainty, we are of the belief that the resolution of these actions should not have a material adverse effect on our financial position, results of operations, or cash flows.
| Item 4. | Mine Safety Disclosures. |
None.
22
Table of Contents
PART II
| Item 5. | Market for Registrant’s Common Equity, Related Stockholder Matters and Issuer Purchases of Equity Securities. |
Market Information, Holders, and Dividends
Our common stock is traded on the NASDAQ Global Select Market under the symbol FCBC. As of February 28, 2017, there were 2,451 record holders and 16,994,616 outstanding shares of our common stock. The following table presents the high and low stock prices and cash dividends paid per share of our common stock for the periods indicated:
| Year Ended December 31, | ||||||||||||||||||||||||
| 2016 | 2015 | |||||||||||||||||||||||
| Sale Price | Cash Dividends per Common Share |
Sale Price | Cash Dividends per Common Share |
|||||||||||||||||||||
| High | Low | High | Low | |||||||||||||||||||||
| First quarter |
$ | 19.93 | $ | 16.67 | $ | 0.14 | $ | 18.00 | $ | 14.94 | $ | 0.13 | ||||||||||||
| Second quarter |
22.74 | 19.03 | 0.14 | 18.80 | 16.12 | 0.13 | ||||||||||||||||||
| Third quarter |
25.24 | 21.53 | 0.16 | 18.68 | 15.79 | 0.14 | ||||||||||||||||||
| Fourth quarter |
31.94 | 20.47 | 0.16 | 20.82 | 16.83 | 0.14 | ||||||||||||||||||
Common stock cash dividends totaled $10.40 million in 2016, $9.99 million in 2015, and $9.20 million in 2014. Cash dividends paid per common share totaled $0.60 in 2016, $0.54 in 2015, and $0.50 in 2014. The Company’s ability to pay dividends on its common stock is dependent on the Bank’s ability to pay dividends to the Company, which is subject to various regulatory restrictions and limitations. For additional information, see “Payment of Dividends” in Part I, Item 1 of this report.
During the first quarter of 2015, the Company notified holders of its 6% Series A Noncumulative Convertible Preferred Stock (“Series A Preferred Stock”) of its intent to redeem all of the outstanding shares. Prior to redemption, holders converted 12,784 shares of Series A Preferred Stock with each share convertible into 69 shares of the Company’s common stock. The Company redeemed the remaining 2,367 shares for $2.37 million along with accrued and unpaid dividends of $9 thousand. As a result of the redemption, there were no shares of Series A Preferred Stock outstanding as of December 31, 2016, or December 31, 2015, compared to 15,151 shares as of December 31, 2014. Series A Preferred Stock cash dividends totaled $105 thousand in 2015 and $910 thousand in 2014.
Purchases of Equity Securities
We repurchased 1,182,294 shares of our common stock in 2016, 1,238,299 shares in 2015, and 132,773 shares in 2014. The following table provides information about purchases of our common stock made by us or on our behalf by any affiliated purchaser, as defined in Rule 10b-18(a)(3) under the Exchange Act, during the periods indicated:
| Total Number of Shares Purchased |
Average Price Paid per Share |
Total Number of Shares Purchased as Part of a Publicly Announced Plan |
Maximum Number of Shares that May Yet be Purchased Under the Plan (1) |
|||||||||||||
| October 1-31, 2016 |
4,800 | $ | 23.30 | 4,800 | 602,904 | |||||||||||
| November 1-30, 2016 |
24,718 | 22.44 | 24,718 | 581,399 | ||||||||||||
| December 1-31, 2016 |
— | — | — | 612,429 | ||||||||||||
|
|
|
|
|
|
|
|||||||||||
| Total |
29,518 | $ | 22.58 | 29,518 | ||||||||||||
|
|
|
|
|
|
|
|||||||||||
23
Table of Contents
| (1) | Our stock repurchase plan, as amended, authorizes the purchase and retention of up to 5,000,000 shares. The plan has no expiration date and is currently in effect. No determination has been made to terminate the plan or to cease making purchases. We held 4,387,571 shares in treasury as of December 31, 2016. |
Stock Performance Graph
The following graph, compiled by SNL Financial LC (“SNL”), compares the cumulative total shareholder return on our common stock for the five years ended December 31, 2016, with the cumulative total return of the S&P 500 Index, the NASDAQ Composite Index, and SNL’s Asset Size & Regional Peer Group. The Asset Size & Regional Peer Group consists of 48 bank holding companies with total assets between $1 billion and $5 billion that are located in the Southeast Region of the United States and traded on NASDAQ, the OTC Bulletin Board, and pink sheets. The cumulative returns assume that $100 was originally invested on December 31, 2011, and that all dividends are reinvested.
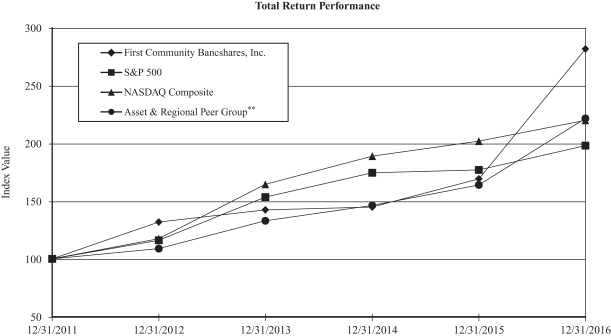
| Year Ended December 31, | ||||||||||||||||||||||||
| 2011 | 2012 | 2013 | 2014 | 2015 | 2016 | |||||||||||||||||||
| First Community Bancshares, Inc. |
100.00 | 132.00 | 142.30 | 145.03 | 169.18 | 281.69 | ||||||||||||||||||
| S&P 500 Index |
100.00 | 116.00 | 153.57 | 174.60 | 177.01 | 198.18 | ||||||||||||||||||
| NASDAQ Composite Index |
100.00 | 117.45 | 164.57 | 188.84 | 201.98 | 219.89 | ||||||||||||||||||
| SNL Asset & Regional Peer Group (1) |
100.00 | 108.93 | 133.11 | 146.29 | 164.11 | 221.70 | ||||||||||||||||||
| (1) | Includes the following institutions: John Marshall Bank; Citizens Holding Company; SmartFinancial, Inc.; Peoples Bancorp of North Carolina, Inc.; CNB Corporation; Southern National Bancorp of Virginia, Inc.; Colony Bankcorp, Inc.; National Bankshares, Inc.; Community Bankers Trust Corporation; TGR Financial, Inc.; First Bancshares, Inc.; Southern First Bancshares, Inc.; Eastern Virginia Bankshares, Inc.; CapStar Financial Holdings, Inc.; Middleburg Financial Corporation; First Farmers and Merchants Corporation; Access National Corporation; C&F Financial Corporation; MVB Financial Corp.; Paragon Commercial Corporation; Premier Financial Bancorp, Inc.; First Bancorp, Inc.; American National Bankshares Inc.; First Citizens Bancshares, Inc.; Carolina Financial Corporation; Summit Financial Group, Inc.; Live Oak |
24
Table of Contents
| Bancshares, Inc.; National Commerce Corporation; Hamilton State Bancshares, Inc.; WashingtonFirst; Bankshares, Inc.; Bear State Financial, Inc.; Wilson Bank Holding Co.; Southern BancShares (N.C.), Inc.; Capital City Bank Group, Inc.; HomeTrust Bancshares, Inc.; Atlantic Capital Bancshares, Inc.; Burke & Herbert Bank & Trust Company; Stonegate Bank; Park Sterling Corporation; Xenith Bankshares, Inc.; First Bancorp; State Bank Financial Corporation; City Holding Company; USAmeriBancorp, Inc.; Cardinal Financial Corporation; Fidelity Southern Corporation; Seacoast Banking Corporation of Florida; and Carter Bank & Trust. |
25
Table of Contents
| Item 6. | Selected Financial Data. |
The following table presents selected consolidated financial data, derived from the audited financial statements, as of and for the five years ended December 31, 2016. This information should be read in conjunction with Item 7, “Management’s Discussion and Analysis of Financial Condition and Results of Operations,” and Item 8, “Financial Statements and Supplementary Data,” of this report.
| Year Ended December 31, | ||||||||||||||||||||
| (Amounts in thousands, except share and per share data) | 2016 | 2015 | 2014 | 2013 | 2012 | |||||||||||||||
| Selected Balance Sheet Data |
||||||||||||||||||||
| Investment securities |
$ | 212,712 | $ | 438,714 | $ | 384,065 | $ | 520,388 | $ | 535,174 | ||||||||||
| Loans |
1,852,948 | 1,706,541 | 1,691,208 | 1,711,604 | 1,731,325 | |||||||||||||||
| Allowance for loan losses |
17,948 | 20,233 | 20,227 | 24,077 | 25,770 | |||||||||||||||
| Total assets |
2,386,398 | 2,462,276 | 2,607,936 | 2,602,514 | 2,728,867 | |||||||||||||||
| Average assets |
2,455,458 | 2,520,934 | 2,608,570 | 2,661,602 | 2,510,931 | |||||||||||||||
| Deposits |
1,841,338 | 1,873,259 | 2,000,759 | 1,950,742 | 2,030,175 | |||||||||||||||
| Borrowings |
178,713 | 219,370 | 229,741 | 300,396 | 313,553 | |||||||||||||||
| Total liabilities |
2,047,341 | 2,119,259 | 2,256,562 | 2,273,908 | 2,372,544 | |||||||||||||||
| Preferred stock |
— | — | 15,151 | 15,251 | 17,421 | |||||||||||||||
| Total stockholders’ equity |
339,057 | 343,017 | 351,374 | 328,606 | 356,323 | |||||||||||||||
| Average stockholders’ equity |
338,475 | 348,199 | 342,619 | 355,611 | 334,901 | |||||||||||||||
| Summary of Operations |
||||||||||||||||||||
| Interest income |
$ | 94,724 | $ | 96,102 | $ | 106,108 | $ | 109,476 | $ | 109,656 | ||||||||||
| Interest expense |
9,844 | 11,349 | 15,290 | 17,834 | 19,600 | |||||||||||||||
| Net interest income |
84,880 | 84,753 | 90,818 | 91,642 | 90,056 | |||||||||||||||
| Provision for loan losses |
1,255 | 2,191 | 145 | 8,208 | 5,678 | |||||||||||||||
| Noninterest income |
27,066 | 29,530 | 30,003 | 29,771 | 36,710 | |||||||||||||||
| Noninterest expense |
72,746 | 76,171 | 82,862 | 78,985 | 78,383 | |||||||||||||||
| Income tax expense |
12,819 | 11,381 | 12,324 | 10,908 | 14,128 | |||||||||||||||
| Net income |
25,126 | 24,540 | 25,490 | 23,312 | 28,577 | |||||||||||||||
| Dividends on preferred stock |
— | 105 | 910 | 1,024 | 1,058 | |||||||||||||||
| Net income available to common shareholders |
25,126 | 24,435 | 24,580 | 22,288 | 27,519 | |||||||||||||||
| Selected Share and Per Share Data |
||||||||||||||||||||
| Basic earnings per common share |
$ | 1.45 | $ | 1.32 | $ | 1.34 | $ | 1.13 | $ | 1.44 | ||||||||||
| Diluted earnings per common share |
1.45 | 1.31 | 1.31 | 1.11 | 1.40 | |||||||||||||||
| Cash dividends per common share |
0.60 | 0.54 | 0.50 | 0.48 | 0.43 | |||||||||||||||
| Book value per common share at year-end (1) |
19.95 | 18.95 | 18.06 | 16.79 | 16.76 | |||||||||||||||
| Weighted average basic shares outstanding |
17,319,689 | 18,531,039 | 18,406,363 | 19,792,099 | 19,127,065 | |||||||||||||||
| Weighted average diluted shares outstanding |
17,365,524 | 18,727,464 | 19,483,054 | 20,961,800 | 20,419,569 | |||||||||||||||
| Selected Ratios |
||||||||||||||||||||
| Return on average assets |
1.02 | % | 0.97 | % | 0.94 | % | 0.84 | % | 1.10 | % | ||||||||||
| Return on average common equity |
7.42 | % | 7.07 | % | 7.51 | % | 6.57 | % | 8.70 | % | ||||||||||
| Average equity to average assets |
13.78 | % | 13.81 | % | 13.13 | % | 13.36 | % | 13.34 | % | ||||||||||
| Dividend payout |
41.36 | % | 40.95 | % | 37.44 | % | 42.62 | % | 29.89 | % | ||||||||||
| Common equity Tier 1 ratio (2) |
13.88 | % | 14.54 | % | NA | NA | NA | |||||||||||||
| Total risk-based capital ratio |
15.79 | % | 15.95 | % | 17.68 | % | 16.44 | % | 16.70 | % | ||||||||||
| Tier 1 risk-based capital ratio |
14.74 | % | 14.73 | % | 16.43 | % | 15.19 | % | 15.44 | % | ||||||||||
| Tier 1 leverage ratio |
11.07 | % | 10.62 | % | 10.12 | % | 9.95 | % | 9.96 | % | ||||||||||
| (1) | Book value per common share is defined as stockholders’ equity divided by as-converted common shares outstanding. |
| (2) | The common equity Tier 1 ratio became effective on January 1, 2015. |
26
Table of Contents
| Item 7. | Management’s Discussion and Analysis of Financial Condition and Results of Operations. |
Management’s Discussion and Analysis of Financial Condition and Results of Operations (“MD&A”) is intended to help the reader understand our financial condition, changes in financial condition, and results of operations. MD&A contains forward-looking statements and should be read in conjunction with our consolidated financial statements, accompanying notes, and other financial information included in this report. Unless the context suggests otherwise, the terms “First Community,” “Company,” “we,” “our,” and “us” refer to First Community Bancshares, Inc. and its subsidiaries as a consolidated entity.
Executive Overview
First Community Bancshares, Inc. (the “Company”) is a financial holding company, headquartered in Bluefield, Virginia, that provides banking products and services through its wholly owned subsidiary First Community Bank (the “Bank”), a Virginia chartered bank institution. As of December 31, 2016, the Bank operated 45 branches as First Community Bank in Virginia, West Virginia, and North Carolina and as People’s Community Bank, a Division of First Community Bank, in Tennessee. Our primary source of earnings is net interest income, the difference between interest earned on assets and interest paid on liabilities, which is supplemented by fees for services, commissions on sales, and various deposit service charges. We fund our lending and investing activities primarily through the retail deposit operations of our branch banking network and, to a lesser extent, retail and wholesale repurchase agreements and Federal Home Loan Bank (“FHLB”) borrowings. We invest our funds primarily in loans to retail and commercial customers and various investment securities.
During the fourth quarter of 2016, the Company sold its wholly owned subsidiary Greenpoint Insurance Group, Inc. (“Greenpoint”) and created First Community Insurance Services, a wholly owned subsidiary of the Bank, to continue offering in-branch commercial and personal insurance services in Virginia and West Virginia. Revenues are primarily derived from commissions paid by issuing companies on the sale of policies.
The Bank offers trust management, estate administration, and investment advisory services through its Trust Division and wholly owned subsidiary First Community Wealth Management (“FCWM”). The Trust Division manages inter vivos trusts and trusts under will, develops and administers employee benefit and individual retirement plans, and manages and settles estates. Fiduciary fees for these services are charged on a schedule related to the size, nature, and complexity of the account. Revenues consist primarily of commissions on assets under management and investment advisory fees. As of December 31, 2016, the Trust Division and FCWM managed $846 million in combined assets under various fee-based arrangements as fiduciary or agent.
Our acquisition and divestiture activity during the three years ended December 31, 2016, includes the simultaneous sale of six branches to and purchase of seven branches from First Bank on July 15, 2016; the sale of thirteen branches to CresCom Bank on December 12, 2014; and the purchase of seven branches from Bank of America, National Association, on October 24, 2014. For additional information, see Note 2, “Acquisitions and Divestitures,” to the Consolidated Financial Statements in Item 8 of this report.
Critical Accounting Estimates
Our consolidated financial statements are prepared in conformity with generally accepted accounting principles (“GAAP”) in the U.S. and prevailing practices in the banking industry. Our accounting policies, as presented in Note 1, “Basis of Presentation and Accounting Policies,” to the Consolidated Financial Statements in Item 8 of this report are fundamental in understanding MD&A and the disclosures presented in Item 8, “Financial Statements and Supplementary Data,” of this report. Management may be required to make significant estimates and assumptions that have a material impact on our financial condition or operating performance. Due to the level of subjectivity and the susceptibility of such matters to change, actual results could differ significantly from management’s assumptions and estimates. Based on the valuation techniques used and the sensitivity of financial statement amounts to the methods, assumptions, and estimates used, we have identified fair value measurements,
27
Table of Contents
investment securities, the allowance for loan losses, the Federal Deposit Insurance Corporation (“FDIC”) indemnification asset, goodwill and other intangible assets, and income taxes as the accounting areas that require the most subjective or complex judgments or are the most susceptible to change.
Fair Value Measurements
We use the fair value hierarchy to determine the fair value of certain assets and liabilities. The hierarchy consists of three levels that include valuations based on observable quoted prices in active markets; quoted prices in inactive markets or other observable inputs, such as third-party sources; and unobservable inputs. When quoted prices or third-party information is not available, management estimates valuation adjustments primarily through the use of financial modeling techniques and appraisal estimates. The assumptions and estimates used to determine fair value may be highly subjective in nature, such as cash flow estimates, risk characteristics, credit quality measurements, and interest rates; therefore, valuations may not be precise. The amounts realized or paid on the settlement or maturity of fair value instruments may be significantly different from estimates. While management believes our valuation methodologies are appropriate and consistent with other market participants, different methodologies or assumptions used to determine the fair value of certain financial instruments could result in a different estimate of fair value at the reporting date. For additional information, see Note 17, “Fair Value,” to the Consolidated Financial Statements in Item 8 of this report.
Investment Securities
We review our investment portfolio quarterly for indications of other-than-temporary impairment (“OTTI”). We use inputs from independent third parties to determine the fair value of investment securities, which are reviewed and corroborated by management. Unrealized losses are evaluated to determine whether the impairment is temporary or other-than-temporary in nature. For debt securities, we consider our intent to sell the securities, the evidence available to determine if it is more likely than not that we will have to sell the securities before recovery of amortized cost, and the probable credit losses. Probable credit losses are evaluated using the present value of expected future cash flows; the severity and duration of the impairment; the issuer’s financial condition and near-term prospects to service the debt; the cause of the decline, such as adverse conditions related to the issuer, the industry, or economic environment; the payment structure of the debt; the issuer’s failure to make scheduled interest or principal payments; and any change in the issuer’s credit rating by rating agencies. If the present value of expected future cash flows discounted at the security’s effective yield is less than the net book value, the difference is recognized as a credit-related OTTI in noninterest income. If we do not intend to sell and if we are not likely to be required to sell the security, the OTTI is separated into an amount representing the credit loss, which is recognized as a charge to noninterest income, and the amount representing all other factors, which is recognized in other comprehensive income (“OCI”). For equity securities, we consider our intent and ability to hold the security to recovery; the severity and duration of the impairment; the issuer’s financial condition, capital strength, and near-term prospects; and any change in the issuer’s credit rating by rating agencies. If the fair value of the security is less than the net book value, the OTTI is recognized as a charge to noninterest income. For additional information, see Note 3, “Investment Securities,” to the Consolidated Financial Statements in Item 8 of this report.
Allowance for Loan Losses
We review our allowance for loan losses quarterly to determine if it is sufficient to absorb probable loan losses in the portfolio. This determination requires management to make significant estimates and assumptions. While management uses its best judgment and available information, the ultimate adequacy of the allowance is dependent upon a variety of factors beyond our control, including the performance of our loan portfolio, the economy, changes in interest rates, and the view of regulatory authorities towards loan classifications. These uncertainties may result in material changes to the allowance for loan losses in the near term; however, the amount of the change cannot reasonably be estimated.
Our allowance for loan losses consists of reserves assigned to specific loans and credit relationships and general reserves assigned to loans not separately identified that have been segmented into groups with similar risk
28
Table of Contents
characteristics using our internal risk grades. General reserve allocations are based on management’s judgments of qualitative and quantitative factors about macro and micro economic conditions reflected within the loan portfolio and the economy. Factors considered in this evaluation include, but are not limited to, probable losses from loan and other credit arrangements, general economic conditions, changes in credit concentrations or pledged collateral, historical loan loss experience, and trends in portfolio volume, maturities, composition, delinquencies, and nonaccruals. Historical loss rates for each risk grade of commercial loans are adjusted by environmental factors to estimate the amount of reserve needed by segment. Individually significant loans require additional analysis that may include the borrower’s underlying cash flow and capacity for debt repayment, specific business conditions, and value of secondary sources of repayment; consequently, this analysis may result in the identification of weakness and a corresponding need for a specific reserve. No allowance for loan losses is carried over or established at acquisition for purchased loans acquired in business combinations. A provision for loan losses is recorded for any credit deterioration in purchased performing loans after the acquisition date. Loans acquired in business combinations that are deemed impaired at acquisition, purchased credit impaired (“PCI”) loans, are grouped into pools and evaluated separately from the non-PCI portfolio. The estimated cash flows to be collected on PCI loans are discounted at a market rate of interest. Management believed the allowance was adequate to absorb probable loan losses inherent in the loan portfolio as of December 31, 2016. For additional information, see Note 6, “Allowance for Loan Losses,” to the Consolidated Financial Statements in Item 8 of this report.
Third-party collateral valuations are regularly obtained and evaluated to help management determine changes in cash flows on purchased loans acquired in business combinations, potential credit impairment, and the amount of impairment to record. Internal collateral valuations are generally performed within two to four weeks of identifying the initial potential impairment. The internal evaluation compares the original appraisal to current local real estate market conditions and considers experience and expected liquidation costs. When a third-party evaluation is received, it is reviewed for reasonableness. Once the evaluation is reviewed and accepted, discounts are applied to fair market value, based on, but not limited to, our historical liquidation experience for like collateral, resulting in an estimated net realizable value. The estimated net realizable value is compared to the outstanding loan balance to determine the appropriate amount of specific impairment reserve. Specific reserves are generally recorded for impaired loans while third-party evaluations are in process and for impaired loans that continue to make some form of payment. While waiting for receipt of the third-party appraisal, we regularly review the relationship to identify any potential adverse developments and begin the tasks necessary to gain control of the collateral and prepare it for liquidation, including, but not limited to, engagement of counsel, inspection of collateral, and continued communication with the borrower. Generally, the only difference between current appraised value, adjusted for liquidation costs, and the carrying amount of the loan, less the specific reserve, is any downward adjustment to appraised value that we determine appropriate, such as the costs to sell the property. Impaired loans that do not meet certain criteria and do not have a specific reserve have typically been written down through partial charge-offs to net realizable value. Based on prior experience, the Company rarely returns loans to performing status after they have been partially charged off. Impaired credits move quickly through the process towards ultimate resolution except in cases involving bankruptcy and various state judicial processes, which may extend the time for ultimate resolution.
FDIC Indemnification Asset
In 2012, we entered into a purchase and assumption agreement with loss share arrangements with the FDIC to purchase certain assets and assume substantially all customer deposits and certain liabilities of Waccamaw Bank (“Waccamaw”). Under the loss share agreements the FDIC agreed to cover 80% of covered assets, which consist of most loan (“covered loans”) and other real estate losses. Gains and recoveries on covered assets offset prior losses or are paid to the FDIC at the loss share percentage at the time of recovery. The loss share agreement for single family covered assets provides FDIC loss sharing and recovery reimbursement to the FDIC for ten years. The loss share agreement for commercial covered assets provides for FDIC loss sharing for five years and recovery reimbursement to the FDIC for eight years. Certain expenses related to covered assets are reimbursable from the FDIC through monthly and quarterly claims we submit. Estimated reimbursements from the FDIC are
29
Table of Contents
netted against covered expenses in the consolidated statements of income. We regularly review the fair value of the FDIC indemnification asset with input from a third-party provider. For additional information, see Note 7, “FDIC Indemnification Asset,” to the Consolidated Financial Statements in Item 8 of this report.
Goodwill and Other Intangible Assets
We test goodwill annually, or more frequently if necessary, using a qualitative assessment to determine if it is more likely than not that the fair value of a reporting unit is less than its carrying amount. We have one reporting unit for goodwill impairment testing purposes — Community Banking. Prior to October 2016, we maintained two reporting units — Community Banking and Insurance Services. The Insurance Services reporting unit consisted of the Company’s wholly owned subsidiary Greenpoint, which was sold in October 2016. We performed our annual qualitative assessment of goodwill as of October 31, 2016, and concluded that our carrying value of goodwill was not impaired. Qualitative factors considered in the analysis included macroeconomic conditions, industry and market considerations, overall financial performance, changes in stock price, and our progress towards stated objectives as compared to prior years. An impairment charge to goodwill and other intangible assets may be required in the future if the Company’s future earnings and cash flows decline or discount rates used in determining fair value increase. For additional information, see Note 9, “Goodwill and Other Intangible Assets,” to the Consolidated Financial Statements in Item 8 of this report.
Income Taxes
The establishment of provisions for federal and state income taxes is a complex area of accounting that involves judgments and estimates in applying relevant tax statutes. We operate in many state tax jurisdictions, which requires the appropriate allocation of income and expense to each state based on a variety of apportionment or allocation bases. Audits by federal and state tax authorities may reveal liabilities that differ from our estimates and provisions. We continually evaluate our exposure to possible tax assessments arising from audits and record an estimate of possible exposure based on current facts and circumstances. We measure deferred tax assets and liabilities using the enacted tax rates applicable in the periods we expect temporary differences to be realized or settled. As changes in tax laws and rates are enacted, we adjust deferred tax assets and liabilities through the provision for income taxes. When evidence indicates that it is more likely than not that some, or all, of the deferred tax asset is not recoverable, we may record a valuation allowance to reduce the carrying value of the asset. Increases or decreases in the valuation allowance result in increases or decreases to the provision for income taxes. The Company is currently open to audit under the statute of limitations by the Internal Revenue Service and various state tax departments for the years ended December 31, 2013 through 2015. For additional information, see Note 15, “Income Taxes,” to the Consolidated Financial Statements in Item 8 of this report.
Performance Overview
Highlights of our results of operations in 2016, and financial condition as of December 31, 2016, include the following:
| • | Diluted earnings per share increased $0.14, or 10.69%, to $1.45 compared to the prior year. |
| • | Our non-covered loan portfolio increased $172.45 million, or 10.62%, to $1.79 billion, compared to December 31, 2015. |
| • | Total nonperforming assets decreased $5.51 million compared to December 31, 2015, largely due to a decrease in covered OREO. |
| • | Our book value per common share increased $1.00 to $19.95 compared to December 31, 2015. |
| • | We repurchased 1,182,294 common shares. |
| • | We completed the divestiture of Greenpoint and branch exchange with First Bank. |
| • | The Company and the Bank both significantly exceed regulatory well capitalized targets as of December 31, 2016. |
30
Table of Contents
Results of Operations
Net Income
The following table presents the changes in net income and related information for the periods indicated:
| 2016 Compared to 2015 | 2015 Compared to 2014 | |||||||||||||||||||||||||||
| Year Ended December 31, | Increase (Decrease) |
% Change |
Increase (Decrease) |
% Change |
||||||||||||||||||||||||
| (Amounts in thousands, except per share data) | 2016 | 2015 | 2014 | |||||||||||||||||||||||||
| Net income |
$ | 25,126 | $ | 24,540 | $ | 25,490 | $ | 586 | 2.39 | % | $ | (950 | ) | -3.73 | % | |||||||||||||
| Net income available to common shareholders |
25,126 | 24,435 | 24,580 | 691 | 2.83 | % | (145 | ) | -0.59 | % | ||||||||||||||||||
| Basic earnings per common share |
1.45 | 1.32 | 1.34 | 0.13 | 9.85 | % | (0.02 | ) | -1.49 | % | ||||||||||||||||||
| Diluted earnings per common share |
1.45 | 1.31 | 1.31 | 0.14 | 10.69 | % | — | — | ||||||||||||||||||||
| Return on average assets |
1.02 | % | 0.97 | % | 0.94 | % | 0.05 | % | 5.57 | % | 0.03 | % | 2.87 | % | ||||||||||||||
| Return on average common equity |
7.42 | % | 7.08 | % | 7.51 | % | 0.34 | % | 4.80 | % | -0.42 | % | -5.64 | % | ||||||||||||||
2016 Compared to 2015. Net income increased in 2016 due to decreases in noninterest expense and in the provision for loan losses and an increase in net interest income. These changes were offset by a decrease in noninterest income and increase in income tax expense.
2015 Compared to 2014. Net income decreased in 2015 due to decreases in net interest income and noninterest income and an increase in the provision for loan losses. These changes were offset by decreases in noninterest expense and income taxes.
31
Table of Contents
Net Interest Income
Net interest income, our largest contributor to earnings, is analyzed on a fully taxable equivalent (“FTE”) basis, a non-GAAP financial measure. For additional information, see “Non-GAAP Financial Measures” below. The following table presents the consolidated average balance sheets and net interest analysis on a FTE basis for the dates indicated:
| Year Ended December 31, | ||||||||||||||||||||||||||||||||||||
| 2016 | 2015 | 2014 | ||||||||||||||||||||||||||||||||||
| (Amounts in thousands) | Average Balance |
Interest (1) | Average Yield/ Rate (1) |
Average Balance |
Interest (1) | Average Yield/ Rate (1) |
Average Balance |
Interest (1) | Average Yield/ Rate (1) |
|||||||||||||||||||||||||||
| Assets |
||||||||||||||||||||||||||||||||||||
| Earning assets |
||||||||||||||||||||||||||||||||||||
|
Loans (2) |
$ | 1,793,618 | $ | 87,848 | 4.90 | % | $ | 1,680,021 | $ | 87,768 | 5.22 | % | $ | 1,744,520 | $ | 95,707 | 5.49 | % | ||||||||||||||||||
| Securities available for sale |
287,332 | 8,047 | 2.80 | % | 363,359 | 9,575 | 2.64 | % | 410,136 | 12,400 | 3.02 | % | ||||||||||||||||||||||||
| Securities held to maturity |
71,069 | 757 | 1.07 | % | 70,987 | 770 | 1.08 | % | 20,843 | 267 | 1.28 | % | ||||||||||||||||||||||||
| Interest-bearing deposits |
18,864 | 153 | 0.81 | % | 98,639 | 267 | 0.27 | % | 98,090 | 291 | 0.30 | % | ||||||||||||||||||||||||
|
|
|
|
|
|
|
|
|
|
|
|
|
|||||||||||||||||||||||||
| Total earning assets |
2,170,883 | $ | 96,805 | 4.46 | % | 2,213,006 | $ | 98,380 | 4.44 | % | 2,273,589 | $ | 108,665 | 4.78 | % | |||||||||||||||||||||
| Other assets |
284,575 | 307,928 | 334,981 | |||||||||||||||||||||||||||||||||
|
|
|
|
|
|
|
|||||||||||||||||||||||||||||||
| Total assets |
$ | 2,455,458 | $ | 2,520,934 | $ | 2,608,570 | ||||||||||||||||||||||||||||||
|
|
|
|
|
|
|
|||||||||||||||||||||||||||||||
| Liabilities |
||||||||||||||||||||||||||||||||||||
| Interest-bearing deposits |
||||||||||||||||||||||||||||||||||||
| Demand deposits |
$ | 342,169 | $ | 250 | 0.07 | % | $ | 343,036 | $ | 203 | 0.06 | % | $ | 366,932 | $ | 206 | 0.06 | % | ||||||||||||||||||
| Savings deposits |
531,050 | 248 | 0.05 | % | 532,221 | 367 | 0.07 | % | 535,256 | 514 | 0.10 | % | ||||||||||||||||||||||||
| Time deposits |
525,162 | 3,981 | 0.76 | % | 631,654 | 5,308 | 0.84 | % | 704,518 | 6,588 | 0.94 | % | ||||||||||||||||||||||||
|
|
|
|
|
|
|
|
|
|
|
|
|
|||||||||||||||||||||||||
| Total interest-bearing deposits |
1,398,381 | 4,479 | 0.32 | % | 1,506,911 | 5,878 | 0.39 | % | 1,606,706 | 7,308 | 0.45 | % | ||||||||||||||||||||||||
| Borrowings |
||||||||||||||||||||||||||||||||||||
| Federal funds purchased |
4,058 | 26 | 0.64 | % | 535 | 2 | 0.37 | % | 892 | 3 | 0.34 | % | ||||||||||||||||||||||||
| Retail repurchase agreements |
68,701 | 49 | 0.07 | % | 71,262 | 68 | 0.10 | % | 72,917 | 97 | 0.13 | % | ||||||||||||||||||||||||
| Wholesale repurchase agreements |
49,727 | 1,874 | 3.77 | % | 50,000 | 1,878 | 3.76 | % | 50,000 | 1,878 | 3.76 | % | ||||||||||||||||||||||||
| FHLB advances and other borrowings |
116,602 | 3,416 | 2.93 | % | 89,400 | 3,523 | 3.94 | % | 147,504 | 6,004 | 4.07 | % | ||||||||||||||||||||||||
|
|
|
|
|
|
|
|
|
|
|
|
|
|||||||||||||||||||||||||
| Total borrowings |
239,088 | 5,365 | 2.24 | % | 211,197 | 5,471 | 2.59 | % | 271,313 | 7,982 | 2.94 | % | ||||||||||||||||||||||||
|
|
|
|
|
|
|
|
|
|
|
|
|
|||||||||||||||||||||||||
| Total interest-bearing liabilities |
1,637,469 | 9,844 | 0.60 | % | 1,718,108 | 11,349 | 0.66 | % | 1,878,019 | 15,290 | 0.81 | % | ||||||||||||||||||||||||
|
|
|
|
|
|
|
|||||||||||||||||||||||||||||||
| Noninterest-bearing demand deposits |
456,474 | 433,936 | 367,315 | |||||||||||||||||||||||||||||||||
| Other liabilities |
23,040 | 20,691 | 20,617 | |||||||||||||||||||||||||||||||||
|
|
|
|
|
|
|
|||||||||||||||||||||||||||||||
| Total liabilities |
2,116,983 | 2,172,735 | 2,265,951 | |||||||||||||||||||||||||||||||||
| Stockholders’ equity |
338,475 | 348,199 | 342,619 | |||||||||||||||||||||||||||||||||
|
|
|
|
|
|
|
|||||||||||||||||||||||||||||||
| Total liabilities and equity |
$ | 2,455,458 | $ | 2,520,934 | $ | 2,608,570 | ||||||||||||||||||||||||||||||
|
|
|
|
|
|
|
|||||||||||||||||||||||||||||||
| Net interest income, FTE |
$ | 86,961 | $ | 87,031 | $ | 93,375 | ||||||||||||||||||||||||||||||
|
|
|
|
|
|
|
|||||||||||||||||||||||||||||||
| Net interest rate spread, FTE |
3.86 | % | 3.78 | % | 3.97 | % | ||||||||||||||||||||||||||||||
|
|
|
|
|
|
|
|||||||||||||||||||||||||||||||
| Net interest margin, FTE |
4.01 | % | 3.93 | % | 4.11 | % | ||||||||||||||||||||||||||||||
|
|
|
|
|
|
|
|||||||||||||||||||||||||||||||
| (1) | Fully taxable equivalent (“FTE”) basis based on the federal statutory rate of 35% |
| (2) | Nonaccrual loans are included in average balances; however, no related interest income is recognized during the period of nonaccrual. |
32
Table of Contents
The following table presents the impact to net interest income on a FTE basis due to changes in volume (average volume times the prior year’s average rate), rate (average rate times the prior year’s average volume), and rate/volume (average volume times the change in average rate), for the periods indicated:
| Year Ended December 31, 2016 Compared to 2015 Dollar Increase (Decrease) due to |
Year Ended December 31, 2015 Compared to 2014 Dollar Increase (Decrease) due to |
|||||||||||||||||||||||||||||||
| (Amounts in thousands) | Volume | Rate | Rate/ Volume |
Total | Volume | Rate | Rate/ Volume |
Total | ||||||||||||||||||||||||
| Interest earned on (1): |
||||||||||||||||||||||||||||||||
|
Loans (2) |
$ | 5,930 | $ | (5,376 | ) | $ | (474 | ) | $ | 80 | $ | (3,541 | ) | $ | (4,710 | ) | $ | 312 | $ | (7,939 | ) | |||||||||||
| Securities available for sale |
(2,007 | ) | 581 | (102 | ) | (1,528 | ) | (1,413 | ) | (1,558 | ) | 146 | (2,825 | ) | ||||||||||||||||||
| Securities held to maturity |
1 | (7 | ) | (7 | ) | (13 | ) | 642 | (42 | ) | (97 | ) | 503 | |||||||||||||||||||
| Interest-bearing deposits with other banks |
(215 | ) | 533 | (432 | ) | (114 | ) | 2 | (30 | ) | 4 | (24 | ) | |||||||||||||||||||
|
|
|
|
|
|
|
|
|
|
|
|
|
|
|
|
|
|||||||||||||||||
| Total interest-earning assets |
3,709 | (4,269 | ) | (1,015 | ) | (1,575 | ) | (4,310 | ) | (6,340 | ) | 365 | (10,285 | ) | ||||||||||||||||||
| Interest paid on (1): |
||||||||||||||||||||||||||||||||
| Demand deposits |
(1 | ) | 34 | 14 | 47 | (14 | ) | — | 11 | (3 | ) | |||||||||||||||||||||
| Savings deposits |
(1 | ) | (106 | ) | (12 | ) | (119 | ) | (3 | ) | (161 | ) | 17 | (147 | ) | |||||||||||||||||
| Time deposits |
(895 | ) | (505 | ) | 73 | (1,327 | ) | (685 | ) | (705 | ) | 110 | (1,280 | ) | ||||||||||||||||||
| Federal funds purchased |
13 | 1 | 10 | 24 | (1 | ) | — | — | (1 | ) | ||||||||||||||||||||||
| Retail repurchase agreements |
(3 | ) | (21 | ) | 5 | (19 | ) | (2 | ) | (22 | ) | (5 | ) | (29 | ) | |||||||||||||||||
| Wholesale repurchase agreements |
(10 | ) | 5 | 1 | (4 | ) | — | — | — | — | ||||||||||||||||||||||
| FHLB advances and other |
||||||||||||||||||||||||||||||||
| Borrowings |
1,072 | (903 | ) | (276 | ) | (107 | ) | (2,365 | ) | (192 | ) | 76 | (2,481 | ) | ||||||||||||||||||
|
|
|
|
|
|
|
|
|
|
|
|
|
|
|
|
|
|||||||||||||||||
| Total interest-bearing liabilities |
175 | (1,495 | ) | (185 | ) | (1,505 | ) | (3,070 | ) | (1,080 | ) | 209 | (3,941 | ) | ||||||||||||||||||
|
|
|
|
|
|
|
|
|
|
|
|
|
|
|
|
|
|||||||||||||||||
| Change in net interest income, FTE |
$ | 3,534 | $ | (2,774 | ) | $ | (830 | ) | $ | (70 | ) | $ | (1,240 | ) | $ | (5,260 | ) | $ | 156 | $ | (6,344 | ) | ||||||||||
|
|
|
|
|
|
|
|
|
|
|
|
|
|
|
|
|
|||||||||||||||||
| (1) | FTE basis based on the federal statutory rate of 35% |
| (2) | Nonaccrual loans are included in average balances; however, no related interest income is recognized during the period of nonaccrual. |
33
Table of Contents
The following table presents the net interest analysis on a FTE basis excluding the impact of non-cash purchase accounting accretion from acquired loan portfolios for the periods indicated:
| Year Ended December 31, | ||||||||||||||||||||||||
| 2016 | 2015 | 2014 | ||||||||||||||||||||||
| (Amounts in thousands) | Interest (1) | Average Yield/ Rate (1) |
Interest (1) | Average Yield/ Rate (1) |
Interest (1) | Average Yield/ Rate (1) |
||||||||||||||||||
| Earning assets |
||||||||||||||||||||||||
|
Loans (2) |
$ | 87,848 | 4.90 | % | $ | 87,768 | 5.22 | % | $ | 95,707 | 5.49 | % | ||||||||||||
| Accretion income |
7,690 | 11,258 | 11,469 | |||||||||||||||||||||
| Less: cash accretion income |
2,924 | 4,149 | 4,412 | |||||||||||||||||||||
|
|
|
|
|
|
|
|||||||||||||||||||
| Non-cash accretion income |
4,766 | 7,109 | 7,057 | |||||||||||||||||||||
| Non-recurring discount accretion (3) |
— | — | 2,588 | |||||||||||||||||||||
|
|
|
|
|
|
|
|||||||||||||||||||
| Loans, normalized (4) |
83,082 | 4.63 | % | 80,659 | 4.80 | % | 86,062 | 4.93 | % | |||||||||||||||
| Other earning assets |
8,957 | 2.37 | % | 10,612 | 1.99 | % | 12,958 | 2.45 | % | |||||||||||||||
|
|
|
|
|
|
|
|||||||||||||||||||
| Total earning assets |
92,039 | 4.24 | % | 91,271 | 4.12 | % | 99,020 | 4.36 | % | |||||||||||||||
| Total interest-bearing liabilities |
9,844 | 0.60 | % | 11,349 | 0.66 | % | 15,290 | 0.81 | % | |||||||||||||||
|
|
|
|
|
|
|
|||||||||||||||||||
| Net interest income, normalized (4) |
$ | 82,195 | $ | 79,922 | $ | 83,730 | ||||||||||||||||||
|
|
|
|
|
|
|
|||||||||||||||||||
| Net interest rate spread, normalized (4) |
3.64 | % | 3.46 | % | 3.55 | % | ||||||||||||||||||
|
|
|
|
|
|
|
|||||||||||||||||||
| Net interest margin, normalized (4) |
3.79 | % | 3.61 | % | 3.68 | % | ||||||||||||||||||
|
|
|
|
|
|
|
|||||||||||||||||||
| (1) | FTE basis based on the federal statutory rate of 35% |
| (2) | Nonaccrual loans are included in average balances; however, no related interest income is recorded during the period of nonaccrual. |
| (3) | Non-recurring discount accretion was enhanced in 2014 as a result of a positive resolution on a sizable credit. |
| (4) | Normalized totals are non-GAAP financial measures that exclude non-cash loan interest accretion related to PCI loans. |
2016 Compared to 2015. Net interest income comprised 75.82% of total net interest and noninterest income in 2016 compared to 74.16% in 2015. Net interest income on a GAAP basis increased $127 thousand, or 0.15%, and net interest income on a FTE basis decreased $70 thousand, or 0.08%. Normalized net interest income on a FTE basis is a non-GAAP measure that excludes non-cash loan accretion income related to PCI loans. For additional information, see “Non-GAAP Financial Measures” below. Normalized net interest margin increased 18 basis points compared to an increase of 8 basis points on a GAAP basis. The normalized and GAAP-basis net interest spread increased 18 basis points.
Average earning assets decreased $42.12 million, or 1.90%, primarily due to decreases in securities available for sale and interest-bearing deposits offset by loan growth. The normalized yield on earning assets increased 12 basis points compared to an increase of 2 basis points on a GAAP basis. Average loans increased $113.60 million, or 6.76%, and the average loan to deposit ratio increased to 96.70% from 86.56%. The normalized yield on loans decreased 17 basis points compared to a decrease of 32 basis points on a GAAP basis. Non-cash accretion income decreased $2.34 million, or 32.96%, as the effect of accretion income continued to decline from acquired portfolio attrition.
Average interest-bearing liabilities, which consist of interest-bearing deposits and borrowings, decreased $80.64 million, or 4.69%, primarily due to a decline in average interest-bearing time deposit balances. The yield on interest-bearing liabilities decreased 6 basis points, which was comprised of a 7 basis point decrease in the rate on interest-bearing deposits and a 1 basis point increase in the rate on borrowings. Average interest-bearing
34
Table of Contents
deposits decreased $108.53 million, or 7.20%, which was driven by a $106.49 million, or 16.86%, decrease in average time deposits, a $1.17 million, or 0.22%, decrease in savings deposits, which include money market and savings accounts, and an $867 thousand, or 0.25%, decrease in interest-bearing demand deposits. Average borrowings increased $27.89 million, or 13.21%, largely due to a $27.20 million, or 30.43%, increase in average FHLB advances and other borrowings.
2015 Compared to 2014. Net interest income comprised 74.16% of total net interest and noninterest income in 2015 compared to 75.17% in 2014. Net interest on a GAAP basis decreased $6.07 million, or 6.68%, and net interest income on a FTE basis decreased $6.34 million, or 6.79%. Normalized net interest margin decreased 7 basis points compared to a decrease of 18 basis points on a GAAP basis. The normalized net interest spread decreased 9 basis points compared to a decrease of 19 basis points on a GAAP basis.
Average earning assets decreased $60.58 million, or 2.66%, primarily due to a decrease in the loan portfolio and securities available for sale offset by an increase in securities held to maturity. During 2015, we purchased short-term bonds in the held-to-maturity category to provide the funding necessary to extinguish certain wholesale borrowings as they come due. The normalized yield on earning assets decreased 24 basis points compared to a decrease of 34 basis points on a GAAP basis. Average loans decreased $64.50 million, or 3.70%, and the average loan to deposit ratio decreased to 86.56% from 88.37%. The normalized yield on loans decreased 13 basis points compared to a decrease of 27 basis points on a GAAP basis. Non-cash accretion income increased $52 thousand, or 0.74%, due to continued strong credit performance in the acquired portfolio. Accretion income was enhanced in 2014 by non-recurring discount accretion of $2.59 million related to the positive resolution of a sizable credit.
Average interest-bearing liabilities decreased $159.91 million, or 8.51%, primarily due to the decline in average time deposits and FHLB borrowings. During 2015, we prepaid an additional $25 million of a $50 million FHLB convertible advance with a May 2017 maturity and 4.15% interest rate. The yield on interest-bearing liabilities decreased 15 basis points, which was comprised of a 6 basis point decrease in the rate on interest-bearing deposits and a 35 basis point decrease in the rate on borrowings. Average interest-bearing deposits decreased $99.80 million, or 6.21%, which was driven by a $72.86 million, or 10.34%, decrease in average time deposits, a $23.90 million, or 6.51%, decrease in average interest-bearing demand deposits, and a $3.04 million, or 0.57%, decrease in average savings deposits, which include money market and savings accounts. Average borrowings decreased $60.12 million, or 22.16%, largely due to a $58.10 million, or 39.39%, decrease in FHLB and other borrowings.
Provision for Loan Losses
2016 Compared to 2015. The provision charged to operations decreased $936 thousand to $1.26 million, which included an $870 thousand decrease in the non-PCI provision and a $66 thousand decrease in the PCI provision resulting in a PCI recovery of $25 thousand. The provision charged to operations included a $29 thousand benefit attributed to the FDIC indemnification asset to reflect the indemnified portion of the post-acquisition exposure. The reduction in the non-PCI provision was partially due to the reversal of loan loss reserves totaling $1.35 million attributed to loans divested in the First Bank transaction.
2015 Compared to 2014. The provision charged to operations increased $2.05 million which included a $1.75 million increase in the non-PCI provision and a $300 thousand increase in the PCI provision. The increase in the non-PCI provision was due to an $889 thousand increase in specific reserves on loans identified as impaired and the absence of a significant non-recurring recovery related to the positive resolution of a sizable problem credit in 2014. The provision charged to operations included a $29 thousand benefit attributed to the FDIC indemnification.
35
Table of Contents
Noninterest Income
The following table presents the components of, and changes in, noninterest income for the periods indicated:
| 2016 Compared to 2015 | 2015 Compared to 2014 | |||||||||||||||||||||||||||
| Year Ended December 31, | Increase (Decrease) |
% Change | Increase (Decrease) |
% Change | ||||||||||||||||||||||||
| (Amounts in thousands) | 2016 | 2015 | 2014 | |||||||||||||||||||||||||
| Wealth management |
$ | 2,828 | $ | 2,975 | $ | 3,030 | $ | (147 | ) | -4.94 | % | $ | (55 | ) | -1.82 | % | ||||||||||||
| Service charges on deposits |
13,588 | 13,717 | 13,828 | (129 | ) | -0.94 | % | (111 | ) | -0.80 | % | |||||||||||||||||
| Other service charges and fees |
8,102 | 8,045 | 7,581 | 57 | 0.71 | % | 464 | 6.12 | % | |||||||||||||||||||
| Insurance commissions |
5,442 | 6,899 | 6,555 | (1,457 | ) | -21.12 | % | 344 | 5.25 | % | ||||||||||||||||||
| Net impairment loss |
(4,646 | ) | — | (737 | ) | (4,646 | ) | — | 737 | -100.00 | % | |||||||||||||||||
| Net gain (loss) on sale of securities |
335 | 144 | (1,385 | ) | 191 | 132.64 | % | 1,529 | -110.40 | % | ||||||||||||||||||
| Net FDIC indemnification asset amortization |
(5,474 | ) | (6,379 | ) | (3,979 | ) | 905 | -14.19 | % | (2,400 | ) | 60.32 | % | |||||||||||||||
| Net gain on divestitures |
3,682 | — | 755 | 3,682 | — | (755 | ) | -100.00 | % | |||||||||||||||||||
| Other operating income |
3,209 | 4,129 | 4,355 | (920 | ) | -22.28 | % | (226 | ) | -5.19 | % | |||||||||||||||||
|
|
|
|
|
|
|
|
|
|
|
|||||||||||||||||||
| Total noninterest income |
$ | 27,066 | $ | 29,530 | $ | 30,003 | $ | (2,464 | ) | -8.34 | % | $ | (473 | ) | -1.58 | % | ||||||||||||
|
|
|
|
|
|
|
|
|
|
|
|||||||||||||||||||
2016 Compared to 2015. Noninterest income comprised 24.18% of total net interest and noninterest income in 2016 compared to 25.84% in 2015. Noninterest income decreased $2.46 million, or 8.34%, in 2016 primarily due to net impairment losses offset by a net gain on divestitures and a decrease in insurance commissions. We realized net impairment losses of $4.64 million on certain debt securities and $11 thousand on certain equity securities. We realized a net gain of $3.68 million on the divestiture of Greenpoint and six bank branches. Insurance commissions decreased largely due to the Greenpoint divestiture. Other operating income decreased primarily due to the absence of a $1.14 million net death benefit from the maturity of a life insurance policy recognized in 2015 offset by a $381 thousand gain on the sale of closed branches and $474 thousand in legal settlements. Net negative amortization related to the FDIC indemnification asset decreased as the expiration of the loss share agreement for commercial loans approaches. We recognized a net gain of $335 thousand on the sale of securities related primarily to certain Agency mortgage-backed securities. Excluding the impact from impairment losses, sales of securities and branches, net FDIC indemnification asset amortization, the net gain on divestitures, and net death benefits, noninterest income decreased $1.82 million, or 5.25%, to $32.81 million in 2016 from $34.62 million in 2015.
2015 Compared to 2014. Noninterest income comprised 25.84% of total net interest and noninterest income in 2015 compared to 24.83% in 2014. Noninterest income decreased $473 thousand, or 1.58%, in 2015, which was largely due to the FDIC indemnification asset and sale of securities. Net negative amortization related to the FDIC indemnification asset increased as a result of improved loss estimates and payoffs in the covered Waccamaw loan portfolio. We realized a net gain of $144 thousand on the sale of securities compared to a net loss of $1.39 million in 2014, which was driven by the sale of our only remaining non-Agency mortgage-backed security at a loss of $1.62 million. Service charges on deposits and other service charges and fees increased primarily from increases in debit and credit card income offset by decreases in service charges on demand deposit accounts and nonsufficient fee income. Insurance commissions increased largely due to an increase in property and casualty premium commissions and contingency profit-sharing revenue income. Other operating income decreased primarily due to the absence of a $536 thousand benefit from a life insurance policy recognized in 2014, a $280 thousand decrease in recovery settlements, a $258 thousand decrease in bank owned life insurance income, and a $219 thousand decrease in loss share recovery income. These decreases were offset by a $1.14 million net death benefit from the maturity of a life insurance policy. The decrease in wealth management revenues was due to a decline in income from the Trust Division. Excluding the impact from impairment losses, the sale of securities, net FDIC indemnification asset amortization, the net gain on divestitures, and net death benefits, noninterest income decreased $191 thousand, or 0.55%, to $34.62 million in 2015 from $34.81 million in 2014.
36
Table of Contents
Noninterest Expense
The following table presents the components of, and changes in, noninterest expense for the periods indicated:
| 2016 Compared to 2015 | 2015 Compared to 2014 | |||||||||||||||||||||||||||
| Year Ended December 31, | Increase (Decrease) |
Increase (Decrease) |
||||||||||||||||||||||||||
| (Amounts in thousands) | 2016 | 2015 | 2014 | % Change | % Change | |||||||||||||||||||||||
| Salaries and employee benefits |
$ | 39,912 | $ | 39,625 | $ | 40,713 | $ | 287 | 0.72 | % | $ | (1,088 | ) | -2.67 | % | |||||||||||||
| Occupancy expense |
5,297 | 5,817 | 6,338 | (520 | ) | -8.94 | % | (521 | ) | -8.22 | % | |||||||||||||||||
| Furniture and equipment expense |
4,341 | 5,199 | 4,952 | (858 | ) | -16.50 | % | 247 | 4.99 | % | ||||||||||||||||||
| Amortization of intangibles |
1,136 | 1,118 | 787 | 18 | 1.61 | % | 331 | 42.06 | % | |||||||||||||||||||
| FDIC premiums and assessments |
1,383 | 1,513 | 1,672 | (130 | ) | -8.59 | % | (159 | ) | -9.51 | % | |||||||||||||||||
| FHLB debt prepayment fees |
— | 1,702 | 5,008 | (1,702 | ) | -100.00 | % | (3,306 | ) | -66.01 | % | |||||||||||||||||
| Merger, acquisition, and |
730 | 86 | 1,150 | 644 | 748.84 | % | (1,064 | ) | -92.52 | % | ||||||||||||||||||
| Other operating expense |
19,947 | 21,111 | 22,242 | (1,164 | ) | -5.51 | % | (1,131 | ) | -5.08 | % | |||||||||||||||||
|
|
|
|
|
|
|
|
|
|
|
|||||||||||||||||||
| Total noninterest expense |
$ | 72,746 | $ | 76,171 | $ | 82,862 | $ | (3,425 | ) | -4.50 | % | $ | (6,691 | ) | -8.07 | % | ||||||||||||
|
|
|
|
|
|
|
|
|
|
|
|||||||||||||||||||
2016 Compared to 2015. Noninterest expense decreased $3.43 million, or 4.50%, in 2016, which was largely due to the absence of FHLB prepayment penalties and a decrease in operating expenses. Occupancy, furniture, and equipment expense decreased $1.38 million, or 12.51%, due to branch closures and divestitures. The decrease in other operating expense was primarily due to a $1.02 million decrease in the net loss on sales and expenses related to other real estate owned (“OREO”) to $1.42 million from $2.44 million in 2015. The decrease was offset by a $535 thousand increase in consulting fees and a $425 thousand increase in legal fees. We incurred expenses totaling $730 thousand related to the First Bank branch exchange and divestiture of Greenpoint. Full-time equivalent employees, calculated using the number of hours worked, decreased to 580 as of December 31, 2016, from 673 as of December 31, 2015, primarily due to personnel restructuring as a result of the First Bank and Greenpoint transactions.
2015 Compared to 2014. Noninterest expense decreased $6.69 million, or 8.07%, in 2015, which was largely due to decreases in debt prepayment fees, other operating expense, salaries and employee benefits, and acquisition and divestiture activities. During 2015, we prepaid $25 million of a FHLB convertible advance with a May 2017 maturity and 4.15% interest rate, which resulted in a prepayment penalty of $1.70 million. The decrease in other operating expense was largely due to a $1.00 million decrease in legal expenses offset by a $510 thousand increase in other losses. Other operating expense also included a $345 thousand increase in the net loss on sales and expenses related to OREO to $2.44 million in 2015 from $2.09 million in 2014. Salaries and employee benefits decreased as full-time equivalent employees decreased to 673 as of December 31, 2015, from 678 as of December 31, 2014. We incurred expenses totaling $86 thousand related to branch acquisition and divestiture activity that occurred in the fourth quarter of 2014. Occupancy, furniture, and equipment expense decreased $274 thousand, or 2.43%, which was primarily due to branch closures.
Income Tax Expense
2016 Compared to 2015. Income tax expense increased $1.44 million, or 12.64%, and the effective tax rate increased 210 basis points to 33.78%. The increase in the effective tax rate was largely due to an increase in taxable revenues as a percent of operating earnings and non-deductible goodwill related to the Greenpoint divestiture.
2015 Compared to 2014. Income tax expense decreased $943 thousand, or 7.65%, and the effective tax rate decreased 91 basis points to 31.68%. The decrease in the effective tax rate was largely due to a decrease in taxable revenues as a percentage of net earnings and an increase in the relative amounts of nontaxable revenues. For additional information, see “Income Taxes” in the “Critical Accounting Estimates” section above and Note 15, “Income Taxes,” to the Consolidated Financial Statements in Item 8 of this report.
37
Table of Contents
Non-GAAP Financial Measures
In addition to financial statements prepared in accordance with GAAP, we use certain non-GAAP financial measures that management believes provide investors with important information useful in understanding our operational performance and comparing our financial measures with other financial institutions. The non-GAAP financial measures presented in this report include net interest income on a FTE basis, normalized net interest income on a FTE basis, and the efficiency ratio. While we believe these non-GAAP financial measures enhance understanding of our business and performance, they are supplemental and not a substitute for, or more important than, financial measures prepared on a GAAP basis. Our non-GAAP financial measures may not be comparable to those reported by other financial institutions. The reconciliations of these measures to GAAP measures are presented below.
We believe FTE basis is the preferred industry measurement of net interest income and provides better comparability between taxable and tax exempt amounts. We use this non-GAAP financial measure to monitor net interest income performance and to manage the composition of our balance sheet. The FTE basis adjusts for the tax benefits of income from certain tax exempt loans and investments using the federal statutory rate of 35%. Normalized net interest income on a FTE basis is a non-GAAP measure that excludes non-cash loan accretion income related to PCI loans. The following table reconciles net interest income and margin, as presented in our consolidated statements of income, to net interest income on a FTE basis for the periods indicated:
| Year Ended December 31, | ||||||||||||
| (Amounts in thousands) | 2016 | 2015 | 2014 | |||||||||
| Net interest income, GAAP |
$ | 84,880 | $ | 84,753 | $ | 90,818 | ||||||
| FTE adjustment (1) |
2,081 | 2,278 | 2,557 | |||||||||
|
|
|
|
|
|
|
|||||||
| Net interest income, FTE |
86,961 | 87,031 | 93,375 | |||||||||
| Less: non-cash accretion income (2) |
4,766 | 7,109 | 7,057 | |||||||||
| Less: non-recurring discount accretion (3) |
— | — | 2,588 | |||||||||
|
|
|
|
|
|
|
|||||||
| Net interest income, normalized |
$ | 82,195 | $ | 79,922 | $ | 83,730 | ||||||
|
|
|
|
|
|
|
|||||||
| Net interest margin, GAAP |
3.91 | % | 3.83 | % | 3.99 | % | ||||||
| FTE adjustment (1) |
0.10 | % | 0.10 | % | 0.12 | % | ||||||
|
|
|
|
|
|
|
|||||||
| Net interest margin, FTE |
4.01 | % | 3.93 | % | 4.11 | % | ||||||
| Less: non-cash accretion income (2) |
0.22 | % | 0.32 | % | 0.31 | % | ||||||
| Less: non-recurring discount accretion (3) |
0.00 | % | 0.00 | % | 0.12 | % | ||||||
|
|
|
|
|
|
|
|||||||
| Net interest margin, normalized |
3.79 | % | 3.61 | % | 3.68 | % | ||||||
|
|
|
|
|
|
|
|||||||
| (1) | FTE basis based on the federal statutory rate of 35% |
| (2) | Includes non-cash purchase accounting accretion income from acquired loan portfolios |
| (3) | Non-recurring discount accretion was enhanced in 2014 as a result of a positive resolution on a sizable credit. |
We believe the efficiency ratio provides investors with important information about our operating expense control and efficiency of operations. Management also believes this non-GAAP measure focuses attention on our core operating performance over time and is highly useful in comparing period-to-period operating performance of core business operations.
38
Table of Contents
The following table reconciles the GAAP-based efficiency ratio to the non-GAAP efficiency ratio for the periods indicated:
| Year Ended December 31, | ||||||||||||
| (Amounts in thousands) | 2016 | 2015 | 2014 | |||||||||
| GAAP efficiency ratio |
||||||||||||
| Noninterest expense |
$ | 72,746 | $ | 76,171 | $ | 82,862 | ||||||
| Net interest income |
84,880 | 84,753 | 90,818 | |||||||||
| Noninterest income |
27,066 | 29,530 | 30,003 | |||||||||
|
|
|
|
|
|
|
|||||||
| Net interest income plus noninterest income |
111,946 | 114,283 | 120,821 | |||||||||
| GAAP efficiency ratio |
64.98 | % | 66.65 | % | 68.58 | % | ||||||
| Non-GAAP efficiency ratio |
||||||||||||
| Noninterest expense, GAAP |
$ | 72,746 | $ | 76,171 | $ | 82,862 | ||||||
| Non-GAAP adjustments |
||||||||||||
| Merger, acquisition, and divestiture expense |
(730 | ) | (86 | ) | (1,150 | ) | ||||||
| FHLB debt prepayment fees |
— | (1,702 | ) | (5,008 | ) | |||||||
| OREO expense and net loss |
(1,420 | ) | (2,438 | ) | (2,094 | ) | ||||||
| Other non-core items |
(364 | ) | (259 | ) | (1,573 | ) | ||||||
|
|
|
|
|
|
|
|||||||
| Total non-GAAP adjustments |
(2,514 | ) | (4,485 | ) | (9,825 | ) | ||||||
|
|
|
|
|
|
|
|||||||
| Adjusted noninterest expense |
70,232 | 71,686 | 73,037 | |||||||||
| Net interest income plus noninterest income, GAAP |
111,946 | 114,283 | 120,821 | |||||||||
| Non-GAAP adjustments |
||||||||||||
| Tax equivalency adjustment |
2,081 | 2,950 | 2,557 | |||||||||
| Net impairment losses |
4,646 | — | 737 | |||||||||
| Net (gain) loss on sale of securities |
(335 | ) | (144 | ) | 1,385 | |||||||
| Net gain on divestitures |
(3,682 | ) | — | (755 | ) | |||||||
| Other non-core items |
(918 | ) | (1,263 | ) | (936 | ) | ||||||
|
|
|
|
|
|
|
|||||||
| Total non-GAAP adjustments |
1,792 | 1,543 | 2,988 | |||||||||
|
|
|
|
|
|
|
|||||||
| Adjusted net interest income plus noninterest income |
113,738 | 115,826 | 123,809 | |||||||||
| Non-GAAP efficiency ratio (1) |
61.75 | % | 61.89 | % | 58.99 | % | ||||||
| (1) | A non-GAAP financial measure computed by dividing adjusted noninterest expense by the sum of tax equivalent net interest income and adjusted noninterest income |
Financial Condition
Total assets as of December 31, 2016, decreased $75.88 million, or 3.08%, to $2.39 billion from $2.46 billion as of December 31, 2015. Total liabilities as of December 31, 2016, decreased $71.92 million, or 3.39%, to $2.05 billion from $2.12 billion as of December 31, 2015.
Investment Securities
Our investment securities are used to generate interest income through the employment of excess funds, to provide liquidity, to fund loan demand or deposit liquidation, and to pledge as collateral where required. The composition of our investment portfolio changes from time to time as we consider our liquidity needs, interest rate expectations, asset/liability management strategies, and capital requirements.
Available-for-sale securities as of December 31, 2016, decreased $200.59 million, or 54.78%, compared to December 31, 2015, primarily due to the maturity of corporate securities and sale of certain Agency mortgage-backed and single-issue trust preferred securities. Held-to-maturity securities as of December 31, 2016, decreased $25.41 million, or 35.03%, compared to December 31, 2015, due to the maturity of low-yield, short-term U.S. Agency securities.
39
Table of Contents
The following table presents the amortized cost and fair value of investment securities as of the dates indicated:
| December 31, | ||||||||||||||||||||||||
| 2016 | 2015 | 2014 | ||||||||||||||||||||||
| (Amounts in thousands) | Amortized Cost |
Fair Value | Amortized Cost |
Fair Value | Amortized Cost |
Fair Value | ||||||||||||||||||
| Available for Sale |
||||||||||||||||||||||||
| U.S. Agency securities |
$ | 1,342 | $ | 1,345 | $ | 31,414 | $ | 30,702 | $ | 34,604 | $ | 33,598 | ||||||||||||
| Municipal securities |
111,659 | 113,331 | 124,880 | 128,678 | 134,784 | 138,915 | ||||||||||||||||||
| Single issue trust preferred securities |
22,104 | 19,939 | 55,882 | 47,832 | 55,822 | 46,137 | ||||||||||||||||||
| Corporate securities |
— | — | 70,571 | 70,333 | 5,000 | 5,109 | ||||||||||||||||||
| Certificates of deposit |
— | — | 5,000 | 5,000 | — | — | ||||||||||||||||||
| Mortgage-backed Agency securities |
31,290 | 30,891 | 84,576 | 83,556 | 102,506 | 102,119 | ||||||||||||||||||
| Equity securities |
55 | 73 | 66 | 72 | 226 | 239 | ||||||||||||||||||
|
|
|
|
|
|
|
|
|
|
|
|
|
|||||||||||||
| Total securities available for sale |
$ | 166,450 | $ | 165,579 | $ | 372,389 | $ | 366,173 | $ | 332,942 | $ | 326,117 | ||||||||||||
|
|
|
|
|
|
|
|
|
|
|
|
|
|||||||||||||
| Fair value to amortized cost |
99.48 | % | 98.33 | % | 97.95 | % | ||||||||||||||||||
| Held to Maturity |
||||||||||||||||||||||||
| U.S. Agency securities |
$ | 36,741 | $ | 36,865 | $ | 61,863 | $ | 61,832 | $ | 46,987 | $ | 46,955 | ||||||||||||
| Municipal securities |
— | — | 190 | 193 | 379 | 386 | ||||||||||||||||||
| Corporate securities |
10,392 | 10,401 | 10,488 | 10,465 | 10,582 | 10,548 | ||||||||||||||||||
|
|
|
|
|
|
|
|
|
|
|
|
|
|||||||||||||
| Total securities held to maturity |
$ | 47,133 | $ | 47,266 | $ | 72,541 | $ | 72,490 | $ | 57,948 | $ | 57,889 | ||||||||||||
|
|
|
|
|
|
|
|
|
|
|
|
|
|||||||||||||
| Fair value to amortized cost |
100.28 | % | 99.93 | % | 99.90 | % | ||||||||||||||||||
The following table provides information about our investment portfolio as of the dates indicated:
| December 31, | ||||||||||||||||||||||||
| 2016 | 2015 | |||||||||||||||||||||||
| (Amounts in years) | Available for Sale |
Held to Maturity |
Total | Available for Sale |
Held to Maturity |
Total | ||||||||||||||||||
| Average life |
7.75 | 1.30 | 6.32 | 6.47 | 1.83 | 5.71 | ||||||||||||||||||
| Average duration |
6.66 | 1.26 | 5.47 | 5.71 | 1.78 | 5.07 | ||||||||||||||||||
There were no holdings of any one issuer, other than the U.S. government and its agencies, in an amount greater than 10% of our total consolidated shareholders’ equity as of December 31, 2016 or 2015.
40
Table of Contents
The following tables present the amortized cost, fair value, and weighted-average yield of available-for-sale and held-to-maturity securities, by contractual maturity, as of December 31, 2016. Actual maturities could differ from contractual maturities because issuers may have the right to call or prepay obligations with or without penalties.
| Available-for-Sale Securities | ||||||||||||||||||||
| (Amounts in thousands) | U.S. Agency Securities |
Municipal Securities |
Corporate Notes |
Total | Tax
Equivalent Purchase Yield (1) |
|||||||||||||||
| Amortized cost maturity: |
||||||||||||||||||||
| One year or less |
$ | — | $ | 1,135 | $ | — | $ | 1,135 | 6.47 | % | ||||||||||
| After one year through five years |
1 | 1,035 | — | 1,036 | 5.30 | % | ||||||||||||||
| After five years through ten years |
— | 88,449 | — | 88,449 | 4.70 | % | ||||||||||||||
| After ten years |
1,341 | 21,040 | 22,104 | 44,485 | 2.62 | % | ||||||||||||||
|
|
|
|
|
|
|
|
|
|||||||||||||
| Amortized cost |
$ | 1,342 | $ | 111,659 | $ | 22,104 | 135,105 | |||||||||||||
|
|
|
|
|
|
|
|||||||||||||||
| Mortgage-backed securities |
31,290 | 2.04 | % | |||||||||||||||||
| Equity securities |
55 | 4.83 | % | |||||||||||||||||
|
|
|
|||||||||||||||||||
| Total amortized cost |
$ | 166,450 | ||||||||||||||||||
|
|
|
|||||||||||||||||||
| Tax equivalent purchase yield (1) |
2.36 | % | 4.52 | % | 1.69 | % | 4.03 | % | ||||||||||||
| Average contractual maturity (in years) |
10.04 | 8.37 | 11.78 | 8.94 | ||||||||||||||||
| Fair value maturity: |
||||||||||||||||||||
| One year or less |
$ | — | $ | 1,141 | $ | — | $ | 1,141 | ||||||||||||
| After one year through five years |
1 | 1,059 | — | 1,060 | ||||||||||||||||
| After five years through ten years |
— | 90,360 | — | 90,360 | ||||||||||||||||
| After ten years |
1,344 | 20,771 | 19,939 | 42,054 | ||||||||||||||||
|
|
|
|
|
|
|
|
|
|||||||||||||
| Fair value |
$ | 1,345 | $ | 113,331 | $ | 19,939 | 134,615 | |||||||||||||
|
|
|
|
|
|
|
|||||||||||||||
| Mortgage-backed securities |
30,891 | |||||||||||||||||||
| Equity securities |
73 | |||||||||||||||||||
|
|
|
|||||||||||||||||||
| Total fair value |
$ | 165,579 | ||||||||||||||||||
|
|
|
|||||||||||||||||||
| (1) | FTE basis based on the federal statutory rate of 35% |
| Held-to-Maturity Securities | ||||||||||||||||
| (Amounts in thousands) | U.S. Agency Securities |
Corporate Notes |
Total | Tax
Equivalent Purchase Yield (1) |
||||||||||||
| Amortized cost maturity: |
||||||||||||||||
| One year or less |
$ | 18,756 | $ | 3,095 | $ | 21,851 | 0.85 | % | ||||||||
| After one year through five years |
17,985 | 7,297 | 25,282 | 1.67 | % | |||||||||||
| After five years through ten years |
— | — | — | — | ||||||||||||
| After ten years |
— | — | — | — | ||||||||||||
|
|
|
|
|
|
|
|||||||||||
| Total amortized cost |
$ | 36,741 | $ | 10,392 | $ | 47,133 | ||||||||||
|
|
|
|
|
|
|
|||||||||||
| Tax equivalent purchase yield (1) |
1.18 | % | 1.64 | % | 1.29 | % | ||||||||||
| Average contractual maturity (in years) |
1.22 | 1.55 | 1.29 | |||||||||||||
| Fair value maturity: |
||||||||||||||||
| One year or less |
$ | 18,768 | $ | 3,096 | $ | 21,864 | ||||||||||
| After one year through five years |
18,097 | 7,305 | 25,402 | |||||||||||||
| After five years through ten years |
— | — | — | |||||||||||||
| After ten years |
— | — | — | |||||||||||||
|
|
|
|
|
|
|
|||||||||||
| Total fair value |
$ | 36,865 | $ | 10,401 | $ | 47,266 | ||||||||||
|
|
|
|
|
|
|
|||||||||||
| (1) | FTE basis based on the federal statutory rate of 35% |
41
Table of Contents
We recognized OTTI charges in earnings associated with debt securities of $4.64 million in 2016 and $705 thousand in 2014. The OTTI charge in 2016 was due to our change in intent to hold certain trust preferred securities in our portfolio to recovery. These specific securities were sold to reduce credit concentrations with two issuers, which increased cash reserves and reduced exposure to the financial industry. The OTTI charged in 2014 was related to a non-Agency mortgage-backed security that was subsequently sold in November 2014. We recognized OTTI charges in earnings associated with certain equity securities of $11 thousand in 2016 and $32 thousand in 2014. No OTTI charges were recognized in 2015. For additional information, see “Investment Securities” in the “Critical Accounting Estimates” section above and Note 3, “Investment Securities,” to the Consolidated Financial Statements in Item 8 of this report.
Loans Held for Investment
Loans held for investment, our largest component of interest income, are grouped into commercial, consumer real estate, and consumer and other loan segments. Each segment is divided into various loan classes based on collateral or purpose. Certain loans acquired in FDIC-assisted transactions are covered under loss share agreements. The general characteristics of each loan segment are as follows:
| • | Commercial loans — This segment consists of loans to small and mid-size industrial, commercial, and service companies that include, but are not limited to, natural gas producers, retail merchants, and wholesale merchants. Commercial real estate projects represent a variety of sectors of the commercial real estate market, including single family and apartment lessors, commercial real estate lessors, and hotel/motel operators. Commercial loan underwriting guidelines require that comprehensive reviews and independent evaluations be performed on credits exceeding predefined size limits. Updates to these loan reviews are done periodically or annually depending on the size of the loan relationship. |
| • | Consumer real estate loans — This segment consists of loans to individuals within our market footprint for home equity loans and lines of credit and for the purchase or construction of owner occupied homes. Residential real estate loan underwriting guidelines require that borrowers meet certain credit, income, and collateral standards at origination. |
| • | Consumer and other loans — This segment consists of loans to individuals within our market footprint that include, but are not limited to, personal lines of credit, credit cards, and the purchase of automobiles, boats, mobile homes, and other consumer goods. Consumer loan underwriting guidelines require that borrowers meet certain credit, income, and collateral standards at origination. |
Total loans held for investment, net of unearned income, as of December 31, 2016, increased $146.41 million, or 8.58%, compared to December 31, 2015, primarily due to a $172.45 million, or 10.62%, increase in non-covered loans, which was driven by demand in the non-farm, non-residential and multi-family real estate segments of the loan portfolio. The increase was offset by a $26.04 million, or 31.36%, decrease in covered loans due to continued runoff in the covered Waccamaw portfolio. We had no foreign loans and had no loan concentrations to any single borrower or industry that represented 10% or more of outstanding loans as of December 31, 2016 or 2015. For additional information, see Note 4, “Loans,” to the Consolidated Financial Statements in Item 8 of this report.
42
Table of Contents
The following table presents loans, net of unearned income and by loan class, as of the dates indicated:
| December 31, | ||||||||||||||||||||
| (Amounts in thousands) | 2016 | 2015 | 2014 | 2013 | 2012 | |||||||||||||||
| Non-covered loans held for investment |
||||||||||||||||||||
| Commercial loans |
||||||||||||||||||||
| Construction, development, and other land |
$ | 56,948 | $ | 48,896 | $ | 41,271 | $ | 35,255 | $ | 57,434 | ||||||||||
| Commercial and industrial |
92,204 | 88,903 | 83,099 | 95,455 | 88,738 | |||||||||||||||
| Multi-family residential |
134,228 | 95,026 | 97,480 | 70,197 | 65,694 | |||||||||||||||
| Single family non-owner occupied |
142,965 | 149,351 | 135,171 | 135,559 | 135,912 | |||||||||||||||
| Non-farm, non-residential |
598,674 | 485,460 | 473,906 | 475,911 | 448,810 | |||||||||||||||
| Agricultural |
6,003 | 2,911 | 1,599 | 2,324 | 1,709 | |||||||||||||||
| Farmland |
31,729 | 27,540 | 29,517 | 32,614 | 34,570 | |||||||||||||||
|
|
|
|
|
|
|
|
|
|
|
|||||||||||
| Total commercial loans |
1,062,751 | 898,087 | 862,043 | 847,315 | 832,867 | |||||||||||||||
| Consumer real estate loans |
||||||||||||||||||||
| Home equity lines |
106,361 | 107,367 | 110,957 | 111,770 | 111,081 | |||||||||||||||
| Single family owner occupied |
500,891 | 495,209 | 485,475 | 496,012 | 473,547 | |||||||||||||||
| Owner occupied construction |
44,535 | 43,505 | 32,799 | 28,703 | 16,223 | |||||||||||||||
|
|
|
|
|
|
|
|
|
|
|
|||||||||||
| Total consumer real estate loans |
651,787 | 646,081 | 629,231 | 636,485 | 600,851 | |||||||||||||||
| Consumer and other loans |
||||||||||||||||||||
| Consumer loans |
77,445 | 72,000 | 69,347 | 71,313 | 78,163 | |||||||||||||||
| Other |
3,971 | 7,338 | 6,555 | 3,926 | 5,666 | |||||||||||||||
|
|
|
|
|
|
|
|
|
|
|
|||||||||||
| Total consumer and other loans |
81,416 | 79,338 | 75,902 | 75,239 | 83,829 | |||||||||||||||
|
|
|
|
|
|
|
|
|
|
|
|||||||||||
| Total non-covered loans |
1,795,954 | 1,623,506 | 1,567,176 | 1,559,039 | 1,517,547 | |||||||||||||||
| Total covered loans |
56,994 | 83,035 | 122,240 | 151,682 | 207,106 | |||||||||||||||
|
|
|
|
|
|
|
|
|
|
|
|||||||||||
| Total loans held for investment, net of unearned income |
1,852,948 | 1,706,541 | 1,689,416 | 1,710,721 | 1,724,653 | |||||||||||||||
| Less: allowance for loan losses |
17,948 | 20,233 | 20,227 | 24,077 | 25,770 | |||||||||||||||
|
|
|
|
|
|
|
|
|
|
|
|||||||||||
| Total loans held for investment, net of unearned income and allowance |
$ | 1,835,000 | $ | 1,686,308 | $ | 1,669,189 | $ | 1,686,644 | $ | 1,698,883 | ||||||||||
|
|
|
|
|
|
|
|
|
|
|
|||||||||||
| Loans held for sale |
$ | — | $ | — | $ | 1,792 | $ | 883 | $ | 6,672 | ||||||||||
|
|
|
|
|
|
|
|
|
|
|
|||||||||||
The following table presents covered loans, by loan class, as of the dates indicated:
| December 31, | ||||||||||||||||||||
| (Amounts in thousands) | 2016 | 2015 | 2014 | 2013 | 2012 | |||||||||||||||
| Commercial loans |
||||||||||||||||||||
| Construction, development, and other land |
$ | 4,570 | $ | 6,303 | $ | 13,100 | $ | 15,865 | $ | 26,595 | ||||||||||
| Commercial and industrial |
895 | 1,170 | 2,662 | 3,325 | 6,948 | |||||||||||||||
| Multi-family residential |
8 | 640 | 1,584 | 1,933 | 2,611 | |||||||||||||||
| Single family non-owner occupied |
962 | 2,674 | 5,918 | 7,449 | 11,428 | |||||||||||||||
| Non-farm, non-residential |
7,512 | 14,065 | 25,317 | 34,646 | 48,565 | |||||||||||||||
| Agricultural |
25 | 34 | 43 | 164 | 144 | |||||||||||||||
| Farmland |
397 | 643 | 716 | 873 | 1,091 | |||||||||||||||
|
|
|
|
|
|
|
|
|
|
|
|||||||||||
| Total commercial loans |
14,369 | 25,529 | 49,340 | 64,255 | 97,382 | |||||||||||||||
| Consumer real estate loans |
||||||||||||||||||||
| Home equity lines |
35,817 | 48,565 | 60,391 | 69,206 | 81,445 | |||||||||||||||
| Single family owner occupied |
6,729 | 8,595 | 11,968 | 16,919 | 22,961 | |||||||||||||||
| Owner occupied construction |
— | 262 | 453 | 1,184 | 1,644 | |||||||||||||||
|
|
|
|
|
|
|
|
|
|
|
|||||||||||
| Total consumer real estate loans |
42,546 | 57,422 | 72,812 | 87,309 | 106,050 | |||||||||||||||
| Consumer and other loans |
||||||||||||||||||||
| Consumer loans |
79 | 84 | 88 | 118 | 3,674 | |||||||||||||||
|
|
|
|
|
|
|
|
|
|
|
|||||||||||
| Total covered loans |
$ | 56,994 | $ | 83,035 | $ | 122,240 | $ | 151,682 | $ | 207,106 | ||||||||||
|
|
|
|
|
|
|
|
|
|
|
|||||||||||
43
Table of Contents
The following table presents the percentage of loans to total loans in the non-covered portfolio, by loan class, as of the dates indicated:
| December 31, | ||||||||||||||||||||
| 2016 | 2015 | 2014 | 2013 | 2012 | ||||||||||||||||
| Commercial loans |
||||||||||||||||||||
| Construction, development, and other land |
3.17 | % | 3.01 | % | 2.64 | % | 2.26 | % | 3.78 | % | ||||||||||
| Commercial and industrial |
5.13 | % | 5.48 | % | 5.30 | % | 6.12 | % | 5.85 | % | ||||||||||
| Multi-family residential |
7.47 | % | 5.85 | % | 6.22 | % | 4.50 | % | 4.33 | % | ||||||||||
| Single family non-owner occupied |
7.96 | % | 9.20 | % | 8.63 | % | 8.70 | % | 8.96 | % | ||||||||||
| Non-farm, non-residential |
33.34 | % | 29.90 | % | 30.24 | % | 30.53 | % | 29.57 | % | ||||||||||
| Agricultural |
0.34 | % | 0.18 | % | 0.10 | % | 0.15 | % | 0.11 | % | ||||||||||
| Farmland |
1.77 | % | 1.70 | % | 1.88 | % | 2.09 | % | 2.28 | % | ||||||||||
|
|
|
|
|
|
|
|
|
|
|
|||||||||||
| Total commercial loans |
59.18 | % | 55.32 | % | 55.01 | % | 54.35 | % | 54.88 | % | ||||||||||
| Consumer real estate loans |
||||||||||||||||||||
| Home equity lines |
5.92 | % | 6.62 | % | 7.08 | % | 7.17 | % | 7.32 | % | ||||||||||
| Single family owner occupied |
27.89 | % | 30.50 | % | 30.98 | % | 31.82 | % | 31.21 | % | ||||||||||
| Owner occupied construction |
2.48 | % | 2.68 | % | 2.09 | % | 1.84 | % | 1.07 | % | ||||||||||
|
|
|
|
|
|
|
|
|
|
|
|||||||||||
| Total consumer real estate loans |
36.29 | % | 39.80 | % | 40.15 | % | 40.83 | % | 39.60 | % | ||||||||||
| Consumer and other loans |
||||||||||||||||||||
| Consumer loans |
4.31 | % | 4.43 | % | 4.42 | % | 4.57 | % | 5.15 | % | ||||||||||
| Other |
0.22 | % | 0.45 | % | 0.42 | % | 0.25 | % | 0.37 | % | ||||||||||
|
|
|
|
|
|
|
|
|
|
|
|||||||||||
| Total consumer and other loans |
4.53 | % | 4.88 | % | 4.84 | % | 4.82 | % | 5.52 | % | ||||||||||
|
|
|
|
|
|
|
|
|
|
|
|||||||||||
| Total non-covered loans |
100.00 | % | 100.00 | % | 100.00 | % | 100.00 | % | 100.00 | % | ||||||||||
|
|
|
|
|
|
|
|
|
|
|
|||||||||||
The following table presents the percentage of loans to total loans in the covered portfolio, by loan class, as of the dates indicated:
| December 31, | ||||||||||||||||||||
| 2016 | 2015 | 2014 | 2013 | 2012 | ||||||||||||||||
| Commercial loans |
||||||||||||||||||||
| Construction, development, and other land |
8.02 | % | 7.59 | % | 10.72 | % | 10.46 | % | 12.84 | % | ||||||||||
| Commercial and industrial |
1.57 | % | 1.41 | % | 2.18 | % | 2.19 | % | 3.35 | % | ||||||||||
| Multi-family residential |
0.01 | % | 0.77 | % | 1.30 | % | 1.27 | % | 1.26 | % | ||||||||||
| Single family non-owner occupied |
1.69 | % | 3.22 | % | 4.84 | % | 4.91 | % | 5.52 | % | ||||||||||
| Non-farm, non-residential |
13.18 | % | 16.94 | % | 20.71 | % | 22.84 | % | 23.45 | % | ||||||||||
| Agricultural |
0.04 | % | 0.04 | % | 0.03 | % | 0.11 | % | 0.07 | % | ||||||||||
| Farmland |
0.70 | % | 0.77 | % | 0.59 | % | 0.58 | % | 0.53 | % | ||||||||||
|
|
|
|
|
|
|
|
|
|
|
|||||||||||
| Total commercial loans |
25.21 | % | 30.74 | % | 40.37 | % | 42.36 | % | 47.02 | % | ||||||||||
| Consumer real estate loans |
||||||||||||||||||||
| Home equity lines |
62.84 | % | 58.49 | % | 49.40 | % | 45.63 | % | 39.33 | % | ||||||||||
| Single family owner occupied |
11.81 | % | 10.35 | % | 9.79 | % | 11.15 | % | 11.09 | % | ||||||||||
| Owner occupied construction |
0.00 | % | 0.32 | % | 0.37 | % | 0.78 | % | 0.79 | % | ||||||||||
|
|
|
|
|
|
|
|
|
|
|
|||||||||||
| Total consumer real estate loans |
74.65 | % | 69.16 | % | 59.56 | % | 57.56 | % | 51.21 | % | ||||||||||
| Consumer and other loans |
||||||||||||||||||||
| Consumer loans |
0.14 | % | 0.10 | % | 0.07 | % | 0.08 | % | 1.77 | % | ||||||||||
|
|
|
|
|
|
|
|
|
|
|
|||||||||||
| Total covered loans |
100.00 | % | 100.00 | % | 100.00 | % | 100.00 | % | 100.00 | % | ||||||||||
|
|
|
|
|
|
|
|
|
|
|
|||||||||||
44
Table of Contents
The following table presents the maturities and rate sensitivities of the non-covered loan portfolio as of December 31, 2016:
| (Amounts in thousands) |
Due in One Year or Less |
Due After One Year Through Five Years |
Due After Five Years |
Total | ||||||||||||
| Commercial loans |
||||||||||||||||
| Construction, development, and other land (1) |
$ | 22,631 | $ | 14,367 | $ | 19,950 | $ | 56,948 | ||||||||
| Commercial and industrial |
36,118 | 43,512 | 12,574 | 92,204 | ||||||||||||
| Multi-family residential |
12,516 | 31,027 | 90,685 | 134,228 | ||||||||||||
| Single family non-owner occupied |
22,990 | 34,433 | 85,542 | 142,965 | ||||||||||||
| Non-farm, non-residential |
42,723 | 187,759 | 368,192 | 598,674 | ||||||||||||
| Agricultural |
519 | 3,857 | 1,627 | 6,003 | ||||||||||||
| Farmland |
5,448 | 10,149 | 16,132 | 31,729 | ||||||||||||
|
|
|
|
|
|
|
|
|
|||||||||
| Total commercial loans |
142,945 | 325,104 | 594,702 | 1,062,751 | ||||||||||||
| Consumer real estate loans |
||||||||||||||||
| Home equity lines |
4,920 | 10,266 | 91,175 | 106,361 | ||||||||||||
| Single family owner occupied |
8,712 | 22,528 | 469,651 | 500,891 | ||||||||||||
| Owner occupied construction |
1,948 | 905 | 41,682 | 44,535 | ||||||||||||
|
|
|
|
|
|
|
|
|
|||||||||
| Total consumer real estate loans |
15,580 | 33,699 | 602,508 | 651,787 | ||||||||||||
| Consumer and other loans |
||||||||||||||||
| Consumer loans |
16,830 | 50,818 | 9,797 | 77,445 | ||||||||||||
| Other |
1,264 | 875 | 1,832 | 3,971 | ||||||||||||
|
|
|
|
|
|
|
|
|
|||||||||
| Total consumer and other loans |
18,094 | 51,693 | 11,629 | 81,416 | ||||||||||||
|
|
|
|
|
|
|
|
|
|||||||||
| Total non-covered loans |
$ | 176,619 | $ | 410,496 | $ | 1,208,839 | $ | 1,795,954 | ||||||||
|
|
|
|
|
|
|
|
|
|||||||||
| Rate sensitivities |
||||||||||||||||
| Predetermined interest rate |
$ | 124,342 | $ | 367,152 | $ | 435,026 | $ | 926,520 | ||||||||
| Floating or adjustable interest rate |
52,277 | 43,344 | 773,813 | 869,434 | ||||||||||||
|
|
|
|
|
|
|
|
|
|||||||||
| Total non-covered loans |
$ | 176,619 | $ | 410,496 | $ | 1,208,839 | $ | 1,795,954 | ||||||||
|
|
|
|
|
|
|
|
|
|||||||||
| (1) | Construction loans with maturities due after five years include construction to permanent loans that have not converted to principal and interest payments. |
45
Table of Contents
The following table presents the maturities and rate sensitivities of the covered loan portfolio as of December 31, 2016:
| (Amounts in thousands) | Due in One Year or Less |
Due After One Year Through Five Years |
Due After Five Years |
Total | ||||||||||||
| Commercial loans |
||||||||||||||||
| Construction, development, and other land (1) |
$ | 2,490 | $ | 1,418 | $ | 662 | $ | 4,570 | ||||||||
| Commercial and industrial |
261 | 219 | 415 | 895 | ||||||||||||
| Multi-family residential |
— | — | 8 | 8 | ||||||||||||
| Single family non-owner occupied |
227 | 209 | 526 | 962 | ||||||||||||
| Non-farm, non-residential |
699 | 4,846 | 1,967 | 7,512 | ||||||||||||
| Agricultural |
— | — | 25 | 25 | ||||||||||||
| Farmland |
265 | 80 | 52 | 397 | ||||||||||||
|
|
|
|
|
|
|
|
|
|||||||||
| Total commercial loans |
3,942 | 6,772 | 3,655 | 14,369 | ||||||||||||
| Consumer real estate loans |
||||||||||||||||
| Home equity lines |
325 | 5,501 | 29,991 | 35,817 | ||||||||||||
| Single family owner occupied |
727 | 1,214 | 4,788 | 6,729 | ||||||||||||
|
|
|
|
|
|
|
|
|
|||||||||
| Total consumer real estate loans |
1,052 | 6,715 | 34,779 | 42,546 | ||||||||||||
| Consumer and other loans |
||||||||||||||||
| Consumer loans |
79 | — | — | 79 | ||||||||||||
|
|
|
|
|
|
|
|
|
|||||||||
| Total covered loans |
$ | 5,073 | $ | 13,487 | $ | 38,434 | $ | 56,994 | ||||||||
|
|
|
|
|
|
|
|
|
|||||||||
| Rate sensitivities |
||||||||||||||||
| Predetermined interest rate |
$ | 4,604 | $ | 7,569 | $ | 6,644 | $ | 18,817 | ||||||||
| Floating or adjustable interest rate |
469 | 5,918 | 31,790 | 38,177 | ||||||||||||
|
|
|
|
|
|
|
|
|
|||||||||
| Total covered loans |
$ | 5,073 | $ | 13,487 | $ | 38,434 | $ | 56,994 | ||||||||
|
|
|
|
|
|
|
|
|
|||||||||
| (1) | Construction loans with maturities due after five years include construction to permanent loans that have not converted to principal and interest payments. |
Risk Elements
We seek to mitigate credit risk by adhering to specific underwriting practices and by ongoing monitoring of our loan portfolio. Our underwriting practices include the analysis of borrowers’ prior credit histories, financial statements, tax returns, and cash flow projections; valuation of collateral based on independent appraisers’ reports; and verification of liquid assets. We believe our underwriting criteria are appropriate for the various loan types we offer; however, losses may occur that exceed the reserves established in our allowance for loan losses. We track certain credit quality indicators that include: trends related to the risk rating of commercial loans, the level of classified commercial loans, net charge-offs, nonperforming loans, and general economic conditions. The Company’s loan review function generally analyzes all commercial loan relationships greater than $4.0 million annually and at various times during the year. Smaller commercial and retail loans are sampled for review during the year.
Nonperforming assets consist of nonaccrual loans, accrual loans contractually past due 90 days or more, unseasoned troubled debt restructurings (“TDRs”), and OREO. Ongoing activity in the classification and categories of nonperforming loans include collections on delinquencies, foreclosures, loan restructurings, and movements into or out of the nonperforming classification due to changing economic conditions, borrower financial capacity, or resolution efforts. Loans acquired with credit deterioration, with a discount, continue to accrue interest based on expected cash flows; therefore, PCI loans are not generally considered nonaccrual. For additional information, see Note 5, “Credit Quality,” to the Consolidated Financial Statements in Item 8 of this report.
46
Table of Contents
The following table presents the components of nonperforming assets and related information as of the periods indicated:
| December 31, | ||||||||||||||||||||
| (Amounts in thousands) | 2016 | 2015 | 2014 | 2013 | 2012 | |||||||||||||||
| Non-covered nonperforming |
||||||||||||||||||||
| Nonaccrual loans |
$ | 15,854 | $ | 17,847 | $ | 10,556 | $ | 19,161 | $ | 23,931 | ||||||||||
|
TDRs (1) |
114 | 73 | 2,726 | 1,311 | 6,009 | |||||||||||||||
|
|
|
|
|
|
|
|
|
|
|
|||||||||||
| Total non-covered nonperforming loans |
15,968 | 17,920 | 13,282 | 20,472 | 29,940 | |||||||||||||||
| Non-covered OREO |
5,109 | 4,873 | 6,638 | 7,318 | 5,749 | |||||||||||||||
|
|
|
|
|
|
|
|
|
|
|
|||||||||||
| Total non-covered nonperforming assets |
$ | 21,077 | $ | 22,793 | $ | 19,920 | $ | 27,790 | $ | 35,689 | ||||||||||
|
|
|
|
|
|
|
|
|
|
|
|||||||||||
| Covered nonperforming |
||||||||||||||||||||
| Nonaccrual loans |
$ | 608 | $ | 647 | $ | 2,438 | $ | 3,353 | $ | 4,323 | ||||||||||
| Accruing loans past due 90 days or more |
— | — | — | 86 | — | |||||||||||||||
|
|
|
|
|
|
|
|
|
|
|
|||||||||||
| Total covered nonperforming loans |
608 | 647 | 2,438 | 3,439 | 4,323 | |||||||||||||||
| Covered OREO |
276 | 4,034 | 6,324 | 7,541 | 3,255 | |||||||||||||||
|
|
|
|
|
|
|
|
|
|
|
|||||||||||
| Total covered nonperforming assets |
$ | 884 | $ | 4,681 | $ | 8,762 | $ | 10,980 | $ | 7,578 | ||||||||||
|
|
|
|
|
|
|
|
|
|
|
|||||||||||
| Total nonperforming |
||||||||||||||||||||
| Nonaccrual loans |
$ | 16,462 | $ | 18,494 | $ | 12,994 | $ | 22,514 | $ | 28,254 | ||||||||||
| Accruing loans past due 90 days or more |
— | — | — | 86 | — | |||||||||||||||
|
TDRs (1) |
114 | 73 | 2,726 | 1,311 | 6,009 | |||||||||||||||
|
|
|
|
|
|
|
|
|
|
|
|||||||||||
| Total nonperforming loans |
16,576 | 18,567 | 15,720 | 23,911 | 34,263 | |||||||||||||||
| OREO |
5,385 | 8,907 | 12,962 | 14,859 | 9,004 | |||||||||||||||
|
|
|
|
|
|
|
|
|
|
|
|||||||||||
| Total nonperforming assets |
$ | 21,961 | $ | 27,474 | $ | 28,682 | $ | 38,770 | $ | 43,267 | ||||||||||
|
|
|
|
|
|
|
|
|
|
|
|||||||||||
| Additional Information |
||||||||||||||||||||
| Performing TDRs (2) |
$ | 12,838 | $ | 13,889 | $ | 11,808 | $ | 10,900 | $ | 6,038 | ||||||||||
| Total TDRs (3) |
12,952 | 13,962 | 14,534 | 12,211 | 12,047 | |||||||||||||||
| Gross interest income that would have been recorded under the original terms of restructured and nonperforming loans |
1,414 | 1,645 | 1,171 | 1,548 | 2,955 | |||||||||||||||
| Actual interest income recorded on restructured and nonperforming loans |
424 | 608 | 597 | 511 | 640 | |||||||||||||||
| Non-covered ratios |
||||||||||||||||||||
| Nonperforming loans to total loans |
0.89 | % | 1.10 | % | 0.85 | % | 1.31 | % | 1.97 | % | ||||||||||
| Nonperforming assets to total assets |
0.90 | % | 0.96 | % | 0.80 | % | 1.14 | % | 1.42 | % | ||||||||||
| Non-PCI allowance to nonperforming loans |
112.32 | % | 112.61 | % | 151.85 | % | 113.92 | % | 86.05 | % | ||||||||||
| Non-PCI allowance to total loans |
1.00 | % | 1.24 | % | 1.29 | % | 1.50 | % | 1.70 | % | ||||||||||
| Total ratios |
||||||||||||||||||||
| Nonperforming loans to total loans |
0.89 | % | 1.09 | % | 0.93 | % | 1.40 | % | 1.99 | % | ||||||||||
| Nonperforming assets to total assets |
0.92 | % | 1.12 | % | 1.10 | % | 1.49 | % | 1.59 | % | ||||||||||
| Allowance for loan losses to nonperforming loans |
108.28 | % | 108.97 | % | 128.67 | % | 100.69 | % | 75.21 | % | ||||||||||
| Allowance for loan losses to total loans |
0.97 | % | 1.19 | % | 1.20 | % | 1.41 | % | 1.49 | % | ||||||||||
| (1) | TDRs restructured within the past six months and nonperforming exclude nonaccrual TDRs of $224 thousand, $923 thousand, $306 thousand, $734 thousand, and $3.04 million for the five years ended December 31, 2016. |
| (2) | TDRs with six months or more of satisfactory payment performance exclude TDRs of $1.06 million, $416 thousand, $248 thousand, $1.47 million, and $792 thousand for the five years ended December 31, 2016. |
47
Table of Contents
| (3) | Total TDRs exclude nonaccrual TDRs of $1.28 million, $1.34 million, $554 thousand, $2.20 million, and $3.83 million for the five years ended December 31, 2016. |
Non-covered nonperforming assets as of December 31, 2016, decreased $1.72 million, or 7.53%, from December 31, 2015, due to a decrease in non-covered nonaccrual loans. Non-covered nonaccrual loans as of December 31, 2016, decreased $1.99 million, or 11.17%, from December 31, 2015. Non-covered nonaccrual loans were largely attributed to single family owner occupied (49.98%) and non-farm, non-residential (20.78%) loans as of December 31, 2016. As of December 31, 2016, approximately $336 thousand, or 2.12%, of non-covered nonaccrual loans were attributed to performing loans acquired in business combinations. Certain loans included in the nonaccrual category have been written down to estimated realizable value or assigned specific reserves in the allowance for loan losses based on management’s estimate of loss at ultimate resolution.
Non-covered delinquent loans, comprised of loans 30 days or more past due and nonaccrual loans, totaled $25.02 million as of December 31, 2016, a decrease of $2.87 million, or 10.29%, compared to $27.88 million as of December 31, 2015. Non-covered delinquent loans as a percent of total non-covered loans totaled 1.39% as of December 31, 2016, which includes past due loans (0.51%) and nonaccrual loans (0.88%).
When restructuring loans for borrowers experiencing financial difficulty, we generally make concessions in interest rates, loan terms, or amortization terms. Certain TDRs are classified as nonperforming when modified and are returned to performing status after six months of satisfactory payment performance; however, these loans remain identified as impaired until full payment or other satisfaction of the obligation occurs. Accruing TDRs as of December 31, 2016, decreased $1.01 million, or 7.23%, to $12.95 million from December 31, 2015. Nonperforming accruing TDRs as of December 31, 2016, increased $41 thousand, or 56.16%, to $114 thousand from December 31, 2015. Nonperforming accruing TDRs as a percent of total accruing TDRs totaled 0.88% as of December 31, 2016, compared to 0.52% as of December 31, 2015. Specific reserves on TDRs totaled $670 thousand as of December 31, 2016, compared to $590 thousand as of December 31, 2015.
Non-covered OREO, which is carried at the lesser of estimated net realizable value or cost, increased $236 thousand, or 4.84%, as of December 31, 2016, compared to December 31, 2015. Non-covered OREO consisted of 31 properties with an average holding period of 9 months as of December 31, 2016. The net loss on the sale of OREO totaled $1.15 million in 2016, $1.85 million in 2015, and $1.42 million in 2014. The following table presents the changes in OREO during the periods indicated:
| Year Ended December 31, | ||||||||||||||||||||||||
| 2016 | 2015 | |||||||||||||||||||||||
| (Amounts in thousands) | Non-covered | Covered | Total | Non-covered | Covered | Total | ||||||||||||||||||
| Beginning balance |
$ | 4,873 | $ | 4,034 | $ | 8,907 | $ | 6,638 | $ | 6,324 | $ | 12,962 | ||||||||||||
| Additions |
3,962 | 1,200 | 5,162 | 3,726 | 2,591 | 6,317 | ||||||||||||||||||
| Disposals |
(2,887 | ) | (4,405 | ) | (7,292 | ) | (4,579 | ) | (3,879 | ) | (8,458 | ) | ||||||||||||
| Valuation adjustments |
(839 | ) | (553 | ) | (1,392 | ) | (912 | ) | (1,002 | ) | (1,914 | ) | ||||||||||||
|
|
|
|
|
|
|
|
|
|
|
|
|
|||||||||||||
| Ending balance |
$ | 5,109 | $ | 276 | $ | 5,385 | $ | 4,873 | $ | 4,034 | $ | 8,907 | ||||||||||||
|
|
|
|
|
|
|
|
|
|
|
|
|
|||||||||||||
Allowance for Loan Losses
The allowance for loan losses is maintained at a level management deems sufficient to absorb probable loan losses inherent in the loan portfolio. The allowance is increased by the provision for loan losses and recoveries of prior loan charge-offs and decreased by loans charged off. The provision for loan losses is calculated and charged to expense to bring the allowance to an appropriate level using a systematic process of measurement that requires significant judgments and estimates. As of December 31, 2016, our qualitative risk factors reflect a stable risk of loan losses due to consistent asset quality metrics and relatively stable business and economic conditions in our primary market areas. The loan portfolio is continually monitored for deterioration in credit, which may result in
48
Table of Contents
the need to increase the allowance for loan losses in future periods. Management considered the allowance adequate as of December 31, 2016; however, no assurance can be made that additions to the allowance will not be required in future periods. For additional information, see “Allowance for Loan Losses” in the “Critical Accounting Estimates” section above and Note 6, “Allowance for Loan Losses,” to the Consolidated Financial Statements in Item 8 of this report.
The allowance for loan losses as of December 31, 2016, decreased $2.29 million, or 11.29%, from December 31, 2015. The non-PCI allowance as a percent of non-covered loans totaled 1.00% as of December 31, 2016, compared to 1.24% as of December 31, 2015. PCI loans were aggregated into five loan pools as of December 31, 2016; Waccamaw commercial, Waccamaw serviced home equity lines, Waccamaw residential, Peoples Bank of Virginia (“Peoples”) commercial, and Peoples residential; compared to six loan pools as of December 31, 2015. The cash flow analysis performed for the PCI loan pools as of December 31, 2016, identified one pool as impaired with a cumulative impairment of $12 thousand compared to the analysis performed as of December 31, 2015, that identified two pools as impaired with a cumulative impairment of $54 thousand. Net charge-offs increased $1.38 million, or 64.15%, from December 31, 2015, largely due to one loan relationship in the non-farm, non-residential segment that was fully reserved for.
49
Table of Contents
The following table presents the changes in the allowance for loan losses, by loan class, during the periods indicated:
| Year Ended December 31, | ||||||||||||||||||||
| (Amounts in thousands) | 2016 | 2015 | 2014 | 2013 | 2012 | |||||||||||||||
| Beginning balance |
$ | 20,233 | $ | 20,227 | $ | 24,077 | $ | 25,770 | $ | 26,205 | ||||||||||
| Removal of loans transferred (1) |
— | — | (682 | ) | — | — | ||||||||||||||
| Provision for loan losses charged to operations, non-PCI loans |
1,296 | 2,166 | 420 | 7,912 | 5,871 | |||||||||||||||
| (Recovery of) provision for loan losses charged to operations, PCI loans |
(41 | ) | 25 | (275 | ) | 296 | (193 | ) | ||||||||||||
| (Recovery of) provision for loan losses recorded through the FDIC indemnification asset |
(1 | ) | (29 | ) | (422 | ) | 451 | — | ||||||||||||
| Charge-offs |
||||||||||||||||||||
| Commercial loans |
||||||||||||||||||||
| Construction, development, and other land |
254 | 256 | 1,238 | 2,738 | 286 | |||||||||||||||
| Commercial and industrial |
144 | 93 | 459 | 720 | 113 | |||||||||||||||
| Multi-family residential |
64 | — | 35 | 17 | 209 | |||||||||||||||
| Single family non-owner occupied |
237 | 87 | 488 | 2,618 | 2,502 | |||||||||||||||
| Non-farm, non-residential |
1,684 | 773 | 832 | 1,613 | 643 | |||||||||||||||
| Agricultural |
— | — | — | 17 | — | |||||||||||||||
| Farmland |
9 | 73 | — | 20 | 61 | |||||||||||||||
| Consumer real estate loans |
||||||||||||||||||||
| Home equity lines |
1,073 | 92 | 451 | 1,873 | 851 | |||||||||||||||
| Single family owner occupied |
508 | 812 | 988 | 947 | 1,842 | |||||||||||||||
| Owner occupied construction |
31 | 2 | 305 | 295 | 9 | |||||||||||||||
| Consumer and other loans |
||||||||||||||||||||
| Consumer loans |
457 | 461 | 659 | 491 | 403 | |||||||||||||||
| Other |
715 | 1,096 | 1,026 | 1,178 | 585 | |||||||||||||||
|
|
|
|
|
|
|
|
|
|
|
|||||||||||
| Total charge-offs |
5,176 | 3,745 | 6,481 | 12,527 | 7,504 | |||||||||||||||
| Recoveries |
||||||||||||||||||||
| Commercial loans |
||||||||||||||||||||
| Construction, development, and other land |
282 | 135 | 84 | 510 | 17 | |||||||||||||||
| Commercial and industrial (2) |
484 | 173 | 1,736 | 98 | 93 | |||||||||||||||
| Multi-family residential |
15 | — | 10 | 16 | 125 | |||||||||||||||
| Single family non-owner occupied |
79 | 92 | 331 | 158 | 109 | |||||||||||||||
| Non-farm, non-residential |
59 | 74 | 239 | 119 | 280 | |||||||||||||||
| Agricultural |
— | — | — | 22 | 1 | |||||||||||||||
| Farmland |
— | — | — | 8 | 1 | |||||||||||||||
| Consumer real estate loans |
||||||||||||||||||||
| Home equity lines |
137 | 402 | 514 | 273 | 76 | |||||||||||||||
| Single family owner occupied |
182 | 258 | 76 | 169 | 213 | |||||||||||||||
| Owner occupied construction |
39 | 18 | — | — | — | |||||||||||||||
| Consumer and other |
||||||||||||||||||||
| Consumer loans |
123 | 101 | 121 | 107 | 152 | |||||||||||||||
| Other |
237 | 336 | 479 | 695 | 324 | |||||||||||||||
|
|
|
|
|
|
|
|
|
|
|
|||||||||||
| Total recoveries |
1,637 | 1,589 | 3,590 | 2,175 | 1,391 | |||||||||||||||
|
|
|
|
|
|
|
|
|
|
|
|||||||||||
| Net charge-offs |
3,539 | 2,156 | 2,891 | 10,352 | 6,113 | |||||||||||||||
|
|
|
|
|
|
|
|
|
|
|
|||||||||||
| Ending balance |
$ | 17,948 | $ | 20,233 | $ | 20,227 | $ | 24,077 | $ | 25,770 | ||||||||||
|
|
|
|
|
|
|
|
|
|
|
|||||||||||
| Net charge-offs to average non-covered loans |
0.21 | % | 0.14 | % | 0.18 | % | 0.68 | % | 0.41 | % | ||||||||||
| Net charge-offs to average total loans |
0.20 | % | 0.13 | % | 0.17 | % | 0.61 | % | 0.38 | % | ||||||||||
50
Table of Contents
| (1) | Includes a $682 thousand removal in 2014 due to loans transferred in branch divestitures |
| (2) | Includes a $1.60 million recovery in 2014 related to the positive resolution of a sizable problem credit |
The following table presents the allowance for loan losses, excluding PCI loans, by loan class, as of the dates indicated:
| December 31, | ||||||||||||||||||||
| (Amounts in thousands) | 2016 | 2015 | 2014 | 2013 | 2012 | |||||||||||||||
| Commercial loans |
||||||||||||||||||||
| Construction, development, and other land |
$ | 889 | $ | 1,119 | $ | 1,151 | $ | 1,141 | $ | 1,214 | ||||||||||
| Commercial and industrial |
495 | 504 | 689 | 5,215 | 4,351 | |||||||||||||||
| Multi-family residential |
1,157 | 1,535 | 1,917 | 1,211 | 1,630 | |||||||||||||||
| Single family non-owner occupied |
2,752 | 3,369 | 3,228 | 3,549 | 4,367 | |||||||||||||||
| Non-farm, non-residential |
6,185 | 6,393 | 5,805 | 4,650 | 5,259 | |||||||||||||||
| Agricultural |
43 | 22 | 13 | 23 | 22 | |||||||||||||||
| Farmland |
169 | 190 | 206 | 301 | 416 | |||||||||||||||
| Consumer real estate loans |
||||||||||||||||||||
| Home equity lines |
895 | 1,091 | 1,330 | 1,361 | 1,574 | |||||||||||||||
| Single family owner occupied |
4,364 | 4,969 | 4,935 | 5,030 | 5,995 | |||||||||||||||
| Owner occupied construction |
228 | 297 | 225 | 206 | 337 | |||||||||||||||
| Consumer and other loans |
||||||||||||||||||||
| Consumer loans |
759 | 690 | 670 | 635 | 597 | |||||||||||||||
|
|
|
|
|
|
|
|
|
|
|
|||||||||||
| Total allowance, excluding PCI loans |
$ | 17,936 | $ | 20,179 | $ | 20,169 | $ | 23,322 | $ | 25,762 | ||||||||||
|
|
|
|
|
|
|
|
|
|
|
|||||||||||
The following table presents the PCI allowance for loan losses, by loan pool, as of the dates indicated:
| December 31, | ||||||||||||||||||||
| (Amounts in thousands) | 2016 | 2015 | 2014 | 2013 | 2012 | |||||||||||||||
| Commercial loans |
||||||||||||||||||||
| Waccamaw commercial |
$ | — | $ | — | $ | 37 | $ | — | $ | — | ||||||||||
| Waccamaw lines of credit (1) |
— | — | — | — | — | |||||||||||||||
| Peoples commercial |
— | — | — | 69 | — | |||||||||||||||
| Other |
— | — | — | 8 | 8 | |||||||||||||||
| Consumer real estate loans |
||||||||||||||||||||
| Waccamaw serviced home equity lines |
— | — | — | 277 | — | |||||||||||||||
| Waccamaw residential |
— | 1 | — | 217 | — | |||||||||||||||
| Peoples residential |
12 | 53 | 21 | 184 | — | |||||||||||||||
| Consumer and other loans |
||||||||||||||||||||
| Waccamaw consumer (2) |
— | — | — | — | — | |||||||||||||||
|
|
|
|
|
|
|
|
|
|
|
|||||||||||
| Total PCI allowance |
$ | 12 | $ | 54 | $ | 58 | $ | 755 | $ | 8 | ||||||||||
|
|
|
|
|
|
|
|
|
|
|
|||||||||||
| (1) | Closed during the first quarter of 2016 |
| (2) | Closed during the first quarter of 2015 |
Deposits
Total deposits as of December 31, 2016, decreased $31.92 million, or 1.70%, compared to December 31, 2015. Noninterest-bearing deposits decreased $23.81 million; savings deposits, which include money market accounts and savings accounts, decreased $7.33 million; and time deposits, which include certificates of deposit and individual retirement accounts, decreased $31.42 million as of December 31, 2016, compared to December 31,
51
Table of Contents
2015. Interest-bearing deposits increased $30.63 million as of December 31, 2016, compared to December 31, 2015. We had no material deposit concentrations to any single customer or industry that represented 10% or more of outstanding deposits as of December 31, 2016 or 2015.
The following schedule presents the contractual maturities of time deposits of $100 thousand or more as of December 31, 2016:
| (Amounts in thousands) | ||||
| Three months or less |
$ | 22,297 | ||
| Over three through six months |
21,816 | |||
| Over six through twelve months |
41,749 | |||
| Over twelve months |
107,548 | |||
|
|
|
|||
| $ | 193,410 | |||
|
|
|
|||
Borrowings
Total borrowings as of December 31, 2016, decreased $40.66 million, or 18.53%, compared to December 31, 2015, primarily due to the repayment of wholesale debt. Short-term borrowings consisted of retail repurchase agreements, which decreased $15.61 million, or 17.61%, as of December 31, 2016, compared to December 31, 2015. The following table presents the balances and weighted average rates paid on short-term borrowings for the periods indicated:
| Year Ended December 31, | ||||||||||||||||||||||||
| 2016 | 2015 | 2014 | ||||||||||||||||||||||
| (Amounts in thousands) | Amount | Rate | Amount | Rate | Amount | Rate | ||||||||||||||||||
| Year-end balance |
$ | 73,005 | 0.07 | % | $ | 88,614 | 0.19 | % | $ | 73,742 | 0.17 | % | ||||||||||||
| Average annual balance (1) |
108,620 | 0.21 | % | 72,691 | 0.10 | % | 74,165 | 0.14 | % | |||||||||||||||
| Maximum month-end balance (1) |
182,554 | 122,693 | 117,105 | |||||||||||||||||||||
| (1) | Average annual and month-end balances include federal funds purchased and short-term FHLB advances that were repaid prior to year end. |
Long-term borrowings consisted of wholesale repurchase agreements; FHLB borrowings, including convertible and callable advances; and other obligations as of December 31, 2016. Wholesale repurchase agreements decreased $25.00 million, or 50.00%, as of December 31, 2016, compared to December 31, 2015, due to the maturity of an agreement with an interest rate of 4.23%. The remaining wholesale repurchase agreement carries an interest rate of 3.18% and matures February 25, 2019. Long-term FHLB borrowings totaled $65.00 million as of December 31, 2016 and 2015. Subordinated debt, primarily comprised of junior subordinated debentures, totaled $15.46 million as of December 31, 2016 and 2015. The Company redeemed all of its trust preferred securities on January 9, 2017.
Liquidity and Capital Resources
Liquidity
Liquidity is a measure of our ability to convert assets to cash or raise cash to meet financial obligations. We believe that liquidity management should encompass an overall balance sheet approach that draws together all sources and uses of liquidity. Poor or inadequate liquidity risk management may result in a funding deficit that could have a material impact on our operations. We maintain a liquidity risk management policy and contingency funding policy (“Liquidity Plan”) to detect potential liquidity issues and protect our depositors, creditors, and shareholders. The Liquidity Plan includes various internal and external indicators that are reviewed on a recurring basis by our Asset/Liability Management Committee (“ALCO”), which reports to the Board of
52
Table of Contents
Directors. ALCO reviews liquidity risk exposure and policies related to liquidity management; ensures that systems and internal controls are consistent with liquidity policies; and provides accurate reports about liquidity needs, sources, and compliance. The Liquidity Plan involves ongoing monitoring and estimation of potentially credit sensitive liabilities and the sources and amounts of balance sheet and external liquidity available to replace outflows during a funding crisis. The liquidity model incorporates various funding crisis scenarios and a specific action plan is formulated, and activated, when a financial shock that affects our normal funding activities is identified. Generally, the plan will reflect a strategy of replacing liability outflows with alternative liabilities, rather than balance sheet asset liquidity, to the extent that significant premiums can be avoided. If alternative liabilities are not available, outflows will be met through liquidation of balance sheet assets, including unpledged securities.
As a financial holding company, the Company’s primary source of liquidity is dividends received from the Bank, which are subject to certain regulatory limitations. Other sources of liquidity include cash, investment securities, and borrowings. As of December 31, 2016, the Company’s cash reserves and investment securities totaled $23.58 million and availability on an unsecured, committed line of credit with an unrelated financial institution totaled $15.00 million. There was no outstanding balance on the line of credit as of December 31, 2016. The Company’s cash reserves and investments provide adequate working capital to meet obligations, projected dividends to shareholders, and anticipated debt repayments for the next twelve months.
In addition to cash on hand and deposits with other financial institutions, we rely on customer deposits, cash flows from loans and investment securities, and lines of credit from the FHLB and the Federal Reserve Bank (“FRB”) Discount Window to meet potential liquidity demands. These sources of liquidity are immediately available to satisfy deposit withdrawals, customer credit needs, and our operations. Secondary sources of liquidity include approved lines of credit with correspondent banks and unpledged available-for-sale securities. As of December 31, 2016, unencumbered cash totaled $76.31 million, unused borrowing capacity from the FHLB of $558.75 million, available credit from the FRB Discount Window of $9.09 million, available lines from correspondent banks of $105.00 million, and unpledged available-for-sale securities of $25.83 million.
Cash Flows
The following table summarizes the components of cash flow for the periods indicated:
| Year Ended December 31, | ||||||||||||
| 2016 | 2015 | 2014 | ||||||||||
| (Amounts in thousands) | ||||||||||||
| Net cash provided by operating activities |
$ | 43,088 | $ | 58,519 | $ | 41,689 | ||||||
| Net cash provided by (used in) investing activities |
110,210 | (70,785 | ) | 280,955 | ||||||||
| Net cash used in financing activities |
(128,778 | ) | (173,607 | ) | (141,551 | ) | ||||||
|
|
|
|
|
|
|
|||||||
| Net increase (decrease) in cash and cash equivalents |
24,520 | (185,873 | ) | 181,093 | ||||||||
| Cash and cash equivalents, beginning balance |
51,787 | 237,660 | 56,567 | |||||||||
|
|
|
|
|
|
|
|||||||
| Cash and cash equivalents, ending balance |
$ | 76,307 | $ | 51,787 | $ | 237,660 | ||||||
|
|
|
|
|
|
|
|||||||
2016 Compared to 2015. Cash and cash equivalents increased $24.52 million in 2016 compared to a decrease of $185.87 million in 2015 primarily due to investing activities. Net cash provided by investing activities increased $181.00 million in 2016 compared to net cash used of $70.79 million in 2015, which was largely the result of an increase in proceeds from sales and maturities of investment securities, an increase in proceeds from acquisition and divestiture activities, and a reduction in the purchase of investment securities. These increases to investing cash flow were offset by an increase in loan originations. Net cash used in financing activities decreased $44.83 million primarily due to a decrease in interest-bearing deposits offset by an increase in the repayment of long-term debt. Net cash provided by operating activities decreased $15.43 million.
53
Table of Contents
2015 Compared to 2014. Cash and cash equivalents decreased $185.87 million in 2015 compared to an increase of $181.09 million in 2014. Net cash used in investing activities increased $351.74 million in 2015 compared to net cash provided of $280.96 million in 2014, which was largely the result of a reduction in net cash received in acquisitions and divestitures and a decrease in the proceeds from the sale of available-for-sale securities coupled with an increase in the purchase of available-for-sale securities. Net cash used in financing activities increased $32.06 million, or 22.65%, primarily due to a decrease in noninterest and interest-bearing deposits offset by a reduction in the repayment of long-term debt. Net cash provided by operating activities increased $16.83 million, or 40.37%, primarily due to a cash decrease in other operating activities offset by a decrease in FHLB debt prepayment penalties.
Capital Resources
We are committed to effectively managing our capital to protect our depositors, creditors, and shareholders. Failure to meet certain capital requirements may result in actions by regulatory agencies that could have a material impact on our operations. Total stockholders’ equity as of December 31, 2016, decreased $3.96 million, or 1.15%, to $339.06 million from $343.02 million as of December 31, 2015. The change in stockholders’ equity was largely due to the repurchase of 1,182,294 shares of our common stock totaling $23.76 million and dividends declared on our common stock of $10.40 million offset by net income of $25.13 million and OCI of $3.24 million. The increase in OCI was primarily due to recognizing OTTI charges of $4.65 million in net income. In accordance with current regulatory guidelines, accumulated other comprehensive income is largely excluded from stockholders’ equity in the calculation of our capital ratios. Our book value per common share increased $1.00, or 5.28%, to $19.95 as of December 31, 2016, from $18.95 as of December 31, 2015.
Capital Adequacy Requirements
Risk-based capital guidelines, issued by state and federal banking agencies, include balance sheet assets and off-balance sheet arrangements weighted by the risks inherent in the specific asset type. Our current risk-based capital requirements, based on the international capital standards known as Basel III, became effective on January 1, 2015, subject to a four-year phase-in period. Basel III’s capital conservation buffer became effective on January 1, 2016, at 0.625%, and will be phased in over a four-year period. Our current required capital ratios are as follows:
| • | 4.5% Common Equity Tier 1 capital to risk-weighted assets (effectively 5.125% including the capital conservation buffer) |
| • | 6.0% Tier 1 capital to risk-weighted assets (effectively 6.625% including the capital conservation buffer) |
| • | 8.0% Total capital to risk-weighted assets (effectively 8.625% including the capital conservation buffer) |
| • | 4.0% Tier 1 capital to average consolidated assets (“Tier 1 leverage ratio”) |
The following table presents our capital ratios as of the dates indicated:
| December 31, | ||||||||||||
| 2016 (1) | 2015 (1) | 2014 (2) | ||||||||||
| The Company |
||||||||||||
| Common equity Tier 1 ratio |
13.88 | % | 14.54 | % | N/A | |||||||
| Tier 1 risk-based capital ratio |
14.74 | % | 14.73 | % | 16.43 | % | ||||||
| Total risk-based capital ratio |
15.79 | % | 15.95 | % | 17.68 | % | ||||||
| Tier 1 leverage ratio |
11.07 | % | 10.62 | % | 10.12 | % | ||||||
| The Bank |
||||||||||||
| Common equity Tier 1 ratio |
12.93 | % | 13.60 | % | N/A | |||||||
| Tier 1 risk-based capital ratio |
12.93 | % | 13.60 | % | 14.48 | % | ||||||
| Total risk-based capital ratio |
13.98 | % | 14.82 | % | 15.73 | % | ||||||
| Tier 1 leverage ratio |
9.71 | % | 9.77 | % | 8.87 | % | ||||||
54
Table of Contents
| (1) | Based on Basel III |
| (2) | Based on Basel I |
As of December 31, 2016, we continued to meet all capital adequacy requirements and were classified as well-capitalized under the regulatory framework for prompt corrective action. Management believes there have been no conditions or events since those notifications that would change the Bank’s classification. Additionally, our capital ratios were in excess of the minimum standards under the Basel III capital rules on a fully phased-in basis, if such requirements were in effect, as of December 31, 2016. Our capital ratios as of December 31, 2015, decreased from December 31, 2014, primarily due to the phase-in of the Basel III Capital Rules related to Common Equity Tier 1 deductions and an increase in risk-weighted assets. For additional information, see “Capital Requirements” in Part I, Item 1 and Note 21, “Regulatory Requirements and Restrictions,” to the Consolidated Financial Statements in Item 8 of this report.
Commitments, Contingencies, and Off-Balance Sheet Arrangements
Contractual Obligations
We enter into certain contractual obligations that require future cash payments. Management believes we have adequate resources to fund our outstanding commitments and the ability to adjust rates on certificates of deposit, in a changing interest rate environment; attract new deposits; and replace deposits with FHLB advances or other fund providers, if cost effective. The following table presents our contractual cash obligations, by payment date, as of December 31, 2016:
| Less Than One Year |
One to Three Years |
Three to Five Years |
More than Five Years |
Total | ||||||||||||||||
| (Amounts in thousands) | ||||||||||||||||||||
| Deposits without a stated maturity (1) |
$ | 1,329,304 | $ | — | $ | — | $ | — | $ | 1,329,304 | ||||||||||
| Certificates of deposit (2)(3) |
256,693 | 146,967 | 114,971 | 3,607 | 522,238 | |||||||||||||||
| Securities sold under agreements to repurchase |
73,671 | 26,047 | — | — | 99,718 | |||||||||||||||
| Long-term borrowings (2)(3) |
17,211 | 4,000 | 52,033 | — | 73,244 | |||||||||||||||
| Other borrowings |
15,688 | 152 | 76 | — | 15,916 | |||||||||||||||
| Operating leases |
341 | 309 | 194 | 791 | 1,635 | |||||||||||||||
|
|
|
|
|
|
|
|
|
|
|
|||||||||||
| Total contractual cash obligations |
$ | 1,692,908 | $ | 177,475 | $ | 167,274 | $ | 4,398 | $ | 2,042,055 | ||||||||||
|
|
|
|
|
|
|
|
|
|
|
|||||||||||
| (1) | Excludes interest |
| (2) | Includes interest on fixed and variable rate obligations (changes in market interest rates may materially affect the variable rate obligation to be paid, which is reflected using the rates in effect as of December 31, 2016) |
| (3) | Excludes unamortized premiums and discounts |
55
Table of Contents
Off-Balance Sheet Arrangements
We extend contractual commitments with off-balance sheet risk in the normal course of business to meet the financing needs of our customers. Our exposure to credit loss in the event of nonperformance by other parties to financial instruments is the same as the contractual amount of the instrument. The following table presents our off-balance sheet arrangements, by commitment expiration, as of December 31, 2016:
| (Amounts in thousands) | Less than One Year (1) |
One to Three Years |
Three to Five Years |
More than Five Years |
Total | |||||||||||||||
| Commitments to extend credit |
$ | 91,061 | $ | 51,643 | $ | 15,512 | $ | 103,585 | $ | 261,801 | ||||||||||
| Financial letters of credit |
554 | 192 | 4,000 | 10 | 4,756 | |||||||||||||||
| Performance letters of credit |
2,939 | 106 | 379 | — | 3,424 | |||||||||||||||
|
|
|
|
|
|
|
|
|
|
|
|||||||||||
| Total off-balance sheet risk |
$ | 94,554 | $ | 51,941 | $ | 19,891 | $ | 103,595 | $ | 269,981 | ||||||||||
|
|
|
|
|
|
|
|
|
|
|
|||||||||||
| (1) | Lines of credit with no stated maturity date are included in the less than one year expiration category. |
The reserve for the risk inherent in unfunded lending commitments totaled $326 thousand as of December 31, 2016. For additional information, see Note 20, “Litigation, Commitments, and Contingencies,” to the Consolidated Financial Statements in Item 8 of this report.
Market Risk and Interest Rate Sensitivity
Market risk represents the risk of loss due to adverse changes in current and future cash flows, fair values, earnings, or capital due to movements in interest rates and other factors. Our profitability is largely dependent upon net interest income, which is subject to variation due to changes in the interest rate environment and unbalanced repricing opportunities. We are subject to interest rate risk when interest-earning assets and interest-bearing liabilities reprice at differing times, when underlying rates change at different levels or in varying degrees, when there is an unequal change in the spread between two or more rates for different maturities, and when embedded options, if any, are exercised. ALCO reviews our mix of assets and liabilities with the goal of limiting exposure to interest rate risk, ensuring adequate liquidity, and coordinating sources and uses of funds while maintaining an acceptable level of net interest income given the current interest rate environment. ALCO is also responsible for overseeing the formulation and implementation of policies and strategies to improve balance sheet positioning and mitigate the effect of interest rate changes.
In order to manage our exposure to interest rate risk, we periodically review third-party and internal simulation models that project net interest income at risk, which measures the impact of different interest rate scenarios on net interest income, and the economic value of equity at risk, which measures potential long-term risk in the balance sheet by valuing our assets and liabilities at fair value under different interest rate scenarios. Simulation results show the existence and severity of interest rate risk in each scenario based on our current balance sheet position, assumptions about changes in the volume and mix of interest-earning assets and interest-bearing liabilities, and estimated yields earned on assets and rates paid on liabilities. The simulation model provides the best tool available to us and the industry for managing interest rate risk; however, the model cannot precisely predict the impact of fluctuations in interest rates on net interest income due to the use of significant estimates and assumptions. Actual results will differ from simulated results due to the timing, magnitude, and frequency of interest rate changes; changes in market conditions and customer behavior; and changes in our strategies that management might undertake in response to a sudden and sustained rate shock.
On December 14, 2016, the Federal Open Market Committee raised the benchmark federal funds rate, which changed the target rate from a range of 25 to 50 basis points to a new range of 50 to 75 basis points. This represents the first move of the target since December 2015 when it was increased 25 basis points. The following table presents the sensitivity of net interest income from immediate and sustained rate shocks in various interest
56
Table of Contents
rate scenarios over a twelve-month period for the periods indicated. Due to the current target rate, we do not reflect a decrease of more than 100 basis points from current rates in our analysis.
| Year Ended December 31, | ||||||||||||||||
| 2016 | 2015 | |||||||||||||||
| (Amounts in thousands, except basis points) Increase (Decrease) in Basis Points |
Change in Net Interest Income |
Percent Change |
Change in Net Interest Income |
Percent Change |
||||||||||||
| 300 |
$ | 526 | 0.6 | $ | (1,162 | ) | (1.4 | ) | ||||||||
| 200 |
438 | 0.5 | (694 | ) | (0.9 | ) | ||||||||||
| 100 |
183 | 0.2 | (409 | ) | (0.5 | ) | ||||||||||
| (100) |
(2,616 | ) | (3.1 | ) | (1,813 | ) | (2.2 | ) | ||||||||
We have established policy limits for tolerance of interest rate risk in various interest rate scenarios and exposure limits to changes in the economic value of equity. The most recent simulation indicates that current exposure to interest rate risk is within our defined policy limits.
The Company primarily uses derivative instruments to manage exposure to market risk and meet customer financing needs. As of December 31, 2016, we maintained interest rate swap agreements with notional amounts totaling $4.84 million to modify our exposure to interest rate risk caused by changes in the LIBOR curve in relation to certain designated fixed rate loans. The fair value of the swap agreements, which are accounted for as fair value hedges and recorded as derivative liabilities, totaled $167 thousand as of December 31, 2016, and $251 thousand as of December 31, 2015. For additional information, see Note 12, “Derivative Instruments and Hedging Activities,” to the Consolidated Financial Statements in Item 8 of this report.
Inflation and Changing Prices
Our consolidated financial statements and related notes are presented in accordance with GAAP, which requires the measurement of results of operations and financial position in historical dollars. Inflation may cause a rise in price levels and changes in the relative purchasing power of money. These inflationary effects are not reflected in historical dollar measurements. The primary effect of inflation on our operations is increased operating costs. In management’s opinion, interest rates have a greater impact on our financial performance than inflation. Interest rates do not necessarily fluctuate in the same direction, or to the same extent, as the price of goods and services; therefore, the effect of inflation on businesses with large investments in property, plant, and inventory is generally more significant than the effect on financial institutions. The U.S. inflation rate continues to be relatively stable, and management believes that any changes in inflation will not be material to our financial performance.
| Item 7A. | Quantitative and Qualitative Disclosures about Market Risk. |
The information required in this item is incorporated by reference to “Market Risk and Interest Rate Sensitivity” in Item 7 of this report.
57
Table of Contents
| Item 8. | Financial Statements and Supplementary Data. |
FINANCIAL STATEMENTS AND SUPPLEMENTARY DATA INDEX
58
Table of Contents
FIRST COMMUNITY BANCSHARES, INC.
CONSOLIDATED BALANCE SHEETS
| December 31, | ||||||||
| (Amounts in thousands, except share and per share data) | 2016 | 2015 | ||||||
| Assets |
||||||||
| Cash and due from banks |
$ | 36,645 | $ | 37,383 | ||||
| Federal funds sold |
38,717 | 13,498 | ||||||
| Interest-bearing deposits in banks |
945 | 906 | ||||||
|
|
|
|
|
|||||
| Total cash and cash equivalents |
76,307 | 51,787 | ||||||
| Securities available for sale |
165,579 | 366,173 | ||||||
| Securities held to maturity |
47,133 | 72,541 | ||||||
| Loans held for investment, net of unearned income |
||||||||
| Non-covered |
1,795,954 | 1,623,506 | ||||||
| Covered |
56,994 | 83,035 | ||||||
| Allowance for loan losses |
(17,948 | ) | (20,233 | ) | ||||
|
|
|
|
|
|||||
| Loans held for investment, net |
1,835,000 | 1,686,308 | ||||||
| FDIC indemnification asset |
12,173 | 20,844 | ||||||
| Premises and equipment, net |
50,085 | 52,756 | ||||||
| Other real estate owned, non-covered |
5,109 | 4,873 | ||||||
| Other real estate owned, covered |
276 | 4,034 | ||||||
| Interest receivable |
5,553 | 6,007 | ||||||
| Goodwill |
95,779 | 100,486 | ||||||
| Other intangible assets |
7,207 | 5,243 | ||||||
| Other assets |
86,197 | 91,224 | ||||||
|
|
|
|
|
|||||
| Total assets |
$ | 2,386,398 | $ | 2,462,276 | ||||
|
|
|
|
|
|||||
| Liabilities |
||||||||
| Deposits |
||||||||
| Noninterest-bearing |
$ | 427,705 | $ | 451,511 | ||||
| Interest-bearing |
1,413,633 | 1,421,748 | ||||||
|
|
|
|
|
|||||
| Total deposits |
1,841,338 | 1,873,259 | ||||||
| Securities sold under agreements to repurchase |
98,005 | 138,614 | ||||||
| FHLB borrowings |
65,000 | 65,000 | ||||||
| Other borrowings |
15,708 | 15,756 | ||||||
| Interest, taxes, and other liabilities |
27,290 | 26,630 | ||||||
|
|
|
|
|
|||||
| Total liabilities |
2,047,341 | 2,119,259 | ||||||
| Stockholders’ equity |
||||||||
| Preferred stock, undesignated par value; 1,000,000 shares authorized; Series A Noncumulative Convertible Preferred Stock, $0.01 par value; 25,000 shares authorized; none outstanding |
— | — | ||||||
| Common stock, $1 par value; 50,000,000 shares authorized; 21,381,779 shares issued at December 31, 2016 and 2015, including 4,387,571 and 3,283,638 shares in treasury, respectively |
21,382 | 21,382 | ||||||
| Additional paid-in capital |
228,142 | 227,692 | ||||||
| Retained earnings |
170,377 | 155,647 | ||||||
| Treasury stock |
(78,833 | ) | (56,457 | ) | ||||
| Accumulated other comprehensive loss |
(2,011 | ) | (5,247 | ) | ||||
|
|
|
|
|
|||||
| Total stockholders’ equity |
339,057 | 343,017 | ||||||
|
|
|
|
|
|||||
| Total liabilities and stockholders’ equity |
$ | 2,386,398 | $ | 2,462,276 | ||||
|
|
|
|
|
|||||
See Notes to Consolidated Financial Statements.
59
Table of Contents
FIRST COMMUNITY BANCSHARES, INC.
CONSOLIDATED STATEMENTS OF INCOME
| Year Ended December 31, | ||||||||||||
| (Amounts in thousands, except share and per share data) | 2016 | 2015 | 2014 | |||||||||
| Interest income |
||||||||||||
| Interest and fees on loans |
$ | 87,718 | $ | 87,632 | $ | 95,492 | ||||||
| Interest on securities — taxable |
3,229 | 4,225 | 5,975 | |||||||||
| Interest on securities — tax-exempt |
3,624 | 3,978 | 4,350 | |||||||||
| Interest on deposits in banks |
153 | 267 | 291 | |||||||||
|
|
|
|
|
|
|
|||||||
| Total interest income |
94,724 | 96,102 | 106,108 | |||||||||
| Interest expense |
||||||||||||
| Interest on deposits |
4,479 | 5,878 | 7,308 | |||||||||
| Interest on short-term borrowings |
2,101 | 1,952 | 2,024 | |||||||||
| Interest on long-term debt |
3,264 | 3,519 | 5,958 | |||||||||
|
|
|
|
|
|
|
|||||||
| Total interest expense |
9,844 | 11,349 | 15,290 | |||||||||
|
|
|
|
|
|
|
|||||||
| Net interest income |
84,880 | 84,753 | 90,818 | |||||||||
| Provision for loan losses |
1,255 | 2,191 | 145 | |||||||||
|
|
|
|
|
|
|
|||||||
| Net interest income after provision for loan losses |
83,625 | 82,562 | 90,673 | |||||||||
| Noninterest income |
||||||||||||
| Wealth management |
2,828 | 2,975 | 3,030 | |||||||||
| Service charges on deposits |
13,588 | 13,717 | 13,828 | |||||||||
| Other service charges and fees |
8,102 | 8,045 | 7,581 | |||||||||
| Insurance commissions |
5,442 | 6,899 | 6,555 | |||||||||
| Impairment losses on securities |
(4,646 | ) | — | (737 | ) | |||||||
| Portion of loss recognized in other comprehensive income |
— | — | — | |||||||||
|
|
|
|
|
|
|
|||||||
| Net impairment losses recognized in earnings |
(4,646 | ) | — | (737 | ) | |||||||
| Net gain (loss) on sale of securities |
335 | 144 | (1,385 | ) | ||||||||
| Net FDIC indemnification asset amortization |
(5,474 | ) | (6,379 | ) | (3,979 | ) | ||||||
| Net gain on divestitures |
3,682 | — | 755 | |||||||||
| Other operating income |
3,209 | 4,129 | 4,355 | |||||||||
|
|
|
|
|
|
|
|||||||
| Total noninterest income |
27,066 | 29,530 | 30,003 | |||||||||
| Noninterest expense |
||||||||||||
| Salaries and employee benefits |
39,912 | 39,625 | 40,713 | |||||||||
| Occupancy expense |
5,297 | 5,817 | 6,338 | |||||||||
| Furniture and equipment expense |
4,341 | 5,199 | 4,952 | |||||||||
| Amortization of intangibles |
1,136 | 1,118 | 787 | |||||||||
| FDIC premiums and assessments |
1,383 | 1,513 | 1,672 | |||||||||
| FHLB debt prepayment fees |
— | 1,702 | 5,008 | |||||||||
| Merger, acquisition, and divestiture expense |
730 | 86 | 1,150 | |||||||||
| Other operating expense |
19,947 | 21,111 | 22,242 | |||||||||
|
|
|
|
|
|
|
|||||||
| Total noninterest expense |
72,746 | 76,171 | 82,862 | |||||||||
|
|
|
|
|
|
|
|||||||
| Income before income taxes |
37,945 | 35,921 | 37,814 | |||||||||
| Income tax expense |
12,819 | 11,381 | 12,324 | |||||||||
|
|
|
|
|
|
|
|||||||
| Net income |
25,126 | 24,540 | 25,490 | |||||||||
| Dividends on preferred stock |
— | 105 | 910 | |||||||||
|
|
|
|
|
|
|
|||||||
| Net income available to common shareholders |
$ | 25,126 | $ | 24,435 | $ | 24,580 | ||||||
|
|
|
|
|
|
|
|||||||
| Earnings per common share |
||||||||||||
| Basic |
$ | 1.45 | $ | 1.32 | $ | 1.34 | ||||||
| Diluted |
1.45 | 1.31 | 1.31 | |||||||||
| Cash dividends per common share |
0.60 | 0.54 | 0.50 | |||||||||
| Weighted average shares outstanding |
||||||||||||
| Basic |
17,319,689 | 18,531,039 | 18,406,363 | |||||||||
| Diluted |
17,365,524 | 18,727,464 | 19,483,054 | |||||||||
See Notes to Consolidated Financial Statements.
60
Table of Contents
FIRST COMMUNITY BANCSHARES, INC
CONSOLIDATED STATEMENTS OF COMPREHENSIVE INCOME (LOSS)
| Year Ended December 31, | ||||||||||||
| (Amounts in thousands) | 2016 | 2015 | 2014 | |||||||||
| Net income |
$ | 25,126 | $ | 24,540 | $ | 25,490 | ||||||
| Other comprehensive income, before tax |
||||||||||||
| Available-for-sale securities |
||||||||||||
| Change in net unrealized losses on securities with other-than-temporary impairment |
— | — | (1 | ) | ||||||||
| Change in net unrealized gains on securities without other-than-temporary impairment |
1,035 | 755 | 12,914 | |||||||||
| Reclassification adjustment for net (gains) losses recognized in net income |
(335 | ) | (144 | ) | 1,385 | |||||||
| Reclassification adjustment for other-than-temporary impairment losses recognized in net income |
4,646 | — | 737 | |||||||||
|
|
|
|
|
|
|
|||||||
| Net unrealized gains on available-for-sale securities |
5,346 | 611 | 15,035 | |||||||||
| Employee benefit plans |
||||||||||||
| Net actuarial loss |
(367 | ) | (363 | ) | (642 | ) | ||||||
| Plan change |
(69 | ) | — | — | ||||||||
| Reclassification adjustment for amortization of prior service cost and net actuarial loss recognized in net income |
273 | 326 | 260 | |||||||||
|
|
|
|
|
|
|
|||||||
| Net unrealized losses on employee benefit plans |
(163 | ) | (37 | ) | (382 | ) | ||||||
|
|
|
|
|
|
|
|||||||
| Other comprehensive income, before tax |
5,183 | 574 | 14,653 | |||||||||
| Income tax expense |
(1,947 | ) | (216 | ) | (5,518 | ) | ||||||
|
|
|
|
|
|
|
|||||||
| Other comprehensive income, net of tax |
3,236 | 358 | 9,135 | |||||||||
|
|
|
|
|
|
|
|||||||
| Total comprehensive income |
$ | 28,362 | $ | 24,898 | $ | 34,625 | ||||||
|
|
|
|
|
|
|
|||||||
See Notes to Consolidated Financial Statements.
61
Table of Contents
FIRST COMMUNITY BANCSHARES, INC.
CONSOLIDATED STATEMENTS OF CHANGES IN STOCKHOLDERS’ EQUITY
| (Amounts in thousands, except share and per share data) |
Preferred Stock |
Common Stock |
Additional Paid-in Capital |
Retained Earnings |
Treasury Stock |
Accumulated Other Comprehensive Income (Loss) |
Total | |||||||||||||||||||||
| Balance January 1, 2014 |
$ | 15,251 | $ | 20,493 | $ | 215,663 | $ | 125,826 | $ | (33,887 | ) | $ | (14,740 | ) | $ | 328,606 | ||||||||||||
| Net income |
— | — | — | 25,490 | — | — | 25,490 | |||||||||||||||||||||
| Other comprehensive income |
— | — | — | — | — | 9,135 | 9,135 | |||||||||||||||||||||
| Common dividends declared — $0.50 per share |
— | — | — | (9,200 | ) | — | — | (9,200 | ) | |||||||||||||||||||
| Preferred dividends declared — $60.00 per share |
— | — | — | (910 | ) | — | — | (910 | ) | |||||||||||||||||||
| Preferred stock converted to common stock — 6,900 shares |
(100 | ) | 7 | 93 | — | — | — | — | ||||||||||||||||||||
| Equity-based compensation expense |
— | — | 332 | — | — | — | 332 | |||||||||||||||||||||
| Common stock options exercised — 3,854 shares |
— | — | (13 | ) | — | 66 | — | 53 | ||||||||||||||||||||
| Restricted stock awards — 13,933 shares |
— | — | (202 | ) | — | 238 | — | 36 | ||||||||||||||||||||
| Purchase of treasury shares — 132,773 shares at $16.29 per share |
— | — | — | — | (2,168 | ) | — | (2,168 | ) | |||||||||||||||||||
|
|
|
|
|
|
|
|
|
|
|
|
|
|
|
|||||||||||||||
| Balance December 31, 2014 |
$ | 15,151 | $ | 20,500 | $ | 215,873 | $ | 141,206 | $ | (35,751 | ) | $ | (5,605 | ) | $ | 351,374 | ||||||||||||
|
|
|
|
|
|
|
|
|
|
|
|
|
|
|
|||||||||||||||
| Balance January 1, 2015 |
$ | 15,151 | $ | 20,500 | $ | 215,873 | $ | 141,206 | $ | (35,751 | ) | $ | (5,605 | ) | $ | 351,374 | ||||||||||||
| Net income |
— | — | — | 24,540 | — | — | 24,540 | |||||||||||||||||||||
| Other comprehensive income |
— | — | — | — | — | 358 | 358 | |||||||||||||||||||||
| Common dividends declared — $0.54 per share |
— | — | — | (9,994 | ) | — | — | (9,994 | ) | |||||||||||||||||||
| Preferred dividends declared — $15.00 per share |
— | — | — | (105 | ) | — | — | (105 | ) | |||||||||||||||||||
| Preferred stock converted to common stock — 882,096 shares |
(12,784 | ) | 882 | 11,902 | — | — | — | — | ||||||||||||||||||||
| Redemption of preferred stock — 2,367 shares |
(2,367 | ) | — | — | — | — | — | (2,367 | ) | |||||||||||||||||||
| Equity-based compensation expense |
— | — | 110 | — | — | — | 110 | |||||||||||||||||||||
| Common stock options exercised — 4,323 shares |
— | — | (11 | ) | — | 74 | — | 63 | ||||||||||||||||||||
| Restricted stock awards — 23,057 shares |
— | — | (191 | ) | — | 391 | — | 200 | ||||||||||||||||||||
| Issuance of treasury stock to 401(k) plan — 20,745 shares |
— | — | 9 | — | 354 | — | 363 | |||||||||||||||||||||
| Purchase of treasury shares — 1,238,299 shares at $17.35 per share |
— | — | — | — | (21,525 | ) | — | (21,525 | ) | |||||||||||||||||||
|
|
|
|
|
|
|
|
|
|
|
|
|
|
|
|||||||||||||||
| Balance December 31, 2015 |
$ | — | $ | 21,382 | $ | 227,692 | $ | 155,647 | $ | (56,457 | ) | $ | (5,247 | ) | $ | 343,017 | ||||||||||||
|
|
|
|
|
|
|
|
|
|
|
|
|
|
|
|||||||||||||||
| Balance January 1, 2016 |
$ | — | $ | 21,382 | $ | 227,692 | $ | 155,647 | $ | (56,457 | ) | $ | (5,247 | ) | $ | 343,017 | ||||||||||||
| Net income |
— | — | — | 25,126 | — | — | 25,126 | |||||||||||||||||||||
| Other comprehensive income |
— | — | — | — | — | 3,236 | 3,236 | |||||||||||||||||||||
| Common dividends declared — $0.60 per share |
— | — | — | (10,396 | ) | — | — | (10,396 | ) | |||||||||||||||||||
| Equity-based compensation expense |
— | — | 209 | — | — | — | 209 | |||||||||||||||||||||
| Common stock options exercised — 43,463 shares |
— | — | 146 | — | 775 | — | 921 | |||||||||||||||||||||
| Restricted stock awards — 16,680 shares |
— | — | 32 | — | 290 | — | 322 | |||||||||||||||||||||
| Issuance of treasury stock to 401(k) plan — 18,218 shares |
— | — | 63 | — | 321 | — | 384 | |||||||||||||||||||||
| Purchase of treasury shares — 1,182,294 shares at $20.06 per share |
— | — | — | — | (23,762 | ) | — | (23,762 | ) | |||||||||||||||||||
|
|
|
|
|
|
|
|
|
|
|
|
|
|
|
|||||||||||||||
| Balance December 31, 2016 |
$ | — | $ | 21,382 | $ | 228,142 | $ | 170,377 | $ | (78,833 | ) | $ | (2,011 | ) | $ | 339,057 | ||||||||||||
|
|
|
|
|
|
|
|
|
|
|
|
|
|
|
|||||||||||||||
See Notes to Consolidated Financial Statements.
62
Table of Contents
FIRST COMMUNITY BANCSHARES, INC.
CONSOLIDATED STATEMENTS OF CASH FLOWS
| Year Ended December 31, | ||||||||||||
| (Amounts in thousands) | 2016 | 2015 | 2014 | |||||||||
| Operating activities |
||||||||||||
| Net income |
$ | 25,126 | $ | 24,540 | $ | 25,490 | ||||||
| Adjustments to reconcile net income to net cash provided by operating activities |
||||||||||||
| Provision for loan losses |
1,255 | 2,191 | 145 | |||||||||
| Depreciation and amortization of property, plant, and equipment |
3,563 | 4,135 | 4,405 | |||||||||
| Amortization of premiums on investments, net |
1,066 | 1,375 | 961 | |||||||||
| Amortization of FDIC indemnification asset, net |
5,474 | 6,379 | 3,979 | |||||||||
| Amortization of intangible assets |
1,136 | 1,118 | 787 | |||||||||
| Accretion on acquired loans |
(4,766 | ) | (7,109 | ) | (9,645 | ) | ||||||
| Gain on divestiture, net |
(3,682 | ) | — | (755 | ) | |||||||
| Gain on sale of loans, net |
— | (501 | ) | (671 | ) | |||||||
| Equity-based compensation expense |
209 | 110 | 332 | |||||||||
| Restricted stock awards |
322 | 200 | 36 | |||||||||
| Issuance of treasury stock to 401(k) plan |
384 | 363 | — | |||||||||
| Loss (gain) on sale of property, plant, and equipment, net |
238 | 23 | (113 | ) | ||||||||
| Loss on sale of other real estate |
1,495 | 3,002 | 3,227 | |||||||||
| (Gain) loss on sale of securities |
(335 | ) | (144 | ) | 1,385 | |||||||
| Net impairment losses recognized in earnings |
4,646 | — | 737 | |||||||||
| FHLB debt prepayment fees |
— | 1,702 | 5,008 | |||||||||
| Proceeds from sale of mortgage loans |
— | 21,993 | 28,443 | |||||||||
| Originations of mortgage loans |
— | (19,700 | ) | (28,681 | ) | |||||||
| Decrease in accrued interest receivable |
454 | 308 | 1,206 | |||||||||
| Decrease in other operating activities |
6,503 | 18,534 | 5,413 | |||||||||
|
|
|
|
|
|
|
|||||||
| Net cash provided by operating activities |
43,088 | 58,519 | 41,689 | |||||||||
| Investing activities |
||||||||||||
| Proceeds from sale of securities available for sale |
104,928 | 10,999 | 162,443 | |||||||||
| Proceeds from maturities, prepayments, and calls of securities available for sale |
99,906 | 29,931 | 48,915 | |||||||||
| Proceeds from maturities and calls of securities held to maturity |
25,190 | 190 | 190 | |||||||||
| Payments to acquire securities available for sale |
(1,174 | ) | (81,540 | ) | (6,047 | ) | ||||||
| Payments to acquire securities held to maturity |
— | (15,003 | ) | (57,675 | ) | |||||||
| Originations of loans, net |
(159,243 | ) | (24,719 | ) | (64,115 | ) | ||||||
| Proceeds from FHLB stock, net |
130 | 1,279 | 4,349 | |||||||||
| Cash proceeds from (paid in) mergers, acquisitions, and divestitures, net (See Note 2) |
29,716 | (88 | ) | 178,604 | ||||||||
| Proceeds from the FDIC |
4,403 | 2,683 | 4,770 | |||||||||
| Payments to acquire property, plant, and equipment, net |
(793 | ) | (1,239 | ) | (1,098 | ) | ||||||
| Proceeds from sale of other real estate |
7,147 | 6,722 | 10,619 | |||||||||
|
|
|
|
|
|
|
|||||||
| Net cash provided by (used in) investing activities |
110,210 | (70,785 | ) | 280,955 | ||||||||
| Financing activities |
||||||||||||
| (Decrease) increase in noninterest-bearing deposits, net |
(17,482 | ) | 33,782 | 68,246 | ||||||||
| Decrease in interest-bearing deposits, net |
(37,576 | ) | (161,282 | ) | (121,912 | ) | ||||||
| Decrease in federal funds purchased |
— | — | (16,000 | ) | ||||||||
| (Repayments of) proceeds from securities sold under agreements to repurchase, net |
(40,609 | ) | 16,872 | 3,432 | ||||||||
| Repayments of FHLB and other borrowings, net |
(48 | ) | (28,945 | ) | (63,097 | ) | ||||||
| Redemption of preferred stock |
— | (2,367 | ) | — | ||||||||
| Proceeds from stock options exercised |
921 | 63 | 53 | |||||||||
| Excess tax benefit from equity-based compensation |
174 | 8 | 5 | |||||||||
| Payments for repurchase of treasury stock |
(23,762 | ) | (21,525 | ) | (2,168 | ) | ||||||
| Payments of common dividends |
(10,396 | ) | (9,994 | ) | (9,200 | ) | ||||||
| Payments of preferred dividends |
— | (219 | ) | (910 | ) | |||||||
|
|
|
|
|
|
|
|||||||
| Net cash used in financing activities |
(128,778 | ) | (173,607 | ) | (141,551 | ) | ||||||
|
|
|
|
|
|
|
|||||||
| Net increase (decrease) in cash and cash equivalents |
24,520 | (185,873 | ) | 181,093 | ||||||||
| Cash and cash equivalents at beginning of period |
51,787 | 237,660 | 56,567 | |||||||||
|
|
|
|
|
|
|
|||||||
| Cash and cash equivalents at end of period |
$ | 76,307 | $ | 51,787 | $ | 237,660 | ||||||
|
|
|
|
|
|
|
|||||||
| Supplemental disclosure — cash flow information |
||||||||||||
| Cash paid for interest |
$ | 9,845 | $ | 11,757 | $ | 15,791 | ||||||
| Cash paid for income taxes |
6,588 | 6,900 | 12,552 | |||||||||
| Supplemental transactions — noncash items |
||||||||||||
| Transfer of loans to other real estate |
5,162 | 6,317 | 12,620 | |||||||||
| Loans originated to finance other real estate |
57 | 649 | 671 | |||||||||
See Notes to Consolidated Financial Statements.
63
Table of Contents
FIRST COMMUNITY BANCSHARES, INC.
NOTES TO CONSOLIDATED FINANCIAL STATEMENTS
| Note 1. | Basis of Presentation and Significant Accounting Policies |
Basis of Presentation
First Community Bancshares, Inc. (the “Company”) is a financial holding company headquartered in Bluefield, Virginia that provides banking products and services to individuals and commercial customers through its wholly owned subsidiary First Community Bank (the “Bank”). The Bank offers insurance products and services through First Community Insurance Services (“FCIS”) and trust and wealth management services through its Trust Division and wholly owned subsidiary First Community Wealth Management. Unless the context suggests otherwise, the term “Company” refers to First Community Bancshares, Inc. and its subsidiaries as a consolidated entity.
Principles of Consolidation
The Company’s accounting and reporting policies conform with U.S. generally accepted accounting principles (“GAAP”) and prevailing practices in the banking industry. The consolidated financial statements include all accounts of the Company and its wholly owned subsidiaries and eliminate all intercompany balances and transactions. The Company operates in one business segment, Community Banking, which consists of all operations, including commercial and consumer banking, lending activities, wealth management, and insurance services.
The Company maintains investments in variable interest entities (“VIEs”). VIEs are legal entities in which equity investors do not have sufficient equity at risk for the entity to independently finance its activities, or as a group, the holders of the equity investment at risk lack the power through voting or similar rights to direct the activities of the entity that most significantly impact its economic performance, or do not have the obligation to absorb the expected losses of the entity or the right to receive expected residual returns of the entity. Consolidation of a VIE is required if a reporting entity is the primary beneficiary of the VIE. The Company periodically reviews its VIEs and has determined that it is not the primary beneficiary of any VIE; therefore, the assets and liabilities of these entities are not consolidated into the financial statements.
Use of Estimates
Preparation of the consolidated financial statements in conformity with GAAP requires management to make estimates and assumptions that affect the reported amounts of assets and liabilities as of the date of the balance sheet and reported amounts of revenues and expenses during the reporting period. Actual results could differ from those estimates. Material estimates that require the most subjective or complex judgments relate to fair value measurements, investment securities, the allowance for loan losses, the Federal Deposit Insurance Corporation (“FDIC”) indemnification asset, goodwill and other intangible assets, and income taxes.
Reclassification
Certain amounts reported in prior years have been reclassified to conform to the current year’s presentation. These reclassifications had no effect on the Company’s results of operations, financial position, or cash flow.
Summary of Significant Accounting Policies
Fair Value Measurements
Fair value is defined as the price that would be received to sell an asset or paid to transfer a liability, in the principal or most advantageous market for the asset or liability, in an orderly transaction between market participants. Market participants are buyers and sellers in the principal market that are independent,
64
Table of Contents
FIRST COMMUNITY BANCSHARES, INC.
NOTES TO CONSOLIDATED FINANCIAL STATEMENTS – (Continued)
knowledgeable, able to transact, and willing to transact. The fair value hierarchy ranks the inputs used in measuring fair value as follows:
| • | Level 1 – Observable, unadjusted quoted prices in active markets |
| • | Level 2 – Inputs other than quoted prices included in Level 1 that are directly or indirectly observable for the asset or liability |
| • | Level 3 – Unobservable inputs with little or no market activity that require the Company to use reasonable inputs and assumptions |
These valuation methodologies are applied to all the Company’s assets and liabilities carried at fair value. Methodologies used to determine fair value might be highly subjective and judgmental in nature. The Company may record adjustments to certain financial assets and liabilities on a recurring basis. The Company may be required to record certain assets at fair value on a nonrecurring basis in specific circumstances, such as evidence of impairment. If the Company determines that a valuation technique change is necessary, the change is assumed to have occurred at the end of the respective reporting period.
Cash and Cash Equivalents
Cash and cash equivalents include cash and due from banks, federal funds sold, and interest-bearing balances on deposit with the Federal Home Loan Bank (“FHLB”), the Federal Reserve Bank (“FRB”), and correspondent banks that are available for immediate withdrawal.
Investment Securities
Management classifies debt and marketable equity securities as held-to-maturity or available-for-sale based on the intent and ability to hold the securities to maturity. Debt securities that the Company has the intent and ability to hold to maturity are classified as held-to-maturity securities and carried at amortized cost. Debt securities not classified as held to maturity and marketable equity securities are classified as available-for-sale securities and carried at estimated fair value. Available-for-sale securities consist of securities the Company intends to hold for indefinite periods of time including securities to be used as part of the Company’s asset/liability management strategy and securities that may be sold in response to changes in interest rates, prepayment risk, or other similar factors. Unrealized gains and losses on available-for-sale securities are included in accumulated other comprehensive income (“AOCI”), net of income taxes, in stockholders’ equity. Gains or losses on calls, maturities, or sales of investment securities are recorded based on the specific identification method and included in noninterest income. Premiums and discounts are amortized or accreted over the life of a security into interest income. Nonmarketable equity investments are reported in other assets. The Company performs extensive quarterly reviews of held-to-maturity and available-for-sale securities to determine if unrealized losses are temporary or other than temporary. If the security is deemed to have other-than-temporary impairment (“OTTI”), the amount representing the credit loss is recognized as a charge to noninterest income and the amount representing all other factors is recognized in other comprehensive income (“OCI”).
Nonmarketable Equity Investments
As a condition of membership in the FHLB and the FRB, the Company is required to hold a minimum level of stock in the FHLB of Atlanta and the FRB of Richmond. These nonmarketable securities are carried at cost and periodically reviewed for impairment. When evaluating these investments, managements considers publicly available information about the profitability and asset quality of the issuer, dividend payment history, and redemption experience in determining the recoverability of the investment. The investment in FHLB and FRB stock was $10.60 million as of December 31, 2016, and $10.73 million as of December 31, 2015.
65
Table of Contents
FIRST COMMUNITY BANCSHARES, INC.
NOTES TO CONSOLIDATED FINANCIAL STATEMENTS – (Continued)
Other Investments
The Company has certain long-term investments that are considered VIEs, including its subsidiary FCBI Capital Trust (the “Trust”), certain tax credit limited partnerships, and various limited liability companies that manage real estate investments, facilitate tax credits, and provide title insurance and other related financial services. The Company uses the equity method of accounting if it is able to exercise significant influence over the entity and records its share of the entity’s earnings or losses in noninterest income. The Company uses the cost method of accounting if it is not able to exercise significant influence over the entity. There were no equity investments as of December 31, 2016, or December 31, 2015. The carrying value and maximum potential loss exposure of VIEs totaled $1.14 million as of December 31, 2016, and $934 thousand as of December 31, 2015.
Business Combinations
The Company accounts for business combinations using the acquisition method of accounting as outlined in using Topic 805 of the Financial Accounting Standards Board’s (“FASB”) Accounting Standards Codification (“ASC”). Under this method, all identifiable assets acquired, including purchased loans, and liabilities assumed are recorded at fair value. Any excess of the purchase price over the fair value of net assets acquired is recorded as goodwill. In instances where the price of the acquired business is less than the net assets acquired, a gain on the purchase is recorded. Fair values are assigned based on quoted prices for similar assets, if readily available, or appraisals by qualified independent parties for relevant asset and liability categories. Certain financial assets and liabilities are valued using discount models that apply current discount rates to streams of cash flow. Valuation methods require assumptions, which can result in alternate valuations, varying levels of goodwill or bargain purchase gains, or amortization expense or accretion income. Management must make estimates for the useful or economic lives of certain acquired assets and liabilities that are used to establish the amortization or accretion of some intangible assets and liabilities, such as core deposits. Fair values are subject to refinement for up to one year after the closing date of the acquisition as additional information about the closing date fair values becomes available. Acquisition and divestiture activities are included in the Company’s consolidated results of operations from the closing date of the transaction. Acquisition and divestiture related costs are recognized in noninterest expense as incurred. For additional information, see “Purchased Credit Impaired Loans” and “Intangible Assets” below.
Loans Held for Investment
Loans classified as held for investment are originated with the intent to hold indefinitely, until maturity, or until pay-off. Loans held for investment are carried at the principal amount outstanding, net of unearned income and any necessary write-downs to reduce individual loans to net realizable value. Interest income on performing loans is recognized as interest income at the contractual rate of interest. Loan origination fees, including loan commitment and underwriting fees, are reduced by direct costs associated with loan processing, including salaries, legal review, and appraisal fees. Net deferred loan fees are deferred and amortized over the life of the related loan or commitment period.
Purchased Performing Loans. Purchased loans that are deemed to be performing at the acquisition date are accounted for using the contractual cash flow method of accounting, which results in the loans being recorded at fair value with a credit discount. The fair value discount is accreted as an adjustment to yield over the estimated contractual lives of the loans. No allowance for loan losses is recorded at acquisition for purchased loans because the fair values of the acquired loans incorporate credit risk assumptions.
Purchased Credit Impaired (“PCI”) Loans. When purchased loans exhibit evidence of credit deterioration after the acquisition date, and it is probable at acquisition the Company will not collect all contractually required principal and interest payments, the loans are referred to as PCI loans. PCI loans are accounted for using Topic
66
Table of Contents
FIRST COMMUNITY BANCSHARES, INC.
NOTES TO CONSOLIDATED FINANCIAL STATEMENTS – (Continued)
310-30 of the FASB ASC, formerly the American Institute of Certified Public Accountants’ Statement of Position 03-3, “Accounting for Certain Loans or Debt Securities Acquired in a Transfer.” PCI loans are initially measured at fair value, which includes estimated future credit losses expected to be incurred over the life of the loans. Per the guidance, the Company groups PCI loans that have common risk characteristics into loan pools. Evidence of credit quality deterioration at acquisition may include measures such as nonaccrual status, credit scores, declines in collateral value, current loan to value percentages, and days past due. The Company considers expected prepayments and estimates the amount and timing of expected principal, interest, and other cash flows for each loan or pool of loans identified as credit impaired. If contractually required payments at acquisition exceed cash flows expected to be collected, the excess is the non-accretable difference, which is available to absorb credit losses on those loans or pools of loans. If the cash flows expected at acquisition exceed the estimated fair values, the excess is the accretable yield, which is recognized in interest income over the remaining lives of those loans or pools of loans when there is a reasonable expectation about the amount and timing of such cash flows.
Impaired Loans and Nonperforming Assets. The Company maintains an active and robust problem credit identification system through its ongoing credit review function. When a credit is identified as exhibiting characteristics of weakening, the Company assesses the credit for potential impairment. Loans are considered impaired when, in the opinion of management and based on current information and events, the collection of principal and interest payments due under the contractual terms of the loan agreements are uncertain. The Company conducts quarterly reviews of loans with balances of $250 thousand or greater that are deemed to be impaired. Factors considered in determining impairment include, but are not limited to, the borrower’s cash flow and capacity for debt repayment, the valuation of collateral, historical loss percentages, and economic conditions. Impairment allowances allocated to individual loans, including individual credit relationships and loan pools grouped by similar risk characteristics, are reviewed quarterly by management. Interest income realized on impaired loans in nonaccrual status, if any, is recognized upon receipt. The accrual of interest, which is based on the daily amount of principal outstanding, on impaired loans is generally continued unless the loan becomes delinquent 90 days or more.
Loans are considered past due when either principal or interest payments become contractually delinquent by 30 days or more. The Company’s policy is to discontinue the accrual of interest, if warranted, on loans based on the payment status, evaluation of the related collateral, and the financial strength of the borrower. Loans that are 90 days or more past due are placed on nonaccrual status. Management may elect to continue the accrual of interest when the loan is well secured and in process of collection. When interest accruals are discontinued, interest accrued and not collected in the current year is reversed from income, and interest accrued and not collected from prior years is charged to the allowance for loan losses. Nonaccrual loans may be returned to accrual status when all principal and interest amounts contractually due, including past due payments, are brought current; the ability of the borrower to repay the obligation is reasonably assured; and there is generally a period of at least six months of repayment performance by the borrower in accordance with the contractual terms.
Seriously delinquent loans are evaluated for loss mitigation options, including charge-off. Closed-end retail loans are generally charged off against the allowance for loan losses when the loans become 120 days past due. Open-end retail loans and residential real estate secured loans are generally charged off when the loans become 180 days past due. Unsecured loans are generally charged off when the loans become 90 days past due. All other loans are charged off against the allowance for loan losses after collection attempts have been exhausted, which generally is within 120 days. Recoveries of loans previously charged off are credited to the allowance for loan losses in the period received.
Loans are considered troubled debt restructurings (“TDRs”) when the Company grants concessions, for legal or economic reasons, to borrowers experiencing financial difficulty that would not otherwise be considered. The
67
Table of Contents
FIRST COMMUNITY BANCSHARES, INC.
NOTES TO CONSOLIDATED FINANCIAL STATEMENTS – (Continued)
Company generally makes concessions in interest rates, loan terms, and/or amortization terms. All TDRs $250 thousand or greater are evaluated for a specific reserve based on either the collateral or net present value method, whichever is most applicable. TDRs under $250 thousand are subject to the reserve calculation for classified loans based primarily on the historical loss rate. At the date of modification, nonaccrual loans are classified as nonaccrual TDRs. TDRs classified as nonperforming at the date of modification are returned to performing status after six months of satisfactory payment performance; however, these loans remain identified as impaired until full payment or other satisfaction of the obligation occurs.
Other real estate owned (“OREO”) acquired through foreclosure, or other settlement, is carried at the lower of cost or fair value less estimated selling costs. The fair value is generally based on current third-party appraisals. When a property is transferred into OREO, any excess of the loan balance over the net realizable fair value is charged against the allowance for loan losses. Operating expenses, gains, and losses on the sale of OREO are included in other noninterest expense in the Company’s consolidated statements of income after any fair value write-downs are recorded as valuation adjustments.
Allowance for Loan Losses
Management performs quarterly assessments of the allowance for loan losses. The allowance is increased by provisions charged to operations and reduced by net charge-offs. The provision is calculated and charged to earnings to bring the allowance to a level that, through a systematic process of measurement, reflects the amount management estimates is needed to absorb probable losses in the portfolio. The Company’s allowance for loan losses is segmented into commercial, consumer real estate, and consumer and other loans with each segment divided into classes with similar characteristics, such as the type of loan and collateral. The allowance for loan losses includes specific allocations related to significant individual loans and credit relationships and general reserves related to loans not individually evaluated. Loans not individually evaluated are grouped into pools based on similar risk characteristics. A loan that becomes adversely classified or graded is moved into a group of adversely classified or graded loans with similar risk characteristics for evaluation. A provision for loan losses is recorded for any credit deterioration in purchased performing loans after the acquisition date.
PCI loans are grouped into pools and evaluated separately from the non-PCI portfolio. The Company estimates cash flows to be collected on PCI loans and discounts those cash flows at a market rate of interest. If cash flows for PCI loans are expected to decline, generally a provision for loan losses is charged to earnings, resulting in an increase to the allowance for loan losses. If cash flows for PCI loans are expected to improve, any previously established allowance is first reversed to the extent of prior charges and then interest income is increased using the prospective yield adjustment over the remaining life of the loan, or pool of loans. Any provision established for PCI loans covered under the FDIC loss share agreements is offset by an adjustment to the FDIC indemnification asset to reflect the indemnified portion, 80%, of the post-acquisition exposure. While allocations are made to various portfolio segments, the allowance for loan losses is available for use against any loan loss management deems appropriate, excluding reserves allocated to specific loans and PCI loan pools.
FDIC Indemnification Asset
The FDIC indemnification asset represents the carrying amount of the right to receive payments from the FDIC for losses incurred on certain loans and OREO purchased from the FDIC that are covered by loss share agreements. The FDIC indemnification asset is measured separately from related covered assets because it is not contractually embedded in the assets or transferable should the assets be disposed. Under the acquisition method of accounting, the FDIC indemnification asset is recorded at fair value using projected cash flows based on expected reimbursements and applicable loss share percentages as outlined in the loss share agreements. The expected reimbursements do not include reimbursable amounts related to future covered expenditures. The cash
68
Table of Contents
FIRST COMMUNITY BANCSHARES, INC.
NOTES TO CONSOLIDATED FINANCIAL STATEMENTS – (Continued)
flows are discounted to reflect the timing and receipt of reimbursements from the FDIC. The discount is accreted through noninterest income over future periods. Post-acquisition adjustments to the indemnification asset are measured on the same basis as the underlying covered assets. Increases in the cash flows of covered loans reduce the FDIC indemnification asset balance, which is recognized as amortization through noninterest income over the shorter of the remaining life of the FDIC indemnification asset or the underlying loans. Decreases in the cash flows of covered loans increase the FDIC indemnification asset balance, which is recognized as accretion through noninterest income.
Premises and Equipment
Premises, equipment, and capital leases are stated at cost less accumulated depreciation and amortization. Depreciation and amortization are computed using the straight-line method over the estimated useful lives of the respective assets. Useful lives range from 5 to 10 years for furniture, fixtures, and equipment; 3 to 5 years for software, hardware, and data handling equipment; and 10 to 40 years for buildings and building improvements. Land improvements are amortized over a period of 20 years and leasehold improvements are amortized over the lesser of the term of the respective leases plus the first optional renewal period, when renewal is reasonably assured, or the estimated useful lives of the improvements. The Company leases various properties within its branch network. Leases generally have initial terms of up to 20 years and most contain options to renew with reasonable increases in rent. All leases are accounted for as operating leases. Maintenance and repairs are charged to current operations while improvements that extend the economic useful life of the underlying asset are capitalized. Disposition gains and losses are reflected in current operations.
Intangible Assets
Intangible assets consist of goodwill, core deposit intangible assets, and other identifiable intangible assets that result from business combinations. Goodwill represents the excess of the purchase price over the fair value of net assets acquired that is allocated to the appropriate reporting unit when acquired. Core deposit intangible assets represent the future earnings potential of acquired deposit relationships that are amortized over their estimated remaining useful lives. Other identifiable intangible assets primarily represent the rights arising from contractual arrangements that are amortized using the straight-line method.
Goodwill is tested annually, or more frequently if necessary, using a qualitative assessment to determine if it is more likely than not that the fair value of a reporting unit is less than its carrying amount. If the Company concludes that it is more likely than not that the fair value of a reporting unit is less than its carrying amount, the two-step quantitative goodwill impairment test is performed. Step 1 consists of calculating and comparing the fair value of a reporting unit to its carrying amount, including goodwill. If the fair value of a reporting unit is greater than its book value, no goodwill impairment exists. If the carrying amount of a reporting unit is greater than its calculated fair value, goodwill impairment may exist and Step 2 is required to determine the amount of the impairment loss.
Securities Sold Under Agreements to Repurchase
Securities sold under agreements to repurchase are generally accounted for as collateralized financing transactions and recognized as short-term borrowings in the Company’s consolidated balance sheets. Securities, generally U.S. government and federal agency securities, pledged as collateral under these arrangements can be sold or repledged only if replaced by the secured party. The fair value of the collateral provided to a third party is continually monitored and additional collateral is provided as appropriate.
69
Table of Contents
FIRST COMMUNITY BANCSHARES, INC.
NOTES TO CONSOLIDATED FINANCIAL STATEMENTS – (Continued)
Derivative Instruments
The Company primarily uses derivative instruments to protect against the risk of adverse price or interest rate movements on the value of certain assets and liabilities and on future cash flows. Derivative instruments represent contracts between parties that usually require little or no initial net investment and result in one party delivering cash or another asset to the other party based on a notional amount and an underlying asset as specified in the contract such as interest rates, equity security prices, currencies, commodity prices, or credit spreads. These derivative instruments may consist of interest rate swaps, floors, caps, collars, futures, forward contracts, and written and purchased options. Derivative contracts often involve future commitments to exchange interest payment streams or currencies based on a notional or contractual amount, such as interest rate swaps or currency forwards, or to purchase or sell other financial instruments at specified terms on a specified date, such as options to buy or sell securities or currencies. Derivative instruments are subject to counterparty credit risk due to the possibility that the Company will incur a loss because a counterparty, which may be a bank, a broker-dealer or a customer, fails to meet its contractual obligations. This risk is measured as the expected positive replacement value of contracts. Derivative contracts may be executed only with exchanges or counterparties approved by the Company’s Asset/Liability Management Committee.
If certain conditions are met, a derivative may be designated as a hedge related to fair value, cash flow, or foreign exposure risk. The recognition of changes in the fair value of a derivative instrument varies depending on the intended use of the derivative and the resulting designation. The Company accounts for hedges of customer loans as fair value hedges. The change in fair value of the hedging derivative and the change in fair value of the hedged exposure are recorded in earnings. Any hedge ineffectiveness is also reflected in current earnings. Changes in the fair value of derivatives not designated as hedging instruments are recognized as a gain or loss in earnings. The Company formally documents any relationships between hedging instruments and hedged items and the risk management objective and strategy for undertaking each hedged transaction. All derivative instruments are reported at fair value in the consolidated balance sheets.
Equity-Based Compensation
The cost of employee services received in exchange for equity instruments, including stock options and restricted stock awards , is generally measured at fair value on the grant date. The Black-Scholes valuation model is used to estimate the fair value of stock options at the grant date while the fair value of restricted stock awards is based on the market price of the Company’s common stock on the grant date. The Black-Scholes model incorporates the following assumptions: the expected volatility is based on the weekly historical volatility of the Company’s common stock price over the expected term of the option; the expected term is generally calculated using the shortcut method; the risk-free interest rate is based on the U.S. Department of the Treasury’s (“Treasury”) yield curve on the grant date with a term comparable to the grant; and the dividend yield is based on the Company’s dividend yield using the most recent dividend rate paid per share and trading price of the Company’s common stock. Compensation cost is recognized over the required service period, generally defined as the vesting period for stock option awards and as the restriction period for restricted stock awards. For awards with graded vesting, compensation cost is recognized on a straight-line basis over the requisite service period for the entire award.
Advertising Expenses
Advertising costs are generally expensed as incurred. The Company may establish accruals for expected advertising expenses in the course of a fiscal year.
70
Table of Contents
FIRST COMMUNITY BANCSHARES, INC.
NOTES TO CONSOLIDATED FINANCIAL STATEMENTS – (Continued)
Income Taxes
Income tax expense is comprised of the current and deferred tax consequences of events and transactions already recognized. The Company includes interest and penalties related to income tax liabilities in income tax expense. The effective tax rate, income tax expense as a percent of pre-tax income, may vary significantly from statutory rates due to tax credits and permanent differences. Deferred tax assets and liabilities are recognized for the estimated future tax consequences attributable to differences between the tax bases of assets and liabilities and their carrying amounts for financial reporting purposes. Deferred tax assets and liabilities are adjusted through the provision for income taxes as changes in tax laws or rates are enacted.
Per Share Results
Basic earnings per common share is calculated by dividing net income available to common shareholders by the weighted average number of common shares outstanding during the period. Diluted earnings per common share includes the dilutive effect of potential common stock that could be issued by the Company. Under the treasury stock method of accounting, potential common stock may be issued for stock options, non-vested restricted stock awards, performance based stock awards, and convertible preferred stock. Diluted earnings per common share is calculated by dividing net income by the weighted average number of common shares outstanding for the period plus the number of dilutive potential common shares. The calculation of diluted earnings per common share excludes potential common shares that have an exercise price greater than the average market value of the Company’s common stock because the effect would be antidilutive.
Recent Accounting Standards
Standards Adopted
In January 2017, the FASB issued Accounting Standards Update (“ASU”) 2017-04, “Intangibles – Goodwill and Other (Topic 350): Simplifying the Accounting for Goodwill Impairment.” This ASU removes the requirement to perform a hypothetical purchase price allocation to measure goodwill impairment. A goodwill impairment will now be the amount by which a reporting unit’s carrying value exceeds its fair value, not to exceed the carrying amount of goodwill. ASU 2017-04 is effective for fiscal years beginning after December 15, 2019, with early adoption permitted. The update should be applied prospectively. The Company early adopted ASU 2017-04 in the first quarter of 2017. The adoption of the standard did not have an effect on the Company’s financial statements.
In January 2017, the FASB issued ASU 2017-03, “Accounting Changes and Error Corrections (Topic 250) and Investments – Equity Method and Joint Ventures (Topic 323): Amendments to SEC Paragraphs Pursuant to Staff Announcements at the September 22, 2016 and November 17, 2016 EITF Meetings.” This ASU requires registrants to disclose the effect that recently issued accounting standards will have on their financial statements when adopted in a future period. In cases where a registrant cannot reasonably estimate the impact of the adoption, additional qualitative disclosures should be considered to assist the reader in assessing the significance of the standard’s impact on its financial statements. The Company adopted ASU 2017-03 in the first quarter of 2017. The adoption of the standard resulted in enhanced disclosures regarding the impact that recently issued accounting standards adopted in a future period will have on the Company’s financial statements and disclosures. See “Standards Not Yet Adopted” below.
In September 2015, the FASB issued ASU 2015-16, “Simplifying the Accounting for Measurement Period Adjustments.” This ASU simplifies the accounting for adjustments made to provisional amounts recognized in a business combination by eliminating the requirement to retrospectively account for those adjustments. The Company adopted ASU 2015-16 in the first quarter of 2016. The adoption of the standard did not have an effect on the Company’s financial statements.
71
Table of Contents
FIRST COMMUNITY BANCSHARES, INC.
NOTES TO CONSOLIDATED FINANCIAL STATEMENTS – (Continued)
In February 2015, the FASB issued ASU 2015-02, “Amendments to the Consolidation Analysis.” This ASU changes the analysis that an entity performs to determine whether to consolidate certain legal entities. The Company adopted ASU 2015-02 in the first quarter of 2016. The Company evaluated its investments in VIEs under the guidance and concluded that not consolidating these entities was still appropriate; therefore, the adoption of the standard did not have an effect on the Company’s financial statements.
In June 2014, the FASB issued ASU 2014-12, “Accounting for Share-Based Payments When the Terms of an Award Provide That a Performance Target Could Be Achieved after the Requisite Service Period.” This ASU requires that a performance target that affects vesting and that could be achieved after the requisite service period be treated as a performance condition. An entity should apply guidance in Topic 718 as it relates to awards with performance conditions that affect vesting to account for such awards. As such, the performance target should not be reflected in estimating the grant-date fair value of the award. Compensation cost should be recognized in the period in which it becomes probable that the performance target will be achieved and should represent the compensation cost attributable to the period for which the service has already been rendered. The Company adopted ASU 2014-12 in the first quarter of 2016. The adoption of the standard did not have an effect on the Company’s financial statements.
Standards Not Yet Adopted
In November 2016, the FASB issued ASU 2016-18, “Statement of Cash Flows (Topic 230): Restricted Cash.” This ASU requires that a statement of cash flows explain the change during the period in the total of cash, cash equivalents, and amounts generally described as restricted cash or restricted cash equivalents. Amounts generally described as restricted cash and restricted cash equivalents should be included with cash and cash equivalents when reconciling the beginning-of-period and end-of-period total amounts shown on the statement of cash flows. ASU 2016-18 will be effective for the Company for fiscal years beginning after December 15, 2017. The Company expects to adopt ASU 2016-18 in the first quarter of 2018. The Company is evaluating the impact of the standard and does not expect the guidance to have a material effect on its financial statements.
In August 2016, the FASB issued ASU 2016-15, “Statement of Cash Flows (Topic 230): Classification of Certain Cash Receipts and Cash Payments.” This ASU makes eight targeted changes to how cash receipts and cash payments are presented and classified in the statement of cash flows. ASU 2016-15 will be effective for the Company for the fiscal years beginning after December 15, 2017, with early adoption permitted. The update should be applied on a retrospective basis, if practicable. The Company expects to adopt ASU 2016-15 in the first quarter of 2018. The Company is evaluating the impact of the standard and does not expect the guidance to have a material effect on its financial statements.
In June 2016, the FASB issued ASU 2016-13, “Financial Instruments — Credit Losses (Topic 326): Measurement of Credit Losses on Financial Instruments.” This ASU intends to improve financial reporting by requiring timelier recording of credit losses on loans and other financial instruments held by financial institutions and other organizations. This ASU requires an organization to measure all expected credit losses for financial assets held at the reporting date based on historical experience, current conditions, and reasonable and supportable forecasts and requires enhanced disclosures related to the significant estimates and judgments used in estimating credit losses, as well as the credit quality and underwriting standards of an organization’s portfolio. In addition, the update amends the accounting for credit losses on available-for-sale debt securities and purchased financial assets with credit deterioration. ASU 2016-13 will be effective for the Company for the fiscal years beginning after December 15, 2019, with early adoption permitted for fiscal years beginning after December 15, 2018. The Company expects to adopt ASU 2016-13 in the first quarter of 2020 and recognize a cumulative adjustment to retained earnings as of the beginning of the year of adoption. The Company is evaluating the impact of the standard.
72
Table of Contents
FIRST COMMUNITY BANCSHARES, INC.
NOTES TO CONSOLIDATED FINANCIAL STATEMENTS – (Continued)
In March 2016, the FASB issued ASU 2016-09, “Compensation – Stock Compensation (Topic 718): Improvements to Employee Share-Based Payment Accounting.” This ASU simplifies several aspects of the accounting for share-based payment award transactions including income tax consequences, classification of awards as either equity or liabilities, and classification on the statement of cash flows. ASU 2016-09 will be effective for the Company for fiscal years beginning after December 15, 2016, with early adoption permitted. The Company expects to adopt ASU 2016-09 in the first quarter of 2017. The Company is evaluating the impact of the standard and does not expect the guidance to have a material effect on its financial statements.
In February 2016, the FASB issued ASU 2016-02, “Leases (Topic 842).” This ASU increases transparency and comparability among organizations by recognizing lease assets and lease liabilities on the balance sheet and requiring more disclosures related to leasing transactions. ASU 2016-02 will be effective for the Company for the fiscal years beginning after December 15, 2018, with early adoption permitted. The Company expects to adopt ASU 2016-02 in the first quarter of 2019. The Company is evaluating the impact of the standard and expects a minimal increase in assets and liabilities; however, the Company does not expect the guidance to have a material effect on its financial statements.
In January 2016, the FASB issued ASU 2016-01, “Financial Instruments — Overall (Subtopic 825-10): Recognition and Measurement of Financial Assets and Financial Liabilities.” This ASU significantly revises an entity’s accounting related to (1) the classification and measurement of investments in equity securities and (2) the presentation of certain fair value changes for financial liabilities measured at fair value. The new guidance also amends certain disclosure requirements associated with the fair value of financial instruments. ASU 2016-01 will be effective for the Company for fiscal years beginning after December 15, 2017, with early adoption permitted for the instrument-specific credit risk provision. The Company expects to adopt ASU 2016-01 in the first quarter of 2018. The Company is evaluating the impact of the standard and does not expect to recognize a significant cumulative effect adjustment to retained earnings at the beginning of the year of adoption or expect the guidance to have a material effect on its financial statements. The cumulative-effect adjustment will be dependent on the composition and fair value of the Company’s equity securities portfolio at the adoption date.
In May 2014, the FASB issued ASU 2014-09, “Revenue from Contracts with Customers.” This ASU’s core principle is that an entity will recognize revenue when it transfers promised goods or services to customers in an amount that reflects the consideration to which the company expects to be entitled in exchange for those goods or services. In doing so, companies will need to use more judgment and make more estimates than under existing guidance. These may include identifying performance obligations in the contract, estimating the amount of variable consideration to include in the transaction price and allocating the transaction price to each separate performance obligation. In August 2015, the FASB issued ASU 2015-14, “Revenue from Contracts with Customers” deferring the effective date of ASU 2014-09 for the Company until fiscal years beginning after December 15, 2017, with early adoption permitted for fiscal years beginning after December 15, 2016. Additional revenue related standards to be adopted concurrently with ASU 2014-09 include ASU 2016-20, ASU 2016-12, ASU 2016-10, and ASU 2016-08. The Company expects to adopt ASU 2014-09, and related updates, in the first quarter of 2018 and recognize a cumulative adjustment to retained earnings as of the beginning of the year of adoption. The Company’s primary source of revenue is interest income, which is excluded from the scope of this guidance; however, the Company is evaluating the impact of the standard on other income, which includes fees for services, commissions on sales, and various deposit service charges. The Company does not expect the guidance to have a material effect on its financial statements.
The Company does not expect other recent accounting standards issued by the FASB or other standards-setting bodies to have a material impact on the consolidated financial statements.
73
Table of Contents
FIRST COMMUNITY BANCSHARES, INC.
NOTES TO CONSOLIDATED FINANCIAL STATEMENTS – (Continued)
| Note 2. | Acquisitions and Divestitures |
The following table presents the components of net cash received in, or paid for, acquisitions and divestitures, an investing activity in the Company’s consolidated statements of cash flows, for the periods indicated:
| Year Ended December 31, | ||||||||||||
| (Amounts in thousands) | 2016 | 2015 | 2014 | |||||||||
| Acquisitions |
||||||||||||
| Fair value of assets and liabilities acquired: |
||||||||||||
| Loans |
$ | 149,122 | $ | — | $ | 140 | ||||||
| Premises and equipment |
4,829 | — | 4,547 | |||||||||
| Other assets |
448 | — | 4,563 | |||||||||
| Other intangible assets |
3,842 | — | — | |||||||||
| Deposits |
(134,307 | ) | — | (318,877 | ) | |||||||
| Other liabilities |
(75 | ) | — | (76 | ) | |||||||
| Purchase price in excess of net assets acquired |
2,446 | 88 | 1,721 | |||||||||
|
|
|
|
|
|
|
|||||||
| Total purchase price |
26,305 | 88 | (307,982 | ) | ||||||||
| Non-cash purchase price |
— | — | — | |||||||||
| Cash acquired |
— | — | — | |||||||||
|
|
|
|
|
|
|
|||||||
| Net cash paid (received) in acquisitions |
26,305 | 88 | (307,982 | ) | ||||||||
| Divestitures |
||||||||||||
| Book value of assets sold |
(165,742 | ) | 389 | (83,283 | ) | |||||||
| Book value of liabilities sold |
111,198 | (152 | ) | 215,268 | ||||||||
| Sales price in excess of net liabilities assumed |
(3,682 | ) | (6 | ) | (755 | ) | ||||||
|
|
|
|
|
|
|
|||||||
| Total sales price |
(58,226 | ) | 231 | 131,230 | ||||||||
| Cash sold |
— | — | (1,852 | ) | ||||||||
| Amount due remaining on books |
2,205 | (231 | ) | — | ||||||||
|
|
|
|
|
|
|
|||||||
| Net cash (received) paid in divestitures |
(56,021 | ) | — | 129,378 | ||||||||
|
|
|
|
|
|
|
|||||||
| Net cash (received) paid in acquisitions and divestitures |
$ | (29,716 | ) | $ | 88 | $ | (178,604 | ) | ||||
|
|
|
|
|
|
|
|||||||
Ascension Insurance Agency, Inc.
On October 1, 2016, the Company completed the sale of Greenpoint Insurance Group, Inc. (“Greenpoint”) to Ascension Insurance Agency, Inc. for $7.11 million, including earn-out payments of $2.21 million to be received over the next three years if certain operating targets are met. The divestiture consisted of two North Carolina offices operating as Greenpoint and two Virginia offices operating under the trade name Carr & Hyde Insurance. The Company recorded a net gain of $617 thousand in connection with the divestiture and eliminated $6.49 million in goodwill and other intangible assets. The Company incurred expenses related to the divestiture of $46 thousand in 2016. The transaction did not impact the Company’s in-branch insurance offices operating as FCIS in West Virginia and Virginia.
On October 31, 2015, the Company sold one insurance agency for $372 thousand. The Company recorded a net loss of $8 thousand in connection with the sale and eliminated $385 thousand in goodwill and other intangible assets. In addition, the Company recorded additional goodwill of $88 thousand in 2015 related to contingent earn-out payments from acquisitions that occurred before 2009.
74
Table of Contents
FIRST COMMUNITY BANCSHARES, INC.
NOTES TO CONSOLIDATED FINANCIAL STATEMENTS – (Continued)
First Bank
On July 15, 2016, the Company completed the branch exchange with First Bank, North Carolina, pursuant to which the Bank exchanged a portion of its North Carolina branch network for First Bank’s Virginia branch network. Under the agreements, the Bank simultaneously sold six branches in the Winston-Salem and Mooresville areas of North Carolina and acquired seven branches in Southwestern Virginia. The branch acquisition complements the Company’s 2014 acquisition of seven branches from Bank of America by expanding the Company’s existing presence in Southwest Virginia and affords the opportunity to realize certain operating cost savings.
In connection with the branch exchange, the Company acquired total assets of $160.69 million, including total loans of $149.12 million and goodwill and other intangibles of $6.29 million, and total liabilities of $134.38 million, including total deposits of $134.31 million. The Company did not acquire any PCI loans. The consideration transferred included the net fair value of divested assets and a purchase premium of $3.84 million. The Company divested total assets of $162.17 million, including loans of $155.54 million and goodwill and other intangibles of $2.33 million, and total liabilities of $111.05 million, including deposits of $111.02 million, and received a deposit premium of $4.07 million. In connection with the divestiture, the Company recorded a net gain of $3.07 million. The Company incurred expenses related to the First Bank transaction of $684 thousand in 2016. The estimated fair values, including identifiable intangible assets, are preliminary and subject to refinement for up to one year after the closing date of the acquisition.
CresCom Bank
On December 12, 2014, the Company completed the sale of thirteen branches to CresCom Bank, Charleston, South Carolina. The divestiture consisted of ten branches in the Southeastern, Coastal region of North Carolina and three branches in South Carolina, all of which were previously acquired in the FDIC-assisted acquisition of Waccamaw Bank (“Waccamaw”) on June 8, 2012. At closing, the Company divested total deposits of $215.19 million and total loans of $70.04 million. The transaction excluded loans covered under FDIC loss share agreements. The Company recorded a net gain of $755 thousand in connection with the divestiture, which included a deposit premium of $6.45 million and goodwill allocation of $6.45 million.
Bank of America
On October 24, 2014, the Company completed the acquisition of seven branches from Bank of America, National Association. The acquisition consisted of six branches in Southwestern Virginia and one branch in Central North Carolina. At acquisition, the Company assumed total deposits of $318.88 million for a premium of $5.79 million. No loans were included in the purchase. The Company purchased the real estate, or assumed the leases, associated with the branches.
75
Table of Contents
FIRST COMMUNITY BANCSHARES, INC.
NOTES TO CONSOLIDATED FINANCIAL STATEMENTS – (Continued)
| Note 3. | Investment Securities |
The following tables present the amortized cost and fair value of available-for-sale securities, including gross unrealized gains and losses, as of the dates indicated:
| December 31, 2016 | ||||||||||||||||
| (Amounts in thousands) | Amortized Cost |
Unrealized Gains |
Unrealized Losses |
Fair Value |
||||||||||||
| U.S. Agency securities |
$ | 1,342 | $ | 3 | $ | — | $ | 1,345 | ||||||||
| Municipal securities |
111,659 | 2,258 | (586 | ) | 113,331 | |||||||||||
| Single issue trust preferred securities |
22,104 | — | (2,165 | ) | 19,939 | |||||||||||
| Mortgage-backed Agency securities |
31,290 | 66 | (465 | ) | 30,891 | |||||||||||
| Equity securities |
55 | 18 | — | 73 | ||||||||||||
|
|
|
|
|
|
|
|
|
|||||||||
| Total securities available for sale |
$ | 166,450 | $ | 2,345 | $ | (3,216 | ) | $ | 165,579 | |||||||
|
|
|
|
|
|
|
|
|
|||||||||
| December 31, 2015 | ||||||||||||||||
| (Amounts in thousands) | Amortized Cost |
Unrealized Gains |
Unrealized Losses |
Fair Value |
||||||||||||
| U.S. Agency securities |
$ | 31,414 | $ | 39 | $ | (751 | ) | $ | 30,702 | |||||||
| Municipal securities |
124,880 | 4,155 | (357 | ) | 128,678 | |||||||||||
| Single issue trust preferred securities |
55,882 | — | (8,050 | ) | 47,832 | |||||||||||
| Corporate securities |
70,571 | — | (238 | ) | 70,333 | |||||||||||
| Certificates of deposit |
5,000 | — | — | 5,000 | ||||||||||||
| Mortgage-backed Agency securities |
84,576 | 155 | (1,175 | ) | 83,556 | |||||||||||
| Equity securities |
66 | 6 | — | 72 | ||||||||||||
|
|
|
|
|
|
|
|
|
|||||||||
| Total securities available for sale |
$ | 372,389 | $ | 4,355 | $ | (10,571 | ) | $ | 366,173 | |||||||
|
|
|
|
|
|
|
|
|
|||||||||
76
Table of Contents
FIRST COMMUNITY BANCSHARES, INC.
NOTES TO CONSOLIDATED FINANCIAL STATEMENTS – (Continued)
The following table presents the amortized cost and fair value of available-for-sale securities, by contractual maturity, as of December 31, 2016. Actual maturities could differ from contractual maturities because issuers may have the right to call or prepay obligations with or without penalties.
| (Amounts in thousands) | U.S. Agency Securities |
Municipal Securities |
Corporate Notes | Total | ||||||||||||
| Amortized cost maturity: |
||||||||||||||||
| One year or less |
$ | — | $ | 1,135 | $ | — | $ | 1,135 | ||||||||
| After one year through five years |
1 | 1,035 | — | 1,036 | ||||||||||||
| After five years through ten years |
— | 88,449 | — | 88,449 | ||||||||||||
| After ten years |
1,341 | 21,040 | 22,104 | 44,485 | ||||||||||||
|
|
|
|
|
|
|
|
|
|||||||||
| Amortized cost |
$ | 1,342 | $ | 111,659 | $ | 22,104 | 135,105 | |||||||||
|
|
|
|
|
|
|
|||||||||||
| Mortgage-backed securities |
31,290 | |||||||||||||||
| Equity securities |
55 | |||||||||||||||
|
|
|
|||||||||||||||
| Total amortized cost |
$ | 166,450 | ||||||||||||||
|
|
|
|||||||||||||||
| Fair value maturity: |
||||||||||||||||
| One year or less |
$ | — | $ | 1,141 | $ | — | $ | 1,141 | ||||||||
| After one year through five years |
1 | 1,059 | — | 1,060 | ||||||||||||
| After five years through ten years |
— | 90,360 | — | 90,360 | ||||||||||||
| After ten years |
1,344 | 20,771 | 19,939 | 42,054 | ||||||||||||
|
|
|
|
|
|
|
|
|
|||||||||
| Fair value |
$ | 1,345 | $ | 113,331 | $ | 19,939 | 134,615 | |||||||||
|
|
|
|
|
|
|
|||||||||||
| Mortgage-backed securities |
30,891 | |||||||||||||||
| Equity securities |
73 | |||||||||||||||
|
|
|
|||||||||||||||
| Total fair value |
$ | 165,579 | ||||||||||||||
|
|
|
|||||||||||||||
The following tables present the amortized cost and fair value of held-to-maturity securities, including gross unrealized gains and losses, as of the dates indicated:
| December 31, 2016 | ||||||||||||||||
| (Amounts in thousands) | Amortized Cost |
Unrealized Gains |
Unrealized Losses |
Fair Value |
||||||||||||
| U.S. Agency securities |
$ | 36,741 | $ | 124 | $ | — | $ | 36,865 | ||||||||
| Corporate securities |
10,392 | 11 | (2 | ) | 10,401 | |||||||||||
|
|
|
|
|
|
|
|
|
|||||||||
| Total securities held to maturity |
$ | 47,133 | $ | 135 | $ | (2 | ) | $ | 47,266 | |||||||
|
|
|
|
|
|
|
|
|
|||||||||
| December 31, 2015 | ||||||||||||||||
| (Amounts in thousands) | Amortized Cost |
Unrealized Gains |
Unrealized Losses |
Fair Value |
||||||||||||
| U.S. Agency securities |
$ | 61,863 | $ | 75 | $ | (106 | ) | $ | 61,832 | |||||||
| Municipal securities |
190 | 3 | — | 193 | ||||||||||||
| Corporate securities |
10,488 | — | (23 | ) | 10,465 | |||||||||||
|
|
|
|
|
|
|
|
|
|||||||||
| Total securities held to maturity |
$ | 72,541 | $ | 78 | $ | (129 | ) | $ | 72,490 | |||||||
|
|
|
|
|
|
|
|
|
|||||||||
77
Table of Contents
FIRST COMMUNITY BANCSHARES, INC.
NOTES TO CONSOLIDATED FINANCIAL STATEMENTS – (Continued)
The following table presents the amortized cost and fair value of held-to-maturity securities, by contractual maturity, as of December 31, 2016. Actual maturities could differ from contractual maturities because issuers may have the right to call or prepay obligations with or without penalties.
| (Amounts in thousands) | U.S. Agency Securities |
Corporate Notes | Total | |||||||||
| Amortized cost maturity: |
||||||||||||
| One year or less |
$ | 18,756 | $ | 3,095 | $ | 21,851 | ||||||
| After one year through five years |
17,985 | 7,297 | 25,282 | |||||||||
| After five years through ten years |
— | — | — | |||||||||
| After ten years |
— | — | — | |||||||||
|
|
|
|
|
|
|
|||||||
| Total amortized cost |
$ | 36,741 | $ | 10,392 | $ | 47,133 | ||||||
|
|
|
|
|
|
|
|||||||
| Fair value maturity: |
||||||||||||
| One year or less |
$ | 18,768 | $ | 3,096 | $ | 21,864 | ||||||
| After one year through five years |
18,097 | 7,305 | 25,402 | |||||||||
| After five years through ten years |
— | — | — | |||||||||
| After ten years |
— | — | — | |||||||||
|
|
|
|
|
|
|
|||||||
| Total fair value |
$ | 36,865 | $ | 10,401 | $ | 47,266 | ||||||
|
|
|
|
|
|
|
|||||||
78
Table of Contents
FIRST COMMUNITY BANCSHARES, INC.
NOTES TO CONSOLIDATED FINANCIAL STATEMENTS – (Continued)
The following tables present municipal securities, by state, for the states where the largest volume of these securities are held in the Company’s portfolio. The tables also present the amortized cost and fair value of the municipal securities, including gross unrealized gains and losses, as of the dates indicated.
| December 31, 2016 | ||||||||||||||||||||
| (Amounts in thousands) | Percent of Municipal Portfolio |
Amortized Cost | Unrealized Gains | Unrealized Losses | Fair Value | |||||||||||||||
| New York |
11.66 | % | $ | 12,876 | $ | 334 | $ | — | $ | 13,210 | ||||||||||
| Minnesota |
9.70 | % | 10,796 | 232 | (40 | ) | 10,988 | |||||||||||||
| Wisconsin |
8.66 | % | 9,786 | 74 | (42 | ) | 9,818 | |||||||||||||
| Ohio |
8.50 | % | 9,599 | 125 | (88 | ) | 9,636 | |||||||||||||
| Massachusetts |
8.45 | % | 9,355 | 229 | (10 | ) | 9,574 | |||||||||||||
| New Jersey |
7.14 | % | 7,891 | 202 | — | 8,093 | ||||||||||||||
| Connecticut |
6.90 | % | 7,628 | 190 | — | 7,818 | ||||||||||||||
| Texas |
6.55 | % | 7,397 | 130 | (103 | ) | 7,424 | |||||||||||||
| Iowa |
5.66 | % | 6,467 | 36 | (88 | ) | 6,415 | |||||||||||||
| Other |
26.78 | % | 29,864 | 706 | (215 | ) | 30,355 | |||||||||||||
|
|
|
|
|
|
|
|
|
|
|
|||||||||||
| Total |
100.00 | % | $ | 111,659 | $ | 2,258 | $ | (586 | ) | $ | 113,331 | |||||||||
|
|
|
|
|
|
|
|
|
|||||||||||||
| December 31, 2015 | ||||||||||||||||||||
| (Amounts in thousands) | Percent of Municipal Portfolio |
Amortized Cost | Unrealized Gains | Unrealized Losses | Fair Value | |||||||||||||||
| New York |
11.38 | % | $ | 14,062 | $ | 602 | $ | — | $ | 14,664 | ||||||||||
| Minnesota |
8.72 | % | 11,011 | 283 | (64 | ) | 11,230 | |||||||||||||
| Wisconsin |
8.69 | % | 10,797 | 420 | (14 | ) | 11,203 | |||||||||||||
| Ohio |
8.38 | % | 10,416 | 388 | — | 10,804 | ||||||||||||||
| Connecticut |
7.76 | % | 9,786 | 217 | (5 | ) | 9,998 | |||||||||||||
| New Jersey |
7.69 | % | 9,554 | 378 | (22 | ) | 9,910 | |||||||||||||
| Massachusetts |
7.60 | % | 9,479 | 315 | — | 9,794 | ||||||||||||||
| Texas |
6.04 | % | 7,651 | 208 | (75 | ) | 7,784 | |||||||||||||
| Other |
5.03 | % | 6,471 | 75 | (60 | ) | 6,486 | |||||||||||||
| Total |
28.71 | % | 35,843 | 1,272 | (117 | ) | 36,998 | |||||||||||||
|
|
|
|
|
|
|
|
|
|
|
|||||||||||
| 100.00 | % | $ | 125,070 | $ | 4,158 | $ | (357 | ) | $ | 128,871 | ||||||||||
|
|
|
|
|
|
|
|
|
|||||||||||||
79
Table of Contents
FIRST COMMUNITY BANCSHARES, INC.
NOTES TO CONSOLIDATED FINANCIAL STATEMENTS – (Continued)
The following tables present the fair values and unrealized losses for available-for-sale securities in a continuous unrealized loss position for less than 12 months and for 12 months or longer as of the dates indicated:
| December 31, 2016 | ||||||||||||||||||||||||
| Less than 12 Months | 12 Months or Longer | Total | ||||||||||||||||||||||
| Fair | Unrealized | Fair | Unrealized | Fair | Unrealized | |||||||||||||||||||
| (Amounts in thousands) | Value | Losses | Value | Losses | Value | Losses | ||||||||||||||||||
| Municipal securities |
$ | 24,252 | $ | (527 | ) | $ | 715 | $ | (59 | ) | $ | 24,967 | $ | (586 | ) | |||||||||
| Single issue trust preferred securities |
— | — | 19,939 | (2,165 | ) | 19,939 | (2,165 | ) | ||||||||||||||||
| Mortgage-backed Agency securities |
12,834 | (166 | ) | 11,851 | (299 | ) | 24,685 | (465 | ) | |||||||||||||||
|
|
|
|
|
|
|
|
|
|
|
|
|
|||||||||||||
| Total |
$ | 37,086 | $ | (693 | ) | $ | 32,505 | $ | (2,523 | ) | $ | 69,591 | $ | (3,216 | ) | |||||||||
|
|
|
|
|
|
|
|
|
|
|
|
|
|||||||||||||
| December 31, 2015 | ||||||||||||||||||||||||
| Less than 12 Months | 12 Months or Longer | Total | ||||||||||||||||||||||
| Fair | Unrealized | Fair | Unrealized | Fair | Unrealized | |||||||||||||||||||
| (Amounts in thousands) | Value | Losses | Value | Losses | Value | Losses | ||||||||||||||||||
| U.S. Agency securities |
$ | 4,441 | $ | (5 | ) | $ | 23,922 | $ | (746 | ) | $ | 28,363 | $ | (751 | ) | |||||||||
| Municipal securities |
8,126 | (48 | ) | 10,393 | (309 | ) | 18,519 | (357 | ) | |||||||||||||||
| Single issue trust preferred securities |
— | — | 47,832 | (8,050 | ) | 47,832 | (8,050 | ) | ||||||||||||||||
| Corporate securities |
70,333 | (238 | ) | — | — | 70,333 | (238 | ) | ||||||||||||||||
| Mortgage-backed Agency securities |
27,050 | (253 | ) | 37,291 | (922 | ) | 64,341 | (1,175 | ) | |||||||||||||||
|
|
|
|
|
|
|
|
|
|
|
|
|
|||||||||||||
| Total |
$ | 109,950 | $ | (544 | ) | $ | 119,438 | $ | (10,027 | ) | $ | 229,388 | $ | (10,571 | ) | |||||||||
|
|
|
|
|
|
|
|
|
|
|
|
|
|||||||||||||
The following tables present the fair values and unrealized losses for held-to-maturity securities in a continuous unrealized loss position for less than 12 months and for 12 months or longer as of the dates indicated:
| December 31, 2016 | ||||||||||||||||||||||||
| Less than 12 Months | 12 Months or Longer | Total | ||||||||||||||||||||||
| Fair | Unrealized | Fair | Unrealized | Fair | Unrealized | |||||||||||||||||||
| (Amounts in thousands) | Value | Losses | Value | Losses | Value | Losses | ||||||||||||||||||
| Corporate securities |
$ | 3,533 | $ | (2 | ) | $ | — | $ | — | $ | 3,533 | $ | (2 | ) | ||||||||||
|
|
|
|
|
|
|
|
|
|
|
|
|
|||||||||||||
| Total |
$ | 3,533 | $ | (2 | ) | $ | — | $ | — | $ | 3,533 | $ | (2 | ) | ||||||||||
|
|
|
|
|
|
|
|
|
|
|
|
|
|||||||||||||
| December 31, 2015 | ||||||||||||||||||||||||
| Less than 12 Months | 12 Months or Longer | Total | ||||||||||||||||||||||
| Fair | Unrealized | Fair | Unrealized | Fair | Unrealized | |||||||||||||||||||
| (Amounts in thousands) | Value | Losses | Value | Losses | Value | Losses | ||||||||||||||||||
| U.S. Agency securities |
$ | 43,723 | $ | (106 | ) | $ | — | $ | — | $ | 43,723 | $ | (106 | ) | ||||||||||
| Corporate securities |
6,851 | (23 | ) | — | — | 6,851 | (23 | ) | ||||||||||||||||
|
|
|
|
|
|
|
|
|
|
|
|
|
|||||||||||||
| Total |
$ | 50,574 | $ | (129 | ) | $ | — | $ | — | $ | 50,574 | $ | (129 | ) | ||||||||||
|
|
|
|
|
|
|
|
|
|
|
|
|
|||||||||||||
There were 82 individual securities in an unrealized loss position as of December 31, 2016, and their combined depreciation in value represented 1.51% of the investment securities portfolio. These securities included 15 securities in a continuous unrealized loss position for 12 months or longer that the Company does not intend to
80
Table of Contents
FIRST COMMUNITY BANCSHARES, INC.
NOTES TO CONSOLIDATED FINANCIAL STATEMENTS – (Continued)
sell, and that it has determined is not more likely than not going to be required to sell, prior to maturity or recovery. There were 107 individual securities in an unrealized loss position as of December 31, 2015, and their combined depreciation in value represented 2.44% of the investment securities portfolio.
The Company reviews its investment portfolio quarterly for indications of OTTI. The initial indicator of OTTI for both debt and equity securities is a decline in fair value below book value and the severity and duration of the decline. For debt securities, the credit-related OTTI is recognized as a charge to noninterest income and the noncredit-related OTTI is recognized in OCI. The Company incurred credit-related OTTI charges on debt securities of $4.64 million in 2016 related to the Company’s change in intent to hold certain securities to recovery. The intent was changed to sell specific trust preferred securities in the Company’s investment portfolio primarily to reduce credit concentrations with two issuers. The Company incurred credit-related OTTI charges on debt securities of $705 thousand in 2014 related to a non-Agency mortgage-backed security that was sold in November 2014. Temporary impairment on debt securities is primarily related to changes in benchmark interest rates, changes in pricing in the credit markets, and other current economic factors. For equity securities, the OTTI is recognized as a charge to noninterest income. The Company incurred OTTI charges related to equity securities of $11 thousand in 2016 and $32 thousand in 2014. There were no OTTI charges recognized in 2015.
The following table presents the changes in credit-related losses recognized in earnings on debt securities where a portion of the impairment was recognized in OCI during the periods indicated:
| Year Ended December 31, | ||||||||||||
| (Amounts in thousands) | 2016 | 2015 | 2014 | |||||||||
| Beginning balance (1) |
$ | — | $ | — | $ | 7,798 | ||||||
| Additions for credit losses on securities not previously recognized |
4,646 | — | — | |||||||||
| Additions for credit losses on securities previously recognized |
— | — | 705 | |||||||||
| Reduction for securities sold/realized losses |
(4,646 | ) | — | (8,503 | ) | |||||||
|
|
|
|
|
|
|
|||||||
| Ending balance |
$ | — | $ | — | $ | — | ||||||
|
|
|
|
|
|
|
|||||||
| (1) | The beginning balance includes credit-related losses included in OTTI charges recognized on debt securities in prior periods. |
The carrying amount of securities pledged for various purposes totaled $139.75 million as of December 31, 2016, and $236.73 million as of December 31, 2015.
The following table presents the gross realized gains and losses from the sale of available-for-sale securities for the periods indicated:
| Year Ended December 31, | ||||||||||||
| (Amounts in thousands) | 2016 | 2015 | 2014 | |||||||||
| Gross realized gains |
$ | 757 | $ | 363 | $ | 2,257 | ||||||
| Gross realized losses |
(422 | ) | (219 | ) | (3,642 | ) | ||||||
|
|
|
|
|
|
|
|||||||
| Net gain (loss) on sale of securities |
$ | 335 | $ | 144 | $ | (1,385 | ) | |||||
|
|
|
|
|
|
|
|||||||
81
Table of Contents
FIRST COMMUNITY BANCSHARES, INC.
NOTES TO CONSOLIDATED FINANCIAL STATEMENTS – (Continued)
| Note 4. | Loans |
The Company groups loans held for investment into three segments (commercial loans, consumer real estate loans, and consumer and other loans) with each segment divided into various classes. Covered loans are those loans acquired in FDIC assisted transactions that are covered by loss share agreements. Customer overdrafts reclassified as loans totaled $1.41 million as of December 31, 2016, and $1.24 million as of December 31, 2015. Deferred loan fees totaled $3.90 million in 2016, $3.78 million in 2015, and $3.39 million in 2014. For information about off-balance sheet financing, see Note 20, “Litigation, Commitments, and Contingencies,” to the Consolidated Financial Statements of this report.
The following table presents loans, net of unearned income with non-covered loans and by loan class, as of the dates indicated:
| December 31, | ||||||||||||||||
| 2016 | 2015 | |||||||||||||||
| (Amounts in thousands) | Amount | Percent | Amount | Percent | ||||||||||||
| Non-covered loans held for investment |
||||||||||||||||
| Commercial loans |
||||||||||||||||
| Construction, development, and other land |
$ | 56,948 | 3.07 | % | $ | 48,896 | 2.86 | % | ||||||||
| Commercial and industrial |
92,204 | 4.98 | % | 88,903 | 5.21 | % | ||||||||||
| Multi-family residential |
134,228 | 7.24 | % | 95,026 | 5.57 | % | ||||||||||
| Single family non-owner occupied |
142,965 | 7.72 | % | 149,351 | 8.75 | % | ||||||||||
| Non-farm, non-residential |
598,674 | 32.31 | % | 485,460 | 28.45 | % | ||||||||||
| Agricultural |
6,003 | 0.32 | % | 2,911 | 0.17 | % | ||||||||||
| Farmland |
31,729 | 1.71 | % | 27,540 | 1.61 | % | ||||||||||
|
|
|
|
|
|
|
|
|
|||||||||
| Total commercial loans |
1,062,751 | 57.35 | % | 898,087 | 52.62 | % | ||||||||||
| Consumer real estate loans |
||||||||||||||||
| Home equity lines |
106,361 | 5.74 | % | 107,367 | 6.29 | % | ||||||||||
| Single family owner occupied |
500,891 | 27.03 | % | 495,209 | 29.02 | % | ||||||||||
| Owner occupied construction |
44,535 | 2.41 | % | 43,505 | 2.55 | % | ||||||||||
|
|
|
|
|
|
|
|
|
|||||||||
| Total consumer real estate loans |
651,787 | 35.18 | % | 646,081 | 37.86 | % | ||||||||||
| Consumer and other loans |
||||||||||||||||
| Consumer loans |
77,445 | 4.18 | % | 72,000 | 4.22 | % | ||||||||||
| Other |
3,971 | 0.21 | % | 7,338 | 0.43 | % | ||||||||||
|
|
|
|
|
|
|
|
|
|||||||||
| Total consumer and other loans |
81,416 | 4.39 | % | 79,338 | 4.65 | % | ||||||||||
|
|
|
|
|
|
|
|
|
|||||||||
| Total non-covered loans |
1,795,954 | 96.92 | % | 1,623,506 | 95.13 | % | ||||||||||
| Total covered loans |
56,994 | 3.08 | % | 83,035 | 4.87 | % | ||||||||||
|
|
|
|
|
|
|
|
|
|||||||||
| Total loans held for investment, net of unearned income |
$ | 1,852,948 | 100.00 | % | $ | 1,706,541 | 100.00 | % | ||||||||
|
|
|
|
|
|
|
|
|
|||||||||
82
Table of Contents
FIRST COMMUNITY BANCSHARES, INC.
NOTES TO CONSOLIDATED FINANCIAL STATEMENTS – (Continued)
The following table presents the covered loan portfolio, by loan class, as of the dates indicated:
| December 31, | ||||||||
| (Amounts in thousands) | 2016 | 2015 | ||||||
| Covered loans |
||||||||
| Commercial loans |
||||||||
| Construction, development, and other land |
$ | 4,570 | $ | 6,303 | ||||
| Commercial and industrial |
895 | 1,170 | ||||||
| Multi-family residential |
8 | 640 | ||||||
| Single family non-owner occupied |
962 | 2,674 | ||||||
| Non-farm, non-residential |
7,512 | 14,065 | ||||||
| Agricultural |
25 | 34 | ||||||
| Farmland |
397 | 643 | ||||||
|
|
|
|
|
|||||
| Total commercial loans |
14,369 | 25,529 | ||||||
| Consumer real estate loans |
||||||||
| Home equity lines |
35,817 | 48,565 | ||||||
| Single family owner occupied |
6,729 | 8,595 | ||||||
| Owner occupied construction |
— | 262 | ||||||
|
|
|
|
|
|||||
| Total consumer real estate loans |
42,546 | 57,422 | ||||||
| Consumer and other loans |
||||||||
| Consumer loans |
79 | 84 | ||||||
|
|
|
|
|
|||||
| Total covered loans |
$ | 56,994 | $ | 83,035 | ||||
|
|
|
|
|
|||||
The Company identifies certain purchased loans as impaired when fair values are established at acquisition and groups those PCI loans into loan pools with common risk characteristics. The Company estimates cash flows to be collected on PCI loans and discounts those cash flows at a market rate of interest. The following table presents the recorded investment and contractual unpaid principal balance of PCI loans, by acquisition, as of the dates indicated:
| December 31, | ||||||||||||||||
| 2016 | 2015 | |||||||||||||||
| (Amounts in thousands) | Recorded Investment | Unpaid Principal Balance |
Recorded Investment | Unpaid Principal Balance |
||||||||||||
| PCI Loans, by acquisition |
||||||||||||||||
| Peoples |
$ | 5,576 | $ | 9,397 | $ | 6,681 | $ | 11,249 | ||||||||
| Waccamaw |
21,758 | 45,030 | 34,707 | 63,151 | ||||||||||||
| Other acquired |
1,095 | 1,121 | 1,254 | 1,297 | ||||||||||||
|
|
|
|
|
|
|
|
|
|||||||||
| Total PCI Loans |
$ | 28,429 | $ | 55,548 | $ | 42,642 | $ | 75,697 | ||||||||
|
|
|
|
|
|
|
|
|
|||||||||
83
Table of Contents
FIRST COMMUNITY BANCSHARES, INC.
NOTES TO CONSOLIDATED FINANCIAL STATEMENTS – (Continued)
The following table presents the changes in the accretable yield on PCI loans, by acquisition, during the periods indicated:
| (Amounts in thousands) | Peoples | Waccamaw | Other | Total | ||||||||||||
| Balance January 1, 2014 |
$ | 5,294 | $ | 10,338 | $ | 8 | $ | 15,640 | ||||||||
| Additions |
267 | 26 | — | 293 | ||||||||||||
| Accretion |
(2,147 | ) | (6,118 | ) | (37 | ) | (8,302 | ) | ||||||||
| Reclassifications from nonaccretable difference |
1,912 | 16,400 | 29 | 18,341 | ||||||||||||
| Other changes, net |
(581 | ) | (1,598 | ) | — | (2,179 | ) | |||||||||
|
|
|
|
|
|
|
|
|
|||||||||
| Balance December 31, 2014 |
$ | 4,745 | $ | 19,048 | $ | — | $ | 23,793 | ||||||||
|
|
|
|
|
|
|
|
|
|||||||||
| Balance January 1, 2015 |
$ | 4,745 | $ | 19,048 | $ | — | $ | 23,793 | ||||||||
| Additions |
— | 2 | — | 2 | ||||||||||||
| Accretion |
(2,712 | ) | (6,459 | ) | — | (9,171 | ) | |||||||||
| Reclassifications from nonaccretable difference |
1,283 | 6,564 | — | 7,847 | ||||||||||||
| Other changes, net |
273 | 6,954 | — | 7,227 | ||||||||||||
|
|
|
|
|
|
|
|
|
|||||||||
| Balance December 31, 2015 |
$ | 3,589 | $ | 26,109 | $ | — | $ | 29,698 | ||||||||
|
|
|
|
|
|
|
|
|
|||||||||
| Balance January 1, 2016 |
$ | 3,589 | $ | 26,109 | $ | — | $ | 29,698 | ||||||||
| Accretion |
(1,237 | ) | (5,380 | ) | — | (6,617 | ) | |||||||||
| Reclassifications from nonaccretable difference |
287 | 1,620 | — | 1,907 | ||||||||||||
| Other changes, net |
1,753 | (515 | ) | — | 1,238 | |||||||||||
|
|
|
|
|
|
|
|
|
|||||||||
| Balance December 31, 2016 |
$ | 4,392 | $ | 21,834 | $ | — | $ | 26,226 | ||||||||
|
|
|
|
|
|
|
|
|
|||||||||
| Note 5. | Credit Quality |
The Company uses a risk grading matrix to assign a risk grade to each loan in its portfolio. Loan risk ratings may be upgraded or downgraded to reflect current information identified during the loan review process. The general characteristics of each risk grade are as follows:
| • | Pass — This grade is assigned to loans with acceptable credit quality and risk. The Company further segments this grade based on borrower characteristics that include capital strength, earnings stability, liquidity, leverage, and industry conditions. |
| • | Special Mention — This grade is assigned to loans that require an above average degree of supervision and attention. These loans have the characteristics of an asset with acceptable credit quality and risk; however, adverse economic or financial conditions exist that create potential weaknesses deserving of management’s close attention. If potential weaknesses are not corrected, the prospect of repayment may worsen. |
| • | Substandard — This grade is assigned to loans that have well defined weaknesses that may make payment default, or principal exposure, possible. These loans will likely be dependent on collateral liquidation, secondary repayment sources, or events outside the normal course of business to meet repayment terms. |
| • | Doubtful — This grade is assigned to loans that have the weaknesses inherent in substandard loans; however, the weaknesses are so severe that collection or liquidation in full is unlikely based on current facts, conditions, and values. Due to certain specific pending factors, the amount of loss cannot yet be determined. |
| • | Loss — This grade is assigned to loans that will be charged off or charged down when payments, including the timing and value of payments, are uncertain. This risk grade does not imply that the asset has no recovery or salvage value, but simply means that it is not practical or desirable to defer writing off, either all or a portion of, the loan balance even though partial recovery may be realized in the future. |
84
Table of Contents
FIRST COMMUNITY BANCSHARES, INC.
NOTES TO CONSOLIDATED FINANCIAL STATEMENTS – (Continued)
The following tables present the recorded investment of the loan portfolio, by loan class and credit quality, as of the dates indicated. Losses on covered loans are generally reimbursable by the FDIC at the applicable loss share percentage, 80%; therefore, covered loans are disclosed separately.
| December 31, 2016 | ||||||||||||||||||||||||
| Special | ||||||||||||||||||||||||
| (Amounts in thousands) | Pass | Mention | Substandard | Doubtful | Loss | Total | ||||||||||||||||||
| Non-covered loans |
||||||||||||||||||||||||
| Commercial loans |
||||||||||||||||||||||||
| Construction, development, and other land |
$ | 55,188 | $ | 980 | $ | 780 | $ | — | $ | — | $ | 56,948 | ||||||||||||
| Commercial and industrial |
87,581 | 3,483 | 1,137 | — | 3 | 92,204 | ||||||||||||||||||
| Multi-family residential |
126,468 | 6,992 | 768 | — | — | 134,228 | ||||||||||||||||||
| Single family non-owner occupied |
131,934 | 5,466 | 5,565 | — | — | 142,965 | ||||||||||||||||||
| Non-farm, non-residential |
579,134 | 10,236 | 9,102 | 202 | — | 598,674 | ||||||||||||||||||
| Agricultural |
5,839 | 164 | — | — | — | 6,003 | ||||||||||||||||||
| Farmland |
28,887 | 1,223 | 1,619 | — | — | 31,729 | ||||||||||||||||||
| Consumer real estate loans |
||||||||||||||||||||||||
| Home equity lines |
104,033 | 871 | 1,457 | — | — | 106,361 | ||||||||||||||||||
| Single family owner occupied |
475,402 | 4,636 | 20,381 | 472 | — | 500,891 | ||||||||||||||||||
| Owner occupied construction |
43,833 | — | 702 | — | — | 44,535 | ||||||||||||||||||
| Consumer and other loans |
||||||||||||||||||||||||
| Consumer loans |
77,218 | 11 | 216 | — | — | 77,445 | ||||||||||||||||||
| Other |
3,971 | — | — | — | — | 3,971 | ||||||||||||||||||
|
|
|
|
|
|
|
|
|
|
|
|
|
|||||||||||||
| Total non-covered loans |
1,719,488 | 34,062 | 41,727 | 674 | 3 | 1,795,954 | ||||||||||||||||||
| Covered loans |
||||||||||||||||||||||||
| Commercial loans |
||||||||||||||||||||||||
| Construction, development, and other land |
2,768 | 803 | 999 | — | — | 4,570 | ||||||||||||||||||
| Commercial and industrial |
882 | — | 13 | — | — | 895 | ||||||||||||||||||
| Multi-family residential |
— | — | 8 | — | — | 8 | ||||||||||||||||||
| Single family non-owner occupied |
796 | 63 | 103 | — | — | 962 | ||||||||||||||||||
| Non-farm, non-residential |
6,423 | 537 | 552 | — | — | 7,512 | ||||||||||||||||||
| Agricultural |
25 | — | — | — | — | 25 | ||||||||||||||||||
| Farmland |
132 | — | 265 | — | — | 397 | ||||||||||||||||||
| Consumer real estate loans |
||||||||||||||||||||||||
| Home equity lines |
14,283 | 20,763 | 771 | — | — | 35,817 | ||||||||||||||||||
| Single family owner occupied |
4,601 | 928 | 1,200 | — | — | 6,729 | ||||||||||||||||||
| Consumer and other loans |
||||||||||||||||||||||||
| Consumer loans |
79 | — | — | — | — | 79 | ||||||||||||||||||
|
|
|
|
|
|
|
|
|
|
|
|
|
|||||||||||||
| Total covered loans |
29,989 | 23,094 | 3,911 | — | — | 56,994 | ||||||||||||||||||
|
|
|
|
|
|
|
|
|
|
|
|
|
|||||||||||||
| Total loans |
$ | 1,749,477 | $ | 57,156 | $ | 45,638 | $ | 674 | $ | 3 | $ | 1,852,948 | ||||||||||||
|
|
|
|
|
|
|
|
|
|
|
|
|
|||||||||||||
85
Table of Contents
FIRST COMMUNITY BANCSHARES, INC.
NOTES TO CONSOLIDATED FINANCIAL STATEMENTS – (Continued)
| December 31, 2015 | ||||||||||||||||||||||||
| Special | ||||||||||||||||||||||||
| (Amounts in thousands) | Pass | Mention | Substandard | Doubtful | Loss | Total | ||||||||||||||||||
| Non-covered loans |
||||||||||||||||||||||||
| Commercial loans |
||||||||||||||||||||||||
| Construction, development, and other land |
$ | 46,816 | $ | 974 | $ | 1,106 | $ | — | $ | — | $ | 48,896 | ||||||||||||
| Commercial and industrial |
87,223 | 663 | 1,017 | — | — | 88,903 | ||||||||||||||||||
| Multi-family residential |
81,168 | 12,969 | 889 | — | — | 95,026 | ||||||||||||||||||
| Single family non-owner occupied |
139,680 | 3,976 | 5,695 | — | — | 149,351 | ||||||||||||||||||
| Non-farm, non-residential |
454,906 | 15,170 | 15,384 | — | — | 485,460 | ||||||||||||||||||
| Agricultural |
2,886 | 25 | — | — | — | 2,911 | ||||||||||||||||||
| Farmland |
25,855 | 1,427 | 258 | — | — | 27,540 | ||||||||||||||||||
| Consumer real estate loans |
||||||||||||||||||||||||
| Home equity lines |
104,897 | 1,083 | 1,387 | — | — | 107,367 | ||||||||||||||||||
| Single family owner occupied |
468,155 | 6,686 | 20,368 | — | — | 495,209 | ||||||||||||||||||
| Owner occupied construction |
42,783 | — | 722 | — | — | 43,505 | ||||||||||||||||||
| Consumer and other loans |
||||||||||||||||||||||||
| Consumer loans |
71,685 | 61 | 254 | — | — | 72,000 | ||||||||||||||||||
| Other |
7,338 | — | — | — | — | 7,338 | ||||||||||||||||||
|
|
|
|
|
|
|
|
|
|
|
|
|
|||||||||||||
| Total non-covered loans |
1,533,392 | 43,034 | 47,080 | — | — | 1,623,506 | ||||||||||||||||||
| Covered loans |
||||||||||||||||||||||||
| Commercial loans |
||||||||||||||||||||||||
| Construction, development, and other land |
3,908 | 1,261 | 1,134 | — | — | 6,303 | ||||||||||||||||||
| Commercial and industrial |
1,144 | 4 | 22 | — | — | 1,170 | ||||||||||||||||||
| Multi-family residential |
460 | — | 180 | — | — | 640 | ||||||||||||||||||
| Single family non-owner occupied |
1,808 | 457 | 409 | — | — | 2,674 | ||||||||||||||||||
| Non-farm, non-residential |
9,192 | 2,044 | 2,829 | — | — | 14,065 | ||||||||||||||||||
| Agricultural |
34 | — | — | — | — | 34 | ||||||||||||||||||
| Farmland |
364 | — | 279 | — | — | 643 | ||||||||||||||||||
| Consumer real estate loans |
||||||||||||||||||||||||
| Home equity lines |
17,893 | 29,823 | 849 | — | — | 48,565 | ||||||||||||||||||
| Single family owner occupied |
5,102 | 1,963 | 1,530 | — | — | 8,595 | ||||||||||||||||||
| Owner occupied construction |
112 | 51 | 99 | — | — | 262 | ||||||||||||||||||
| Consumer and other loans |
||||||||||||||||||||||||
| Consumer loans |
84 | — | — | — | — | 84 | ||||||||||||||||||
|
|
|
|
|
|
|
|
|
|
|
|
|
|||||||||||||
| Total covered loans |
40,101 | 35,603 | 7,331 | — | — | 83,035 | ||||||||||||||||||
|
|
|
|
|
|
|
|
|
|
|
|
|
|||||||||||||
| Total loans |
$ | 1,573,493 | $ | 78,637 | $ | 54,411 | $ | — | $ | — | $ | 1,706,541 | ||||||||||||
|
|
|
|
|
|
|
|
|
|
|
|
|
|||||||||||||
The Company identifies loans for potential impairment through a variety of means, including, but not limited to, ongoing loan review, renewal processes, delinquency data, market communications, and public information. If the Company determines that it is probable all principal and interest amounts contractually due will not be collected, the loan is generally deemed impaired.
86
Table of Contents
FIRST COMMUNITY BANCSHARES, INC.
NOTES TO CONSOLIDATED FINANCIAL STATEMENTS – (Continued)
The following table presents the recorded investment, unpaid principal balance, and related allowance for loan losses for impaired loans, excluding PCI loans, as of the dates indicated:
| December 31, 2016 | December 31, 2015 | |||||||||||||||||||||||
| Unpaid | Unpaid | |||||||||||||||||||||||
| Recorded | Principal | Related | Recorded | Principal | Related | |||||||||||||||||||
| (Amounts in thousands) | Investment | Balance | Allowance | Investment | Balance | Allowance | ||||||||||||||||||
| Impaired loans with no related allowance |
||||||||||||||||||||||||
| Commercial loans |
||||||||||||||||||||||||
| Construction, development, and other land |
$ | 33 | $ | 35 | $ | — | $ | 57 | $ | 57 | $ | — | ||||||||||||
| Commercial and industrial |
346 | 383 | — | 16 | 23 | — | ||||||||||||||||||
| Multi-family residential |
294 | 369 | — | 84 | 94 | — | ||||||||||||||||||
| Single family non-owner occupied |
3,084 | 3,334 | — | 2,095 | 2,239 | — | ||||||||||||||||||
| Non-farm, non-residential |
3,829 | 4,534 | — | 10,369 | 11,055 | — | ||||||||||||||||||
| Agricultural |
— | — | — | — | — | — | ||||||||||||||||||
| Farmland |
1,161 | 1,188 | — | 310 | 326 | — | ||||||||||||||||||
| Consumer real estate loans |
||||||||||||||||||||||||
| Home equity lines |
913 | 968 | — | 868 | 898 | — | ||||||||||||||||||
| Single family owner occupied |
11,779 | 12,630 | — | 11,289 | 11,996 | — | ||||||||||||||||||
| Owner occupied construction |
573 | 589 | — | 243 | 243 | — | ||||||||||||||||||
| Consumer and other loans |
||||||||||||||||||||||||
| Consumer loans |
62 | 103 | — | 71 | 74 | — | ||||||||||||||||||
| Other |
— | — | — | — | — | — | ||||||||||||||||||
|
|
|
|
|
|
|
|
|
|
|
|
|
|||||||||||||
| Total impaired loans with no allowance |
22,074 | 24,133 | — | 25,402 | 27,005 | — | ||||||||||||||||||
| Impaired loans with a related allowance |
||||||||||||||||||||||||
| Commercial loans |
||||||||||||||||||||||||
| Single family non-owner occupied |
351 | 351 | 31 | 619 | 623 | 124 | ||||||||||||||||||
| Non-farm, non-residential |
— | — | — | 5,667 | 5,673 | 1,568 | ||||||||||||||||||
| Farmland |
430 | 430 | 18 | — | — | — | ||||||||||||||||||
| Consumer real estate loans |
||||||||||||||||||||||||
| Single family owner occupied |
4,118 | 4,174 | 770 | 4,899 | 4,907 | 672 | ||||||||||||||||||
| Owner occupied construction |
— | — | — | 349 | 355 | 7 | ||||||||||||||||||
|
|
|
|
|
|
|
|
|
|
|
|
|
|||||||||||||
| Total impaired loans with an allowance |
4,899 | 4,955 | 819 | 11,534 | 11,558 | 2,371 | ||||||||||||||||||
|
|
|
|
|
|
|
|
|
|
|
|
|
|||||||||||||
| Total impaired loans(1) |
$ | 26,973 | $ | 29,088 | $ | 819 | $ | 36,936 | $ | 38,563 | $ | 2,371 | ||||||||||||
|
|
|
|
|
|
|
|
|
|
|
|
|
|||||||||||||
| (1) | Includes loans totaling $16.89 million as of December 31, 2016, and $14.22 million as of December 31, 2015, that do not meet the Company’s evaluation threshold for individual impairment and are therefore collectively evaluated for impairment |
87
Table of Contents
FIRST COMMUNITY BANCSHARES, INC.
NOTES TO CONSOLIDATED FINANCIAL STATEMENTS – (Continued)
The following table presents the average recorded investment and interest income recognized on impaired loans, excluding PCI loans, for the periods indicated:
| Year Ended December 31, | ||||||||||||||||||||||||
| 2016 | 2015 | 2014 | ||||||||||||||||||||||
| (Amounts in thousands) | Interest Income Recognized |
Average Recorded Investment |
Interest Income Recognized |
Average Recorded Investment |
Interest Income Recognized |
Average Recorded Investment |
||||||||||||||||||
| Impaired loans with no related allowance: |
||||||||||||||||||||||||
| Commercial loans |
||||||||||||||||||||||||
| Construction, development, and other land |
$ | 22 | $ | 344 | $ | 5 | $ | 481 | $ | 8 | $ | 607 | ||||||||||||
| Commercial and industrial |
16 | 646 | — | 324 | 18 | 1,627 | ||||||||||||||||||
| Multi-family residential |
21 | 308 | 4 | 269 | 21 | 162 | ||||||||||||||||||
| Single family non-owner occupied |
178 | 3,076 | 88 | 2,140 | 60 | 1,629 | ||||||||||||||||||
| Non-farm, non-residential |
307 | 8,573 | 312 | 11,677 | 353 | 8,248 | ||||||||||||||||||
| Agricultural |
— | — | — | — | — | 1 | ||||||||||||||||||
| Farmland |
55 | 437 | 16 | 195 | 6 | 315 | ||||||||||||||||||
| Consumer real estate loans |
||||||||||||||||||||||||
| Home equity lines |
30 | 1,223 | 36 | 813 | 22 | 686 | ||||||||||||||||||
| Single family owner occupied |
343 | 12,330 | 356 | 12,708 | 404 | 11,486 | ||||||||||||||||||
| Owner occupied construction |
9 | 497 | 10 | 359 | 5 | 259 | ||||||||||||||||||
| Consumer and other loans |
||||||||||||||||||||||||
| Consumer loans |
5 | 60 | 8 | 98 | 5 | 108 | ||||||||||||||||||
|
|
|
|
|
|
|
|
|
|
|
|
|
|||||||||||||
| Total impaired loans with no related allowance |
986 | 27,494 | 835 | 29,064 | 902 | 25,128 | ||||||||||||||||||
| Impaired loans with a related allowance: |
||||||||||||||||||||||||
| Commercial loans |
||||||||||||||||||||||||
| Commercial and industrial |
— | — | — | — | 47 | 2,199 | ||||||||||||||||||
| Multi-family residential |
— | — | — | — | 23 | 4,190 | ||||||||||||||||||
| Single family non-owner occupied |
23 | 518 | 25 | 575 | 2 | 369 | ||||||||||||||||||
| Non-farm, non-residential |
215 | 3,831 | 65 | 4,987 | 31 | 3,386 | ||||||||||||||||||
| Farmland |
14 | 108 | — | — | — | — | ||||||||||||||||||
| Consumer real estate loans |
||||||||||||||||||||||||
| Home equity lines |
— | — | — | — | 1 | 57 | ||||||||||||||||||
| Single family owner occupied |
118 | 4,452 | 26 | 3,731 | 48 | 3,897 | ||||||||||||||||||
| Owner occupied construction |
— | 87 | 1 | 178 | — | — | ||||||||||||||||||
|
|
|
|
|
|
|
|
|
|
|
|
|
|||||||||||||
| Total impaired loans with a related allowance |
370 | 8,996 | 117 | 9,471 | 152 | 14,098 | ||||||||||||||||||
|
|
|
|
|
|
|
|
|
|
|
|
|
|||||||||||||
| Total impaired loans |
$ | 1,356 | $ | 36,490 | $ | 952 | $ | 38,535 | $ | 1,054 | $ | 39,226 | ||||||||||||
|
|
|
|
|
|
|
|
|
|
|
|
|
|||||||||||||
The following tables provide information on impaired PCI loan pools as of and for the dates indicated:
| December 31, | ||||||||
| (Amounts in thousands, except impaired loan pools) | 2016 | 2015 | ||||||
| Unpaid principal balance |
$ | 1,086 | $ | 3,759 | ||||
| Recorded investment |
1,085 | 2,834 | ||||||
| Allowance for loan losses related to PCI loan pools |
12 | 54 | ||||||
| Impaired PCI loan pools |
1 | 2 | ||||||
| Year Ended December 31, | ||||||||||||
| (Amounts in thousands) | 2016 | 2015 | 2014 | |||||||||
| Interest income recognized |
$ | 142 | $ | 364 | $ | 3,081 | ||||||
| Average recorded investment |
1,929 | 3,309 | 30,007 | |||||||||
88
Table of Contents
FIRST COMMUNITY BANCSHARES, INC.
NOTES TO CONSOLIDATED FINANCIAL STATEMENTS – (Continued)
The Company generally places a loan on nonaccrual status when it is 90 days or more past due. PCI loans are generally not classified as nonaccrual due to the accrual of interest income under the accretion method of accounting. The following table presents nonaccrual loans, by loan class, as of the dates indicated:
| December 31, | ||||||||||||||||||||||||
| 2016 | 2015 | |||||||||||||||||||||||
| (Amounts in thousands) | Non-covered | Covered | Total | Non-covered | Covered | Total | ||||||||||||||||||
| Commercial loans |
||||||||||||||||||||||||
| Construction, development, and other land |
$ | 72 | $ | 32 | $ | 104 | $ | 39 | $ | 54 | $ | 93 | ||||||||||||
| Commercial and industrial |
332 | 13 | 345 | — | 16 | 16 | ||||||||||||||||||
| Multi-family residential |
294 | — | 294 | 84 | — | 84 | ||||||||||||||||||
| Single family non-owner occupied |
1,242 | 24 | 1,266 | 1,850 | 29 | 1,879 | ||||||||||||||||||
| Non-farm, non-residential |
3,295 | 30 | 3,325 | 7,150 | 39 | 7,189 | ||||||||||||||||||
| Farmland |
1,591 | — | 1,591 | 234 | — | 234 | ||||||||||||||||||
| Consumer real estate loans |
||||||||||||||||||||||||
| Home equity lines |
705 | 400 | 1,105 | 825 | 413 | 1,238 | ||||||||||||||||||
| Single family owner occupied |
7,924 | 109 | 8,033 | 7,245 | 96 | 7,341 | ||||||||||||||||||
| Owner occupied construction |
336 | — | 336 | 349 | — | 349 | ||||||||||||||||||
| Consumer and other loans |
||||||||||||||||||||||||
| Consumer loans |
63 | — | 63 | 71 | — | 71 | ||||||||||||||||||
|
|
|
|
|
|
|
|
|
|
|
|
|
|||||||||||||
| Total nonaccrual loans |
$ | 15,854 | $ | 608 | $ | 16,462 | $ | 17,847 | $ | 647 | $ | 18,494 | ||||||||||||
|
|
|
|
|
|
|
|
|
|
|
|
|
|||||||||||||
89
Table of Contents
FIRST COMMUNITY BANCSHARES, INC.
NOTES TO CONSOLIDATED FINANCIAL STATEMENTS – (Continued)
The following tables present the aging of past due loans, by loan class, as of the dates indicated. Nonaccrual loans 30 days or more past due are included in the applicable delinquency category. Loans acquired with credit deterioration, with a discount, continue to accrue interest based on expected cash flows; therefore, PCI loans are not generally considered nonaccrual. There were no non-covered accruing loans contractually past due 90 days or more as of December 31, 2016, or December 31, 2015.
| December 31, 2016 | ||||||||||||||||||||||||
| 30 - 59 Days | 60 - 89 Days | 90+ Days | Total | Current | Total | |||||||||||||||||||
| (Amounts in thousands) | Past Due | Past Due | Past Due | Past Due | Loans | Loans | ||||||||||||||||||
| Non-covered loans |
||||||||||||||||||||||||
| Commercial loans |
||||||||||||||||||||||||
| Construction, development, and other land |
$ | 33 | $ | 5 | $ | 17 | $ | 55 | $ | 56,893 | $ | 56,948 | ||||||||||||
| Commercial and industrial |
174 | 30 | 149 | 353 | 91,851 | 92,204 | ||||||||||||||||||
| Multi-family residential |
163 | — | 281 | 444 | 133,784 | 134,228 | ||||||||||||||||||
| Single family non-owner occupied |
1,302 | 159 | 835 | 2,296 | 140,669 | 142,965 | ||||||||||||||||||
| Non-farm, non-residential |
1,235 | 332 | 2,169 | 3,736 | 594,938 | 598,674 | ||||||||||||||||||
| Agricultural |
— | 5 | — | 5 | 5,998 | 6,003 | ||||||||||||||||||
| Farmland |
224 | 343 | 565 | 1,132 | 30,597 | 31,729 | ||||||||||||||||||
| Consumer real estate loans |
||||||||||||||||||||||||
| Home equity lines |
78 | 136 | 658 | 872 | 105,489 | 106,361 | ||||||||||||||||||
| Single family owner occupied |
4,777 | 2,408 | 3,311 | 10,496 | 490,395 | 500,891 | ||||||||||||||||||
| Owner occupied construction |
342 | 336 | — | 678 | 43,857 | 44,535 | ||||||||||||||||||
| Consumer and other loans |
||||||||||||||||||||||||
| Consumer loans |
371 | 90 | 15 | 476 | 76,969 | 77,445 | ||||||||||||||||||
| Other |
— | — | — | — | 3,971 | 3,971 | ||||||||||||||||||
|
|
|
|
|
|
|
|
|
|
|
|
|
|||||||||||||
| Total non-covered loans |
8,699 | 3,844 | 8,000 | 20,543 | 1,775,411 | 1,795,954 | ||||||||||||||||||
| Covered loans |
||||||||||||||||||||||||
| Commercial loans |
||||||||||||||||||||||||
| Construction, development, and other land |
434 | — | 32 | 466 | 4,104 | 4,570 | ||||||||||||||||||
| Commercial and industrial |
— | — | — | — | 895 | 895 | ||||||||||||||||||
| Multi-family residential |
— | — | — | — | 8 | 8 | ||||||||||||||||||
| Single family non-owner occupied |
24 | — | — | 24 | 938 | 962 | ||||||||||||||||||
| Non-farm, non-residential |
32 | — | — | 32 | 7,480 | 7,512 | ||||||||||||||||||
| Agricultural |
— | — | — | — | 25 | 25 | ||||||||||||||||||
| Farmland |
— | — | — | — | 397 | 397 | ||||||||||||||||||
| Consumer real estate loans |
||||||||||||||||||||||||
| Home equity lines |
108 | 146 | 62 | 316 | 35,501 | 35,817 | ||||||||||||||||||
| Single family owner occupied |
58 | — | 39 | 97 | 6,632 | 6,729 | ||||||||||||||||||
| Owner occupied construction |
— | — | — | — | — | — | ||||||||||||||||||
| Consumer and other loans |
||||||||||||||||||||||||
| Consumer loans |
— | — | — | — | 79 | 79 | ||||||||||||||||||
|
|
|
|
|
|
|
|
|
|
|
|
|
|||||||||||||
| Total covered loans |
656 | 146 | 133 | 935 | 56,059 | 56,994 | ||||||||||||||||||
|
|
|
|
|
|
|
|
|
|
|
|
|
|||||||||||||
| Total loans |
$ | 9,355 | $ | 3,990 | $ | 8,133 | $ | 21,478 | $ | 1,831,470 | $ | 1,852,948 | ||||||||||||
|
|
|
|
|
|
|
|
|
|
|
|
|
|||||||||||||
90
Table of Contents
FIRST COMMUNITY BANCSHARES, INC.
NOTES TO CONSOLIDATED FINANCIAL STATEMENTS – (Continued)
| December 31, 2015 | ||||||||||||||||||||||||
| 30 - 59 Days Past Due |
60 - 89 Days Past Due |
90+ Days Past Due |
Total Past Due |
Current Loans |
Total Loans |
|||||||||||||||||||
| (Amounts in thousands) | ||||||||||||||||||||||||
| Non-covered loans |
||||||||||||||||||||||||
| Commercial loans |
||||||||||||||||||||||||
| Construction, development, and other land |
$ | — | $ | — | $ | 39 | $ | 39 | $ | 48,857 | $ | 48,896 | ||||||||||||
| Commercial and industrial |
281 | 66 | — | 347 | 88,556 | 88,903 | ||||||||||||||||||
| Multi-family residential |
302 | 76 | 84 | 462 | 94,564 | 95,026 | ||||||||||||||||||
| Single family non-owner occupied |
748 | 120 | 929 | 1,797 | 147,554 | 149,351 | ||||||||||||||||||
| Non-farm, non-residential |
347 | 676 | 4,940 | 5,963 | 479,497 | 485,460 | ||||||||||||||||||
| Agricultural |
— | — | — | — | 2,911 | 2,911 | ||||||||||||||||||
| Farmland |
585 | 11 | 234 | 830 | 26,710 | 27,540 | ||||||||||||||||||
| Consumer real estate loans |
||||||||||||||||||||||||
| Home equity lines |
668 | 195 | 468 | 1,331 | 106,036 | 107,367 | ||||||||||||||||||
| Single family owner occupied |
6,122 | 1,943 | 3,191 | 11,256 | 483,953 | 495,209 | ||||||||||||||||||
| Owner occupied construction |
— | — | — | — | 43,505 | 43,505 | ||||||||||||||||||
| Consumer and other loans |
||||||||||||||||||||||||
| Consumer loans |
278 | 71 | 23 | 372 | 71,628 | 72,000 | ||||||||||||||||||
| Other |
— | — | — | — | 7,338 | 7,338 | ||||||||||||||||||
|
|
|
|
|
|
|
|
|
|
|
|
|
|||||||||||||
| Total non-covered loans |
9,331 | 3,158 | 9,908 | 22,397 | 1,601,109 | 1,623,506 | ||||||||||||||||||
| Covered loans |
||||||||||||||||||||||||
| Commercial loans |
||||||||||||||||||||||||
| Construction, development, and other land |
96 | — | 42 | 138 | 6,165 | 6,303 | ||||||||||||||||||
| Commercial and industrial |
— | — | 16 | 16 | 1,154 | 1,170 | ||||||||||||||||||
| Multi-family residential |
— | — | — | — | 640 | 640 | ||||||||||||||||||
| Single family non-owner occupied |
1,422 | — | — | 1,422 | 1,252 | 2,674 | ||||||||||||||||||
| Non-farm, non-residential |
— | — | 39 | 39 | 14,026 | 14,065 | ||||||||||||||||||
| Agricultural |
— | — | — | — | 34 | 34 | ||||||||||||||||||
| Farmland |
— | — | — | — | 643 | 643 | ||||||||||||||||||
| Consumer real estate loans |
||||||||||||||||||||||||
| Home equity lines |
489 | 37 | 225 | 751 | 47,814 | 48,565 | ||||||||||||||||||
| Single family owner occupied |
274 | — | 42 | 316 | 8,279 | 8,595 | ||||||||||||||||||
| Owner occupied construction |
— | — | — | — | 262 | 262 | ||||||||||||||||||
| Consumer and other loans |
||||||||||||||||||||||||
| Consumer loans |
— | — | — | — | 84 | 84 | ||||||||||||||||||
|
|
|
|
|
|
|
|
|
|
|
|
|
|||||||||||||
| Total covered loans |
2,281 | 37 | 364 | 2,682 | 80,353 | 83,035 | ||||||||||||||||||
|
|
|
|
|
|
|
|
|
|
|
|
|
|||||||||||||
| Total loans |
$ | 11,612 | $ | 3,195 | $ | 10,272 | $ | 25,079 | $ | 1,681,462 | $ | 1,706,541 | ||||||||||||
|
|
|
|
|
|
|
|
|
|
|
|
|
|||||||||||||
91
Table of Contents
FIRST COMMUNITY BANCSHARES, INC.
NOTES TO CONSOLIDATED FINANCIAL STATEMENTS – (Continued)
The Company may make concessions in interest rates, loan terms and/or amortization terms when restructuring loans for borrowers experiencing financial difficulty. Restructured loans in excess of $250 thousand are evaluated for a specific reserve based on either the collateral or net present value method, whichever is most applicable. Restructured loans under $250 thousand are subject to the reserve calculation at the historical loss rate for classified loans. Certain TDRs are classified as nonperforming at the time of restructuring and are returned to performing status after six months of satisfactory payment performance; however, these loans remain identified as impaired until full payment or other satisfaction of the obligation occurs. PCI loans are generally not considered TDRs as long as the loans remain in the assigned loan pool. No covered loans were recorded as TDRs as of December 31, 2016, or December 31, 2015.
The following table presents loans modified as TDRs, by loan class and accrual status, as of the dates indicated:
| December 31, | ||||||||||||||||||||||||
| 2016 | 2015 | |||||||||||||||||||||||
|
(Amounts in thousands) |
Nonaccrual (1) |
Accruing |
Total |
Nonaccrual (1) |
Accruing |
Total |
||||||||||||||||||
| Commercial loans |
||||||||||||||||||||||||
| Single family non-owner occupied |
$ | 38 | $ | 892 | $ | 930 | $ | 130 | $ | 820 | $ | 950 | ||||||||||||
| Non-farm, non-residential |
— | 4,160 | 4,160 | — | 4,600 | 4,600 | ||||||||||||||||||
| Consumer real estate loans |
||||||||||||||||||||||||
| Home equity lines |
— | 158 | 158 | 127 | 43 | 170 | ||||||||||||||||||
| Single family owner occupied |
905 | 7,503 | 8,408 | 733 | 8,256 | 8,989 | ||||||||||||||||||
| Owner occupied construction |
341 | 239 | 580 | 349 | 243 | 592 | ||||||||||||||||||
|
|
|
|
|
|
|
|
|
|
|
|
|
|||||||||||||
| Total TDRs |
$ | 1,284 | $ | 12,952 | $ | 14,236 | $ | 1,339 | $ | 13,962 | $ | 15,301 | ||||||||||||
|
|
|
|
|
|
|
|
|
|
|
|
|
|||||||||||||
| Allowance for loan losses related to TDRs |
$ | 670 | $ | 590 | ||||||||||||||||||||
|
|
|
|
|
|||||||||||||||||||||
| (1) | Nonaccrual TDRs are included in total nonaccrual loans disclosed in the nonaccrual table above. |
The following table presents interest income recognized on TDRs for the periods indicated:
| Year Ended December 31, | ||||||||||||
| (Amounts in thousands) | 2016 | 2015 | 2014 | |||||||||
| Interest income recognized |
$ | 424 | $ | 608 | $ | 597 | ||||||
92
Table of Contents
FIRST COMMUNITY BANCSHARES, INC.
NOTES TO CONSOLIDATED FINANCIAL STATEMENTS – (Continued)
The following table presents loans modified as TDRs, by type of concession made and loan class, that were restructured during the periods indicated. The post-modification recorded investment represents the loan balance immediately following modification.
| Year Ended December 31, | ||||||||||||||||||||||||
| 2016 | 2015 | |||||||||||||||||||||||
| (Amounts in thousands) |
Total Contracts |
Pre- Modification Recorded Investment |
Post- Modification Recorded Investment |
Total Contracts |
Pre- Modification Recorded Investment |
Post- Modification Recorded Investment |
||||||||||||||||||
| Below market interest rate and extended payment term Single family owner occupied |
1 | $ | 115 | $ | 115 | 5 | $ | 342 | $ | 342 | ||||||||||||||
|
|
|
|
|
|
|
|
|
|
|
|
|
|||||||||||||
| Total |
1 | $ | 115 | $ | 115 | 5 | $ | 342 | $ | 342 | ||||||||||||||
|
|
|
|
|
|
|
|
|
|
|
|
|
|||||||||||||
There were no payment defaults on loans modified as TDRs that were restructured within the previous 12 months as of December 31, 2016 and 2015.
The following table provides information about OREO, which consists of properties acquired through foreclosure, as of the dates indicated:
| December 31, | ||||||||
| (Amounts in thousands) | 2016 | 2015 | ||||||
| Non-covered OREO |
$ | 5,109 | $ | 4,873 | ||||
| Covered OREO |
276 | 4,034 | ||||||
|
|
|
|
|
|||||
| Total OREO |
$ | 5,385 | $ | 8,907 | ||||
|
|
|
|
|
|||||
| Non-covered OREO secured by residential real estate |
$ | 1,746 | $ | 2,677 | ||||
| Residential real estate loans in the foreclosure process (1) |
2,539 | 2,727 | ||||||
| (1) | The recorded investment in consumer mortgage loans collateralized by residential real estate that are in the process of foreclosure according to local requirements of the applicable jurisdiction. |
93
Table of Contents
FIRST COMMUNITY BANCSHARES, INC.
NOTES TO CONSOLIDATED FINANCIAL STATEMENTS – (Continued)
| Note 6. | Allowance for Loan Losses |
The following tables present the changes in the allowance for loan losses, by loan segment, during the periods indicated:
| Year Ended December 31, 2016 | ||||||||||||||||
| (Amounts in thousands) | Commercial | Consumer Real Estate |
Consumer and Other |
Total Allowance |
||||||||||||
| Allowance, excluding PCI |
||||||||||||||||
| Beginning balance |
$ | 13,133 | $ | 6,356 | $ | 690 | $ | 20,179 | ||||||||
| Provision for loan losses charged to operations |
30 | 385 | 881 | 1,296 | ||||||||||||
| Charge-offs |
(2,392 | ) | (1,612 | ) | (1,172 | ) | (5,176 | ) | ||||||||
| Recoveries |
919 | 358 | 360 | 1,637 | ||||||||||||
|
|
|
|
|
|
|
|
|
|||||||||
| Net charge-offs |
(1,473 | ) | (1,254 | ) | (812 | ) | (3,539 | ) | ||||||||
|
|
|
|
|
|
|
|
|
|||||||||
| Ending balance |
$ | 11,690 | $ | 5,487 | $ | 759 | $ | 17,936 | ||||||||
|
|
|
|
|
|
|
|
|
|||||||||
| PCI allowance |
||||||||||||||||
| Beginning balance |
$ | — | $ | 54 | $ | — | $ | 54 | ||||||||
| Recovery of loan losses |
— | (42 | ) | — | (42 | ) | ||||||||||
| Benefit attributable to the FDIC indemnification asset |
— | 1 | — | 1 | ||||||||||||
|
|
|
|
|
|
|
|
|
|||||||||
| Recovery of loan losses charged to operations |
— | (41 | ) | — | (41 | ) | ||||||||||
| Recovery of loan losses recorded through the FDIC indemnification asset |
— | (1 | ) | — | (1 | ) | ||||||||||
|
|
|
|
|
|
|
|
|
|||||||||
| Ending balance |
$ | — | $ | 12 | $ | — | $ | 12 | ||||||||
|
|
|
|
|
|
|
|
|
|||||||||
| Total allowance |
||||||||||||||||
| Beginning balance |
$ | 13,133 | $ | 6,410 | $ | 690 | $ | 20,233 | ||||||||
| Provision for loan losses |
30 | 343 | 881 | 1,254 | ||||||||||||
| Benefit attributable to the FDIC indemnification asset |
— | 1 | — | 1 | ||||||||||||
|
|
|
|
|
|
|
|
|
|||||||||
| Provision for loan losses charged to operations |
30 | 344 | 881 | 1,255 | ||||||||||||
| Recovery of loan losses recorded through the FDIC indemnification asset |
— | (1 | ) | — | (1 | ) | ||||||||||
| Charge-offs |
(2,392 | ) | (1,612 | ) | (1,172 | ) | (5,176 | ) | ||||||||
| Recoveries |
919 | 358 | 360 | 1,637 | ||||||||||||
|
|
|
|
|
|
|
|
|
|||||||||
| Net charge-offs |
(1,473 | ) | (1,254 | ) | (812 | ) | (3,539 | ) | ||||||||
|
|
|
|
|
|
|
|
|
|||||||||
| Ending balance |
$ | 11,690 | $ | 5,499 | $ | 759 | $ | 17,948 | ||||||||
|
|
|
|
|
|
|
|
|
|||||||||
94
Table of Contents
FIRST COMMUNITY BANCSHARES, INC.
NOTES TO CONSOLIDATED FINANCIAL STATEMENTS – (Continued)
| Year Ended December 31, 2015 | ||||||||||||||||
| (Amounts in thousands) | Commercial | Consumer Real Estate |
Consumer and Other |
Total Allowance |
||||||||||||
| Allowance, excluding PCI |
||||||||||||||||
| Beginning balance |
$ | 13,010 | $ | 6,489 | $ | 670 | $ | 20,169 | ||||||||
| Provision for loan losses charged to operations |
931 | 95 | 1,140 | 2,166 | ||||||||||||
| Charge-offs |
(1,282 | ) | (906 | ) | (1,557 | ) | (3,745 | ) | ||||||||
| Recoveries |
474 | 678 | 437 | 1,589 | ||||||||||||
|
|
|
|
|
|
|
|
|
|||||||||
| Net charge-offs |
(808 | ) | (228 | ) | (1,120 | ) | (2,156 | ) | ||||||||
|
|
|
|
|
|
|
|
|
|||||||||
| Ending balance |
$ | 13,133 | $ | 6,356 | $ | 690 | $ | 20,179 | ||||||||
|
|
|
|
|
|
|
|
|
|||||||||
| PCI allowance |
||||||||||||||||
| Beginning balance |
$ | 37 | $ | 21 | $ | — | $ | 58 | ||||||||
| (Recovery of) provision for loan losses |
(37 | ) | 33 | — | (4 | ) | ||||||||||
| Benefit attributable to the FDIC indemnification asset |
29 | — | — | 29 | ||||||||||||
|
|
|
|
|
|
|
|
|
|||||||||
| (Recovery of) provision for loan losses charged to operations |
(8 | ) | 33 | — | 25 | |||||||||||
| Recovery of loan losses recorded through the FDIC indemnification asset |
(29 | ) | — | — | (29 | ) | ||||||||||
|
|
|
|
|
|
|
|
|
|||||||||
| Ending balance |
$ | — | $ | 54 | $ | — | $ | 54 | ||||||||
|
|
|
|
|
|
|
|
|
|||||||||
| Total allowance |
||||||||||||||||
| Beginning balance |
$ | 13,047 | $ | 6,510 | $ | 670 | $ | 20,227 | ||||||||
| Provision for loan losses |
894 | 128 | 1,140 | 2,162 | ||||||||||||
| Benefit attributable to the FDIC indemnification asset |
29 | — | — | 29 | ||||||||||||
|
|
|
|
|
|
|
|
|
|||||||||
| Provision for loan losses charged to operations |
923 | 128 | 1,140 | 2,191 | ||||||||||||
| Recovery of loan losses recorded through the FDIC indemnification asset |
(29 | ) | — | — | (29 | ) | ||||||||||
| Charge-offs |
(1,282 | ) | (906 | ) | (1,557 | ) | (3,745 | ) | ||||||||
| Recoveries |
474 | 678 | 437 | 1,589 | ||||||||||||
|
|
|
|
|
|
|
|
|
|||||||||
| Net charge-offs |
(808 | ) | (228 | ) | (1,120 | ) | (2,156 | ) | ||||||||
|
|
|
|
|
|
|
|
|
|||||||||
| Ending balance |
$ | 13,133 | $ | 6,410 | $ | 690 | $ | 20,233 | ||||||||
|
|
|
|
|
|
|
|
|
|||||||||
95
Table of Contents
FIRST COMMUNITY BANCSHARES, INC.
NOTES TO CONSOLIDATED FINANCIAL STATEMENTS – (Continued)
The following tables present the allowance for loan losses and recorded investment in loans evaluated for impairment, excluding PCI loans, by loan class, as of the dates indicated:
| December 31, 2016 | ||||||||||||||||
| (Amounts in thousands) | Loans Individually Evaluated for Impairment |
Allowance for Loans Individually Evaluated |
Loans Collectively Evaluated for Impairment |
Allowance for Loans Collectively Evaluated |
||||||||||||
| Commercial loans |
||||||||||||||||
| Construction, development, and other land |
$ | — | $ | — | $ | 60,281 | $ | 889 | ||||||||
| Commercial and industrial |
— | — | 93,099 | 495 | ||||||||||||
| Multi-family residential |
281 | — | 133,947 | 1,157 | ||||||||||||
| Single family non-owner occupied |
1,910 | 31 | 139,711 | 2,721 | ||||||||||||
| Non-farm, non-residential |
1,454 | — | 600,915 | 6,185 | ||||||||||||
| Agricultural |
— | — | 6,028 | 43 | ||||||||||||
| Farmland |
981 | 18 | 31,145 | 151 | ||||||||||||
|
|
|
|
|
|
|
|
|
|||||||||
| Total commercial loans |
4,626 | 49 | 1,065,126 | 11,641 | ||||||||||||
| Consumer real estate loans |
||||||||||||||||
| Home equity lines |
— | — | 122,000 | 895 | ||||||||||||
| Single family owner occupied |
5,120 | 770 | 501,617 | 3,594 | ||||||||||||
| Owner occupied construction |
336 | — | 44,199 | 228 | ||||||||||||
|
|
|
|
|
|
|
|
|
|||||||||
| Total consumer real estate loans |
5,456 | 770 | 667,816 | 4,717 | ||||||||||||
| Consumer and other loans |
||||||||||||||||
| Consumer loans |
— | — | 77,524 | 759 | ||||||||||||
| Other |
— | — | 3,971 | — | ||||||||||||
|
|
|
|
|
|
|
|
|
|||||||||
| Total consumer and other loans |
— | — | 81,495 | 759 | ||||||||||||
|
|
|
|
|
|
|
|
|
|||||||||
| Total loans, excluding PCI loans |
$ | 10,082 | $ | 819 | $ | 1,814,437 | $ | 17,117 | ||||||||
|
|
|
|
|
|
|
|
|
|||||||||
| December 31, 2015 | ||||||||||||||||
| (Amounts in thousands) | Loans Individually Evaluated for Impairment |
Allowance for Loans Individually Evaluated |
Loans Collectively Evaluated for Impairment |
Allowance for Loans Collectively Evaluated |
||||||||||||
| Commercial loans |
||||||||||||||||
| Construction, development, and other land |
$ | — | $ | — | $ | 53,437 | $ | 1,119 | ||||||||
| Commercial and industrial |
— | — | 89,885 | 504 | ||||||||||||
| Multi-family residential |
— | — | 95,486 | 1,535 | ||||||||||||
| Single family non-owner occupied |
1,401 | 124 | 147,209 | 3,245 | ||||||||||||
| Non-farm, non-residential |
14,094 | 1,568 | 478,839 | 4,825 | ||||||||||||
| Agricultural |
— | — | 2,945 | 22 | ||||||||||||
| Farmland |
— | — | 28,183 | 190 | ||||||||||||
|
|
|
|
|
|
|
|
|
|||||||||
| Total commercial loans |
15,495 | 1,692 | 895,984 | 11,440 | ||||||||||||
| Consumer real estate loans |
||||||||||||||||
| Home equity lines |
— | — | 126,691 | 1,091 | ||||||||||||
| Single family owner occupied |
6,874 | 672 | 495,761 | 4,297 | ||||||||||||
| Owner occupied construction |
349 | 7 | 43,323 | 290 | ||||||||||||
|
|
|
|
|
|
|
|
|
|||||||||
| Total consumer real estate loans |
7,223 | 679 | 665,775 | 5,678 | ||||||||||||
| Consumer and other loans |
||||||||||||||||
| Consumer loans |
— | — | 72,084 | 690 | ||||||||||||
| Other |
— | — | 7,338 | — | ||||||||||||
|
|
|
|
|
|
|
|
|
|||||||||
| Total consumer and other loans |
— | — | 79,422 | 690 | ||||||||||||
|
|
|
|
|
|
|
|
|
|||||||||
| Total loans, excluding PCI loans |
$ | 22,718 | $ | 2,371 | $ | 1,641,181 | $ | 17,808 | ||||||||
|
|
|
|
|
|
|
|
|
|||||||||
96
Table of Contents
FIRST COMMUNITY BANCSHARES, INC.
NOTES TO CONSOLIDATED FINANCIAL STATEMENTS – (Continued)
The following table presents the allowance for loan losses on PCI loans and recorded investment in PCI loans, by loan pool, as of the dates indicated:
| December 31, 2016 | December 31, 2015 | |||||||||||||||
| (Amounts in thousands) | Recorded Investment |
Allowance for Loan Pools With Impairment |
Recorded Investment |
Allowance for Loan Pools With Impairment |
||||||||||||
| Commercial loans |
||||||||||||||||
| Waccamaw commercial |
$ | 260 | $ | — | $ | 3,788 | $ | — | ||||||||
| Peoples commercial |
4,491 | — | 5,525 | — | ||||||||||||
| Other |
1,095 | — | 1,254 | — | ||||||||||||
|
|
|
|
|
|
|
|
|
|||||||||
| Total commercial loans |
5,846 | — | 10,567 | — | ||||||||||||
| Consumer real estate loans |
||||||||||||||||
| Waccamaw serviced home equity lines |
20,178 | — | 29,241 | — | ||||||||||||
| Waccamaw residential |
1,320 | — | 1,678 | 1 | ||||||||||||
| Peoples residential |
1,085 | 12 | 1,156 | 53 | ||||||||||||
|
|
|
|
|
|
|
|
|
|||||||||
| Total consumer real estate loans |
22,583 | 12 | 32,075 | 54 | ||||||||||||
|
|
|
|
|
|
|
|
|
|||||||||
| Total PCI loans |
$ | 28,429 | $ | 12 | $ | 42,642 | $ | 54 | ||||||||
|
|
|
|
|
|
|
|
|
|||||||||
Management believed the allowance was adequate to absorb probable loan losses inherent in the loan portfolio as of December 31, 2016.
| Note 7. | FDIC Indemnification Asset |
In connection with the FDIC-assisted acquisition of Waccamaw in 2012, the Company entered into loss share agreements with the FDIC that covered $56.99 million of loans and $276 thousand of OREO as of December 31, 2016, compared to $83.04 million of loans and $4.03 million of OREO as of December 31, 2015. Under the loss share agreements, the FDIC agrees to cover 80% of most loan and foreclosed real estate losses and reimburse certain expenses incurred in relation to these covered assets. Loss share coverage will expire June 30, 2017, for commercial loans, with recoveries continuing until June 30, 2019. Loss share coverage will expire June 30, 2022, for single family loans. The Company’s consolidated statements of income include the expense on covered assets net of estimated reimbursements. The following table presents the changes in the FDIC indemnification asset during the periods indicated:
| Year Ended December 31, | ||||||||
| (Amounts in thousands) | 2016 | 2015 | ||||||
| Beginning balance |
$ | 20,844 | $ | 27,900 | ||||
| Decrease in estimated losses on covered loans |
(1 | ) | (28 | ) | ||||
| Increase in estimated losses on covered OREO |
1,045 | 1,489 | ||||||
| Reimbursable expenses from the FDIC |
162 | 545 | ||||||
| Net amortization |
(5,474 | ) | (6,379 | ) | ||||
| Reimbursements from the FDIC |
(4,403 | ) | (2,683 | ) | ||||
|
|
|
|
|
|||||
| Ending balance |
$ | 12,173 | $ | 20,844 | ||||
|
|
|
|
|
|||||
97
Table of Contents
FIRST COMMUNITY BANCSHARES, INC.
NOTES TO CONSOLIDATED FINANCIAL STATEMENTS – (Continued)
| Note 8. | Premises, Equipment, and Leases |
Premises and Equipment
The following table presents the components of premises and equipment as of the dates indicated:
| December 31, | ||||||||
| (Amounts in thousands) | 2016 | 2015 | ||||||
| Land |
$ | 18,987 | $ | 19,155 | ||||
| Buildings and leasehold improvements |
46,740 | 50,776 | ||||||
| Equipment |
32,519 | 36,709 | ||||||
|
|
|
|
|
|||||
| Total premises and equipment |
98,246 | 106,640 | ||||||
| Accumulated depreciation and amortization |
(48,161 | ) | (53,884 | ) | ||||
|
|
|
|
|
|||||
| Total premises and equipment, net |
$ | 50,085 | $ | 52,756 | ||||
|
|
|
|
|
|||||
Impairment charges related to certain long-term investments in land and buildings totaled $364 thousand in 2016, $259 thousand in 2015, and $935 thousand in 2014. Depreciation and amortization expense for premises and equipment was $3.56 million in 2016, $4.14 million in 2015, and $4.41 million in 2014.
Leases
The Company enters into various noncancelable operating leases. The following schedule presents the future minimum lease payments required under noncancelable operating leases, with initial or remaining terms in excess of one year, by year, as of December 31, 2016:
| (Amounts in thousands) | ||||
| 2017 |
$ | 341 | ||
| 2018 |
199 | |||
| 2019 |
110 | |||
| 2020 |
97 | |||
| 2021 |
97 | |||
| 2022 and thereafter |
791 | |||
|
|
|
|||
| $ | 1,635 | |||
|
|
|
|||
Lease expense was $784 thousand in 2016, $862 thousand in 2015, and $1.06 million in 2014. Certain portions of the Company’s leases have been sublet to third parties for properties not currently being used by the Company. Future minimum lease payments to be received under noncancelable subleases totaled $1 thousand as of December 31, 2016.
| Note 9. | Goodwill and Other Intangible Assets |
Goodwill
The company has one reporting unit for goodwill impairment testing purposes – Community Banking. Prior to October 2016, the Company maintained two reporting units — Community Banking and Insurance Services. The Insurance Services reporting unit consisted of the Company’s wholly owned subsidiary Greenpoint, which was sold in October 2016. The Company performed its annual qualitative assessment of goodwill as of October 31, 2016, and concluded that no impairment charge was necessary. No events have occurred after the 2016 analysis to indicate potential impairment.
98
Table of Contents
FIRST COMMUNITY BANCSHARES, INC.
NOTES TO CONSOLIDATED FINANCIAL STATEMENTS – (Continued)
The following table presents the changes in goodwill, by reporting unit, during the periods indicated:
| (Amounts in thousands) | Community Banking |
Insurance Services |
Total | |||||||||
| Balance January 1, 2014 |
$ | 96,541 | $ | 8,914 | $ | 105,455 | ||||||
| Acquisitions and dispositions, net |
(6,454 | ) | — | (6,454 | ) | |||||||
| Cash consideration paid |
1,368 | 353 | 1,721 | |||||||||
|
|
|
|
|
|
|
|||||||
| Balance December 31, 2014 |
$ | 91,455 | $ | 9,267 | $ | 100,722 | ||||||
|
|
|
|
|
|
|
|||||||
| Balance January 1, 2015 |
$ | 91,455 | $ | 9,267 | $ | 100,722 | ||||||
| Acquisitions and dispositions, net |
— | (324 | ) | (324 | ) | |||||||
| Cash consideration paid |
— | 88 | 88 | |||||||||
|
|
|
|
|
|
|
|||||||
| Balance December 31, 2015 |
$ | 91,455 | $ | 9,031 | $ | 100,486 | ||||||
|
|
|
|
|
|
|
|||||||
| Balance January 1, 2016 |
$ | 91,455 | $ | 9,031 | $ | 100,486 | ||||||
| Acquisitions and dispositions, net |
1,290 | (5,997 | ) | (4,707 | ) | |||||||
| Other (1) |
3,034 | (3,034 | ) | — | ||||||||
|
|
|
|
|
|
|
|||||||
| Balance December 31, 2016 |
$ | 95,779 | $ | — | $ | 95,779 | ||||||
|
|
|
|
|
|
|
|||||||
| (1) | Represents the transfer of goodwill after the sale of Greenpoint to one reporting unit |
Other Intangible Assets
The Company’s other intangible assets include core deposit and other identifiable intangibles. As of December 31, 2016, the remaining lives of core deposit intangibles ranged from 6 years to 9 years and the weighted average remaining life was 7 years. Other identifiable intangibles consist primarily of the value assigned to contractual rights arising from insurance agency acquisitions. The following table presents the components of other intangible assets, by reporting unit, as of the dates indicated:
| December 31, | ||||||||||||||||
| 2016 | 2015 | |||||||||||||||
| (Amounts in thousands) | Total | Community Banking |
Insurance Services |
Total | ||||||||||||
| Core deposit intangibles |
$ | 11,536 | $ | 12,282 | $ | — | $ | 12,282 | ||||||||
| Accumulated amortization |
(4,515 | ) | (7,958 | ) | — | (7,958 | ) | |||||||||
|
|
|
|
|
|
|
|
|
|||||||||
| Core deposit intangibles, net |
7,021 | 4,324 | — | 4,324 | ||||||||||||
| Other identifiable intangibles |
3,508 | 535 | 3,711 | 4,246 | ||||||||||||
| Accumulated amortization |
(3,322 | ) | (464 | ) | (2,863 | ) | (3,327 | ) | ||||||||
|
|
|
|
|
|
|
|
|
|||||||||
| Other identifiable intangibles, net |
186 | 71 | 848 | 919 | ||||||||||||
|
|
|
|
|
|
|
|
|
|||||||||
| Total other intangible assets, net |
$ | 7,207 | $ | 4,395 | $ | 848 | $ | 5,243 | ||||||||
|
|
|
|
|
|
|
|
|
|||||||||
99
Table of Contents
FIRST COMMUNITY BANCSHARES, INC.
NOTES TO CONSOLIDATED FINANCIAL STATEMENTS – (Continued)
Amortization expense for other intangible assets was $1.14 million in 2016, $1.12 million in 2015, and $787 thousand in 2014. The following schedule presents the estimated amortization expense for intangible assets, by year, as of December 31, 2016:
| (Amounts in thousands) | ||||
| 2017 |
$ | 1,029 | ||
| 2018 |
1,029 | |||
| 2019 |
1,029 | |||
| 2020 |
1,029 | |||
| 2021 |
1,015 | |||
| 2022 and thereafter |
2,034 | |||
|
|
|
|||
| $ | 7,165 | |||
|
|
|
|||
| Note 10. | Deposits |
The following table presents the components of deposits as of the dates indicated:
| December 31, | ||||||||
| (Amounts in thousands) | 2016 | 2015 | ||||||
| Noninterest-bearing demand deposits |
$ | 427,705 | $ | 451,511 | ||||
| Interest-bearing deposits: |
||||||||
| Interest-bearing demand deposits |
378,339 | 347,705 | ||||||
| Money market accounts |
196,997 | 213,982 | ||||||
| Savings deposits |
326,263 | 316,603 | ||||||
| Certificates of deposit |
382,503 | 408,519 | ||||||
| Individual retirement accounts |
129,531 | 134,939 | ||||||
|
|
|
|
|
|||||
| Total interest-bearing deposits |
1,413,633 | 1,421,748 | ||||||
|
|
|
|
|
|||||
| Total deposits |
$ | 1,841,338 | $ | 1,873,259 | ||||
|
|
|
|
|
|||||
The following schedule presents the contractual maturities of time deposits, by year, as of December 31, 2016:
| (Amounts in thousands) | ||||
| 2017 |
$ | 254,738 | ||
| 2018 |
88,596 | |||
| 2019 |
53,400 | |||
| 2020 |
68,644 | |||
| 2021 |
44,968 | |||
| 2022 and thereafter |
1,688 | |||
|
|
|
|||
| $ | 512,034 | |||
|
|
|
|||
100
Table of Contents
FIRST COMMUNITY BANCSHARES, INC.
NOTES TO CONSOLIDATED FINANCIAL STATEMENTS – (Continued)
Time deposits of $250 thousand or more totaled $41.55 million as of December 31, 2016, and $41.35 million as of December 31, 2015. The following schedule presents the contractual maturities of time deposits of $250 thousand or more as of December 31, 2016:
| (Amounts in thousands) | ||||
| Three months or less |
$ | 6,274 | ||
| Over three through six months |
2,687 | |||
| Over six through twelve months |
10,890 | |||
| Over twelve months |
21,698 | |||
|
|
|
|||
| $ | 41,549 | |||
|
|
|
|||
| Note 11. | Borrowings |
The following table presents the components of borrowings as of the dates indicated:
| December 31, | ||||||||||||||||
| 2016 | 2015 | |||||||||||||||
| (Amounts in thousands) | Balance | Weighted Average Rate |
Balance | Weighted Average Rate |
||||||||||||
| Short-term borrowings |
||||||||||||||||
| Retail repurchase agreements |
$ | 73,005 | 0.07 | % | $ | 88,614 | 0.10 | % | ||||||||
| Long-term borrowings |
||||||||||||||||
| Wholesale repurchase agreements |
25,000 | 3.18 | % | 50,000 | 3.71 | % | ||||||||||
| Long-term FHLB advances |
65,000 | 4.04 | % | 65,000 | 4.04 | % | ||||||||||
| Other borrowings |
||||||||||||||||
| Subordinated debt |
15,464 | 3.65 | % | 15,464 | 3.23 | % | ||||||||||
| Other debt |
244 | 292 | ||||||||||||||
|
|
|
|
|
|||||||||||||
| Total borrowings |
$ | 178,713 | $ | 219,370 | ||||||||||||
|
|
|
|
|
|||||||||||||
The following schedule presents the contractual and weighted average maturities of long-term borrowings, by year, as of December 31, 2016:
| (Amounts in thousands) | Wholesale Repurchase Agreements |
FHLB Borrowings |
Total | |||||||||
| 2017 |
$ | — | $ | 15,000 | $ | 15,000 | ||||||
| 2018 |
— | — | — | |||||||||
| 2019 |
25,000 | — | 25,000 | |||||||||
| 2020 |
— | — | — | |||||||||
| 2021 |
— | 50,000 | 50,000 | |||||||||
| 2022 and thereafter |
— | — | — | |||||||||
|
|
|
|
|
|
|
|||||||
| $ | 25,000 | $ | 65,000 | $ | 90,000 | |||||||
|
|
|
|
|
|
|
|||||||
| Weighted average maturity (in years) |
2.15 | 3.17 | 2.89 | |||||||||
The FHLB may redeem callable advances at quarterly intervals, which could substantially shorten the advances’ lives. If called, the advance may be paid in full or converted into another FHLB credit product. Prepayment of an advance may result in substantial penalties based on the differential between the contractual note and current advance rate for similar maturities. The Company pledged certain loans to secure FHLB advances and letters of
101
Table of Contents
FIRST COMMUNITY BANCSHARES, INC.
NOTES TO CONSOLIDATED FINANCIAL STATEMENTS – (Continued)
credit totaling $1.03 billion as of December 31, 2016. Unused borrowing capacity with the FHLB totaled $558.75 million, net of FHLB letters of credit $75.72 million, as of December 31, 2016. The FHLB letters of credit provide an attractive alternative to pledging securities for public unit deposits.
Investment securities pledged to secure repurchase agreements remain under the Company’s control during the agreements’ terms. The counterparties may redeem callable repurchase agreements, which could substantially shorten the borrowings’ lives. The prepayment or unwind of a repurchase agreement may result in substantial penalties based on market conditions.
The following schedule presents the contractual maturities of repurchase agreements, by type of collateral pledged, as of December 31, 2016:
| (Amounts in thousands) | U.S.
Agency Securities |
Municipal Securities | Mortgage-backed Agency Securities |
Total | ||||||||||||
| Overnight and continuous |
$ | 18,680 | $ | 44,414 | $ | 7,821 | $ | 70,915 | ||||||||
| Up to 30 days |
— | — | — | — | ||||||||||||
| 30 — 90 days |
— | — | — | — | ||||||||||||
| Greater than 90 days |
— | 1,204 | 25,886 | 27,090 | ||||||||||||
|
|
|
|
|
|
|
|
|
|||||||||
| $ | 18,680 | $ | 45,618 | $ | 33,707 | $ | 98,005 | |||||||||
|
|
|
|
|
|
|
|
|
|||||||||
Subordinated debt consists of $15.46 million of junior subordinated debentures (“Debentures”) the Company issued to the Trust in October 2003 with an interest rate of three-month London InterBank Offered Rate (“LIBOR”) plus 2.95%. The Debentures mature on October 8, 2033, and are callable quarterly. The Trust purchased the Debentures through the issuance of trust preferred securities, which had substantially identical terms as the Debentures. Net proceeds from the offering were contributed as capital to the Bank to support further growth. The Company’s obligations under the Debentures and other relevant Trust agreements, in aggregate, constitute a full and unconditional guarantee of the Trust’s obligations. The preferred securities issued by the Trust are not included in the consolidated balance sheets; however, these securities qualify as Tier 1 capital for regulatory purposes, subject to guidelines issued by the Board of Governors of the Federal Reserve System (“Federal Reserve”). The Federal Reserve’s quantitative limits did not prevent the Company from including all $15.46 million in trust preferred securities outstanding in Tier 1 capital as of December 31, 2016 and 2015. On January 9, 2017, the Company redeemed all of its trust preferred securities.
In addition, the Company maintains a $15.00 million unsecured, committed line of credit with an unrelated financial institution with an interest rate of one-month LIBOR plus 2.00% and an April 2017 maturity. There was no outstanding balance on the line as of December 31, 2016, or December 31, 2015.
| Note 12. | Derivative Instruments and Hedging Activities |
As of December 31, 2016, the Company’s derivative instruments consisted of interest rate swaps. Generally, derivative instruments help the Company manage exposure to market risk and meet customer financing needs. Market risk represents the possibility that fluctuations in external factors such as interest rates, market-driven loan rates, prices, or other economic factors will adversely affect economic value or net interest income.
The Company uses interest rate swap contracts to modify its exposure to interest rate risk caused by changes in the LIBOR curve in relation to certain designated fixed rate loans. These instruments are used to convert these fixed rate loans to an effective floating rate. If the LIBOR rate falls below the loan’s stated fixed rate for a given period, the Company will owe the floating rate payer the notional amount times the difference between LIBOR
102
Table of Contents
FIRST COMMUNITY BANCSHARES, INC.
NOTES TO CONSOLIDATED FINANCIAL STATEMENTS – (Continued)
and the stated fixed rate. If LIBOR is above the stated rate for a given period, the Company will receive payments based on the notional amount times the difference between LIBOR and the stated fixed rate. The Company’s interest rate swaps qualify as fair value hedging instruments; therefore, fair value changes in the derivative and hedged item attributable to the hedged risk are recognized in earnings in the same period.
The Company’s interest rate swaps include a fourteen-year, $1.20 million notional interest rate swap agreement entered into in March 2015 and a fifteen-year, $4.37 million notional interest rate swap agreement entered into in February 2014. The swap agreements, which are accounted for as fair value hedges, and the loans hedged by the agreements are recorded at fair value. The fair value hedges were effective as of December 31, 2016. The following table presents the notional, or contractual, amounts and fair values of derivative instruments as of the dates indicated:
| December 31, | ||||||||||||||||||||||||
| 2016 | 2015 | |||||||||||||||||||||||
| (Amounts in thousands) | Notional or Contractual Amount |
Derivative Assets |
Derivative Liabilities |
Notional or Contractual Amount |
Derivative Assets |
Derivative Liabilities |
||||||||||||||||||
| Derivatives designated as hedges |
||||||||||||||||||||||||
| Interest rate swaps |
$ | 4,835 | $ | — | $ | 167 | $ | 5,151 | $ | — | $ | 251 | ||||||||||||
|
|
|
|
|
|
|
|
|
|
|
|
|
|||||||||||||
| Total derivatives |
$ | 4,835 | $ | — | $ | 167 | $ | 5,151 | $ | — | $ | 251 | ||||||||||||
|
|
|
|
|
|
|
|
|
|
|
|
|
|||||||||||||
The following table presents the effect of derivative and hedging activity, if applicable, on the consolidated statements of income for the periods indicated:
| Year Ended December 31, | ||||||||||||||||
| (Amounts in thousands) | 2016 | 2015 | 2014 | Income Statement Location |
||||||||||||
| Derivatives designated as hedges |
||||||||||||||||
| Interest rate swaps |
$ | 116 | $ | 122 | $ | 162 | Interest and fees on loans | |||||||||
|
|
|
|
|
|
|
|||||||||||
| Total derivatives |
$ | 116 | $ | 122 | $ | 162 | ||||||||||
|
|
|
|
|
|
|
|||||||||||
103
Table of Contents
FIRST COMMUNITY BANCSHARES, INC.
NOTES TO CONSOLIDATED FINANCIAL STATEMENTS – (Continued)
| Note 13. | Employee Benefit Plans |
Defined Benefit Plans
The Company maintains two nonqualified domestic, noncontributory defined benefit plans (the “Benefit Plans”) for key members of senior management and non-management directors. The Company’s unfunded Benefit Plans include the Supplemental Executive Retention Plan (“SERP”) and the Directors’ Supplemental Retirement Plan (“Directors’ Plan”). The SERP provides for a defined benefit, at normal retirement age, targeted at 35% of the participant’s projected final average compensation, subject to a defined maximum annual benefit. Benefits under the SERP generally become payable at age 62. The Directors’ Plan provides for a defined benefit, at normal retirement age, up to 100% of the participant’s highest consecutive three-year average compensation. Benefits under the Directors’ Plan generally become payable at age 70. The following table presents the changes in the aggregate actuarial benefit obligation during the periods indicated:
| December 31, | ||||||||
| (Amounts in thousands) | 2016 | 2015 | ||||||
| Beginning balance |
$ | 8,390 | $ | 7,631 | ||||
| Plan change |
69 | — | ||||||
| Service cost |
184 | 180 | ||||||
| Interest cost |
382 | 334 | ||||||
| Actuarial loss |
367 | 363 | ||||||
| Benefits paid |
(211 | ) | (118 | ) | ||||
|
|
|
|
|
|||||
| Ending balance |
$ | 9,181 | $ | 8,390 | ||||
|
|
|
|
|
|||||
The following table presents the components of net periodic pension cost and the assumed discount rate for the periods indicated:
| Year Ended December 31, | ||||||||||||
| (Amounts in thousands, except discount rate) | 2016 | 2015 | 2014 | |||||||||
| Service cost |
$ | 184 | $ | 180 | $ | 128 | ||||||
| Interest cost |
382 | 334 | 336 | |||||||||
| Amortization of prior service cost |
226 | 260 | 260 | |||||||||
| Amortization of losses |
47 | 66 | — | |||||||||
|
|
|
|
|
|
|
|||||||
| Net periodic cost |
$ | 839 | $ | 840 | $ | 724 | ||||||
|
|
|
|
|
|
|
|||||||
| Assumed discount rate |
4.22 | % | 4.62 | % | 4.41 | % | ||||||
The following schedule presents the projected benefit payments to be paid under the Benefit Plans, by year, as of December 31, 2016:
| (Amounts in thousands) | ||||
| 2017 |
$ | 465 | ||
| 2018 |
462 | |||
| 2019 |
458 | |||
| 2020 |
529 | |||
| 2021 |
587 | |||
| 2022 through 2026 |
2,937 | |||
104
Table of Contents
FIRST COMMUNITY BANCSHARES, INC.
NOTES TO CONSOLIDATED FINANCIAL STATEMENTS – (Continued)
Employee Welfare Plan
The Company provides various medical, dental, vision, life, accidental death and dismemberment, and long-term disability insurance benefits to all full-time employees who elect coverage under this program. A third-party administrator manages the health plan. Monthly employer and employee contributions are made to a tax-exempt employee benefits trust where the third-party administrator processes and pays claims. As of December 31, 2016, stop-loss insurance coverage generally limits the Company’s risk of loss to $125 thousand for individual claims and $3.92 million for aggregate claims. Expenses related to the health plan totaled $3.48 million in 2016, $3.06 million in 2015, and $2.88 million in 2014.
Deferred Compensation Plan
The Company maintains deferred compensation agreements with certain current and former officers that provide benefit payments, over various periods, commencing at retirement or death. Accrued benefits are based on the present values of expected payments and estimated life expectancies and totaled $458 thousand as of December 31, 2016 and 2015. Expenses related to the deferred compensation plan totaled $60 thousand in each of the three years ended December 31, 2016.
Employee Stock Ownership and Savings Plan
The Company maintains the Employee Stock Ownership and Savings Plan (“KSOP”) that consists of a 401(k) savings feature that covers all employees that meet minimum eligibility requirements. The Company matches employee contributions at levels determined by the Board of Directors annually. These contributions are made in the first quarter following each plan year and employees must be employed on the last day of the plan year to be eligible. Matching contributions to qualified deferrals under the 401(k) savings component of the KSOP totaled $1.50 million in 2016, $1.53 million in 2015, and $1.58 million in 2014. The KSOP held 410,384 shares of the Company’s common stock as of December 31, 2016, 428,785 shares as of December 31, 2015, and 457,765 shares as of December 31, 2014. Substantially all plan assets are invested in the Company’s common stock.
Equity-Based Compensation Plans
The Company maintains equity-based compensation plans to promote the long-term success of the Company by encouraging officers, employees, directors, and other individuals performing services for the Company to focus on critical long-range objectives. The Company’s equity-based compensation plans include the 2012 Omnibus Equity Compensation Plan (“2012 Plan”), 2004 Omnibus Stock Option Plan, 2001 Director’s Option Plan, 1999 Stock Option Plan, and various other plans obtained through acquisitions. As of December 31, 2016, the 2012 Plan was the only plan available for the issuance of future grants. All plans issued or obtained before the 2012 Plan are frozen and no new grants may be issued; however, any options or awards unexercised and outstanding under those plans remain in effect per their respective terms. The 2012 Plan authorized 600,000 shares available for potential grants of incentive stock options, nonqualified stock options, performance awards, restricted stock, restricted stock units, stock appreciation rights, bonus stock, and stock awards. Grants issued under the 2012 Plan state the period of time the grant may be exercised, not to exceed more than ten years from the date granted. The Company’s Compensation and Retirement Committee determines the vesting period for each grant; however, if no vesting period is specified the vesting occurs in 25% increments on the first four anniversaries of the grant date.
105
Table of Contents
FIRST COMMUNITY BANCSHARES, INC.
NOTES TO CONSOLIDATED FINANCIAL STATEMENTS – (Continued)
The following table presents the pre-tax compensation expense and excess tax benefit recognized in earnings for all equity-based compensation plans for the periods indicated:
| Year Ended December 31, | ||||||||||||
| (Amounts in thousands) | 2016 | 2015 | 2014 | |||||||||
| Pre-tax compensation expense |
$ | 209 | $ | 110 | $ | 332 | ||||||
| Excess tax benefit |
174 | 8 | 5 | |||||||||
Stock Options
The following table presents stock option activity and related information for the year ended December 31, 2016:
| (Amounts in thousands, except share and per share data) |
Option | Weighted Average Exercise Price |
Weighted Average Remaining Contractual |
Aggregate Intrinsic |
||||||||||||
| Shares | Per Share | Term (Years) | Value | |||||||||||||
| Outstanding, January 1, 2016 |
236,404 | $ | 20.17 | |||||||||||||
| Granted |
32,768 | 20.15 | ||||||||||||||
| Exercised |
(43,463 | ) | 17.26 | |||||||||||||
| Canceled |
(25,313 | ) | 28.56 | |||||||||||||
|
|
|
|
|
|||||||||||||
| Outstanding, December 31, 2016 |
200,396 | $ | 19.73 | 6.1 | $ | 2,123 | ||||||||||
|
|
|
|
|
|
|
|
|
|||||||||
| Exercisable, December 31, 2016 |
167,628 | $ | 19.65 | 5.5 | $ | 1,790 | ||||||||||
|
|
|
|
|
|
|
|
|
|||||||||
The following table presents the total options granted and the weighted average assumptions used to estimate the fair value of those options during the periods indicated:
| Year Ended December 31, | ||||||||||||
| 2016 | 2015 | 2014 | ||||||||||
| Stock options granted |
$ | 32,768 | $ | — | $ | — | ||||||
| Grant-date fair value per share |
10.16 | — | — | |||||||||
| Volatility |
25.04 | % | — | — | ||||||||
| Risk-free rate |
1.56 | % | — | — | ||||||||
| Expected dividend yield |
3.09 | % | — | — | ||||||||
| Expected term (in years) |
6.50 | — | — | |||||||||
The intrinsic value of options exercised totaled $434 thousand in 2016, $20 thousand in 2015, and $13 thousand in 2014. As of December 31, 2016, unrecognized compensation cost related to nonvested stock options was $101 thousand with an expected weighted average recognition period of 1.11 years. The actual compensation cost recognized might differ from this estimate due to various items, including new grants and changes in estimated forfeitures.
106
Table of Contents
FIRST COMMUNITY BANCSHARES, INC.
NOTES TO CONSOLIDATED FINANCIAL STATEMENTS – (Continued)
Restricted Stock Awards
The following table presents restricted stock activity and related information for the year ended December 31, 2016:
| Weighted Average | ||||||||
| Shares | Grant-Date Fair Value |
|||||||
| Nonvested, January 1, 2016 |
5,327 | $ | 16.85 | |||||
| Granted |
46,033 | 19.97 | ||||||
| Vested |
(21,533 | ) | 17.90 | |||||
| Canceled |
(2,024 | ) | 19.27 | |||||
|
|
|
|
|
|||||
| Nonvested, December 31, 2016 |
27,803 | $ | 20.59 | |||||
|
|
|
|
|
|||||
As of December 31, 2016, unrecognized compensation cost related to nonvested restricted stock awards was $447 thousand with an expected weighted average recognition period of 2.03 years. The actual compensation cost recognized might differ from this estimate due to various items, including new awards granted and changes in estimated forfeitures.
Performance Stock Awards
Performance stock awards represent restricted stock that may be issuable in the future if specific performance criteria are met. The following table presents performance stock activity and related information for the year ended December 31, 2016:
| Shares | Weighted Average Grant-Date Fair Value |
|||||||
| Nonvested, January 1, 2016 |
9,848 | $ | 15.83 | |||||
| Granted |
— | — | ||||||
| Vested |
(9,848 | ) | 15.83 | |||||
| Canceled |
— | — | ||||||
|
|
|
|
|
|||||
| Nonvested, December 31, 2016 |
— | $ | — | |||||
|
|
|
|
|
|||||
As of December 31, 2016, there was no unrecognized compensation cost related to nonvested performance stock awards. The actual compensation cost recognized might differ from this estimate due to various items, including new awards granted, changes in estimated forfeitures, and resolution of performance contingencies.
107
Table of Contents
FIRST COMMUNITY BANCSHARES, INC.
NOTES TO CONSOLIDATED FINANCIAL STATEMENTS – (Continued)
| Note 14. | Other Operating Income and Expense |
The following table presents the components of other operating income and expense for the periods indicated:
| Year Ended December 31, | ||||||||||||
| (Amounts in thousands) | 2016 | 2015 | 2014 | |||||||||
| Other operating income |
||||||||||||
| Bank owned life insurance |
$ | 955 | $ | 1,971 | $ | 1,587 | ||||||
|
Other (1) |
2,254 | 2,158 | 2,768 | |||||||||
|
|
|
|
|
|
|
|||||||
| Total other operating income |
$ | 3,209 | $ | 4,129 | $ | 4,355 | ||||||
|
|
|
|
|
|
|
|||||||
| Other operating expense |
||||||||||||
| Service fees |
$ | 3,641 | $ | 3,401 | $ | 3,856 | ||||||
| ATM processing expenses |
2,024 | 2,407 | 2,102 | |||||||||
| Telephone and data communications |
1,598 | 1,595 | 1,715 | |||||||||
| Advertising and public relations |
1,532 | 1,309 | 1,001 | |||||||||
| Professional fees |
1,501 | 1,272 | 1,436 | |||||||||
| OREO expense and net loss |
1,420 | 2,438 | 2,094 | |||||||||
| Office supplies |
1,220 | 1,228 | 1,514 | |||||||||
|
Other (1) |
7,011 | 7,461 | 8,524 | |||||||||
|
|
|
|
|
|
|
|||||||
| Total other operating expense |
$ | 19,947 | $ | 21,111 | $ | 22,242 | ||||||
|
|
|
|
|
|
|
|||||||
| (1) | Other components of other operating income or expense that do not exceed 1% of total income. |
| Note 15. | Income Taxes |
Income tax expense is comprised of current and deferred, federal and state income taxes on the Company’s pre-tax earnings. The following table presents the components of the income tax provision for the periods indicated:
| Year Ended December 31, | ||||||||||||
| (Amounts in thousands) | 2016 | 2015 | 2014 | |||||||||
| Current tax expense (benefit): |
||||||||||||
| Federal |
$ | 13,634 | $ | (254 | ) | $ | 7,234 | |||||
| State |
675 | 581 | 1,325 | |||||||||
|
|
|
|
|
|
|
|||||||
| Total current tax expense |
14,309 | 327 | 8,559 | |||||||||
| Deferred tax expense (benefit): |
||||||||||||
| Federal |
(1,480 | ) | 10,034 | 2,971 | ||||||||
| State |
(10 | ) | 1,020 | 794 | ||||||||
|
|
|
|
|
|
|
|||||||
| Total deferred tax expense (benefit) |
(1,490 | ) | 11,054 | 3,765 | ||||||||
|
|
|
|
|
|
|
|||||||
| Total income tax expense |
$ | 12,819 | $ | 11,381 | $ | 12,324 | ||||||
|
|
|
|
|
|
|
|||||||
108
Table of Contents
FIRST COMMUNITY BANCSHARES, INC.
NOTES TO CONSOLIDATED FINANCIAL STATEMENTS – (Continued)
The Company’s effective tax rate, income tax as a percent of pre-tax income, may vary significantly from the statutory rate due to permanent differences and available tax credits. Permanent differences are income and expense items excluded by law in the calculation of taxable income. The Company’s most significant permanent differences generally include interest income on municipal securities and increases in the cash surrender value of life insurance policies. The following table reconciles the Company’s income tax expense to the amount computed by applying the federal statutory tax rate to pre-tax income for the periods indicated:
| Year Ended December 31, | ||||||||||||||||||||||||
| 2016 | 2015 | 2014 | ||||||||||||||||||||||
| (Amounts in thousands) | Amount | Percent | Amount | Percent | Amount | Percent | ||||||||||||||||||
| Income tax at the federal statutory rate |
$ | 13,281 | 35.00 | % | $ | 12,572 | 35.00 | % | $ | 13,235 | 35.00 | % | ||||||||||||
| State income taxes, net of federal benefit |
598 | 1.58 | % | 639 | 1.78 | % | 1,006 | 2.66 | % | |||||||||||||||
|
|
|
|
|
|
|
|
|
|
|
|
|
|||||||||||||
| 13,878 | 36.58 | % | 13,212 | 36.78 | % | 14,241 | 37.66 | % | ||||||||||||||||
| Increase (decrease) resulting from: |
||||||||||||||||||||||||
| Tax-exempt interest income |
(1,336 | ) | -3.52 | % | (1,463 | ) | -4.07 | % | (1,645 | ) | -4.35 | % | ||||||||||||
| Nondeductible goodwill |
340 | 0.89 | % | — | — | — | — | |||||||||||||||||
| Bank owned life insurance |
(335 | ) | -0.88 | % | (690 | ) | -1.92 | % | (555 | ) | -1.47 | % | ||||||||||||
| Other items, net |
271 | 0.71 | % | 322 | 0.89 | % | 283 | 0.75 | % | |||||||||||||||
|
|
|
|
|
|
|
|
|
|
|
|
|
|||||||||||||
| Income tax at the effective tax rate |
$ | 12,819 | 33.78 | % | $ | 11,381 | 31.68 | % | $ | 12,324 | 32.59 | % | ||||||||||||
|
|
|
|
|
|
|
|
|
|
|
|
|
|||||||||||||
Deferred taxes derived from continuing operations reflect the net effect of temporary differences between the carrying amounts of assets and liabilities for financial reporting purposes and amounts used for tax purposes. The following table presents the significant components of the net deferred tax asset as of the dates indicated:
| December 31, | ||||||||
| (Amounts in thousands) | 2016 | 2015 | ||||||
| Deferred tax assets |
||||||||
| Allowance for loan losses |
$ | 6,644 | $ | 7,741 | ||||
| Unrealized losses on available-for-sale securities |
326 | 2,331 | ||||||
| Unrealized asset losses |
913 | 1,506 | ||||||
| Purchase accounting |
5,384 | 5,014 | ||||||
| FDIC assisted transactions |
6,540 | 6,551 | ||||||
| Intangible assets |
4,062 | 4,082 | ||||||
| Deferred compensation assets |
4,669 | 4,529 | ||||||
| Deferred loan fees |
1,979 | 1,402 | ||||||
| Other deferred tax assets |
825 | 1,181 | ||||||
|
|
|
|
|
|||||
| Total deferred tax assets |
31,342 | 34,337 | ||||||
| Deferred tax liabilities |
||||||||
| FDIC indemnification asset |
11,927 | 13,162 | ||||||
| Fixed assets |
2,042 | 2,658 | ||||||
| Odd days interest deferral |
1,283 | 1,975 | ||||||
| Other |
347 | 347 | ||||||
|
|
|
|
|
|||||
| Total deferred tax liabilities |
15,599 | 18,142 | ||||||
|
|
|
|
|
|||||
| Net deferred tax asset |
$ | 15,743 | $ | 16,195 | ||||
|
|
|
|
|
|||||
The Company had no unrecognized tax benefits or accrued interest and penalties as of December 31, 2016 or 2015.
109
Table of Contents
FIRST COMMUNITY BANCSHARES, INC.
NOTES TO CONSOLIDATED FINANCIAL STATEMENTS – (Continued)
| Note 16. | Accumulated Other Comprehensive Income |
The following table presents the changes in AOCI, net of tax and by component, during the periods indicated:
| (Amounts in thousands) | Unrealized Gains (Losses) on Available-for-Sale Securities |
Employee Benefit Plans |
Total | |||||||||
| Balance January 1, 2014 |
$ | (13,640 | ) | $ | (1,100 | ) | $ | (14,740 | ) | |||
| Other comprehensive income (loss) before reclassifications |
8,051 | (401 | ) | 7,650 | ||||||||
| Reclassified from AOCI |
1,323 | 162 | 1,485 | |||||||||
|
|
|
|
|
|
|
|||||||
| Other comprehensive income (loss), net |
9,374 | (239 | ) | 9,135 | ||||||||
|
|
|
|
|
|
|
|||||||
| Balance December 31, 2014 |
$ | (4,266 | ) | $ | (1,339 | ) | $ | (5,605 | ) | |||
|
|
|
|
|
|
|
|||||||
| Balance January 1, 2015 |
$ | (4,266 | ) | $ | (1,339 | ) | $ | (5,605 | ) | |||
| Other comprehensive income (loss) before reclassifications |
471 | (226 | ) | 245 | ||||||||
| Reclassified from AOCI |
(90 | ) | 203 | 113 | ||||||||
|
|
|
|
|
|
|
|||||||
| Other comprehensive income (loss), net |
381 | (23 | ) | 358 | ||||||||
|
|
|
|
|
|
|
|||||||
| Balance December 31, 2015 |
$ | (3,885 | ) | $ | (1,362 | ) | $ | (5,247 | ) | |||
|
|
|
|
|
|
|
|||||||
| Balance January 1, 2016 |
$ | (3,885 | ) | $ | (1,362 | ) | $ | (5,247 | ) | |||
| Other comprehensive income (loss) before reclassifications |
647 | (276 | ) | 371 | ||||||||
| Reclassified from AOCI |
2,694 | 171 | 2,865 | |||||||||
|
|
|
|
|
|
|
|||||||
| Other comprehensive income (loss), net |
3,341 | (105 | ) | 3,236 | ||||||||
|
|
|
|
|
|
|
|||||||
| Balance December 31, 2016 |
$ | (544 | ) | $ | (1,467 | ) | $ | (2,011 | ) | |||
|
|
|
|
|
|
|
|||||||
110
Table of Contents
FIRST COMMUNITY BANCSHARES, INC.
NOTES TO CONSOLIDATED FINANCIAL STATEMENTS – (Continued)
The following table presents reclassifications out of AOCI, by component, during the periods indicated:
| Year Ended December 31, | Income Statement | |||||||||||||
| (Amounts in thousands) | 2016 | 2015 | 2014 | Line Item Affected | ||||||||||
| Available-for-sale securities |
||||||||||||||
| (Gains) losses recognized |
(335 | ) | (144 | ) | 1,385 | Net gain (loss) on sale of securities | ||||||||
| OTTI recognized |
4,646 | — | 737 | Net impairment losses recognized in earnings | ||||||||||
|
|
|
|
|
|
|
|||||||||
| Reclassified out of AOCI, before tax |
4,311 | (144 | ) | 2,122 | Income before income taxes | |||||||||
| Income tax (expense) benefit |
(1,617 | ) | 54 | (799 | ) | Income tax expense | ||||||||
|
|
|
|
|
|
|
|||||||||
| Reclassified out of AOCI, net of tax |
2,694 | (90 | ) | 1,323 | Net income | |||||||||
| Employee benefit plans |
||||||||||||||
| Amortization of prior service cost |
226 | 260 | 260 | (1) | ||||||||||
| Amortization of net actuarial loss |
47 | 66 | — | (1) | ||||||||||
|
|
|
|
|
|
|
|||||||||
| Reclassified out of AOCI, before tax |
273 | 326 | 260 | Income before income taxes | ||||||||||
| Income tax expense |
(102 | ) | (123 | ) | (98 | ) | Income tax expense | |||||||
|
|
|
|
|
|
|
|||||||||
| Reclassified out of AOCI, net of tax |
171 | 203 | 162 | Net income | ||||||||||
|
|
|
|
|
|
|
|||||||||
| Total reclassified out of AOCI, net of tax |
$ | 2,865 | $ | 113 | $ | 1,485 | Net income | |||||||
|
|
|
|
|
|
|
|||||||||
| (1) | Amortization is included in net periodic pension cost. See Note 13, “Employee Benefit Plans” |
| Note 17. | Fair Value |
Financial Instruments Measured at Fair Value
The following discussion describes the valuation methodologies used for instruments measured at fair value, as well as the general classification of such instruments under the valuation hierarchy.
Assets and Liabilities Reported at Fair Value on a Recurring Basis
Available-for-Sale Securities. Securities available for sale are reported at fair value on a recurring basis. The fair value of Level 1 securities is based on quoted market prices in active markets, if available. The Company also uses Level 1 inputs to value equity securities that are traded in active markets. If quoted market prices are not available, fair values are measured utilizing independent valuation techniques of identical or similar securities for which significant assumptions are primarily derived from or corroborated by observable market data. Level 2 securities use fair value measurements from independent pricing services obtained by the Company. These fair value measurements consider observable data that may include dealer quotes, market spreads, cash flows, the Treasury yield curve, live trading levels, trade execution data, market consensus prepayment speeds, credit information, and bond terms and conditions. The Company’s Level 2 securities include Treasury securities, single issue trust preferred securities, corporate securities, mortgage-backed securities, and certain equity securities that are not actively traded. Securities are based on Level 3 inputs when there is limited activity or less transparency to the valuation inputs. In the absence of observable or corroborated market data, internally developed estimates that incorporate market-based assumptions are used when such information is available.
Fair value models may be required when trading activity has declined significantly or does not exist, prices are not current, or pricing variations are significant. For Level 3 securities, the Company obtains the cash flow of
111
Table of Contents
FIRST COMMUNITY BANCSHARES, INC.
NOTES TO CONSOLIDATED FINANCIAL STATEMENTS – (Continued)
specific securities from third parties that use modeling software to determine cash flows based on market participant data and knowledge of the structures of each individual security. The fair values of Level 3 securities are determined by applying proper market observable discount rates to the cash flow derived from third-party models. Discount rates are developed by determining credit spreads above a benchmark rate, such as LIBOR, and adding premiums for illiquidity, which are based on a comparison of initial issuance spread to LIBOR versus a financial sector curve for recently issued debt to LIBOR. Securities with increased uncertainty about the receipt of cash flows are discounted at higher rates due to the addition of a deal specific credit premium based on assumptions about the performance of the underlying collateral. Finally, internal fair value model pricing and external pricing observations are combined by assigning weights to each pricing observation. Pricing is reviewed for reasonableness based on the direction of specific markets and the general economic indicators.
Loans Held for Investment. Loans held for investment are reported at fair value using discounted future cash flows that apply current interest rates for loans with similar terms and borrower credit quality. Loans related to fair value hedges are recorded at fair value on a recurring basis.
Deferred Compensation Assets and Liabilities. Securities held for trading purposes are recorded at fair value on a recurring basis and included in other assets in the consolidated balance sheets. These securities include assets related to employee deferred compensation plans, which are generally invested in Level 1 equity securities. The liability associated with these deferred compensation plans is carried at the fair value of the obligation to the employee, which corresponds to the fair value of the invested assets.
Derivative Assets and Liabilities. Derivatives are recorded at fair value on a recurring basis. The Company obtains dealer quotes, Level 2 inputs, based on observable data to value derivatives.
The following tables summarize financial assets and liabilities recorded at fair value on a recurring basis, by the level of valuation inputs in the fair value hierarchy, as of the dates indicated:
| December 31, 2016 | ||||||||||||||||
| Total Fair Value |
Fair Value Measurements Using |
|||||||||||||||
| (Amounts in thousands) | Level 1 | Level 2 | Level 3 | |||||||||||||
| Available-for-sale securities |
||||||||||||||||
| U.S. Agency securities |
$ | 1,345 | $ | — | $ | 1,345 | $ | — | ||||||||
| Municipal securities |
113,331 | — | 113,331 | — | ||||||||||||
| Single issue trust preferred securities |
19,939 | — | 19,939 | — | ||||||||||||
| Mortgage-backed Agency securities |
30,891 | — | 30,891 | — | ||||||||||||
| Equity securities |
73 | 55 | 18 | — | ||||||||||||
|
|
|
|
|
|
|
|
|
|||||||||
| Total available-for-sale securities |
165,579 | 55 | 165,524 | — | ||||||||||||
| Fair value loans |
4,701 | — | 4,701 | — | ||||||||||||
| Deferred compensation assets |
3,224 | 3,224 | — | — | ||||||||||||
| Deferred compensation liabilities |
3,224 | 3,224 | — | — | ||||||||||||
| Derivative liabilities |
167 | — | 167 | — | ||||||||||||
112
Table of Contents
FIRST COMMUNITY BANCSHARES, INC.
NOTES TO CONSOLIDATED FINANCIAL STATEMENTS – (Continued)
| December 31, 2015 | ||||||||||||||||
| Total Fair Value |
Fair Value Measurements Using | |||||||||||||||
| (Amounts in thousands) | Level 1 | Level 2 | Level 3 | |||||||||||||
| Available-for-sale securities |
||||||||||||||||
| U.S. Agency securities |
$ | 30,702 | $ | — | $ | 30,702 | $ | — | ||||||||
| Municipal securities |
128,678 | — | 128,678 | — | ||||||||||||
| Single issue trust preferred securities |
47,832 | — | 47,832 | — | ||||||||||||
| Corporate securities |
70,333 | — | 70,333 | — | ||||||||||||
| Certificates of deposit |
5,000 | — | 5,000 | — | ||||||||||||
| Mortgage-backed Agency securities |
83,556 | — | 83,556 | — | ||||||||||||
| Equity securities |
72 | 54 | 18 | — | ||||||||||||
|
|
|
|
|
|
|
|
|
|||||||||
| Total available-for-sale securities |
366,173 | 54 | 366,119 | — | ||||||||||||
| Fair value loans |
4,886 | — | 4,886 | — | ||||||||||||
| Deferred compensation assets |
3,464 | 3,464 | — | — | ||||||||||||
| Deferred compensation liabilities |
3,464 | 3,464 | — | — | ||||||||||||
| Derivative liabilities |
251 | — | 251 | — | ||||||||||||
No changes in valuation techniques or transfers into or out of Level 3 of the fair value hierarchy occurred during the years ended December 31, 2016 or 2015.
Assets Measured at Fair Value on a Nonrecurring Basis
Impaired Loans. Impaired loans are recorded at fair value on a nonrecurring basis when repayment is expected solely from the sale of the loan’s collateral. Fair value is based on appraised value adjusted for customized discounting criteria, Level 3 inputs.
The Company maintains an active and robust problem credit identification system. The impairment review includes obtaining third-party collateral valuations to help management identify potential credit impairment and determine the amount of impairment to record. The Company’s Special Assets staff manages and monitors all impaired loans. Internal collateral valuations are generally performed within two to four weeks of identifying the initial potential impairment. The internal valuation compares the original appraisal to current local real estate market conditions and considers experience and expected liquidation costs. The Company typically receives a third-party valuation within thirty to forty-five days of completing the internal valuation. When a third-party valuation is received, it is reviewed for reasonableness. Once the valuation is reviewed and accepted, discounts are applied to fair market value, based on, but not limited to, our historical liquidation experience for like collateral, resulting in an estimated net realizable value. The estimated net realizable value is compared to the outstanding loan balance to determine the appropriate amount of specific impairment reserve.
Specific reserves are generally recorded for impaired loans while third-party valuations are in process and for impaired loans that continue to make some form of payment. While waiting to receive the third-party appraisal, the Company regularly reviews the relationship to identify any potential adverse developments and begins the tasks necessary to gain control of the collateral and prepare it for liquidation, including, but not limited to, engagement of counsel, inspection of collateral, and continued communication with the borrower. Generally, the only difference between the current appraised value, less liquidation costs, and the carrying amount of the loan, less the specific reserve, is any downward adjustment to the appraised value that the Company deems appropriate, such as the costs to sell the property. Impaired loans that do not meet certain criteria and do not have a specific reserve have typically been written down through partial charge-offs to net realizable value. Based on prior experience, the Company rarely returns loans to performing status after they have been partially charged off. Credits identified as impaired move quickly through the process towards ultimate resolution, except in cases involving bankruptcy and various state judicial processes that may extend the time for ultimate resolution.
113
Table of Contents
FIRST COMMUNITY BANCSHARES, INC.
NOTES TO CONSOLIDATED FINANCIAL STATEMENTS – (Continued)
OREO. OREO is recorded at fair value on a nonrecurring basis using Level 3 inputs. The Company calculates the fair value of OREO from current or prior appraisals that have been adjusted for valuation declines, estimated selling costs, and other proprietary qualitative adjustments that are deemed necessary.
The following tables present assets measured at fair value on a nonrecurring basis, by the level of valuation inputs in the fair value hierarchy, as of the dates indicated:
| December 31, 2016 | ||||||||||||||||
| Total Fair Value |
Fair Value Measurements Using | |||||||||||||||
| (Amounts in thousands) | Level 1 | Level 2 | Level 3 | |||||||||||||
| Impaired loans, non-covered |
$ | 4,078 | $ | — | $ | — | $ | 4,078 | ||||||||
| OREO, non-covered |
5,109 | — | — | 5,109 | ||||||||||||
| OREO, covered |
265 | — | — | 265 | ||||||||||||
| December 31, 2015 | ||||||||||||||||
| Total Fair Value |
Fair Value Measurements Using | |||||||||||||||
| Level 1 | Level 2 | Level 3 | ||||||||||||||
| (Amounts in thousands) | ||||||||||||||||
| Impaired loans, non-covered |
$ | 9,164 | $ | — | $ | — | $ | 9,164 | ||||||||
| OREO, non-covered |
4,819 | — | — | 4,819 | ||||||||||||
| OREO, covered |
4,034 | — | — | 4,034 | ||||||||||||
Quantitative Information about Level 3 Fair Value Measurements
The following table provides quantitative information for assets measured at fair value on a nonrecurring basis using Level 3 valuation inputs as of the dates indicated:
| Valuation Technique |
Unobservable Input |
Discount Range (Weighted Average) | ||||||||||
| December 31, 2016 | December 31, 2015 | |||||||||||
| Impaired loans, non-covered |
Discounted appraisals (1) | Appraisal adjustments (2) | 3% to 39% (17%) | 1% to 39% (21%) | ||||||||
| OREO, non-covered |
Discounted appraisals (1) | Appraisal adjustments (2) | 0% to 88% (30%) | 1% to 100% (33%) | ||||||||
| OREO, covered |
Discounted appraisals (1) | Appraisal adjustments (2) | 0% to 44% (40%) | 21% to 65% (46%) | ||||||||
| (1) | Fair value is generally based on appraisals of the underlying collateral. |
| (2) | Appraisals may be adjusted by management for customized discounting criteria, estimated sales costs, and proprietary qualitative adjustments. |
Fair Value of Financial Instruments
The Company uses various methodologies and assumptions to estimate the fair value of certain financial instruments. A description of valuation methodologies used for instruments not previously discussed is as follows:
Cash and Cash Equivalents. Cash and cash equivalents are reported at their carrying amount, which is considered a reasonable estimate due to the short-term nature of these instruments.
Held-to-Maturity Securities. Securities held to maturity are reported at fair value using quoted market prices or dealer quotes.
114
Table of Contents
FIRST COMMUNITY BANCSHARES, INC.
NOTES TO CONSOLIDATED FINANCIAL STATEMENTS – (Continued)
FDIC Indemnification Asset. The FDIC indemnification asset is reported at fair value using discounted future cash flows that apply current discount rates.
Accrued Interest Receivable/Payable. Accrued interest receivable/payable is reported at their carrying amount, which is considered a reasonable estimate due to the short-term nature of these instruments.
Deposits and Securities Sold Under Agreements to Repurchase. Deposits without a stated maturity, such as demand, interest-bearing demand, and savings, are reported at their carrying amount, the amount payable on demand as of the reporting date, which is considered a reasonable estimate of fair value. Deposits and repurchase agreements with fixed maturities and rates are reported at fair value using discounted future cash flows that apply interest rates available in the market for instruments with similar characteristics and maturities.
FHLB and Other Borrowings. FHLB and other borrowings are reported at fair value using discounted future cash flows that apply interest rates available to the Company for borrowings with similar characteristics and maturities. Trust preferred obligations are reported at fair value using current credit spreads in the market for similar issues.
Off-Balance Sheet Instruments. The Company believes that fair values of unfunded commitments to extend credit, standby letters of credit, and financial guarantees are not meaningful; therefore, off-balance sheet instruments are not addressed in the fair value disclosures. The Company believes it is not feasible or practical to accurately disclose the fair values of off-balance sheet instruments due to the uncertainty and difficulty in assessing the likelihood and timing of advancing available proceeds, the lack of an established market for these instruments, and the diversity in fee structures. For additional information about the unfunded, contractual value of off-balance sheet financial instruments, see Note 20, “Litigation, Commitments, and Contingencies,” to the Consolidated Financial Statements of this report.
The following tables present the carrying amounts and fair values of financial instruments, by the level of valuation inputs in the fair value hierarchy, as of the dates indicated:
| December 31, 2016 | ||||||||||||||||||||
| Carrying Amount |
Fair Value | Fair Value Measurements Using | ||||||||||||||||||
| (Amounts in thousands) | Level 1 | Level 2 | Level 3 | |||||||||||||||||
| Assets |
||||||||||||||||||||
| Cash and cash equivalents |
$ | 76,307 | $ | 76,307 | $ | 76,307 | $ | — | $ | — | ||||||||||
| Securities available for sale |
165,579 | 165,579 | 55 | 165,524 | — | |||||||||||||||
| Securities held to maturity |
47,133 | 47,266 | — | 47,266 | — | |||||||||||||||
| Loans held for investment, net of allowance |
1,835,000 | 1,805,999 | — | 4,701 | 1,801,298 | |||||||||||||||
| FDIC indemnification asset |
12,173 | 8,112 | — | — | 8,112 | |||||||||||||||
| Interest receivable |
5,553 | 5,553 | — | 5,553 | — | |||||||||||||||
| Deferred compensation assets |
3,224 | 3,224 | 3,224 | — | — | |||||||||||||||
| Liabilities |
||||||||||||||||||||
| Demand deposits |
427,705 | 427,705 | — | 427,705 | — | |||||||||||||||
| Interest-bearing demand deposits |
378,339 | 378,339 | — | 378,339 | — | |||||||||||||||
| Savings deposits |
523,260 | 523,260 | — | 523,260 | — | |||||||||||||||
| Time deposits |
512,034 | 507,917 | — | 507,917 | — | |||||||||||||||
| Securities sold under agreements to repurchase |
98,005 | 98,879 | — | 98,879 | — | |||||||||||||||
| Interest payable |
1,280 | 1,280 | — | 1,280 | — | |||||||||||||||
| FHLB and other borrowings |
80,708 | 83,551 | — | 83,551 | — | |||||||||||||||
| Derivative financial liabilities |
167 | 167 | — | 167 | — | |||||||||||||||
| Deferred compensation liabilities |
3,224 | 3,224 | 3,224 | — | — | |||||||||||||||
115
Table of Contents
FIRST COMMUNITY BANCSHARES, INC.
NOTES TO CONSOLIDATED FINANCIAL STATEMENTS – (Continued)
| December 31, 2015 | ||||||||||||||||||||
| Carrying Amount |
Fair Value | Fair Value Measurements Using | ||||||||||||||||||
| (Amounts in thousands) | Level 1 | Level 2 | Level 3 | |||||||||||||||||
| Assets |
||||||||||||||||||||
| Cash and cash equivalents |
$ | 51,787 | $ | 51,787 | $ | 51,787 | $ | — | $ | — | ||||||||||
| Securities available for sale |
366,173 | 366,173 | 54 | 366,119 | — | |||||||||||||||
| Securities held to maturity |
72,541 | 72,490 | — | 72,490 | — | |||||||||||||||
| Loans held for investment, net of allowance |
1,686,308 | 1,685,061 | — | 4,886 | 1,680,175 | |||||||||||||||
| FDIC indemnification asset |
20,844 | 10,753 | — | — | 10,753 | |||||||||||||||
| Interest receivable |
6,007 | 6,007 | — | 6,007 | — | |||||||||||||||
| Deferred compensation assets |
3,464 | 3,464 | 3,464 | — | — | |||||||||||||||
| Liabilities |
||||||||||||||||||||
| Demand deposits |
451,511 | 451,511 | — | 451,511 | — | |||||||||||||||
| Interest-bearing demand deposits |
347,705 | 347,705 | — | 347,705 | — | |||||||||||||||
| Savings deposits |
530,585 | 530,585 | — | 530,585 | — | |||||||||||||||
| Time deposits |
543,458 | 541,059 | — | 541,059 | — | |||||||||||||||
| Securities sold under agreements to repurchase |
138,614 | 140,880 | — | 140,880 | — | |||||||||||||||
| Interest payable |
1,260 | 1,260 | — | 1,260 | — | |||||||||||||||
| FHLB and other borrowings |
80,756 | 85,774 | — | 85,774 | — | |||||||||||||||
| Derivative financial liabilities |
251 | 251 | — | 251 | — | |||||||||||||||
| Deferred compensation liabilities |
3,464 | 3,464 | 3,464 | — | — | |||||||||||||||
| Note 18. | Earnings per Share |
The following table presents the calculation of basic and diluted earnings per common share for the periods indicated:
| Year Ended December 31, | ||||||||||||
| (Amounts in thousands, except share and per share data) | 2016 | 2015 | 2014 | |||||||||
| Net income |
$ | 25,126 | $ | 24,540 | $ | 25,490 | ||||||
| Dividends on preferred stock |
— | 105 | 910 | |||||||||
|
|
|
|
|
|
|
|||||||
| Net income available to common shareholders |
$ | 25,126 | $ | 24,435 | $ | 24,580 | ||||||
|
|
|
|
|
|
|
|||||||
| Weighted average common shares outstanding, basic |
17,319,689 | 18,531,039 | 18,406,363 | |||||||||
| Dilutive effect of potential common shares |
||||||||||||
| Stock options |
34,530 | 26,487 | 18,607 | |||||||||
| Restricted stock |
11,305 | 2,996 | 461 | |||||||||
| Convertible preferred stock |
— | 166,942 | 1,046,175 | |||||||||
| Contingently issuable shares |
— | — | 11,448 | |||||||||
|
|
|
|
|
|
|
|||||||
| Total dilutive effect of potential common shares |
45,835 | 196,425 | 1,076,691 | |||||||||
|
|
|
|
|
|
|
|||||||
| Weighted average common shares outstanding, diluted |
17,365,524 | 18,727,464 | 19,483,054 | |||||||||
|
|
|
|
|
|
|
|||||||
| Basic earnings per common share |
$ | 1.45 | $ | 1.32 | $ | 1.34 | ||||||
| Diluted earnings per common share |
1.45 | 1.31 | 1.31 | |||||||||
| Antidilutive potential common shares |
||||||||||||
| Stock options |
107,592 | 127,882 | 222,651 | |||||||||
| Restricted stock |
3,279 | — | — | |||||||||
|
|
|
|
|
|
|
|||||||
| Total potential antidilutive shares |
110,871 | 127,882 | 222,651 | |||||||||
|
|
|
|
|
|
|
|||||||
116
Table of Contents
FIRST COMMUNITY BANCSHARES, INC.
NOTES TO CONSOLIDATED FINANCIAL STATEMENTS – (Continued)
The Company redeemed all outstanding shares of its 6% Series A Noncumulative Convertible Preferred Stock (“Series A Preferred Stock”) in 2015. Before redemption, holders converted 12,784 shares of Series A Preferred Stock with each share convertible into 69 shares of the Company’s common stock. The Company redeemed the remaining 2,367 shares for $2.37 million along with accrued and unpaid dividends of $9 thousand.
| Note 19. | Related Party Transactions |
The Company engages in transactions with related parties in the normal course of business. Related parties include directors, executive officers, and principal shareholders and their immediate family members, business interests, and affiliates. All related party transactions are made on terms that are substantially the same as those prevailing at the time for similar transactions with unrelated parties, including interest rates and collateral. The following table presents the changes in loans with related parties during the periods indicated:
| Year Ended December 31, | ||||||||
| (Amounts in thousands) | 2016 | 2015 | ||||||
| Beginning balance |
$ | 21,886 | $ | 22,826 | ||||
| New loans and advances |
559 | 1,066 | ||||||
| Loan repayments |
(4,418 | ) | (2,006 | ) | ||||
| Reclassifications (1) |
333 | — | ||||||
|
|
|
|
|
|||||
| Ending balance |
$ | 18,360 | $ | 21,886 | ||||
|
|
|
|
|
|||||
| (1) | Changes related to the composition of the Company’s directors and executive officers |
Deposits with related parties totaled $5.45 million as of December 31, 2016, and $6.55 million as of December 31, 2015. Legal fees paid to related parties totaled $104 thousand in 2016, $88 thousand in 2015, and $27 thousand in 2014. Lease expense paid to related parties totaled $95 thousand in 2016, $95 thousand in 2015, and $92 thousand in 2014. Other expense paid to related parties totaled $34 thousand in 2016 and $21 thousand in 2015. In addition, the Company repurchased 200,000 shares of its common stock from a related party in 2016 for $4.20 million, which represented the stock’s fair market value as of the date of the transaction.
| Note 20. | Litigation, Commitments, and Contingencies |
Litigation
In the normal course of business, the Company is a defendant in various legal actions and asserted claims. While the Company and its legal counsel are unable to assess the ultimate outcome of each of these matters with certainty, the Company believes the resolution of these actions, singly or in the aggregate, should not have a material adverse effect on its financial condition, results of operations, or cash flows.
Commitments and Contingencies
The Company is a party to financial instruments with off-balance sheet risk in the normal course of business to meet the financing needs of its customers. These financial instruments include commitments to extend credit, standby letters of credit, and financial guarantees. These instruments involve, to varying degrees, elements of credit and interest rate risk beyond the amount recognized in the consolidated balance sheets. The contractual amounts of these instruments reflect the extent of involvement the Company has in particular classes of financial instruments. If the other party to a financial instrument does not perform, the Company’s credit loss exposure is the same as the contractual amount of the instrument. The Company uses the same credit policies in making commitments and conditional obligations as it does for on-balance sheet instruments.
117
Table of Contents
FIRST COMMUNITY BANCSHARES, INC.
NOTES TO CONSOLIDATED FINANCIAL STATEMENTS – (Continued)
Commitments to extend credit are agreements to lend to a customer as long as there is no violation of any condition established in the contract. Commitments generally have fixed expiration dates or other termination clauses and may require payment of a fee. Since many commitments are expected to expire without being drawn on, the total commitment amounts do not necessarily represent future cash requirements. The amount of collateral obtained, if deemed necessary, is based on management’s credit evaluation of each customer on a case-by-case basis. Collateral may include accounts receivable, inventory, property, plant and equipment, and income producing commercial properties. The Company maintains a reserve for the risk inherent in unfunded lending commitments, which is included in other liabilities in the consolidated balance sheets.
Standby letters of credit and financial guarantees are conditional commitments issued by the Company to guarantee the performance of a customer to a third party. The credit risk involved in issuing letters of credit is essentially the same as that involved in extending credit to customers. The amount of collateral obtained, if deemed necessary, to secure the customer’s performance under certain letters of credit is based on management’s credit evaluation of the customer.
The following table presents the off-balance sheet financial instruments as of the dates indicated:
| December 31, | ||||||||
| (Amounts in thousands) | 2016 | 2015 | ||||||
| Commitments to extend credit |
$ | 261,801 | $ | 235,302 | ||||
| Standby letters of credit and financial guarantees |
8,180 | 7,765 | ||||||
|
|
|
|
|
|||||
| Total off-balance sheet risk |
269,981 | 243,067 | ||||||
|
|
|
|
|
|||||
| Reserve for unfunded commitments |
$ | 326 | $ | 326 | ||||
In connection with the private placement of $15.46 million of trust preferred securities through the Trust, the Company irrevocably and unconditionally guarantees the following payments or distributions to holders of the trust preferred securities, to the extent the Trust has not made such payments or distributions and the Company has the funds available: accrued and unpaid distributions, the redemption price, and, upon dissolution or termination of the Trust, the lesser of the liquidation amount and all accrued and unpaid distributions and the amount of assets of the Trust remaining available for distribution.
| Note 21. | Regulatory Requirements and Restrictions |
The Company and the Bank are subject to various regulatory capital requirements administered by state and federal banking agencies. Failure to meet minimum capital requirements can initiate certain mandatory and possibly additional discretionary actions by regulators that, if undertaken, could have a direct material effect on the Company’s consolidated financial statements. Under the capital adequacy guidelines and the regulatory framework for prompt corrective action, which applies only to the Bank, the Bank must meet specific capital guidelines that involve quantitative measures of the entity’s balance sheet assets and off-balance sheet items as calculated under regulatory accounting practices. The Bank’s capital amounts and classifications are also subject to qualitative judgments by the regulators about components, risk weightings, and other factors. In addition, the Company and the Bank are subject to various regulatory restrictions related to the payment of dividends, including requirements to maintain capital at or above regulatory minimums.
The current risk-based capital requirements, based on the international capital standards known as Basel III, requires the Company and the Bank to maintain minimum amounts and ratios of Common Equity Tier 1 capital, Tier 1 capital, and total capital to risk-weighted assets, and of Tier 1 capital to average consolidated assets (“Tier 1 leverage ratio”), as defined in the regulations. On January 1, 2016, Basel III’s capital conservation buffer,
118
Table of Contents
FIRST COMMUNITY BANCSHARES, INC.
NOTES TO CONSOLIDATED FINANCIAL STATEMENTS – (Continued)
which is intended to absorb losses during periods of economic stress, became effective at 0.625%, and will be phased in over a four-year period (increasing by an additional 0.625% each year until it reaches 2.5% on January 1, 2019). As of December 31, 2016, the capital conservation buffer was 5.29% for the Company and 3.48% for the Bank, which exceeds the required capital conservation buffer on a fully phased-in basis.
The following tables present actual and required capital ratios, under Basel III capital rules, as of the dates indicated:
| December 31, 2016 | ||||||||||||||||||||||||||||||||
| Actual | Minimum Basel III Requirement |
Minimum Basel III Requirement - Fully Phased-In |
Well Capitalized Requirement (1) |
|||||||||||||||||||||||||||||
| (Amounts in thousands) | Amount | Ratio | Amount | Ratio | Amount | Ratio | Amount | Ratio | ||||||||||||||||||||||||
| The Company |
||||||||||||||||||||||||||||||||
| Common equity Tier 1 ratio |
$ | 241,671 | 13.88 | % | $ | 78,362 | 4.50 | % | $ | 121,897 | 7.00 | % | N/A | N/A | ||||||||||||||||||
| Tier 1 risk-based capital ratio |
256,671 | 14.74 | % | 104,483 | 6.00 | % | 148,018 | 8.50 | % | N/A | N/A | |||||||||||||||||||||
| Total risk-based capital ratio |
274,953 | 15.79 | % | 139,311 | 8.00 | % | 182,846 | 10.50 | % | N/A | N/A | |||||||||||||||||||||
| Tier 1 Leverage ratio |
256,671 | 11.07 | % | 92,742 | 4.00 | % | 92,742 | 4.00 | % | N/A | N/A | |||||||||||||||||||||
| The Bank |
||||||||||||||||||||||||||||||||
| Common equity Tier 1 ratio |
$ | 223,944 | 12.93 | % | $ | 77,956 | 4.50 | % | $ | 121,264 | 7.00 | % | $ | 112,603 | 6.50 | % | ||||||||||||||||
| Tier 1 risk-based capital ratio |
223,944 | 12.93 | % | 103,941 | 6.00 | % | 147,249 | 8.50 | % | 138,588 | 8.00 | % | ||||||||||||||||||||
| Total risk-based capital ratio |
242,218 | 13.98 | % | 138,588 | 8.00 | % | 181,897 | 10.50 | % | 173,235 | 10.00 | % | ||||||||||||||||||||
| Tier 1 Leverage ratio |
223,944 | 9.71 | % | 92,274 | 4.00 | % | 92,274 | 4.00 | % | 115,343 | 5.00 | % | ||||||||||||||||||||
| (1) | Based on prompt corrective action provisions |
| December 31, 2015 | ||||||||||||||||||||||||||||||||
| Actual | Minimum Basel III Requirement |
Minimum Basel III Requirement - Fully Phased-In |
Well Capitalized Requirement (1) |
|||||||||||||||||||||||||||||
| (Amounts in thousands) | Amount | Ratio | Amount | Ratio | Amount | Ratio | Amount | Ratio | ||||||||||||||||||||||||
| The Company |
||||||||||||||||||||||||||||||||
| Common equity Tier 1 ratio |
$ | 246,237 | 14.54 | % | $ | 76,196 | 4.50 | % | $ | 118,527 | 7.00 | % | N/A | N/A | ||||||||||||||||||
| Tier 1 risk-based capital ratio |
249,436 | 14.73 | % | 101,595 | 6.00 | % | 143,926 | 8.50 | % | N/A | N/A | |||||||||||||||||||||
| Total risk-based capital ratio |
269,998 | 15.95 | % | 135,459 | 8.00 | % | 177,791 | 10.50 | % | N/A | N/A | |||||||||||||||||||||
| Tier 1 Leverage ratio |
249,436 | 10.62 | % | 93,935 | 4.00 | % | 93,935 | 4.00 | % | N/A | N/A | |||||||||||||||||||||
| The Bank |
||||||||||||||||||||||||||||||||
| Common equity Tier 1 ratio |
$ | 228,669 | 13.60 | % | $ | 75,682 | 4.50 | % | $ | 117,728 | 7.00 | % | $ | 109,319 | 6.50 | % | ||||||||||||||||
| Tier 1 risk-based capital ratio |
228,669 | 13.60 | % | 100,910 | 6.00 | % | 142,955 | 8.50 | % | 134,546 | 8.00 | % | ||||||||||||||||||||
| Total risk-based capital ratio |
249,228 | 14.82 | % | 134,546 | 8.00 | % | 176,592 | 10.50 | % | 168,183 | 10.00 | % | ||||||||||||||||||||
| Tier 1 Leverage ratio |
228,669 | 9.77 | % | 93,616 | 4.00 | % | 93,616 | 4.00 | % | 117,020 | 5.00 | % | ||||||||||||||||||||
| (1) | Based on prompt corrective action provisions |
119
Table of Contents
FIRST COMMUNITY BANCSHARES, INC.
NOTES TO CONSOLIDATED FINANCIAL STATEMENTS – (Continued)
Note 22. Parent Company Financial Information
The following tables present condensed financial information for the parent company, First Community Bancshares, Inc., as of and for the dates indicated:
| CONDENSED BALANCE SHEETS | ||||||||
| December 31, | ||||||||
| (Amounts in thousands) | 2016 | 2015 | ||||||
| Assets |
||||||||
| Cash and due from banks |
$ | 23,561 | $ | 8,367 | ||||
| Securities available for sale |
17 | 8,459 | ||||||
| Loans to affiliates |
228 | — | ||||||
| Investment in subsidiaries |
321,389 | 336,311 | ||||||
| Other assets |
9,560 | 5,489 | ||||||
|
|
|
|
|
|||||
| Total assets |
$ | 354,755 | $ | 358,626 | ||||
|
|
|
|
|
|||||
| Liabilities |
||||||||
| Subordinated debt |
$ | 15,464 | $ | 15,464 | ||||
| Other liabilities |
234 | 145 | ||||||
|
|
|
|
|
|||||
| Total liabilities |
15,698 | 15,609 | ||||||
| Stockholders’ equity |
||||||||
| Preferred stock |
— | — | ||||||
| Common stock |
21,382 | 21,382 | ||||||
| Additional paid-in capital |
228,142 | 227,692 | ||||||
| Retained earnings |
170,377 | 154,550 | ||||||
| Treasury stock |
(78,833 | ) | (56,457 | ) | ||||
| Accumulated other comprehensive loss |
(2,011 | ) | (4,150 | ) | ||||
|
|
|
|
|
|||||
| Total stockholders’ equity |
339,057 | 343,017 | ||||||
|
|
|
|
|
|||||
| Total liabilities and stockholders’ equity |
$ | 354,755 | $ | 358,626 | ||||
|
|
|
|
|
|||||
120
Table of Contents
FIRST COMMUNITY BANCSHARES, INC.
NOTES TO CONSOLIDATED FINANCIAL STATEMENTS – (Continued)
| CONDENSED STATEMENTS OF INCOME | ||||||||||||
| Year Ended December 31, | ||||||||||||
| (Amounts in thousands) | 2016 | 2015 | 2014 | |||||||||
| Cash dividends received from subsidiary bank |
$ | 32,000 | $ | 22,970 | $ | 14,148 | ||||||
| Other income |
(1,121 | ) | 1,039 | 515 | ||||||||
| Other operating expense |
2,097 | 2,080 | 1,793 | |||||||||
|
|
|
|
|
|
|
|||||||
| Income before income taxes and equity in undistributed net (loss) income of subsidiaries |
28,782 | 21,929 | 12,870 | |||||||||
| Income tax benefit |
(1,287 | ) | (616 | ) | (511 | ) | ||||||
|
|
|
|
|
|
|
|||||||
| Income before equity in undistributed net income of subsidiaries |
30,069 | 22,545 | 13,381 | |||||||||
| (Dividends in excess of) equity in undistributed net income of subsidiaries |
(4,943 | ) | 1,995 | 12,109 | ||||||||
|
|
|
|
|
|
|
|||||||
| Net income |
25,126 | 24,540 | 25,490 | |||||||||
| Dividends on preferred stock |
— | 105 | 910 | |||||||||
|
|
|
|
|
|
|
|||||||
| Net income available to common shareholders |
$ | 25,126 | $ | 24,435 | $ | 24,580 | ||||||
|
|
|
|
|
|
|
|||||||
121
Table of Contents
FIRST COMMUNITY BANCSHARES, INC.
NOTES TO CONSOLIDATED FINANCIAL STATEMENTS – (Continued)
| CONDENSED STATEMENTS OF CASH FLOWS | ||||||||||||
| Year Ended December 31, | ||||||||||||
| (Amounts in thousands) | 2016 | 2015 | 2014 | |||||||||
| Operating activities |
||||||||||||
| Net income |
$ | 25,126 | $ | 24,540 | $ | 25,490 | ||||||
| Adjustments to reconcile net income to net cash provided by operating activities |
||||||||||||
| Equity in undistributed net income of subsidiaries |
— | (1,995 | ) | (12,109 | ) | |||||||
| (Gain) loss on sale of securities |
(65 | ) | (38 | ) | 2 | |||||||
| Net change in other operating activities |
397 | (626 | ) | 4,212 | ||||||||
|
|
|
|
|
|
|
|||||||
| Net cash provided by operating activities |
25,458 | 21,881 | 17,595 | |||||||||
| Investing activities |
||||||||||||
| Proceeds from sale of securities available for sale |
8,660 | 199 | 5,030 | |||||||||
| Proceeds from divestitures |
4,900 | — | — | |||||||||
| Return of capital from (investment in) subsidiaries |
3,654 | — | (2,000 | ) | ||||||||
| Dividends in excess of undistributed net income of subsidiaries |
4,943 | — | — | |||||||||
| Net change in other investing activities |
(98 | ) | — | — | ||||||||
|
|
|
|
|
|
|
|||||||
| Net cash provided by investing activities |
22,059 | 199 | 3,030 | |||||||||
| Financing activities |
||||||||||||
| (Repayments of) proceeds from other debt |
— | (2,000 | ) | 2,000 | ||||||||
| Redemption of preferred stock |
— | (2,367 | ) | — | ||||||||
| Proceeds from issuance of common stock |
1,243 | 264 | 89 | |||||||||
| Payments for repurchase of treasury stock |
(23,762 | ) | (21,525 | ) | (2,168 | ) | ||||||
| Payments of common dividends |
(10,396 | ) | (9,994 | ) | (9,200 | ) | ||||||
| Payments of preferred dividends |
— | (219 | ) | (910 | ) | |||||||
| Net change in other financing activities |
592 | 482 | 338 | |||||||||
|
|
|
|
|
|
|
|||||||
| Net cash used in financing activities |
(32,323 | ) | (35,359 | ) | (9,851 | ) | ||||||
|
|
|
|
|
|
|
|||||||
| Net increase (decrease) in cash and cash equivalents |
15,194 | (13,279 | ) | 10,774 | ||||||||
| Cash and cash equivalents at beginning of period |
8,367 | 21,646 | 10,872 | |||||||||
|
|
|
|
|
|
|
|||||||
| Cash and cash equivalents at end of period |
$ | 23,561 | $ | 8,367 | $ | 21,646 | ||||||
|
|
|
|
|
|
|
|||||||
122
Table of Contents
FIRST COMMUNITY BANCSHARES, INC.
NOTES TO CONSOLIDATED FINANCIAL STATEMENTS – (Continued)
| Note 23. | Quarterly Financial Data (Unaudited) |
The following tables present selected financial data for the periods indicated:
| Year Ended December 31, 2016 | ||||||||||||||||
| First Quarter |
Second Quarter |
Third Quarter |
Fourth Quarter |
|||||||||||||
| (Amounts in thousands, except share and per share data) | ||||||||||||||||
| Interest income |
$ | 23,550 | $ | 24,137 | $ | 23,621 | $ | 23,416 | ||||||||
| Interest expense |
2,439 | 2,446 | 2,500 | 2,459 | ||||||||||||
|
|
|
|
|
|
|
|
|
|||||||||
| Net interest income |
21,111 | 21,691 | 21,121 | 20,957 | ||||||||||||
| Provision for (recovery of) loan losses |
1,187 | 722 | (1,154 | ) | 500 | |||||||||||
|
|
|
|
|
|
|
|
|
|||||||||
| Net interest income after provision (recovery) |
19,924 | 20,969 | 22,275 | 20,457 | ||||||||||||
| Noninterest income, excluding net gain (loss) on sale of securities |
7,902 | 7,109 | 5,870 | 5,850 | ||||||||||||
| Net gain (loss) on sale of securities |
1 | (79 | ) | 25 | 388 | |||||||||||
| Noninterest expense |
18,814 | 18,722 | 18,557 | 16,653 | ||||||||||||
|
|
|
|
|
|
|
|
|
|||||||||
| Income before income taxes |
9,013 | 9,277 | 9,613 | 10,042 | ||||||||||||
| Income tax expense |
2,929 | 3,022 | 3,230 | 3,638 | ||||||||||||
|
|
|
|
|
|
|
|
|
|||||||||
| Net income available to common shareholders |
$ | 6,084 | $ | 6,255 | $ | 6,383 | $ | 6,404 | ||||||||
|
|
|
|
|
|
|
|
|
|||||||||
| Basic earnings per common share |
$ | 0.34 | $ | 0.36 | $ | 0.37 | $ | 0.38 | ||||||||
| Diluted earnings per common share |
0.34 | 0.36 | 0.37 | 0.38 | ||||||||||||
| Dividend per common share |
0.14 | 0.14 | 0.16 | 0.16 | ||||||||||||
| Weighted average basic shares outstanding |
17,859,197 | 17,414,320 | 17,031,074 | 16,981,010 | ||||||||||||
| Weighted average diluted shares outstanding |
17,892,531 | 17,462,845 | 17,083,526 | 17,043,869 | ||||||||||||
| Year Ended December 31, 2015 | ||||||||||||||||
| First Quarter |
Second Quarter |
Third Quarter |
Fourth Quarter |
|||||||||||||
| (Amounts in thousands, except share and per share data) | ||||||||||||||||
| Interest income |
$ | 24,098 | $ | 23,979 | $ | 24,348 | $ | 23,677 | ||||||||
| Interest expense |
3,259 | 2,909 | 2,679 | 2,502 | ||||||||||||
|
|
|
|
|
|
|
|
|
|||||||||
| Net interest income |
20,839 | 21,070 | 21,669 | 21,175 | ||||||||||||
| Provision for loan losses |
1,100 | 276 | 381 | 434 | ||||||||||||
|
|
|
|
|
|
|
|
|
|||||||||
| Net interest income after provision |
19,739 | 20,794 | 21,288 | 20,741 | ||||||||||||
| Noninterest income, excluding net (loss) gain on sale of securities |
6,859 | 7,924 | 7,113 | 7,490 | ||||||||||||
| Net (loss) gain on sale of securities |
(23 | ) | 213 | (39 | ) | (7 | ) | |||||||||
| Noninterest expense |
17,780 | 20,289 | 19,019 | 19,083 | ||||||||||||
|
|
|
|
|
|
|
|
|
|||||||||
| Income before income taxes |
8,795 | 8,642 | 9,343 | 9,141 | ||||||||||||
| Income tax expense |
2,837 | 2,467 | 3,084 | 2,993 | ||||||||||||
|
|
|
|
|
|
|
|
|
|||||||||
| Net income |
5,958 | 6,175 | 6,259 | 6,148 | ||||||||||||
| Dividends on preferred stock |
105 | — | — | — | ||||||||||||
|
|
|
|
|
|
|
|
|
|||||||||
| Net income available to common shareholders |
$ | 5,853 | $ | 6,175 | $ | 6,259 | $ | 6,148 | ||||||||
|
|
|
|
|
|
|
|
|
|||||||||
| Basic earnings per common share |
$ | 0.31 | $ | 0.33 | $ | 0.34 | $ | 0.34 | ||||||||
| Diluted earnings per common share |
0.31 | 0.33 | 0.34 | 0.34 | ||||||||||||
| Dividend per common share |
0.13 | 0.13 | 0.14 | 0.14 | ||||||||||||
| Weighted average basic shares outstanding |
18,633,574 | 18,831,742 | 18,470,348 | 18,193,824 | ||||||||||||
| Weighted average diluted shares outstanding |
19,344,443 | 18,860,119 | 18,500,975 | 18,226,719 | ||||||||||||
123
Table of Contents
- Report of Independent Registered Public Accounting Firm -
Audit Committee of the Board of Directors and the Stockholders
First Community Bancshares, Inc.
We have audited the accompanying consolidated balance sheets of First Community Bancshares, Inc. and Subsidiaries (the “Company”) as of December 31, 2016 and 2015, and the related consolidated statements of income, comprehensive income (loss), changes in stockholders’ equity and cash flows for each of the years in the three-year period ended December 31, 2016. These consolidated financial statements are the responsibility of the Company’s management. Our responsibility is to express an opinion on these financial statements based on our audits.
We conducted our audits in accordance with the standards of the Public Company Accounting Oversight Board (United States). Those standards require that we plan and perform the audit to obtain reasonable assurance about whether the financial statements are free of material misstatement. An audit includes examining, on a test basis, evidence supporting the amounts and disclosures in the financial statements. An audit also includes assessing the accounting principles used and significant estimates made by management, as well as evaluating the overall financial statement presentation. We believe that our audits provide a reasonable basis for our opinion.
In our opinion, the consolidated financial statements referred to above present fairly, in all material respects, the financial position of First Community Bancshares, Inc. and its Subsidiaries as of December 31, 2016 and 2015, and the results of their operations and their cash flows for each of the years in the three-year period ended December 31, 2016 in conformity with accounting principles generally accepted in the United States of America.
We also have audited, in accordance with the standards of the Public Company Accounting Oversight Board (United States), the Company’s internal control over financial reporting as of December 31, 2016, based on criteria established in Internal Control-Integrated Framework (2013) issued by the Committee of Sponsoring Organizations of the Treadway Commission (COSO), and our report dated March 3, 2017 expressed an unqualified opinion on the effectiveness of the Company’s internal control over financial reporting.
| /s/ Dixon Hughes Goodman LLP |
| Asheville, North Carolina |
| March 4, 2017 |
124
Table of Contents
- Management’s Assessment of Internal Control over Financial Reporting -
First Community Bancshares, Inc. (the “Company”) is responsible for the preparation, integrity, and fair presentation of the consolidated financial statements included in this Annual Report on Form 10-K. The consolidated financial statements and notes included in this Annual Report on Form 10-K have been prepared in conformity with U.S. generally accepted accounting principles and necessarily include some amounts that are based on management’s best estimates and judgments.
We, as management of the Company, are responsible for establishing and maintaining effective internal control over financial reporting that is designed to produce reliable financial statements in conformity with U.S. generally accepted accounting principles. The system of internal control over financial reporting as it relates to the financial statements is evaluated for effectiveness by management and tested for reliability. Any system of internal control, no matter how well designed, has inherent limitations, including the possibility that a control can be circumvented or overridden and misstatements due to error or fraud may occur and not be detected. Also, because of changes in conditions, internal control effectiveness may vary over time. Accordingly, even an effective system of internal control will provide only reasonable assurance with respect to financial statement preparation.
Management conducted an assessment of the effectiveness of the Company’s internal control over financial reporting based on the framework in the Internal Control-Integrated Framework (2013) issued by the Committee of Sponsoring Organizations of the Treadway Commission. Based on this assessment, management concluded that its system of internal control over financial reporting was effective as of December 31, 2016.
Dixon Hughes Goodman LLP, independent registered public accounting firm, has issued an attestation report on the effectiveness of the Company’s internal control over financial reporting as of December 31, 2016. The Report of Independent Registered Public Accounting Firm, which expresses an unqualified opinion on the effectiveness of the Company’s internal control over financial reporting as of December 31, 2016, appears hereafter in Item 8 of this Annual Report on Form 10-K.
Dated this 3rd day of March, 2017.
| /s/ William P. Stafford, II |
/s/ David D. Brown | |||
| William P. Stafford, II | David D. Brown | |||
| Chief Executive Officer | Chief Financial Officer | |||
125
Table of Contents
- Report of Independent Registered Public Accounting Firm -
Audit Committee of the Board of Directors and the Stockholders
First Community Bancshares, Inc.
We have audited First Community Bancshares, Inc. and Subsidiaries (the “Company”) internal control over financial reporting as of December 31, 2016, based on criteria established in Internal Control-Integrated Framework (2013) issued by the Committee of Sponsoring Organizations of the Treadway Commission. The Company’s management is responsible for maintaining effective internal control over financial reporting and for its assessment of the effectiveness of internal control over financial reporting, included in the accompanying Management’s Assessment of Internal Control over Financial Reporting. Our responsibility is to express an opinion on the Company’s internal control over financial reporting based on our audit.
We conducted our audit in accordance with the standards of the Public Company Accounting Oversight Board (United States). Those standards require that we plan and perform the audit to obtain reasonable assurance about whether effective internal control over financial reporting was maintained in all material respects. Our audit included obtaining an understanding of internal control over financial reporting, assessing the risk that a material weakness exists, and testing and evaluating the design and operating effectiveness of internal control based on the assessed risk. Our audit also included performing such other procedures as we considered necessary in the circumstances. We believe that our audit provides a reasonable basis for our opinion.
A company’s internal control over financial reporting is a process designed to provide reasonable assurance regarding the reliability of financial reporting and the preparation of financial statements for external purposes in accordance with generally accepted accounting principles. A company’s internal control over financial reporting includes those policies and procedures that (1) pertain to the maintenance of records that, in reasonable detail, accurately and fairly reflect the transactions and dispositions of the assets of the company; (2) provide reasonable assurance that transactions are recorded as necessary to permit preparation of financial statements in accordance with generally accepted accounting principles, and that receipts and expenditures of the company are being made only in accordance with authorizations of management and directors of the company; and (3) provide reasonable assurance regarding prevention or timely detection of unauthorized acquisition, use, or disposition of the company’s assets that could have a material effect on the financial statements.
Because of its inherent limitations, internal control over financial reporting may not prevent or detect misstatements. Also, projections of any evaluation of effectiveness to future periods are subject to the risk that controls may become inadequate because of changes in conditions, or that the degree of compliance with the policies or procedures may deteriorate.
In our opinion, First Community Bancshares, Inc. maintained, in all material respects, effective internal control over financial reporting as of December 31, 2016, based on criteria established in Internal Control-Integrated Framework (2013) issued by the Committee of Sponsoring Organizations of the Treadway Commission.
We have also audited, in accordance with the standards of the Public Company Accounting Oversight Board (United States), the consolidated financial statements of First Community Bancshares, Inc. as of and for the year ended December 31, 2016, and our report, dated March 4, 2017 expressed an unqualified opinion on those consolidated financial statements.
| /s/ Dixon Hughes Goodman LLP |
| Asheville, North Carolina |
| March 3, 2017 |
126
Table of Contents
| Item 9. | Changes in and Disagreements With Accountants on Accounting and Financial Disclosure. |
None.
| Item 9A. | Controls and Procedures. |
Evaluation of Disclosure Controls and Procedures
In connection with this report, we conducted an evaluation, under the supervision and with the participation of management, including our Chief Executive Officer (“CEO”) and Chief Financial Officer (“CFO”), of the effectiveness of our disclosure controls and procedures under the Exchange Act Rule 13a-15(b). Based upon that evaluation, the CEO and CFO concluded that, as of December 31, 2016, our disclosure controls and procedures were effective.
Disclosure controls and procedures are our Company’s controls and other procedures that are designed to ensure that information we are required to disclose in the reports we file or submit under the Exchange Act is recorded, processed, summarized, and reported within the periods specified in the SEC’s rules and forms. Disclosure controls and procedures include, without limitation, controls and procedures designed to ensure that information we are required to disclose in the reports that we file or submit under the Exchange Act is accumulated and communicated to management, including the CEO and CFO, as appropriate, to allow timely decisions about required disclosure.
Management, including the CEO and CFO, does not expect that our disclosure controls and internal controls will prevent all errors and all fraud. A control system, no matter how well conceived and operated, can provide only reasonable, not absolute, assurance that the objectives of the control system are met. Because of the inherent limitations in all control systems, no evaluation of controls can provide absolute assurance that all control issues and instances of fraud, if any, within our Company have been detected. These inherent limitations include the realities that judgments in decision making can be faulty, and that breakdowns can occur because of simple error or mistake. Additionally, controls can be circumvented by the individual acts of some persons, collusion of two or more people, or management’s override of the controls.
Changes in Internal Control over Financial Reporting
We assess the adequacy of our internal control over financial reporting quarterly and enhance our controls in response to internal control assessments and internal and external audit and regulatory recommendations. There were no changes in our internal control over financial reporting during the quarter ended December 31, 2016, that materially affected, or is reasonably likely to materially affect, our internal control over financial reporting.
Management’s Report on Internal Controls over Financial Reporting
For additional information about the Company’s internal controls, see “Management’s Assessment of Internal Control over Financial Reporting,” and “Report of Independent Registered Public Accounting Firm,” in Item 8 of this report.
| Item 9B. | Other Information. |
None.
127
Table of Contents
PART III
| Item 10. | Directors, Executive Officers and Corporate Governance. |
Board of Directors, First Community Bancshares, Inc.
| W. C. Blankenship, Jr. Retired Agent, State Farm Insurance
C. William Davis Attorney at Law, Richardson & Davis, PLLC
Richard S. Johnson Chairman, President, and Chief Executive Officer, The Wilton Companies; Director and Past Chairman, City of Richmond Economic Development Authority; Trustee Emeritus, University of Richmond
I. Norris Kantor Of Counsel, Katz, Kantor, Stonestreet & Buckner, PLLC; Board of Governors, Bluefield State College
Gary R. Mills President, First Community Bancshares, Inc.; Chief Executive Officer and President, First Community Bank |
Samuel L. Elmore Retired Chief Credit Officer and Senior Vice President, First Community Bank; Past Executive Vice President, Citizens Southern Bank, Inc.; Past President and Chief Executive Officer, Bank One; Past Vice President, Key Centurion Bancshares; Past President and Chief Operations Officer, Beckley National Bank; Director, Raleigh County Commission on Aging
M. Adam Sarver Member/Co-Manager, Main Street Builders, LLC, Eastern Door & Glass, LLC, and Clover Leaf Properties, LLC
William P. Stafford, II Chief Executive Officer, First Community Bancshares, Inc.; Attorney at Law, Brewster, Morhous, Cameron, Caruth, Moore, Kersey & Stafford, PLLC |
Executive Officers, First Community Bancshares, Inc.
| William P. Stafford, II Chief Executive Officer |
David D. Brown Chief Financial Officer |
|||||||
| Gary R. Mills President |
E. Stephen Lilly Chief Operating Officer |
|||||||
128
Table of Contents
Board Of Directors, First Community Bank
| James H. Atkinson, Jr. Retired Chief Executive Officer, Peoples Bank of Virginia
W. C. Blankenship, Jr. See above
Robert L. Buzzo Retired Vice President and Secretary, First Community Bancshares, Inc.; Retired President Emeritus, First Community Bank
Samuel D. Campbell Attorney at Law
C. William Davis See above
Samuel L. Elmore See above
S. Michael Feola Retired Senior Vice President – Regional President, First Community Bank
T. Vernon Foster President of J. La’Verne Print Communications; Past Director, TriStone Community Bank; Executive Director: MBA Programs, Career Management & Public Relations, University of Louisville, College of Business |
Richard H. Jarrell Chick-fil-A Franchise Owner; Director, Raleigh General Hospital Board of Trustees; Director, Beckley-Raleigh County Chamber of Commerce; Director, United Way of Southwest Virginia; Director, Raleigh County Board of Education
Richard S. Johnson See above
I. Norris Kantor See above
Gary R. Mills President, First Community Bancshares, Inc.; Chief Executive Officer and President, First Community Bank
M. Adam Sarver See above
William P. Stafford, II See above
Frank C. Tinder President, Tinder Enterprises, Inc. and Tinco Leasing Corporation; Realtor, Premier Realty |
Additional Information
The following information required in this item is incorporated by reference to the Proxy Statement for the Annual Meeting of Stockholders to be held on April 25, 2017 (“2017 Annual Meeting”):
| • | Information about directors and executive officers is included under the headings “Proposal 1: Election of Directors,” “Nominees for the Class of 2018,” “Incumbent Directors,” “Non-Director Executive Officers,” and “Corporate Governance.” |
| • | Information about compliance with Section 16(a) of the Exchange Act is included under the heading “Section 16(a) Beneficial Ownership Reporting Compliance.” |
| • | Information about the Audit Committee and the Audit Committee Financial Expert is included under the heading “Board Committees.” |
Our Standards of Conduct apply to all directors and employees, including our principal executive officer, principal financial officer, principal accounting officer or controller, or persons performing similar functions. The Standards of Conduct is available on the Investor Relations section of our website at www.fcbinc.com. There have been no waivers of the Standards of Conduct for any officer.
129
Table of Contents
There have been no material changes to the procedures by which stockholders may recommend nominees to our Board of Directors since the disclosure in our Proxy Statement filed with the SEC on March 17, 2016.
| Item 11. | Executive Compensation. |
The information required in this item is incorporated by reference to our Proxy Statement for the 2017 Annual Meeting under the headings “Board Committees,” “Compensation Discussion and Analysis,” and “Director Compensation.”
| Item 12. | Security Ownership of Certain Beneficial Owners and Management and Related Stockholder Matters. |
The following table provides information about compensation plans under which our equity securities are authorized for issuance as of December 31, 2016:
| Plan category |
Number of securities to be issued upon exercise of outstanding options, warrants and rights |
Weighted-average exercise price of outstanding options, warrants and rights |
Number of securities remaining available for future issuance under equity compensation plans (excluding securities reflected in column (a)) |
|||||||||
| (a) | (b) | (c) | ||||||||||
| Equity compensation plans approved by security holders (1) |
67,210 | $ | 16.36 | 447,521 | (3) | |||||||
| Equity compensation plans not approved by security holders (2) |
133,186 | 21.44 | — | |||||||||
|
|
|
|
|
|||||||||
| Total |
200,396 | 447,521 | ||||||||||
|
|
|
|
|
|||||||||
| (1) | Includes the 2012 Omnibus Equity Compensation Plan and 2004 Omnibus Stock Option Plan |
| (2) | Includes the 2001 Directors’ Option Plan, 1999 Stock Option Plan, and other plans related to past business combinations, which are expired or not available to issue new options, warrants, or rights |
| (3) | Shares available for future issuance are under the 2012 Omnibus Equity Compensation Plan. |
Additional information required in this item is incorporated by reference to our Proxy Statement for the 2017 Annual Meeting under the heading “Information on Stock Ownership.”
| Item 13. | Certain Relationships and Related Transactions, and Director Independence. |
The information required in this item is incorporated by reference to our Proxy Statement for the 2017 Annual Meeting under the headings “Corporate Governance” and “Related Person/Party Transactions.”
| Item 14. | Principal Accounting Fees and Services. |
The information required in this item is incorporated by reference to our Proxy Statement for the 2017 Annual Meeting under the heading “Independent Registered Public Accounting Firm.”
130
Table of Contents
PART IV
| Item 15. | Exhibits, Financial Statement Schedules. |
| (a) | Documents Filed as Part of this Report |
| (1) | Financial Statements |
The financial statements required in this item are incorporated by reference to Item 8, “Financial Statements and Supplementary Data,” in Part II of this report.
| (2) | Financial Statement Schedules |
The schedules required in this item are omitted because they are not applicable or the required information is included in the consolidated financial statements or related notes.
| (3) | Exhibits |
The exhibits required in this item are incorporated by reference to the Exhibit Index of this report.
131
Table of Contents
Pursuant to the requirements of Section 13 or 15(d) of the Securities Exchange Act of 1934, the registrant has duly caused this report to be signed on its behalf by the undersigned, thereunto duly authorized on the 3rd day of March, 2017.
First Community Bancshares, Inc.
(Registrant)
| By: | /s/ William P. Stafford, II |
By: | /s/ David D. Brown | |||||
| William P. Stafford, II | David D. Brown | |||||||
| Chief Executive Officer (Principal Executive Officer) |
Chief Financial Officer (Principal Financial Officer and Principal Accounting Officer) | |||||||
Pursuant to the requirements of the Securities Exchange Act of 1934, this report has been signed below by the following persons on behalf of the registrant and in the capacities and on the dates indicated.
| Signature |
Title |
Date | ||
| /s/ William P. Stafford, II |
Chairman and Chief Executive Officer | March 3, 2017 | ||
|
William P. Stafford, II |
||||
| /s/ David D. Brown |
Chief Financial Officer |
March 3, 2017 | ||
| David D. Brown | ||||
| /s/ W. C. Blankenship, Jr. |
Director |
March 3, 2017 | ||
| W. C. Blankenship, Jr. | ||||
| /s/ C. William Davis |
Director |
March 3, 2017 | ||
| C. William Davis | ||||
| /s/ Samuel L. Elmore |
Director |
March 3, 2017 | ||
| Samuel L. Elmore | ||||
| /s/ Richard S. Johnson |
Director |
March 3, 2017 | ||
| Richard S. Johnson | ||||
| /s/ I. Norris Kantor |
Director |
March 3, 2017 | ||
| I. Norris Kantor | ||||
| /s/ Gary R. Mills |
President and Director |
March 3, 2017 | ||
| Gary R. Mills | ||||
| /s/ M. Adam Sarver |
Director |
March 3, 2017 | ||
| M. Adam Sarver | ||||
132
Table of Contents
| Exhibit No. |
Exhibit | |
| 2.1 | Purchase and Assumption Agreement between First Community Bank and First Bank, incorporated by reference to Exhibit 2.1 of the Current Report on Form 8-K dated March 3, 2016, filed on March 4, 2016 | |
| 2.2 | Purchase and Assumption Agreement between First Bank and First Community Bank, incorporated by reference to Exhibit 2.2 of the Current Report on Form 8-K dated March 3, 2016, filed on March 4, 2016 | |
| 3.1 | Articles of Incorporation of First Community Bancshares, Inc., as amended, incorporated by reference to Exhibit 3(i) of the Quarterly Report on Form 10-Q for the period ended June 30, 2010, filed on August 16, 2010 | |
| 3.2 | Amended and Restated Bylaws of First Community Bancshares, Inc., incorporated by reference to Exhibit 3.1 of the Current Report on Form 8-K dated February 23, 2016, filed on February 25, 2016 | |
| 4.1 | Specimen stock certificate of First Community Bancshares, Inc., incorporated by reference to Exhibit 4.1 of the Annual Report on Form 10-K for the period ended December 31, 2002, filed on March 25, 2003, amended on June 30, 2003 | |
| 4.2 | Indenture Agreement dated September 25, 2003, incorporated by reference to Exhibit 4.2 of the Quarterly Report on Form 10-Q for the period ended September 30, 2003, filed on November 10, 2003 | |
| 4.3 | Declaration of Trust of FCBI Capital Trust dated September 25, 2003, as amended and restated, incorporated by reference to Exhibit 4.3 of the Quarterly Report on Form 10-Q for the period ended September 30, 2003, filed on November 10, 2003 | |
| 4.4 | Preferred Securities Guarantee Agreement dated September 25, 2003, incorporated by reference to Exhibit 4.4 of the Quarterly Report on Form 10-Q for the period ended September 30, 2003, filed on November 10, 2003 | |
| 10.1** | First Community Bancshares, Inc. 1999 Stock Option Plan, incorporated by reference to Exhibit 10.1 of the Annual Report on Form 10-K for the period ended December 31, 1999, filed on March 30, 2000, amended on April 13, 2000, and Amendment One, incorporated by reference to Exhibit 10.1.1 of the Quarterly Report on Form 10-Q for the period ended June 30, 2004, filed on May 7, 2004 | |
| 10.2** | First Community Bancshares, Inc. 1999 Stock Option Agreement, incorporated by reference to Exhibit 10.5 of the Quarterly Report on Form 10-Q for the period ended June 30, 2002, filed on August 14, 2002 | |
| 10.3** | First Community Bancshares, Inc. 2001 Nonqualified Director Stock Option Plan, incorporated by reference to Exhibit 10.4 of the Quarterly Report on Form 10-Q for the period ended June 30, 2002, filed on August 14, 2002 | |
| 10.4** | Employment Agreement between First Community Bancshares, Inc. and John M. Mendez dated December 16, 2008, as amended and restated, incorporated by reference to Exhibit 10.1 of the Current Report on Form 8-K dated and filed on December 16, 2008, and Waiver Agreement, incorporated by reference to Exhibit 10.2 of the Current Report on Form 8-K dated December 16, 2010, filed on December 17, 2010 | |
| 10.5** | First Community Bancshares, Inc. and Affiliates Executive Retention Plan, incorporated by reference to Exhibit 10.1 of the Current Report on Form 8-K dated December 30, 2008, filed on January 5, 2009; Amendment #1, incorporated by reference to Exhibit 10.3 of the Current Report on Form 8-K | |
133
Table of Contents
| Exhibit No. |
Exhibit | |
| dated December 16, 2010, filed on December 17, 2010; Amendment #2, incorporated by reference to Exhibit 10.1 of the Current Report on Form 8-K dated February 21, 2013, filed on February 25, 2013; Amendment #3, incorporated by reference to Exhibit 10.1 of the Current Report on Form 8-K dated May 24, 2016, filed on May 27, 2016; and Amendment #4, incorporated by reference to Exhibit 10.1 of the Current Report on Form 8-K dated and filed on February 28, 2017 | ||
| 10.6** | First Community Bancshares, Inc. Split Dollar Plan and Agreement, incorporated by reference to Exhibit 10.5 of the Annual Report on Form 10-K for the period ended December 31, 1999, filed on March 30, 2000, amended on April 13, 2000 | |
| 10.7** | First Community Bancshares, Inc. Supplemental Directors Retirement Plan, as amended and restated, incorporated by reference to Exhibit 10.1 of the Current Report on Form 8-K dated December 16, 2010, filed on December 17, 2010, and Amendment #2, incorporated by reference to Exhibit 10.2 of the Current Report on Form 8-K dated May 24, 2016, filed on May 31, 2016 | |
| 10.8** | First Community Bancshares, Inc. Nonqualified Supplemental Cash or Deferred Retirement Plan, as amended and restated, incorporated by reference to Exhibit 99.1 of the Current Report on Form 8-K dated August 22, 2006, filed on August 23, 2006, and Amendment #2, incorporated by reference to Exhibit 10.2 of the Current Report on Form 8-K dated and filed on February 28, 2017 | |
| 10.9** | First Community Bancshares, Inc. 2004 Omnibus Stock Option Plan, incorporated by reference to Annex B to the 2004 First Community Bancshares, Inc. Definitive Proxy Statement filed on March 15, 2004, and Stock Award Agreement, incorporated by reference to Exhibit 10.13 of the Quarterly Report on Form 10-Q for the period ended June 30, 2004, filed on August 6, 2004 | |
| 10.10** | First Community Bancshares, Inc. 2012 Omnibus Equity Compensation Plan, incorporated by reference to the 2012 First Community Bancshares, Inc. Definitive Proxy Statement filed on March 7, 2012 | |
| 10.11** | First Community Bancshares, Inc. Directors Deferred Compensation Plan, as amended and restated, incorporated by reference to Exhibit 99.2 of the Current Report on Form 8-K dated August 22, 2006, filed on August 23, 2006 | |
| 10.12** | Employment Agreement between First Community Bancshares, Inc. and David D. Brown dated April 16, 2015, incorporated by reference to Exhibit 10.3 of the Current Report on Form 8-K dated and filed on April 16, 2015 | |
| 10.13** | Employment Agreement between First Community Bancshares, Inc. and E. Stephen Lilly dated April 16, 2015, incorporated by reference to Exhibit 10.5 of the Current Report on Form 8-K dated and filed on April 16, 2015 | |
| 10.14** | Employment Agreement between First Community Bancshares, Inc. and Gary R. Mills dated April 16, 2015, incorporated by reference to Exhibit 10.2 of the Current Report on Form 8-K dated and filed on April 16, 2015 | |
| 10.15** | Employment Agreement between First Community Bancshares, Inc. and Martyn A. Pell dated April 16, 2015, incorporated by reference to Exhibit 10.4 of the Current Report on Form 8-K dated and filed on April 16, 2015, and Amendment #1 dated May 27, 2016, incorporated by reference to Exhibit 10.1 of the Current Report on Form 8-K dated May 24, 2016, filed on May 27, 2016 | |
| 10.16** | Employment Agreement between First Community Bank and Robert L. Schumacher dated April 16, 2015, incorporated by reference to the Current Report on Form 8-K dated and filed on April 16, 2015 | |
| 10.17** | Employment Agreement between First Community Bancshares, Inc. and William P. Stafford, II dated April 16, 2015, incorporated by reference to Exhibit 10.1 of the Current Report on Form 8-K dated and filed on April 16, 2015 | |
134
Table of Contents
| Exhibit No. |
Exhibit | |
| 10.18** | Employment Agreement between First Community Bank and Mark R. Evans dated July 31, 2009, incorporated by reference to Exhibit 2.1 of the Current Report on Form 8-K dated April 2, 2009, filed on April 3, 2009 | |
| 10.19** | Form of Restricted Stock Grant Agreement under First Community Bancshares, Inc. 2012 Omnibus Equity Compensation Plan, incorporated by reference to Exhibit 99.1 of the Current Report on Form 8-K dated and filed May 28, 2013 | |
| 10.20** | Separation Agreement and Release between First Community Bancshares, Inc. and John M. Mendez dated August 28, 2013, incorporated by reference to Exhibit 99.1 of the Current Report on Form 8-K/A dated August 12, 2013, filed on September 3, 2013 | |
| 11 | Statement Regarding Computation of Earnings per Share, incorporated by reference to Note 18 of the Notes to Condensed Consolidated Financial Statements in Part II, Item 8 of this report | |
| 12* | Statement Regarding Computation of Ratios | |
| 21* | Subsidiaries of the Registrant | |
| 23* | Consent of Independent Public Accounting Firm | |
| 31.1* | Rule 13a-14(a)/15d-14(a) Certification of Chief Executive Officer | |
| 31.2* | Rule 13a-14(a)/15d-14(a) Certification of Chief Financial Officer | |
| 32* | Certification of Chief Executive Officer and Chief Financial Officer pursuant to 18 U.S.C. Section 1350, as adopted pursuant to Section 906 of the Sarbanes-Oxley Act of 2002 | |
| 101*** | Interactive data files pursuant to Rule 405 of Regulation S-T: (i) Consolidated Balance Sheets as of December 31, 2016 and 2015; (ii) Consolidated Statements of Income for the years ended December 31, 2016, 2015, and 2014; (iii) Consolidated Statements of Comprehensive Income for the years ended December 31, 2016, 2015, and 2014; (iv) Consolidated Statements of Stockholders’ Equity for the years ended December 31, 2016, 2015, and 2014; (v) Consolidated Statements of Cash Flows for the years ended December 31, 2016, 2015, and 2014; and (vi) Notes to Consolidated Financial Statements | |
| * | Filed herewith |
| ** | Indicates a management contract or compensation plan or agreement |
| *** | Submitted electronically herewith |
135