Attached files
| file | filename |
|---|---|
| 8-K - 8-K - ADVENT SOFTWARE INC /DE/ | a12-17233_18k.htm |
| EX-99.1 - EX-99.1 - ADVENT SOFTWARE INC /DE/ | a12-17233_1ex99d1.htm |
|
|
Advent Software, Inc. Second Quarter 2012 Earnings Highlights July 30, 2012 Advent Investor Relations Contact: InvestorRelations@advent.comt |
|
|
ADVS Forward-Looking Statements The financial projections under 2012 guidance, and any other forward-looking statements included in this presentation reflect management's best judgment based on factors currently known and involve risks and uncertainties; our actual results may differ materially from those discussed here. These risks and uncertainties include: potential fluctuations in new contract bookings, renewal rates, operating results and future growth rates; continued market acceptance of our Advent Portfolio Exchange®, Geneva® and Moxy® products; the successful development, release and market acceptance of new products and product enhancements; uncertainties and fluctuations in the financial markets; the Company’s ability to satisfy contractual performance requirements; difficulties in integrating merged businesses, such as Black Diamond Performance Reporting, LLC, and achieving expected synergies and results; and other risks detailed from time to time in our SEC reports including, but not limited to, our quarterly reports on Form 10-Q and our 2011 annual report on Form 10-K. The Company disclaims any intention or obligation to publicly update or revise any forward-looking statements including any guidance, whether as a result of events or circumstances after the date hereof or to reflect the occurrence of unanticipated events. |
|
|
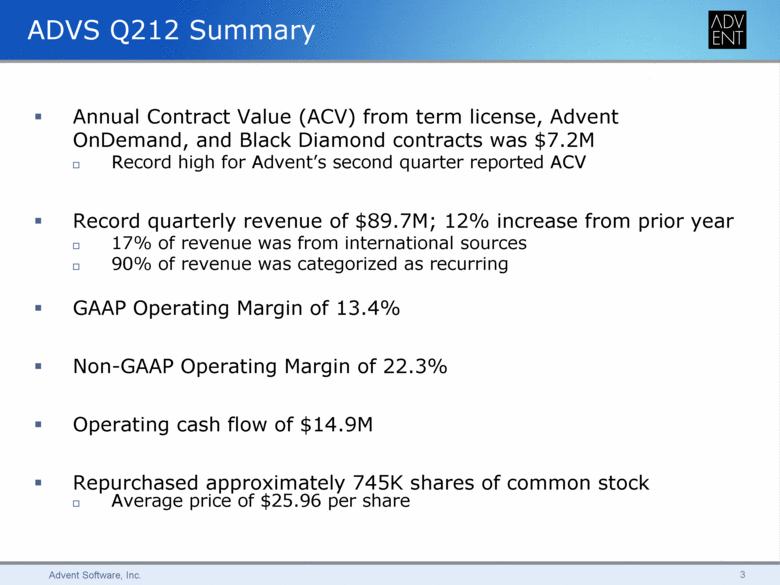
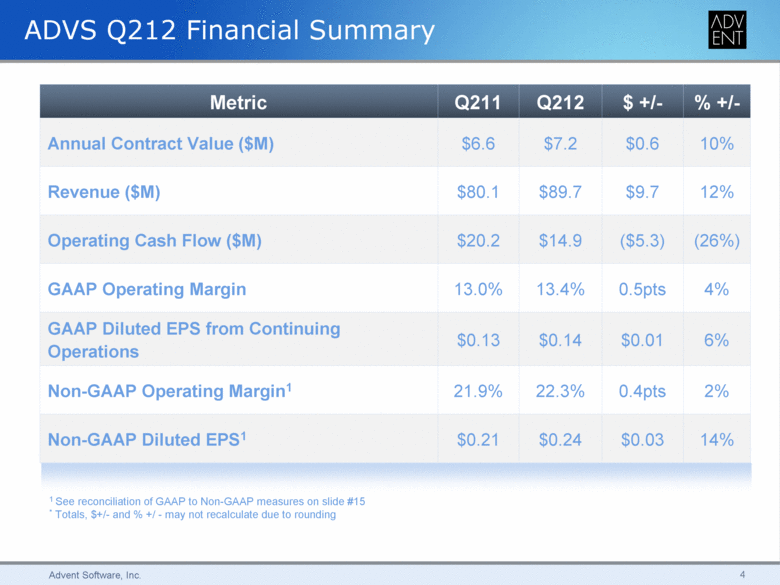
ADVS Q212 Summary Annual Contract Value (ACV) from term license, Advent OnDemand, and Black Diamond contracts was $7.2M Record high for Advent’s second quarter reported ACV Record quarterly revenue of $89.7M; 12% increase from prior year 17% of revenue was from international sources 90% of revenue was categorized as recurring GAAP Operating Margin of 13.4% Non-GAAP Operating Margin of 22.3% Operating cash flow of $14.9M Repurchased approximately 745K shares of common stock Average price of $25.96 per share |
|
|
ADVS Q212 Financial Summary Metric Q211 Q212 $ +/- % +/- Annual Contract Value ($M) $6.6 $7.2 $0.6 10% Revenue ($M) $80.1 $89.7 $9.7 12% Operating Cash Flow ($M) $20.2 $14.9 ($5.3) (26%) GAAP Operating Margin 13.0% 13.4% 0.5pts 4% GAAP Diluted EPS from Continuing Operations $0.13 $0.14 $0.01 6% Non-GAAP Operating Margin1 21.9% 22.3% 0.4pts 2% Non-GAAP Diluted EPS1 $0.21 $0.24 $0.03 14% 1 See reconciliation of GAAP to Non-GAAP measures on slide #15 * Totals, $+/- and % +/ - may not recalculate due to rounding |
|
|
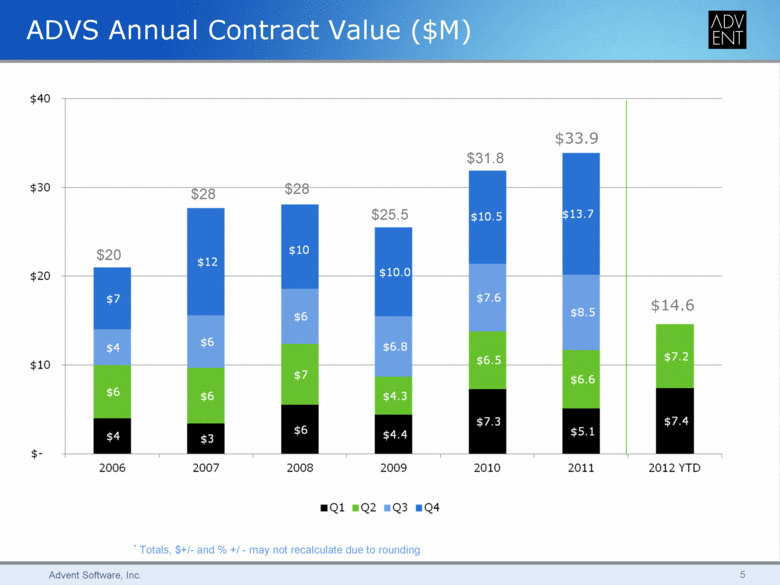
ADVS Annual Contract Value ($M) $40 $33.9 $31.8 $30 $28 $28 $25.5 $10.5 $13.7 $20 $10 $12 $20 $10.0 $7 $7.6 $14.6 $6 $8.5 $6 $6.8 $4 $6.5 $7.2 $10 $7 $6.6 $6 $6 $4.3 $7.3 $7.4 $6 $4.4 $5.1 $4 $3 $-2006 2007 2008 2009 2010 2011 2012 YTD Q1 Q2 Q3 Q4 * Totals, $+/- and % +/ -may not recalculate due to rounding Advent Software, Inc. 5 |
|
|
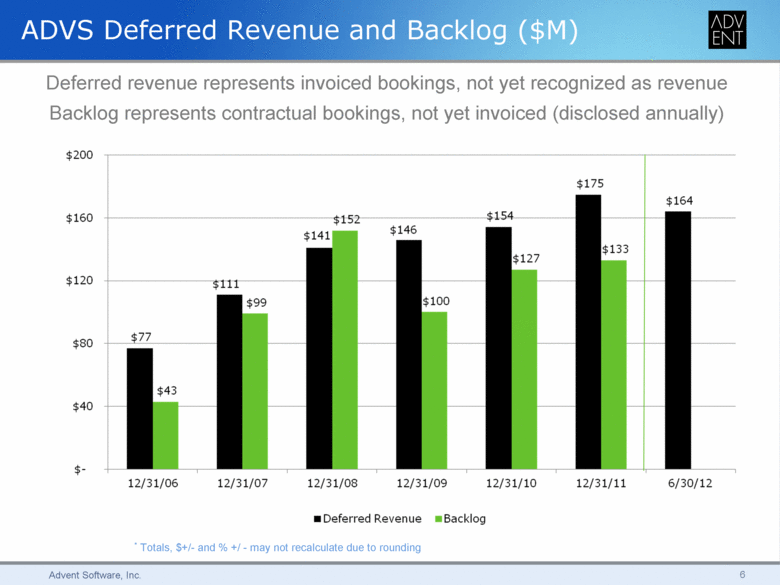
ADVS Deferred Revenue and Backlog ($M) Deferred revenue represents invoiced bookings, not yet recognized as revenue Backlog represents contractual bookings, not yet invoiced (disclosed annually) $200 $175 $164 $160 $152 $154 $146 $141 $133 $127 $120 $111 $99 $100 $77 $80 $43 $40 $- 12/31/06 12/31/07 12/31/08 12/31/09 12/31/10 12/31/11 6/30/12 Deferred Revenue Backlog *Totals, $+/- and % +/ - may not recalculate due to rounding Advent Software, Inc. 6 |
|
|
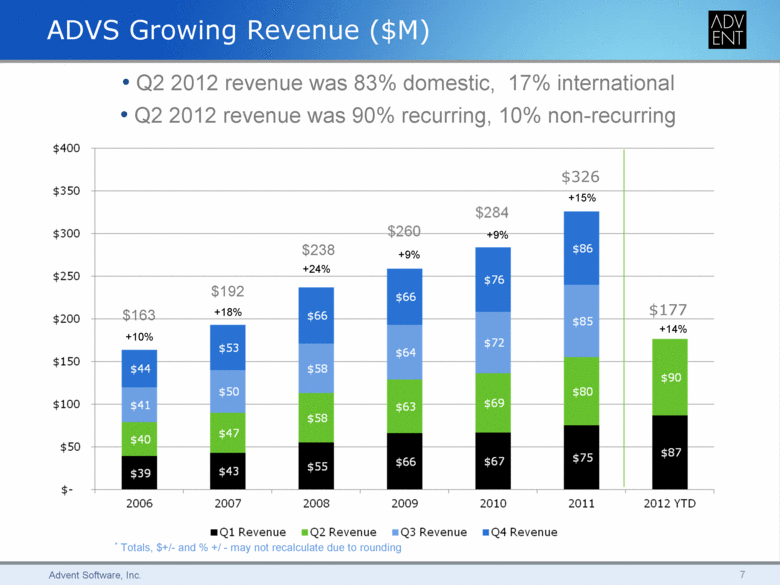
ADVS Growing Revenue ($M) • Q2 2012 revenue was 83% domestic, 17% international • Q2 2012 revenue was 90% recurring, 10% non-recurring $400 $326 $350 + 15% $284 $300 $260 +9% $238 $86 +9% +24% $250 $76 $192 $66 $163 +18% $66 $177 $200 $85 +14% +10% $53 $72 $64 $150 $44 $58 $90 $50 $80 $100 $41 $63 $69 $58 $47 $40 $50 $75 $87 $55 $66 $67 $39 $43 $-2006 2007 2008 2009 2010 2011 2012 YTD Q1 Revenue Q2 Revenue Q3 Revenue Q4 Revenue * Totals, $+/- and % +/ - may not recalculate due to rounding Advent Software, Inc. 7 |
|
|
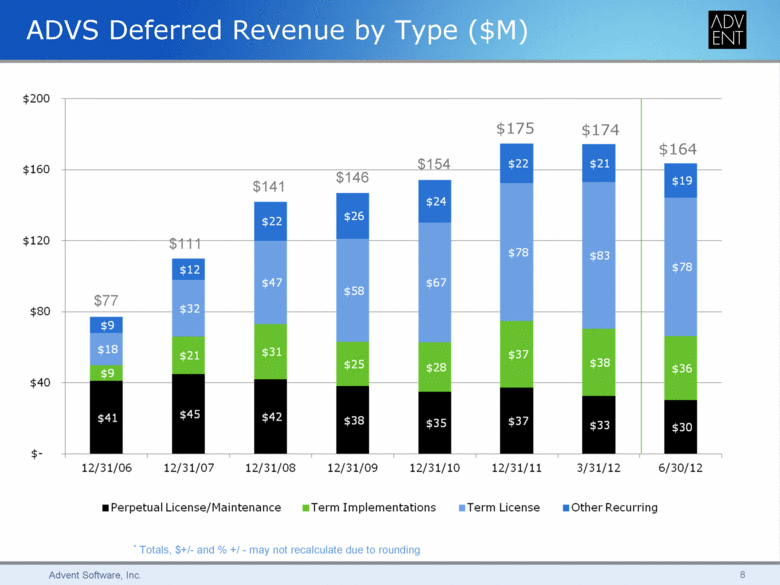
ADVS Deferred Revenue by Type ($M) $200 $175 $174 $164 $154 $22 $21 $160 $146 $19 $141 $24 $22 $26 $120 $111 $78 $83 $12 $78 $47 $67 $58 $77 $80 $32 $9 $18 $31 $37 $21 $25 $28 $38 $9 $36 $40 $41 $45 $42 $38 $35 $37 $33 $30 $- 12/31/06 12/31/07 12/31/08 12/31/09 12/31/10 12/31/11 3/31/12 6/30/12 Perpetual License/Maintenance Term Implementations Term License Other Recurring * Totals, $+/- and % +/ - may not recalculate due to rounding Advent Software, Inc. 8 |
|
|
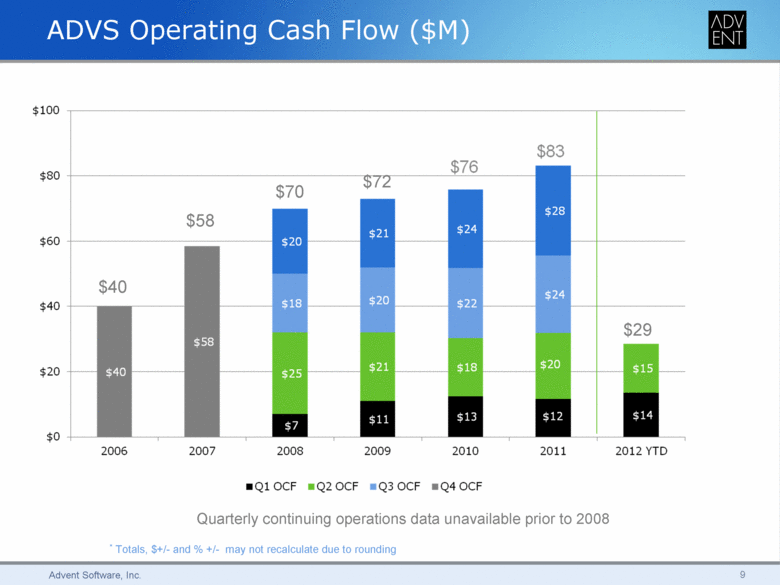
ADVS Operating Cash Flow ($M) $100 $83 $76 $80 $72 $70 $28 $58 $21 $24 $60 $20 $40 $24 $18 $20 $22 $40 $29 $58 $21 $18 $20 $15 $20 $40 $25 $11 $13 $12 $14 $7 $0 2006 2007 2008 2009 2010 2011 2012 YTD Q1 OCF Q2 OCF Q3 OCF Q4 OCF Quarterly continuing operations data unavailable prior to 2008 * Totals, $+/- and % +/- may not recalculate due to rounding Advent Software, Inc. 9 |
|
|
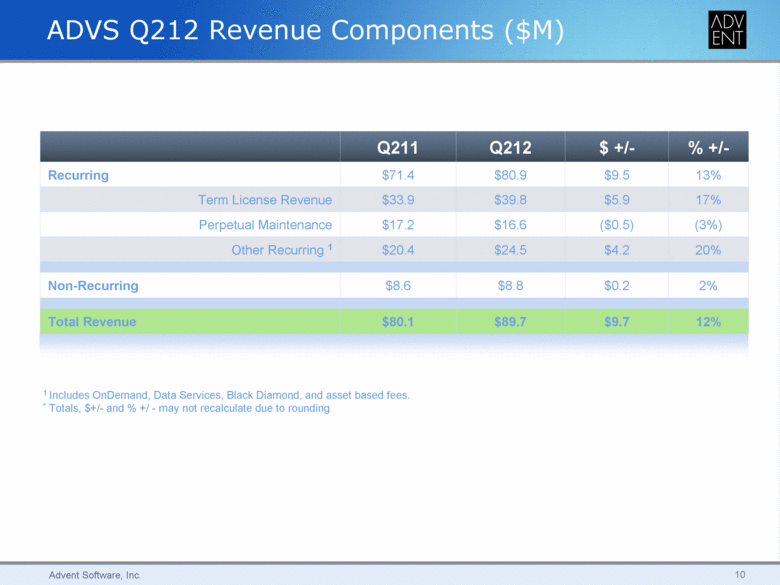
ADVS Q212 Revenue Components ($M) Q211 Q212 $ +/- % +/- Recurring $71.4 $80.9 $9.5 13% Term License Revenue $33.9 $39.8 $5.9 17% Perpetual Maintenance $17.2 $16.6 ($0.5) (3%) Other Recurring 1 $20.4 $24.5 $4.2 20% Non-Recurring $8.6 $8.8 $0.2 2% Total Revenue $80.1 $89.7 $9.7 12% 1 Includes OnDemand, Data Services, Black Diamond, and asset based fees. * Totals, $+/- and % +/ - may not recalculate due to rounding 10 |
|
|
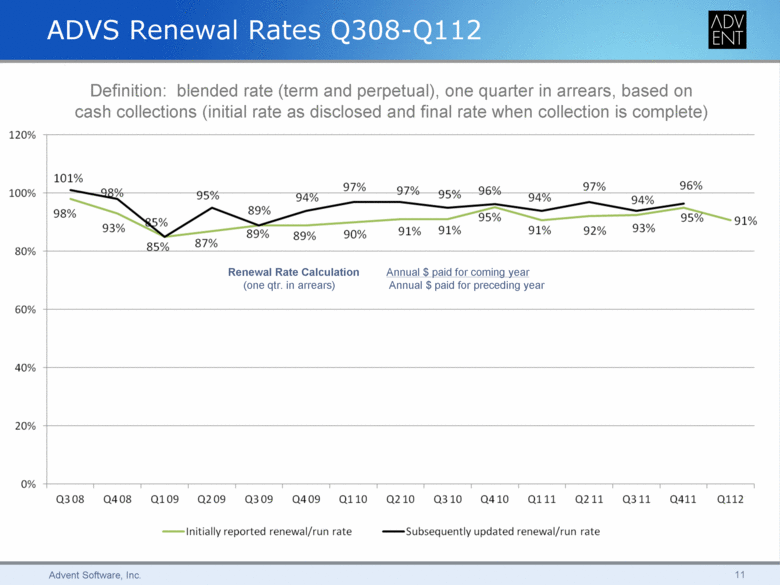
ADVS Renewal Rates Q308-Q112 Definition: blended rate (term and perpetual), one quarter in arrears, based on cash collections (initial rate as disclosed and final rate when collection is complete) 120% 101% 97% 97% 96% 97% 96% 100% 98% 95% 95% 94% 94% 98% 89% 85% 95% 95% 91% 93% 91% 91% 91% 92% 93% 89% 89% 90% 85% 87% 80% Renewal Rate Calculation Annual $ paid for coming year (one qtr. in arrears) Annual $ paid for preceding year 60% 40% 20% 0% Q3 08 Q4 08 Q1 09 Q2 09 Q3 09 Q4 09 Q1 10 Q2 10 Q3 10 Q4 10 Q1 11 Q2 11 Q3 11 Q411 Q112 Initially reported renewal/run rate Subsequently updated renewal/run rate Advent Software, Inc. 11 |
|
|
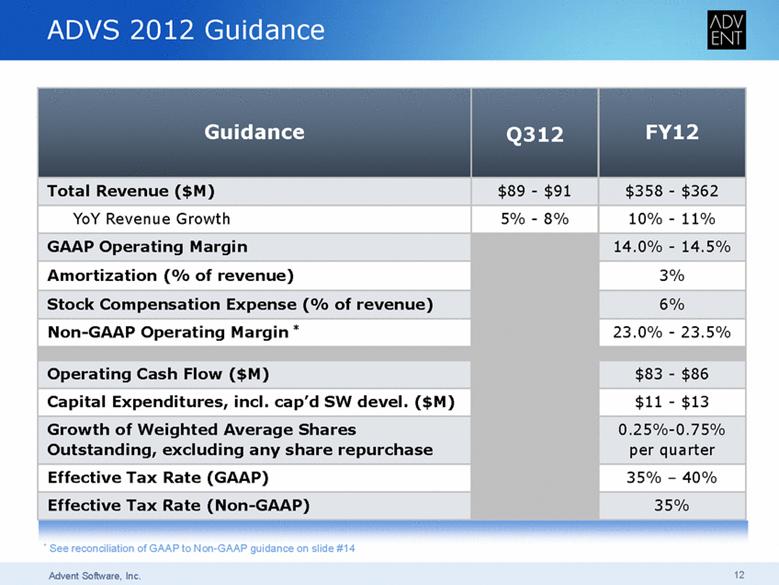
ADVS 2012 Guidance Guidance Q312 FY12 Total Revenue ($M) $89 - $91 $358 - $362 YoY Revenue Growth 5% - 8% 10% - 11% GAAP Operating Margin 14.0% - 14.5% Amortization (% of revenue) 3% Stock Compensation Expense (% of revenue) 6% Non-GAAP Operating Margin * 23 0% - 23 5% Non 23.0% 23.5% Operating Cash Flow ($M) $83 - $86 Capital Expenditures, incl. cap’d SW devel. ($M) $11 - $13 Growth of Weighted Average Shares Outstanding, excluding any share repurchase 0.25%-0.75% per quarter Effective Tax Rate (GAAP) 35% – 40% Effective Tax Rate (Non-GAAP) 35% Advent Software, Inc. 12 Effective Tax Rate (Non-* See reconciliation of GAAP to Non-GAAP guidance on slide #14 |
|
|
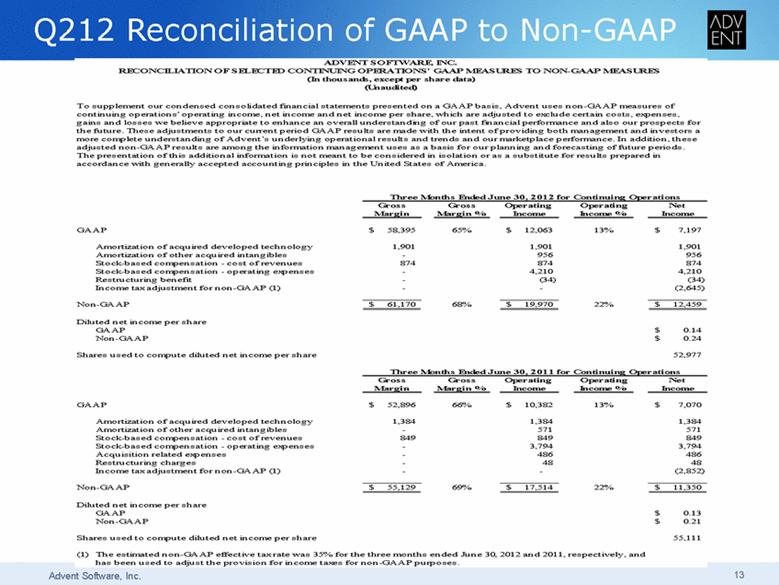
Q212 Reconciliation of GAAP to Non-GAAP ADVENT SOFTWARE, INC. RECONCILIATION OF SELECTED CONTINUING OPERATIONS' GAAP MEASURES TO NON-GAAP MEASURES (In thousands, except per share data) (Unaudited) To supplement our condensed consolidated financial statements presented on a GAAP basis, Advent uses non-GAAP measures of continuing operations' operating income, net income and net income per share, which are adjusted to exclude certain costs, expenses, gains and losses we believe appropriate to enhance an overall understanding of our past financial performance and also our prospects for the future. These adjustments to our current period GAAP results are made with the intent of providing both management and investors a more complete understanding of Advent’s underlying operational results and trends and our marketplace performance. In addition, these adjusted non-GAAP results are among the information management uses as a basis for our planning and forecasting of future periods. The presentation of this additional information is not meant to be considered in isolation or as a substitute for results prepared in accordance with generally accepted accounting principles in the United States of America. Gross Gross Operating Operating Net Margin Margin % Income Income % Income GAAP 58,395 $ 65% 12,063 $ 13% 7,197 $ Amortization of acquired developed technology 1,901 1,901 1,901 Three Months Ended June 30, 2012 for Continuing Operations Amortization of other acquired intangibles - 956 956 Stock-based compensation - cost of revenues 874 874 874 Stock-based compensation - operating expenses - 4,210 4,210 Restructuring benefit - (34) (34) Income tax adjustment for non-GAAP (1) - - (2,645) Non-GAAP 61,170 $ 68% 19,970 $ 22% 12,459 $ Diluted net income per share GAAP 0.14 $ Non-GAAP 0.24 $ Shares used to compute diluted net income per share 52,977 Gross Gross Operating Operating Net Margin Margin % Income Income % Income GAAP 52,896 $ 66% 10,382 $ 13% 7,070 $ Three Months Ended June 30, 2011 for Continuing Operations Amortization of acquired developed technology 1,384 1,384 1,384 Amortization of other acquired intangibles - 571 571 Stock-based compensation - cost of revenues 849 849 849 Stock-based compensation - operating expenses - 3,794 3,794 Acquisition related expenses - 486 486 Restructuring charges - 48 48 Income tax adjustment for non-GAAP (1) - - (2,852) Non-GAAP 55,129 $ 69% 17,514 $ 22% 11,350 $ Advent Software, Inc. 13 Diluted net income per share GAAP 0.13 $ Non-GAAP 0.21 $ Shares used to compute diluted net income per share 55,111 (1) The estimated non-GAAP effective tax rate was 35% for the three months ended June 30, 2012 and 2011, respectively, and has been used to adjust the provision for income taxes for non-GAAP purposes. |
|
|
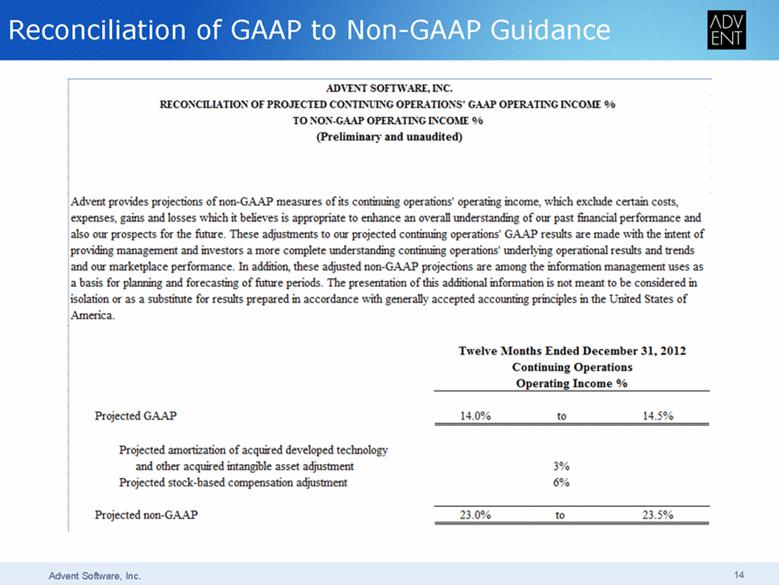
Reconciliation of GAAP to Non-GAAP Guidance Advent Software, Inc. 14 Advent Software, Inc. Reconciliation of Projected Continuing Operations’ GAAP Operating Income % to Non-GAAP Operating Income % (Preliminary and unaudited) Advent provides projections of non-GAAP measures of its continuing operations’ operating income, which exclude certain costs, expenses, gains and losses which it believes is appropriate to enhance an overall understanding of our past financial performance and also our prospects for the future. These adjustments to our projected continuing operation’s GAAP results are made with the intent of providing management and investors a more complete understanding continuing operations’ underlying operational results and trends and our marketplace performance. In addition, these adjusted non-GAAP projections are among the information management uses as a basis for planning and forecasting of future periods. The presentation of this additional information is not meant to be considered in isolation or as a substitute for results prepared in accordance with generally accepted accounting principles in the United States of America. Twelve Months Ended December 31,2012 Continuing Operations Operating Income % Projected GAAP 14.0% to 14.5% Projected amortization of acquired developed technology and other acquired intangible asset adjustment 3% Projected stock-based compensation adjustment 6% Projected non-GAAP 23.0% to 23.5% |