Attached files
| file | filename |
|---|---|
| EX-32.2 - EX-32.2 - ADVENT SOFTWARE INC /DE/ | a2202510zex-32_2.htm |
| EX-32.1 - EX-32.1 - ADVENT SOFTWARE INC /DE/ | a2202510zex-32_1.htm |
| EX-31.2 - EX-31.2 - ADVENT SOFTWARE INC /DE/ | a2202510zex-31_2.htm |
| EX-31.1 - EX-31.1 - ADVENT SOFTWARE INC /DE/ | a2202510zex-31_1.htm |
| EX-23.1 - EX-23.1 - ADVENT SOFTWARE INC /DE/ | a2202510zex-23_1.htm |
| EX-21.1 - EX-21.1 - ADVENT SOFTWARE INC /DE/ | a2202510zex-21_1.htm |
Use these links to rapidly review the document
TABLE OF CONTENTS
TABLE OF CONTENTS 2
UNITED STATES
SECURITIES AND EXCHANGE COMMISSION
Washington, D.C. 20549
FORM 10-K
| ý | Annual report pursuant to Section 13 or 15(d) of the Securities Exchange Act of 1934 | |
For the fiscal year ended December 31, 2010 |
||
or |
||
o |
Transition report pursuant to Section 13 or 15(d) of the Securities Exchange Act of 1934 |
|
For the transition period from to |
||
Commission file number: 0-26994
ADVENT SOFTWARE, INC.
(Exact name of registrant as specified in its charter)
| Delaware (State or other jurisdiction of incorporation or organization) |
94-2901952 (IRS Employer Identification Number) |
600 Townsend Street, San Francisco, California 94103
(Address of principal executive offices and zip code)
(415) 543-7696
(Registrant's telephone number, including area code)
Securities registered pursuant to Section 12(b) of the Act:
| Title of Each Class | Name of Each Exchange on Which Registered | |
|---|---|---|
| Common Stock, par value $0.01 per share | The NASDAQ Stock Market LLC (NASDAQ Global Select) |
Securities registered pursuant to Section 12(g) of the Act: None
Indicate by check mark if the registrant is a well-known seasoned issuer, as defined in Rule 405 of the Securities Act. Yes o No ý
Indicate by check mark if the registrant is not required to file reports pursuant to Section 13 or Section 15(d) of the Exchange Act. Yes o No ý
Indicate by check mark whether the registrant (1) has filed all reports required to be filed by Section 13 or 15(d) of the Securities Exchange Act of 1934 (the "Exchange Act") during the preceding 12 months (or for such shorter period that the registrant was required to file such reports), and (2) has been subject to such filing requirements for the past 90 days. Yes ý No o
Indicate by check mark whether the registrant has submitted electronically and posted on its corporate Web site, if any, every Interactive Data File required to be submitted and posted pursuant to Rule 405 of Regulation S-T (§232.405 of this chapter) during the preceding 12 months (or for such shorter period that the registrant was required to submit and post such files). Yes o No o
Indicate by check mark if disclosure of delinquent filers pursuant to Item 405 of Regulation S-K is not contained herein, and will not be contained, to the best of registrant's knowledge, in definitive proxy or information statements incorporated by reference in Part III of this Form 10-K or any amendment to this Form 10-K. ý
Indicate by check mark whether the registrant is a large accelerated filer, an accelerated filer, a non-accelerated filer, or a small reporting company. See the definitions of "large accelerated filer," "accelerated filer" and "small reporting company" in Rule 12b-2 of the Exchange Act.
| Large accelerated filer o | Accelerated filer ý | Non-accelerated filer o (Do not check if a smaller reporting company) |
Smaller reporting company o |
Indicate by check mark whether the registrant is a shell company (as defined in Rule 12b-2 of the Exchange Act). Yes o No ý
The number of shares of the registrant's common stock outstanding as of June 30, 2010 was 51,066,392. The aggregate market value of the registrant's common stock held by non-affiliates, based upon the closing price on June 30, 2010, as reported on the NASDAQ National Market System, was approximately $574 million. Shares of common stock held by each officer and director and by each person who owns 5% or more of the outstanding common stock have been excluded in that such persons may be deemed to be affiliates. This determination of affiliate status is not necessarily a conclusive determination for other purposes. As of February 28, 2011, there were 52,339,755 shares of the registrant's common stock outstanding.
DOCUMENTS INCORPORATED BY REFERENCE
Portions of the registrant's definitive Proxy Statement for the Annual Meeting of Stockholders to be held May 11, 2011 are incorporated by reference into Part III of this Annual Report on Form 10-K to the extent stated herein. Except with respect to information specifically incorporated by reference in this Form 10-K, the Proxy Statement is not deemed to be filed as part herein.
2
SPECIAL NOTE REGARDING FORWARD-LOOKING STATEMENTS
You should read the following discussion in conjunction with our consolidated financial statements and related notes. The following discussion contains forward-looking statements within the meaning of Section 27A of the Securities Act of 1933 as amended and Section 21E of the Securities Exchange Act of 1934 as amended, including, but not limited to, statements referencing our expectations relating to future revenues, expenses and operating margins. Forward-looking statements can be identified by the use of terminology such as "may," "will," "should," "expect," "plan," "anticipate," "believe," "estimate," "predict," "potential," "continue" or other similar terms and the negative of such terms regarding beliefs, plans, expectations or intentions regarding the future. Forward-looking statements include, among others, statements regarding the future of the investment management market and opportunities for us related thereto, future expansion, acquisition, divestment of or investment in other businesses, projections of revenues, future cost and expense levels, expected timing and amount of amortization expenses related to past acquisitions, the adequacy of resources to meet future cash requirements, estimates or predictions of actions by customers, suppliers, competitors or regulatory authorities, future client wins, future hiring and future product introductions and acceptance. Such forward-looking statements are based on our current plans and expectations and involve known and unknown risks and uncertainties which may cause our actual results or performance to be materially different from any results or performance expressed or implied by such forward-looking statements. Such factors include, but are not limited to, the "Risk Factors" set forth in "Item 1A. Risk Factors" in this Form 10-K, as well as other risks identified from time to time in other Securities and Exchange Commission ("SEC") reports. You should not place undue reliance on our forward-looking statements, as they are not guarantees of future results, levels of activity or performance and represent our expectations only as of the date they are made.
Unless expressly stated or the context otherwise requires, the terms "we", "our", "us", the "Company" and "Advent" refer to Advent Software, Inc. and its subsidiaries.
Overview
Advent Software, Inc. was founded and incorporated in 1983 in California and reincorporated in Delaware in November 1995. We offer software and services that automate work flows and data across investment management organizations, as well as the information flows between an investment management organization and external parties. Our products are intended to increase operational efficiency, improve the accuracy of client information and enable better decision-making. Each solution focuses on specific mission-critical functions of the investment management organization and is tailored to meet the needs of the particular client, as determined by size, assets under management and complexity of the investment process.
Our business is organized into one reportable segment, Advent Investment Management ("AIM") which derives revenues from the development, marketing and sale of software products, hosting services, data interfaces and related maintenance and services that automate, integrate and support certain mission-critical functions of investment management organizations primarily in North America, Europe, Asia, the Middle East and Africa. Prior to the completion of the sale of our MicroEdge subsidiary in October 2009, we reported two operating segments, AIM and MicroEdge. MicroEdge derived revenues from the sale of software and services for grant management, matching gifts and volunteer tracking for the grantmaking community, primarily in the United States and United Kingdom. The results of MicroEdge have been reclassified as a discontinued operation for all periods presented. Unless otherwise noted, discussion in this document pertains to our continuing operations.
3
On December 13, 2010, we announced that our Board of Directors declared a two-for-one stock split of our common stock, payable in the form of a 100% stock dividend. On January 18, 2011, one additional share of common stock was distributed for each share held of record as of the close of business on January 3, 2011. Unless otherwise indicated, all references to number of shares and to per share information (except shares authorized) have been adjusted to reflect the stock split on a retroactive basis.
Our principal executive offices are located at 600 Townsend Street, San Francisco, California 94103, and our telephone number is (415) 543-7696. Our internet address is www.advent.com. On our Investor Relations web site, which is accessible through www.advent.com, we post the following filings as soon as reasonably practicable after they are electronically filed with or furnished to the Securities and Exchange Commission: our annual reports on Form 10-K, our quarterly reports on Form 10-Q, our current reports on Form 8-K and any amendments to those reports. All such filings on our Investor Relations web site are available free of charge. Information contained or referenced on our website is not incorporated by reference in and does not form a part of this Annual Report on Form 10-K. The SEC maintains an internet site at www.sec.gov that contains reports, proxy and information statements, and other information regarding issuers that file electronically with the SEC. The public may also read and copy any materials we file with the SEC at the SEC's Public Reference Room at 100 F Street, NE, Washington DC, 20549. The public may obtain information on the operation of the Public Reference Room by calling the SEC at 1-800-SEC-0330.
Advent's common stock (ticker symbol: ADVS) has traded on the NASDAQ Stock Market since its initial public offering on November 15, 1995. Our fiscal year ends on December 31st.
Clients
Advent's clients are investment management institutions and service providers that manage, advise and perform recordkeeping functions on financial assets. Examples of these institutions include global and US-based asset managers, wealth managers, registered investment advisors, prime brokers, fund administrators, hedge funds, family offices, broker dealers, foundations, pension funds, endowments, and funds of funds. We have a diverse client base ranging from small firms to some of the largest institutional clients in the world. In fiscal 2010, 2009 and 2008, no single customer accounted for more than 10% of our total net revenues. Geographically, the US continues to represent our primary market, with international sales representing 15%, 14% and 16% of total net revenues in 2010, 2009 and 2008, respectively.
Our Industry
Over the past decade, the investment management industry has transformed dramatically. These changes include: a significant increase in cross-border asset flows and global investment activity; the evolution and maturation of electronic markets; the proliferation of research information from a myriad of sources; the increase of assets managed in alternative strategies; and the creation of increasingly complex securities instruments used by hedge funds and in alternative strategies. All of these factors have created opportunities over the years for our investment manager clients, but they have also resulted in substantially increased complexity in their operations and processes. We believe that investment managers have clear needs that translate into demand for Advent solutions: portfolio accounting and analysis; trade order management and post-trade processing; research management; account management; and custodial reconciliation.
Market Trends
Advent's end market has been recovering consistently since the initial crisis in the fall of 2008. Decreasing confidence in the credit markets drove global equity markets into significant decline. The
4
impact on investment management organizations was twofold: first, the decline in market valuations impacted the size and buying power of some of our clients; and second, these firms face increasing pressure from regulators and investors to provide operational transparency. Beginning in the second half of 2009, demand returned from our end market and improved throughout 2010. The demand we see for our products and services is coming from many areas: new firm formation, new business lines created in existing client firms, replacement of legacy and competitor systems, new adoption of research management systems, and expansion of our existing customer relationships. Supporting these demand drivers are the underlying trends we see in the industry today: the globalization and growth of wealth, investor demand for increased transparency, regulatory changes, increased focus on operational risk management, and a trend toward outsourcing.
We anticipate the following trends to continue, which drives demand for Advent solutions:
- •
- Expanding regulatory oversight, such as the Dodd-Frank bill, requires bank holding companies to divest of
proprietary trading desks. The bill also requires hedge funds to register as investment advisors with the SEC and provide information about their trades and portfolios. We expect these two changes to
increase the number of firms in our addressable market and motivate more firms to develop their systems infrastructure and research management processes to mitigate risk.
- •
- Rising tide of new firm creation, as a result of the growth and globalization of wealth. Developed nations and developing
nations such as India, China, Russia, and Brazil are building wealth that will lead to more professional investment managers and sovereign wealth funds.
- •
- Pervasive adoption of a "multi-prime" brokerage model that helps hedge funds diversify their counterparty risk through
multiple prime relationships, encouraging funds to bring an accounting system in-house to perform combined accounting and reporting.
- •
- Increased focus on operational risk which resulted from discoveries of fraud during the financial crisis. This increased
focus leads investment management firms to "shadow" their custodian's books to ensure their accuracy and more closely monitor their investment decisions through adopting research management software.
- •
- Increasing demand for software delivery options including a Software-as-a-Service (SaaS) model.
In this climate, our end market's need to operate more efficiently while enhancing investor confidence and compliance is driving investment management organizations to continue leveraging Advent to automate and integrate their mission-critical and labor-intensive functions, including:
- •
- Investment decision support;
- •
- Trade order management and compliance;
- •
- Portfolio accounting, performance measurement and report generation;
- •
- Client relationship management;
- •
- Straight-through-processing that includes connectivity and data integration; and
- •
- Research management.
Seasonality
We experience seasonality in our license bookings. We believe that this seasonality in our bookings results from customer budgeting cycles and expect this seasonality to continue in the future. As a result, the fourth quarter of the year typically has more term license bookings and perpetual license fee revenue, followed by lower bookings and perpetual license revenue in the first quarter of the following year.
5
We also experience seasonality in our operating cash flows and expect this seasonality to continue in the future. We experience lower operating cash flows in the first quarter of the year as we make payments on our year-end liabilities including payables, bonuses, commissions and payroll taxes. Conversely, we experience relatively stronger operating cash flows in the fourth quarter of the year because we traditionally experience higher licensing activity which we bill annually at the anniversary of the contract signing date. This generally results in higher collections during the fourth quarter.
For additional information regarding factors that affect the timing of the recognition of software license revenue, see "Management's Discussion and Analysis of Financial Condition and Results of Operations / Critical Accounting Policies and Estimates / Revenue Recognition."
Strategy
Mission
Our mission is to strengthen and grow our business as a leading provider of mission-critical software and services for the investment management industry.
We believe we are well-positioned to maintain our competitive position in the longer term for the following reasons:
- •
- Our solutions are mission-critical to our customers;
- •
- Our technology can be utilized to increase operational efficiency;
- •
- As a market leader in investment management technology, customers will attempt to minimize risk and therefore favor our
stability, reliability and scalability;
- •
- A more regulated, compliance-oriented industry will drive an increased need for our systems;
- •
- Our recurring revenue model and large customer base will continue to provide longer term stability; and
- •
- We offer a wide range of deployment options to suit clients of any size and strategy.
We plan to strengthen and grow our core business by:
- •
- Further developing our international presence;
- •
- Expanding our footprint into clients' middle and front offices;
- •
- Expanding our addressable market;
- •
- Adding value to existing client accounts and platforms; and
- •
- Offering a variety of delivery options to suit client requirements
Customer Focus
At December 31, 2010, we served approximately 4,500 customers. The needs of our customers, and the investment management industry as a whole, continue to evolve. We are committed to making the required investments in product development to continue delivering mission-critical solutions to our customers as their needs change. We believe our strategy and customer focus are driving increasing market acceptance for our products. We signed 88 new APX clients and 44 new Geneva clients during 2010.
Our customers use our products for an average of over 10 years. Although the current environment has created pressure on our clients to decrease their information technology budgets, we
6
experience continued loyalty from our customers. While our renewal rates were impacted by the downturn in 2009, we experienced an improvement in renewal rates during the second half of 2010.
Renewal Rates
|
Q410 | Q310 | Q210 | Q110 | Q409 | |||||||||||
|---|---|---|---|---|---|---|---|---|---|---|---|---|---|---|---|---|
Based on cash collections relative to prior year collections |
||||||||||||||||
Initially disclosed rate(1) |
91 |
% |
91 |
% |
90 |
% |
89 |
% |
89 |
% |
||||||
Updated disclosed rate(2) |
n/a | 95 | % | 95 | % | 92 | % | 89 | % | |||||||
- (1)
- "Initially
disclosed rate" is based on cash collections and reported one quarter in arrears.
- (2)
- "Updated disclosed rate" reflects initially disclosed rate updated for subsequent cash collections.
Business Model
Under our term license model, customers purchase a license to use our software for a fixed period of time and we recognize the license revenue ratably over the length of the contract. Conversely, under a perpetual pricing model, customers purchase a license to use our software indefinitely and we recognize all license revenue at the time of sale. Although the term license model has the effect of lowering license revenues compared to a perpetual model in its early periods, we believe the term license business model increases the total potential value of our customer relationships because our customer focus, the stability of our customer base and the market acceptance of our products result in a long customer relationship. We believe that a term license business model ultimately provides more predictable revenue streams.
We continue to focus on growing our recurring revenues. Total recurring revenues, which we define as term license, perpetual maintenance, and other recurring revenues, have increased from 80% of total net revenues in 2008 to 86% in both 2009 and 2010, and we expect them to increase as a percentage of total net revenues. These recurring revenue sources provide us with increased ability to make strategic decisions to invest in our business while remaining confident that our operating results will be reasonably predictable.
In 2011, we plan to continue to invest in client support, product development, and sales and marketing. Our investment in client support will enable us to continue to improve the services we provide to our clients in their day-to-day use of our software and build a scalable organization to support our largest and most complex customers. Our investments in product development are designed to enable us to develop new products as well as maintain the pace of enhancements and upgrades to our existing products. Our investment in sales and marketing will help us expand our international presence and capitalize on new market opportunities.
While we intend to invest to support our growth, we believe our margins will grow modestly in 2011, as we view several investment opportunities, such as international expansion and build-out of our Advent On-Demand and Tamale RMS products that take precedence over near-term operating profitability. In the longer term, we believe that our mission critical products, market leadership position and our reasonably predictable term license revenue model will enable us to consistently grow operating margins.
Products and Services
Advent products are intended to automate those mission-critical functions in the investment management process that will increase operational efficiency, facilitate timely regulatory compliance, improve client reporting and enable better decision-making. Each product focuses on specific functions within an investment management organization and pricing, for the most part, is determined by size of the implementation and assets under management.
7
We offer solutions for customers in numerous markets, which include:
- •
- Advent® for Asset Managers
- •
- Advent® for Trusts, Private Client Services and Private Banking Organizations
- •
- Advent® for Hedge Funds
- •
- Advent® for Family Offices
- •
- Advent® for Funds of Funds
- •
- Advent® for Endowments and Foundations
- •
- Advent® for Wealth Managers
- •
- Advent® for Independent Advisors
- •
- Advent® for Broker Dealers
- •
- Advent® for Prime Brokers
- •
- Advent® for Fund Administrators
These solutions are comprised of various combinations of Advent software products, data integration tools and professional services all aimed at meeting our clients' critical business needs.
Software Products
- •
- Geneva® is a global portfolio
management platform designed to meet the real-time needs of global asset managers, hedge funds, prime brokers, fund administrators, private equity firms and family offices worldwide.
Geneva integrates all phases of the investment management process—portfolio management, accounting and reporting, client investor management, reconciliation and light trade capture and
risk capabilities. It delivers the industry's only "main memory" database system, offering more accurate and flexible reporting, and eliminating batch processing and time-consuming error
corrections. Geneva enables firms to grow into new markets, deliver greater operational efficiencies, enhance investor service, process high trade volumes across multiple securities, improve
compliance and security, and lower operating costs and risks.
- •
- Advent Portfolio Exchange® (APX) is a
comprehensive portfolio management solution that integrates the front-office functions of prospecting, marketing, and customer relationship management with the back-office operations of
portfolio accounting and reporting. It allows firms to manage both high-net worth and institutional clients with a full range of capabilities, including customized reporting, automated
report packaging and performance analytics. APX provides easy access to critical data and enables firms to grow their business, retain assets and deliver superior client service.
- •
- Axys® is a turnkey portfolio
management and reporting system for small to mid-size investment management organizations. Axys provides investment professionals with broad portfolio accounting functionality on a variety
of investment instruments, including equities, fixed income, mutual funds and cash. By using Axys, clients have a timely decision support tool with immediate access to portfolio holdings, asset
allocation, realized and unrealized gains and losses, actual and projected income and other valuable data including sophisticated performance measurement and flexible reporting. In addition to a
comprehensive set of standard reports, clients can easily generate fully customized reports with the assistance of Report Writer Pro which is included with the product.
- •
- Tamale RMS® (Research Management Solution) is a software solution that helps portfolio managers and analysts easily capture, access and share their research in order to manage
8
- •
- Moxy® automates and streamlines the
portfolio construction, trading and order management process for the investment management community. Moxy also provides Internet-ready electronic order routing based on the industry standard FIX
messaging protocol so that users can route trades electronically to any FIX-compliant broker, crossing networks, and various dark pools of liquidity that supports the internet or other
TCP/IP connection. Trades are executed, processed, settled and accounted for without manual intervention. Through its streamlined integration with Advent's industry-leading portfolio management
platforms, Moxy enables true internal and external straight-through-processing through various post trade interfaces and brings together mission-critical functions across investment management
organizations.
- •
- Advent Rules Manager® is a tightly
integrated solution that meets investment management firms' increasingly complex trading compliance and portfolio monitoring requirements. Advent Rules Manager is a rules-based system that enables
firms to define their trading and portfolio policies easily and accurately, and automates their control and review. Automated record keeping and easy reporting save time and eliminate the cost of
hiring additional resources. Firms can efficiently manage portfolios, trading, compliance workflow, and safeguard their client commitments. Putting policies into practice, firms strengthen their
competitive advantages and are able to attract and retain institutional clients. Advent Rules Manager helps firms record, test and compare their compliance practices against their policies,
demonstrating that their compliance programs are managed proactively.
- •
- Advent Revenue Center® provides asset
managers with a solution that automates complex billing processes, from fee creation to accounts-receivable management. This solution integrates seamlessly with Advent's proven suite and not only
reduces billing errors, but improves management's insight into the firm's revenue base. It has a rules-based billing structure approach that makes it extremely flexible in handling unique billing
structures, supporting complex workflows, forecasting the effect of fee schedule modifications and generating both client and audit/management reporting. With its flexible rules-based architecture,
firms can deliver superior customer service and increase profitably, even as their businesses grow in complexity.
- •
- Advent Partner® Featuring World
Investor is a single source solution for onshore and offshore investor accounting and servicing. It integrates with Axys, APX and Geneva. This product is specifically designed
for hedge funds, family offices, fund administrators, and accounting firms that face the complex and time-consuming task of consistently and accurately accounting for and reporting on
investor contributions and redemptions, capital gain/loss and income allocations, and management incentive fees. In addition, Advent Partner Featuring World Investor provides comprehensive economic
and tax allocation reporting and streamlines the production of US K-1 partnership tax returns.
- •
- Rex® enables reconciliation management. Rex is integrated with Axys and APX and is designed for firms that want to reconcile information stored in Axys or APX against custodial information electronically. Rex works in conjunction with Advent Custodial Data, which provides data from a firm's custodian(s).
investment ideas more effectively and document a firm's investment process. Tamale RMS creates a research workspace for portfolio managers and analysts that contains all of their research-related information, such as notes, reports, financial models, contacts, calendar appointments and essential Web sites at their fingertips. It features an open, enabling platform that allows firms to build custom workflows to integrate both quantitative and qualitative information easily. Tamale RMS is highly configurable and organizes information around the workflow of each investment professional and provides features that optimize the research process.
9
- •
- Tradex® is ideal for organizations
seeking a reliable solution for managing and distributing funds. With Tradex, an unlimited amount of funds and their associated order types are made available to client advisors, branches, agents and
the end clients. The order flow from initiation to back-office and through to the funds' administrators becomes highly automated—a process which otherwise is very labor
intensive and error prone. In addition to subscriptions and redemptions, Tradex handles fund switches, model orders, savings/pension plans, currency dealing, and fund and cash transfers. Tradex also
manages fees and sales commissions.
- •
- Advent® General Ledger Exchange
(Advent® GLX) is an easy-to-use general ledger ("GL") interface, which
enables clients to gain efficiencies through eliminating duplicate data entry. With Advent GLX, clients can import portfolio transactions and unrealized gains and losses from APX and Axys, translate
portfolio data into GL journal entries, and export directly into their ledger systems.
- •
- Advent Browser Reporting® for
Enterprise Users allows investment professionals the ability to access Axys from remote locations via the internet and run Axys reports as if they are in their own offices.
- •
- Advent Warehouse® is a data warehouse solution designed to allow investment professionals to access investment data readily and regardless of how the data was created or maintained, without impacting the performance of their high volume transaction-based Advent Office systems.
Outsourcing Services
- •
- Advent OnDemand® is the SaaS (software-as-a-service) delivery of Advent's suite of investment management solutions, which is offered with or without fully outsourced data management services. Data management services include full account aggregation, daily portfolio reconciliation, corporate actions processing and reference data management. Advent OnDemand is ideal for those firms that want to leverage Advent's solutions but want to minimize IT and operational responsibility.
Data and Data Integration Services
- •
- Advent® Custodial
Data (ACD) enables firms to retrieve and reconcile accounts efficiently through a single, standard, Advent-supported solution. ACD uses hundreds of direct-feed
interfaces to consolidate account level information from more than 1,000 custodial sources. The data can then be used for reconciliation and posting into Advent's portfolio management, accounting and
reporting systems, APX, Geneva and Axys. With efficient reconciliation, firms can maintain accurate cash and securities balances, reduce settlement risk, produce client statements earlier and ensure
compliant trading. In addition, the flexibility of ACD makes it easy to add new accounts and/or to establish relationships with new custodians, allowing firms to grow their business more cost
effectively.
- •
- Advent Corporate Actions® (ACA) is a straight-through-processing service that delivers customized, position-level corporate action reports for a broad range of action and security types, along with market effective transactions for mandatory US and Canadian equity and ADR events, including tax compliant details. Using ACA, firms can track actions from announcement through effective date, receive alerts containing revisions and processing tips and gain access to a dedicated team of corporate action specialists who assist advisory staff with processing details and the interpretation and confirmation of complex tax opinions.
10
- •
- Advent® Index Data is our subscription-based and transaction-based service and allows clients to download pricing, corporate actions and other data from third party vendors such as Financial Times/Interactive Data ("FTID").
Support and Maintenance Services
Due to the mission-critical nature of our products, almost all of our perpetual license clients purchase support and maintenance, which entitles them to technical support through Advent's Client Services group and to product upgrades as they become available. Term license customers also receive support and maintenance services as part of the term license offering. We continually upgrade and enhance our products to respond to changing market needs, evolving regulatory requirements and new technologies.
We offer a tiered support structure to meet the diverse needs of our client base. Advent's services are scalable, which means that they adapt to meet the specific needs of a firm no matter how large or small.
- •
- Advent Plus® is the foundation of our
support plans and includes the following features and benefits:
- •
- Access to the Advent Support Center to help ensure reliable system performance without interruption
- •
- Less downtime and increased employee productivity as a result of timely support response
- •
- Freedom to focus a firm's IT resources in other areas
- •
- Access to Advent product upgrades and enhancements including SEC regulatory and CFA Institute compliance updates
- •
- Advent Preferred® offers faster
response times and access to seasoned support representatives. In addition to the services of the Advent Plus plan, Advent Preferred offers:
- •
- Faster access to more experienced support representatives and incident escalation for addressing resolution of questions
and issues
- •
- Additional support hours
- •
- Migration planning sessions to help ensure smoother migrations and upgrades
- •
- Advent Pinnacle® is our most
comprehensive plan provided to all Geneva clients and provides unlimited access to our most experienced team of support representatives. In addition to the services included in Advent Preferred,
Advent Pinnacle provides:
- •
- Maximum support coverage including scheduled extended hours support
- •
- Unlimited support hours
- •
- The highest level of access to Advent product and technical experts—both in response and resolution
- •
- Features that promote continuous improvement of the client's Advent applications, including industry networking events and built-in discounts to Advent Professional Services.
Professional Services
Professional services consist of consulting, project management, implementation and integration services, custom report writing, and training. Many of Advent's clients purchase professional services from us to support their implementations, assist in the conversion of their historical data and provide
11
ongoing training and education. Professional services may be required for as little as a few days or up to several months for large implementations. We believe that these services facilitate a client's early success with our products, strengthen the client relationship and generate valuable feedback for our product development group.
In 2010, our Investment Management Group's Client Support and Professional Services organizations achieved certification under the Service Capability and Performance (SCP) Standards for the sixth and second year, respectfully. By certifying both organizations we continue to be the only Investment Management Software provider to have achieved this status.
Alliance Program
Our Alliance Program is designed to benefit our clients and our partners. The program provides a means by which partners can develop, promote, and sell their products, services, and solutions in conjunction with our solutions. Advent's Alliance Program was created to further extend our product and service offerings.
Sales and Marketing
We primarily license and sell Advent products and services through four sales groups, which are organized by product and customer type. The sales groups include a direct sales organization (comprised of both field sales and telesales representatives) as well as product marketing and product management groups, which are responsible for assessing market opportunities and collaborating with our product development organization on product planning and management. Product marketing coordinates our market validation process, through which we interview existing clients and sales prospects, and gather information to define scope, features and functionality of new products and product upgrades. The sales groups are as follows:
- •
- Global Accounts, selling solutions based on Geneva, Advent Partner and
Advent Custodial Data as well as associated products and services, into the prime broker, hedge fund, fund administrator and global asset management markets;
- •
- Investment Management Group, selling solutions based on APX, Axys, Moxy,
Advent Revenue Center, Advent Rules Manager, Advent Custodial Data, Advent Corporate Actions, Advent OnDemand and associated products and services to asset management firms, wealth management firms,
banks and trusts, hedge funds, family offices and financial advisors;
- •
- Tamale, selling the
Tamale® RMS solution to investment professionals at hedge funds, endowments, funds of funds, asset management firms, pension funds,
endowments and private equity firms to manage their workflow and research process; and
- •
- International, selling solutions from across the entire Advent product portfolio to investment management firms of every profile outside of the US.
We have sales and support offices throughout the world, including San Francisco, New York, Boston, London, Oslo, Copenhagen, Stockholm, Amsterdam, Zurich, Dubai, Hong Kong, Beijing and Singapore.
Our corporate marketing organization is responsible for providing support to the Company through lead generation activities, brand support, sales and marketing materials, and the provision of marketing events, such as conferences and seminars.
Product Development
In fiscal 2010, 2009 and 2008, our product development expenses were $51.4 million, $48.4 million and $42.9 million, respectively. We also capitalized $2.2 million, $3.0 million and $2.5 million of
12
software development costs in 2010, 2009 and 2008, respectively. Our product development organization builds product enhancements and new products, incorporates new technologies into existing products and sustains the quality of our current products. Our product development activities include the identification and validation of product specifications as well as engineering, quality assurance and documentation.
Our new products and product upgrades require varying degrees of development time, depending upon the complexity of the accounting requirements and securities regulations which they are intended to address, as well as the number and type of features incorporated. To date, we have generally relied upon internal development for our products. We have in the past acquired, and may again in the future acquire, additional technologies or products from third parties. For example, in October 2008, we acquired Tamale Software, a provider of research management software which helps investment professionals manage their workflow and research process and in March 2010, we acquired Goya AS to allow us to provide transfer agency-related solutions to mutual fund managers and mutual fund distributors. We intend to continue to support industry standard operating environments, architectures and network protocols.
Unfilled License Orders, Deferred Revenues and Backlog
Unfilled license orders represent license orders that have been received from our customers for the license of our software products but have not been shipped as of the end of the applicable fiscal period. Our customers generally do not cancel orders for our software products; however, we do not believe that unfilled license orders are a consistent or reliable indicator of future results. Unfilled license orders as of December 31, 2010 and 2009 totaled $2.6 million and $1.2 million, respectively.
Total deferred revenue includes deferred perpetual license, term license, maintenance, outsourcing, data services and professional services. Deferred perpetual license revenue is recognized when a contingency, such as a future product deliverable committed in the contract, is removed. Deferred term license revenue is generally recognized over the contract length. Deferred maintenance revenue is generally recognized over the service period, which is typically twelve months. Deferred professional services revenue is either recognized over the period the specific services are rendered, or over the related contract period when sold in conjunction with a multi-year term license.
In 2009, we substantially completed our transition to selling mostly term licenses. We believe that the move to a term license model increases the value over the long-term of each customer relationship and improves the predictability of our revenues. We generally recognize revenue from term licenses ratably over the period of the contract term which varies from one to five years but is typically three years. For these term contracts, we invoice the customer annually in advance. As a result, the first year's contract value is included in deferred revenue while subsequent years of the contracted value are not (unless the subsequent years are prepaid by the client, which is typically not the case). During the subsequent years, annual term billing results in an increase in deferred revenues at the commencement of each annual billing period. Total deferred revenues were $154.2 million and $146.1million at December 31, 2010 and 2009, respectively.
We define backlog as the value of multi-year term license, outsourcing and data service contracts which contain a binding commitment for the full contract term, less any amounts from those contracts already invoiced. We exclude annual contracts from the backlog calculation since they contain annual renewal options (for example, annual term licenses, annual maintenance or data reconciliation contracts). Our total backlog was approximately $126.6 million and $100.4 million as of December 31, 2010 and 2009, respectively.
For additional information regarding factors that affect the timing of the recognition of software license revenue, see "Management's Discussion and Analysis of Financial Condition and Results of Operations—Critical Accounting Policies and Estimates—Revenue Recognition."
13
Competition
The market for investment management software is characterized by the relative size of the organizations that manage and advise on investment portfolios. The market is competitive and highly fragmented. It is subject to rapid change and is sensitive to new product introductions and marketing efforts by industry participants. Competitors vary in size, scope of services offered and platforms supported. Our largest single source of competition is from proprietary systems used by our existing and potential clients, some of whom develop their own software for their particular needs and therefore may be reluctant to license software products offered by third party vendors such as Advent. We also face significant competition from other providers of software and related services as well as providers of outsourced services such as Charles River Development, the Checkfree APL subsidiary of Fiserv, DST International, the Eagle Investment Systems subsidiary of Bank of New York/Mellon Financial Corporation, the Eze Castle Software subsidiary of BNY ConvergEx Group, FT Interactive Data, the IBSI division of SunGard, INDATA, the LatentZero division of Fidessa group plc, Linedata Services, the Macgregor division of Investment Technology Group, the PORTIA division of Thomson Financial, Schwab Performance Technologies, SimCorp A/S and SS&C Technologies. Many of our largest competitors have longer operating histories and greater financial, technical, sales and marketing resources than we do, due, in part to a wave of consolidation that has occurred in our markets. Since 2005, many of our competitors have been acquired by larger enterprises, and it is possible that even larger competitors will be created through additional acquisitions of companies and technologies. We believe that Advent competes effectively in terms of the most predominant competitive differentiators, which include product performance and functionality, ease of use, scalability, ability to integrate external data sources, product and company reputation, client service and price.
Intellectual Property and Other Proprietary Rights
Our success depends significantly upon our proprietary technology. We currently rely on a combination of copyright, trademark, patent and trade secret law, as well confidentiality procedures and contractual provisions to protect our proprietary rights. We have registered trademarks and copyrights for many of our products and services and will continue to evaluate the registration of additional trademarks and copyrights as appropriate. We generally enter into confidentiality agreements with our employees, customers, resellers, vendors and others. We seek to protect our software, documentation and other written materials under trade secret and copyright laws. We also have three issued patents. While we do not believe we are dependent on any one of our intellectual property rights, we do rely on the combination of intellectual property rights and other measures to protect our proprietary rights. Despite these efforts, existing intellectual property laws may afford only limited protection. In addition, it may be possible for unauthorized third parties to copy certain portions of our products or to reverse engineer or otherwise obtain and use our proprietary information. In addition, we cannot be certain that others will not develop or acquire substantially equivalent or superseding proprietary technology, equivalent or better products will not be marketed in competition with our products, or others may not design around any patent that we have or that may be issued to us or other intellectual property rights of ours, thereby substantially reducing the value of our proprietary rights. We cannot be sure that we will develop proprietary products or technologies that are patentable, that any patent, if issued, would provide us with any competitive advantages or would not be challenged by third parties, or that the patents of others will not adversely affect our ability to do business. Despite our efforts to protect our proprietary rights, unauthorized parties may attempt to copy aspects of our products or to obtain and use information that we regard as proprietary. In addition, the laws of some foreign countries do not protect proprietary rights to as great an extent as do the laws of the United States. Litigation may be necessary to protect our proprietary technology which may be time-consuming and expensive, with no assurance of success. As a result, we cannot be sure that our means of protecting our proprietary rights will be adequate.
14
Employees
As of December 31, 2010, we had 1,051 employees, including approximately 400 in client services and support, 203 in sales and marketing, 287 in product development and 161 in general and administration. Of these employees, 852 were located in the United States and 199 were based internationally. We endeavor to maintain competitive compensation, benefits, equity participation and work environment policies in order to attract and retain qualified personnel. None of our employees are represented by a labor union. We have not experienced any work stoppages and we believe our employee relations are good.
Executive Officers of Registrant
The following sets forth certain information regarding the executive officers of the Company as of March 1, 2011:
Name
|
Age | Position | |||
|---|---|---|---|---|---|
| Stephanie G. DiMarco | 53 | Chief Executive Officer | |||
| David Peter F. Hess Jr. | 40 | President | |||
| Lily S. Chang | 62 | Executive Vice President and Chief Technology Officer | |||
| John P. Brennan | 54 | Senior Vice President, Human Resources and Facilities | |||
| James S. Cox | 39 | Senior Vice President and Chief Financial Officer | |||
Ms. DiMarco founded Advent in June 1983. She served as Chairman of the Board from November 1995 until December 2003. Ms. DiMarco currently serves as Chief Executive Officer since her appointment to the position in December 2003, after serving on an interim basis from May 2003. Ms. DiMarco also served as Chief Financial Officer from December 2008 to September 2009, after serving on an interim basis from July 2008. Previously, she had served as President from June 1983 to April 1997 and again from May 2003 to December 2008, and as Chief Executive Officer from June 1983 to November 1999. She is a former member of the Board of Trustees of the UC Berkeley Foundation, serves on the Advisory Board of the College of Engineering at the University of California, Berkeley, and is a San Francisco Foundation board member and Chairman of its Investment Committee and former member of the Audit Committee. Ms. DiMarco holds a B.S. in Business Administration from the University of California at Berkeley.
Mr. Hess joined Advent in 1994. He was appointed as President of Advent in December 2008. Mr. Hess is responsible for the worldwide marketing, sales and services for the Company's Investment Management, Global Accounts, Straight-Through-Processing (STP) and Tamale Research Management groups as well as the Company's international operations. From February 2007 to December 2008, Mr. Hess served as Executive Vice President and General Manager of Advent's Investment Management Group. From May 2004 to February 2007, Mr. Hess served as Executive Vice President and General Manager of our Global Accounts group. In this role, Mr. Hess had global responsibility for strategy, product marketing, sales, services, and support of Advent solutions for the asset management industry's largest firms. Mr. Hess has held a variety of other positions in the company including Vice President of Sales and Vice President of Marketing. Mr. Hess holds a B.A. from Princeton University.
Ms. Chang joined Advent in May 1993 as Vice President, Technology. In April 1997, Ms. Chang was promoted to Executive Vice President, Technology and was also named Chief Technology Officer. From July 1989 to May 1993, Ms. Chang held various positions, including Vice President, Strategic Accounts and Vice President of Oracle Financial Applications, for Oracle Corporation. Ms. Chang holds a B.S. in Biochemistry from Taiwan University.
Mr. Brennan joined Advent in March 2004 as Vice President of Human Resources and is responsible for all aspects of Human Resources and facilities and real estate management. In February
15
2009, Mr. Brennan was promoted to Senior Vice President. Prior to joining Advent, Mr. Brennan was Vice President of Human Resources from 1999 to 2004 for Wind River Systems. Prior to Wind River, Mr. Brennan held various positions at Visa International from 1991 to 1999. Mr. Brennan began his human resources career with assignments at Westinghouse Electric Company and Pacific Gas and Electric. Mr. Brennan also serves as the current Chairman of the Board of Goodwill Industries of the Greater East Bay. Mr. Brennan has a master's degree in Industrial and Labor Relations from Cornell University, and a bachelor's degree in English Literature and Music from Hamilton College.
Mr. Cox joined Advent in June 2006. He was appointed Senior Vice President and Chief Financial Officer in September 2009. Mr. Cox is responsible for the oversight of the Company's financial functions. From July 2008 to September 2009, Mr. Cox served as Vice President and Principal Accounting Officer, and served as Corporate Controller from June 2006 to July 2008. Prior to joining Advent, Mr. Cox served as Assistant Controller of UTStarcom from 2004 to 2006. From 1994 to 2004, Mr. Cox held various positions at PricewaterhouseCoopers, LLP. Mr. Cox holds a B.A. in Economics from Ohio University.
Investors should carefully consider the risks described below before making an investment decision. The trading price of our common stock could decline due to any of, but are not limited to, these risks. In assessing these risks, investors should also refer to the other information contained or incorporated by reference in this Annual Report on Form 10-K filed with the SEC, including our consolidated financial statements and related notes thereto.
If our existing customers do not renew their term license, perpetual maintenance or other recurring contracts, our business will suffer.
Total recurring revenues, which we define as term license, perpetual maintenance, and other recurring revenues, represented 86%, 86% and 80% of total net revenues during 2010, 2009 and 2008, respectively. We expect to continue to derive a significant portion of our revenue from our clients' renewal of term license, perpetual maintenance and other recurring contracts and such renewals are critical to our future success. Some factors that may affect the renewal rate of our contracts include:
- •
- The impact of the economic environment and market volatility on our clients and prospects;
- •
- The impact of customers consolidating or going out of business;
- •
- The price, performance and functionality of our solutions;
- •
- The availability, price, performance and functionality of competing products and services;
- •
- The effectiveness of our maintenance and support services; and
- •
- Our ability to develop complementary products and services.
Most of our perpetual license customers have historically renewed their annual maintenance although our customers have no obligation to renew such maintenance after the first year of their license agreements. In addition, our customers may select maintenance levels less advantageous to us upon renewal, which may reduce recurring revenue from these customers. Market downturns, such as the downturn beginning in the fall of 2008, caused, and may in the future cause, some clients not to renew their maintenance or reduce their level of maintenance, which affects our renewal rates and revenue. Our renewal rates are based on cash collections and are disclosed one quarter in arrears. Our reported renewal rates may fluctuate. For example, our renewal rates for our quarterly periods of 2009 and first three quarters of 2010 were below the levels we disclosed for our corresponding quarterly periods of 2008, while the rates for the first three quarters of 2010 exceeded the previous corresponding 2009 periods. The decreases in renewal rates reflect reduced maintenance expenditures,
16
customer attrition, and reductions in products licensed or number of users by clients, as well as from slower payments received from renewal clients.
Since we commenced renewing term license contracts in the third quarter of 2007, we have limited experience with renewals of our term license contracts. These were the first three-year term license contracts to be renewed by Advent since our transition to a term pricing model began. Our customers have no obligation to renew their term license contracts and given the smaller number of term license contracts subject to renewal that were renewed in the second half of 2007 through the first three quarters of 2010, we cannot yet conclude whether customers will renew at a rate consistent with our perpetual maintenance customers. Additionally, we cannot predict whether the renewals will be less advantageous to us than the original term contract. For example, the renewal periods for our term license contracts are typically shorter than our original term license contract and customers may request a reduction in the number of users or products licensed, resulting in a lower annual term license fee. Further, customers may elect to not renew their term license contracts at all. We may incur significantly more costs in securing our term license contract renewals than we incur for our perpetual maintenance renewals. If our term license contract customers renew under terms less favorable to us or choose not to renew their contracts, or if it costs significantly more to secure a renewal for us, our operating results may be harmed.
Our sales cycle is long and we have limited ability to forecast the timing and amount of specific sales and the timing of specific implementations.
The purchase of our software products often requires prospective customers to provide significant executive-level sponsorship and to make major systems architecture decisions. As a result, we must generally engage in relatively lengthy sales and contracting efforts. Sales transactions may therefore be delayed during the customer decision process because we must provide a significant level of education to prospective customers regarding the use and benefit of our products. Our business and prospects are subject to uncertainties in the financial markets that can cause customers to remain cautious about capital and information technology expenditures, particularly in uncertain economic environments, or to decrease their information technology budgets as an expense reduction measure. The sales cycle associated with the purchase of our solutions is typically between two and twelve months depending upon the size of the client, and is subject to a number of significant risks that have impacted our sales and over which we have little or no control, including broader financial market volatility, adverse economic conditions, customers' budgeting constraints, internal selection procedures, and changes in customer personnel, among others.
As a result of a lengthy and unpredictable sales cycle, we have limited ability to forecast the timing and amount of specific perpetual license sales, or term license and Advent OnDemand sales which we report quarterly as annual contract value (ACV). The timing of large individual license sales is especially difficult to forecast, and we may not be successful in closing large license transactions on a timely basis or at all. Customers may postpone their purchases of our existing products or product enhancements in advance of the anticipated introduction of new products or product enhancements by us or our competitors. Accordingly, our level of ACV bookings and perpetual license revenue in any particular period is subject to significant fluctuation. For example, during fiscal 2009, our ACV bookings and perpetual license revenue decreased by 9% and 33%, respectively, compared to fiscal 2008. During 2010, our ACV bookings and perpetual license revenue increased by 25% and 5%, respectively, compared to 2009.
When a customer purchases a term license together with implementation services, we do not recognize any revenue under the contract until the implementation services are substantially complete. The timing of large implementations is difficult to forecast. Customers may delay or postpone the timing of their particular projects due to the availability of resources or other customer specific priorities. If we are not able to complete an implementation project for a term license in a quarter, it will cause us to defer all of the proportionate contract revenues to a subsequent quarter. Because our expenses are relatively fixed in the near term, any shortfall from anticipated revenues could result in a significant variation in our operating results from quarter to quarter.
17
Our current operating results may not be reflective of our future financial performance.
During 2010, 2009 and 2008, we recognized 86%, 86% and 80%, respectively, of total net revenues from recurring sources. We generally recognize revenue from these sources ratably over the terms of these agreements, which typically range from one to three years. As a result, almost all of our revenues in any quarter are generated from contracts entered into during previous periods.
Consequently, a significant decline in new business generated in any quarter may not materially affect our results of operations in that quarter but will have an impact on our revenue growth rate in future quarters. Additionally, a decline in renewals of term agreements, maintenance or data and other subscription contracts during a quarter will not be fully reflected in our financial performance in that quarter. For example, because we recognize revenue ratably, the non-renewal of term agreements or maintenance contracts late in a quarter may have very little impact on revenue for that quarter, but will reduce revenue in future quarters. In addition, we may be unable to adjust our costs in response to reduced revenue.
Further, because of the large percentage of revenue from recurring sources in our term license business model, our historical operating results on a generally accepted accounting principles (GAAP) basis will not necessarily be the sole or most relevant factor in predicting our future operating results. Accordingly, we report certain non-GAAP or operational information, including our quarterly bookings metrics (expressed as ACV) and maintenance renewal rates, that is intended to provide investors with certain of the information that management uses as a basis for planning and forecasting of future periods. However, we believe that undue reliance should not be placed upon non-GAAP or operating information because this information is neither standardized across companies nor subjected to the same control activities and audit procedures that produce our GAAP financial results.
Uncertain economic and financial market conditions adversely affect our business.
The market for investment management software systems has been and may in the future be negatively affected by a number of factors, including reductions in capital expenditures by customers and volatile performance of major financial markets. For example, the market downturn and fluctuations arising in fall 2008, dissolution and acquisitions of our clients and prospects, the decline in Assets Under Administration (AUA) or Assets Under Management (AUM) as a result of significant declines in asset values of our clients and the accompanying market uncertainty affected both our ability to sell our solutions and the amount of revenue we received from such sales. We experienced some clients and prospects delaying or cancelling additional license purchases and others went out of business, reduced personnel, or were acquired, which we expect to experience should the financial markets face future hardship. The target clients for our products include a range of financial services organizations that manage investment portfolios. The success of many of our clients is intrinsically linked to the health of the financial markets. The demand for our solutions has been and continues to be disproportionately affected by fluctuations, disruptions, instability and downturns in the economy and financial services industry, which may cause clients and potential clients to exit the industry or delay, cancel or reduce any planned expenditures for investment management systems and software products.
In addition, the failure of existing investment firms or the slowdown in the formation of new investment firms could cause a decline in demand for our solutions. Consolidation of financial services firms and other clients will result in reduced technology expenditures or acquired customers using the acquirer's own proprietary software and services solutions or the solutions of another vendor. In some circumstances where both acquisition parties are customers of Advent, the combined entity may require fewer Advent products and services than each individually licensed, thus reducing our revenue. Challenging economic conditions may also cause our customers to experience difficulty with gaining timely access to sufficient credit or our customers may become unable to pay for the products or
18
services they have purchased, which could result in their inability to fulfill or make timely payments to us. If that were to occur, our ability to collect receivables would be negatively affected, and our reserves for doubtful accounts and write-offs of accounts receivable may increase.
We have in the past experienced a number of market downturns in the financial services industry and resulting declines in information technology spending, which has caused longer sales and contracting cycles, deferral or delay of information technology projects and generally reduced expenditures for software and related services. The severity of the market downturn and volatility and uncertainty in the financial markets and the financial services sector in the last several years makes it difficult for us to forecast operating results and may result in a material adverse effect on our revenues and results of operations in the longer term.
The market downturn beginning in fall 2008 caused, and other downturns in the future may cause clients not to renew their term licenses or perpetual license maintenance. Also, significant declines in market value of our clients affect their Assets Under Administration (AUA) or Assets Under Management (AUM). Consequently, we may also experience a decline in the ACV of bookings since the pricing of some of our products is based upon our client's AUA or AUM. Furthermore, we have some contracts for which clients pay us fees based on the greater of a negotiated annual minimum fee or a calculated fee that is determined by the client's AUA or AUM. If a client previously paid us based on the calculated fee, rather than the annual minimum fee, we would experience a decline in revenue as a result of any decline in those clients' AUA or AUM.
We operate in a highly competitive industry.
The market for investment management software is competitive and highly fragmented, is subject to rapid change and is sensitive to new product introductions and marketing efforts by industry participants. Our largest single source of competition is from proprietary systems used by existing and potential clients, many of whom develop their own software for their particular needs and therefore may be reluctant to license software products offered by third party vendors such as Advent. We also face significant competition from other providers of software and related services as well as providers of outsourced services. Many of our competitors have longer operating histories and greater financial, technical, sales and marketing resources than we do. In addition, consolidation has occurred among some of the competitors in our markets. Competitors vary in size, scope of services offered and platforms supported. In recent years, many of our competitors have merged with each other or with other larger third parties, and it is possible that even larger companies will emerge through additional acquisitions of companies and technologies. Consolidation among our competitors may result in stronger competitors in our markets and may therefore either result in a loss of market share or harm our results of operations. In addition, we also face competition from potential new entrants into our markets that may develop innovative technologies or business models. Furthermore, competitors may respond to weak market conditions by lowering prices, offering better contractual terms and attempting to lure away our customers and prospects with lower cost solutions. We cannot guarantee that we will be able to compete successfully against current and future competitors or that competitive pressure will not result in price reductions, reduced operating margins or loss of market share, any one of which could seriously harm our business. We must continue to introduce new products and product enhancements.
The market for our products is characterized by rapid technological change, changes in customer demands, evolving industry standards and new regulatory requirements. New products based on recent technologies or new industry standards can render existing products obsolete and unmarketable. As a result, our future success will continue to depend upon our ability to develop new products or product enhancements that address the future needs of our target markets and respond to their changing standards and practices. We continue to release numerous products and product upgrades and we believe our future success depends on continuing such releases. Additionally, in October 2008, we
19
acquired Tamale Software which enables us to offer a new product in the nascent research management field and in March 2010, Advent Norway AS acquired Goya AS to allow us to provide transfer agency-related solutions to mutual fund managers and mutual fund distributors. However, it is too early to know whether these products will meet anticipated sales or will be broadly accepted in the market, that a market will develop as expected for these new products or that we will continue to introduce more products.
We may not be successful in developing, introducing, marketing and licensing our new products or product enhancements on a timely and cost effective basis, or at all, and our new products and product enhancements may not adequately meet the requirements of the marketplace or achieve market acceptance. Delays in the commencement of commercial shipments of new products or enhancements or delays in client implementations or migrations may result in client dissatisfaction and delay or loss of product revenues. Additionally, existing clients may be reluctant to go through the process of migrating from our Axys product to our APX product, which may slow the migration of our customer base to APX. In addition, clients may delay purchases in anticipation of new products or product enhancements. Our ability to develop new products and product enhancements is also dependent upon the products of other software vendors, including certain system software vendors, such as Microsoft Corporation, database vendors and development tool vendors. If the products of such vendors have design defects or flaws, are unexpectedly delayed in their introduction, are unavailable on acceptable terms, or the vendors exit the business, our business could be seriously harmed.
We depend heavily on our Axys®, Geneva®, APX and Moxy® products.
We derive a majority of our net revenues from the license and maintenance revenues from our Axys, Geneva, APX and Moxy products. In addition, Moxy and many of our applications, such as Partner and various data services, have been designed to provide an integrated solution with Axys, Geneva and APX. As a result, we believe that for the foreseeable future a majority of our net revenues will depend upon continued market acceptance of Axys, Geneva, APX, and Moxy, and upgrades to those products. This is particularly true as a result of our divestiture of our MicroEdge grants management products, which further concentrates our revenue streams.
Our operating results may fluctuate significantly.
Revenues from recurring sources have grown from 80% in 2008, to 86% in both 2009 and 2010, respectively. During 2010 and 2009, term license revenues comprised approximately 44% of term license, maintenance and other recurring revenues as compared to approximately 35% in fiscal 2008. Term license contracts are comprised of both software licenses and maintenance services. Individual perpetual software licenses vary significantly in value, and the value and timing of these transactions can therefore cause our quarterly perpetual license revenues to fluctuate. As we continue to sign term license agreements for new customers, grow our subscription, data management and outsourced services revenues, and our customers renew their perpetual maintenance, we expect our revenue from recurring sources to continue to increase slightly as a percent of net revenues.
When a customer purchases a term license together with implementation services, we do not recognize any revenue under the contract until the implementation services are substantially completed and then we recognize revenue ratably over the remaining length of the contract. If the implementation services are still in progress as of quarter-end, we will defer all of the contract revenues to a subsequent quarter. At the point professional services are substantially completed, we recognize a pro-rata amount of the term license revenue, professional services fees earned and related expenses, based on the elapsed time from the start of the term license to the substantial completion of professional services. During 2009, the revenue recognized from completed implementations exceeded the revenue deferred from projects being implemented, resulting in a net recognition of revenue of $6.1 million for fiscal 2009, composed of $3.5 million of term license revenue and $2.6 million of
20
professional services revenue. Subsequently in 2010, we returned to our prior trend of net term license revenue deferral. In future periods, our revenues related to completed implementations may vary depending on the number of projects that reach substantial completion during the quarter. Term license revenue for the remaining contract years and the remaining deferred professional services revenue and related expenses are recognized ratably over the remaining contract length. The term license component of the deferred revenue balance will increase or decrease in the future depending on the amount of new term license bookings relative to the number of implementations that reach substantial completion in a particular quarter. Although our substantial revenue from recurring sources under our term license model provides us with longer term stability and more visibility in the short term, our quarterly net revenues and operating results may still fluctuate significantly depending on these and other factors. Our expense levels are relatively fixed in the short-term. Due to the fixed nature of these expenses, combined with the relatively high gross margin historically achieved on our products, an unanticipated decline in net revenues in any particular quarter may adversely affect our operating results.
In addition, we experience seasonality in our licensing. We believe that this seasonality results primarily from customer budgeting cycles and expect this seasonality to continue in the future. The fourth quarter of the year typically has more licensing activity. That can result in term license bookings and perpetual license fee revenue being the highest in the fourth quarter, followed by lower term license bookings and perpetual license revenue in the first quarter of the following year. This seasonality has been, and may be in the future, adversely affected by market downturns and uncertain economic conditions. Also, term licenses entered into during a quarter may not result in recognition of associated revenue until later quarters, as we begin recognizing revenue for such licenses when the related implementation services are substantially complete. In addition, we may incur commission and bonus expenses in the period in which we enter into a license, but not recognize the associated revenue until later periods.
Because of the above factors, we believe that quarter-to-quarter comparisons of our operating results are not necessarily reliable indicators of future performance.
Our stock price may fluctuate significantly.
Like many other companies, our stock price has been subject to wide fluctuations in recent quarters as a result of market volatility. If net revenues or earnings in any quarter or our financial guidance for future periods fail to meet the investment community's expectations, our stock price is likely to decline. Even if our revenues or earnings meet or exceed expectations, our stock price is subject to decline in periods of high market volatility because our stock price is affected by trends in the financial services sector and by broader market trends unrelated to our performance. Unfavorable or uncertain economic and market conditions, which can be caused by many factors, including declines in economic growth, business activity or investor or business confidence; limitation on the availability or increases in the cost of credit or capital; increases in inflation, interest rates, exchange rate volatility, default rates or the price of basic commodities; corporate, political or other scandals that reduce investor confidence in capital markets; outbreaks of hostilities or other geopolitical instability; natural disasters or pandemics; or a combination of these or other factors, have adversely affected, and may in the future adversely affect, our business, profitability and stock price.
If our relationship with Financial Times/Interactive Data is terminated, our business may be harmed.
Many of our clients use our proprietary interface to retrieve pricing and other data electronically from Financial Times/Interactive Data ("FTID"). FTID pays us a commission which we classify as other recurring revenues. The commission is based on their revenues from providing this data to our clients. Our software products have been customized to be compatible with their system and our software would need to be redesigned to operate with additional alternative data vendors if FTID's
21
services were unavailable for any reason. Non-renewal of our current agreement with FTID would require at least two years' prior notice by either us or them and the agreement may be terminated upon 90 days' advance notice for an uncured material breach of the other party. While we have contracts with other data vendors for substantially similar financial data with which our products can be used, if our relationship with FTID was terminated or their services were unavailable to clients for any reason, we cannot be certain that we could enter into contracts with additional alternative data providers, or that other relationships would provide similar commission rates to us or if the amount of data used by our clients would remain the same, and our operating results could suffer or our resources could be constrained from the costs of redesigning our software.
If our large subscription-based clients or if our revenue sharing relationships are terminated, our business may be harmed.
In recent years, Advent has periodically entered into contracts relating to our subscription, data management revenue streams and outsourced services with contract values that are substantially larger than we have customarily entered into in the past, including our agreement with TIAA-CREF. We do not know whether we will be able to continue to sign large recurring revenue contracts of this nature or if such clients will renew their contracts at similar rates, if at all. Some of these agreements are subject to milestones, acceptance and penalties and there is no assurance that these agreements will be fully implemented. In addition, we have revenue sharing agreements with other companies that provide revenue to Advent for our clients' use of those companies' services and products. Our operating results could be adversely impacted if these agreements are not fully implemented, terminated or not renewed, or if we are unable to continue to generate similar opportunities and enter similar or larger sized contracts in the future.
Our outsourcing and data integration services are subject to risks that may harm our business.
Our clients rely on our outsourcing and data services to meet their operational needs, including account aggregation and reconciliation. Because our services are complex, because we utilize third party data and other vendors, and because our clients use our services in a variety of ways, our services may have undetected errors or defects, service disruptions, delays, or incomplete or incorrect data that could result in unanticipated downtime for our customers, failure to meet service levels and service disruptions. In addition, our security measures could be breached or unauthorized access to our information or our customers' information could occur. Such potential errors, defects, delays, disruptions or other performance problems may damage our clients' business, harm our reputation, result in losing future sales, cause clients to withhold payment or terminate or not renew their agreements with us, and subject us to litigation and other possible liabilities.
We must recruit and retain key employees.
We believe that our future success is dependent on the continued employment of our senior management and our ability to identify, attract, motivate and retain qualified technical, sales and other personnel. Members of our executive management team have acquired specialized knowledge and skills with respect to Advent. We need technical resources such as our product development engineers to develop new products and enhance existing products; we rely upon sales personnel to sell our products and services and maintain healthy business relationships; we must recruit professional service consultants to support our implementations; we must hire client services personnel to provide technical support to our growing installed base of customers; and we must attract and retain financial and accounting personnel to comply with our public company reporting requirements. We need to identify, attract, motivate and retain such employees with the requisite education, backgrounds and industry experience. However, experienced high quality personnel in the information technology industry
22
continue to be in high demand and competition for their talents remains intense, especially in the San Francisco Bay Area where the majority of our employees are located.
We have relied on our ability to grant equity compensation as one mechanism for recruiting and retaining such highly skilled personnel. In making employment decisions, particularly in the high-technology industries and San Francisco Bay Area, job candidates often consider the value of the equity awards they are to receive in connection with their employment and market downturns may result in our equity incentives becoming less valuable. Additionally, accounting regulations requiring the expensing of equity compensation impair our ability to provide these incentives without reporting significant compensation costs.
We may also choose to create additional performance and retention incentives in order to retain our employees, including the granting of additional stock options, restricted stock, restricted stock units, stock appreciation rights, performance shares or performance units to employees or issuing incentive cash bonuses. Such incentives may either dilute our existing stockholder base or result in unforeseen operating expenses, which may have a material adverse effect on our operating results, could result in our stock price falling or may not be valued as highly by our employees which may create retention issues.
We face challenges in expanding our international operations.
We market and sell our products in the United States and, to a growing extent, internationally. From 2001 through 2005, we acquired the subsidiaries of our independent distributor. In addition, we have begun to expand our sales in relatively new jurisdictions for us, such as the Middle East, Eastern Europe, and Asia. In 2006, we opened a branch office of Advent Europe Ltd. in the United Arab Emirates, and we established Advent Software (Asia) Ltd., a subsidiary of Advent Software, Inc., in Hong Kong in 2008. In addition, we established a subsidiary of Advent Software (Asia), Ltd. in Beijing, China and established Advent Software Singapore Pte. Ltd., a subsidiary of Advent Software, Inc. in April 2010. In March 2010, our wholly-owned Norwegian subsidiary, Advent Norway AS, acquired the entire share capital of Goya AS, a Norwegian software company that provides transfer agency-related solutions to mutual fund managers and mutual fund distributors. In addition, in February 2011, Advent Software, Inc. acquired Syncova Solutions, Ltd., a United Kingdom-based company that provides margin management and debt finance reconciliation and optimization software.
We cannot be certain that establishing businesses in other countries will produce the desired levels of revenues, such as in the case of our former Greek subsidiary, Advent Hellas, which produced less than satisfactory revenues and profitability before its sale by Advent in 2005. Also, worldwide volatility in financial markets may disrupt our sales efforts in overseas markets. We currently have limited experience in developing localized versions of our products and marketing and distributing our products internationally. In other instances, we may rely on the efforts and abilities of foreign business partners in such markets. For example, we previously outsourced certain engineering activities to a business partner located in China until we transitioned those contract developers to become employees of our Beijing office. In addition, international operations are subject to other inherent risks, including:
- •
- The impact of recessions and market fluctuations in economies outside the United States;
- •
- Adverse changes in foreign currency exchange rates;
- •
- Greater difficulty in accounts receivable collection and longer collection periods;
- •
- Difficulty of enforcement of contractual provisions in local jurisdictions;
- •
- Unexpected changes in foreign laws and regulatory requirements;
- •
- US and foreign trade-protection measures and export and import requirements;
23
- •
- Difficulties in successfully adapting our products to the language, regulatory and technology standards of other
countries;
- •
- Resistance of local cultures to foreign-based companies and difficulties establishing local partnerships or engaging local
resources;
- •
- Difficulties in and costs of staffing and managing foreign operations;
- •
- Reduced protection for intellectual property rights in some countries;
- •
- Foreign tax structures and potentially adverse tax consequences; and
- •
- Political and economic instability.
The revenues, expenses, assets and liabilities of our international subsidiaries are primarily denominated in local foreign currencies. Future fluctuations in currency exchange rates may adversely affect revenues and accounts receivable from international sales and the US dollar value of our foreign subsidiaries' revenues, expenses, assets and liabilities. Our international service revenues and certain license revenues from our European subsidiaries are generally denominated in local foreign currencies.
Difficulties in integrating our acquisitions and expanding into new business areas have impacted and could continue to impact our business adversely and we face risks associated with potential acquisitions, investments, divestitures and expansion.
Periodically we seek to grow through the acquisition of additional complementary businesses. In October 2008, we completed the acquisition of Tamale Software, Inc., which provides research management software. More recently in March 2010, our wholly-owned Norwegian subsidiary, Advent Norway AS, acquired the entire share capital of Goya AS, a Norwegian software company that provides transfer agency-related solutions to mutual fund managers and mutual fund distributors. In addition, in February 2011, Advent Software, Inc. acquired Syncova Solutions, Ltd., a United Kingdom-based company that provides margin management and debt finance reconciliation and optimization software.
The process of integrating our acquisitions has required and will continue to require significant resources, particularly in light of our relative inexperience in integrating acquisitions, potential regulatory requirements and operational demands. In particular, our Tamale acquisition reflects our entry into the research management software market, where we have no prior experience. Integrating these acquisitions in the past has been time-consuming, expensive and disruptive to our business. This integration process has strained our managerial resources, resulting in the diversion of these resources from our core business objectives, and may do so in the future. Failure to achieve the anticipated benefits of these acquisitions or to integrate the operations of these entities successfully has harmed and could potentially harm our business, results of operations and cash flows in future periods. The assumptions we made in determining the value and relative risks of these acquisitions could be erroneous. For example, in the first quarter of 2003, we closed our Australian subsidiary because it failed to perform at a satisfactory profit level and similarly in the fourth quarter of 2005, we disposed of our Advent Hellas subsidiary in Greece because of less than satisfactory profitability. In addition, as we have expanded into new business areas and built new offerings through strategic alliances and internal development, as well as acquisitions, some of this expansion has required significant management time and resources without generating required revenues. We have had difficulty and may continue to have difficulty creating demand for such offerings. Furthermore, we may face other unanticipated costs from our acquisitions, such as disputes involving earn-out and incentive compensation amounts.
We may make additional acquisitions of complementary companies, products or technologies in the future. In addition, we periodically evaluate the performance of all our products and services and may sell or discontinue current products, product lines or services, particularly as we focus on ways to
24
streamline our operations. For example, in October 2009, we divested our MicroEdge subsidiary. Failure to achieve the anticipated benefits of any acquisition or divestiture could harm our business, results of operations and cash flows. Furthermore, we may have to incur debt, write-off investments, infrastructure costs or other assets, incur severance liabilities, write-off impaired goodwill or other intangible assets or issue equity securities to pay for any future acquisitions. Financing may not be available to us on sufficiently advantageous terms, or at all, and we have let our credit facility with Wells Fargo Foothill lapse. The issuance of equity securities could dilute our existing stockholders' ownership. Finally, we may not identify suitable businesses to acquire or negotiate acceptable terms for future acquisitions.
If we are unable to protect our intellectual property, we may be subject to increased competition that could seriously harm our business.
Our success depends significantly upon our proprietary technology. We currently rely on a combination of copyright, trademark, patent and trade secret law, as well as confidentiality procedures and contractual provisions to protect our proprietary rights. We have registered trademarks and copyrights for many of our products and services and will continue to evaluate the registration of additional trademarks and copyrights as appropriate. We generally enter into confidentiality agreements with our employees, customers, resellers, vendors and others. We seek to protect our software, documentation and other written materials under trade secret and copyright laws. We also have three issued patents. Despite our efforts, existing intellectual property laws may afford only limited protection. It may be possible for unauthorized third parties to copy certain portions of our products or to reverse engineer or otherwise obtain and use our proprietary information. In addition, we cannot be certain that others will not develop or acquire substantially equivalent or superseding proprietary technology, equivalent or better products will not be marketed in competition with our products, or others may not design around any patent that we have or that may be issued to us or other intellectual property rights of ours, thereby substantially reducing the value of our proprietary rights. We cannot be sure that we will develop proprietary products or technologies that are patentable, that any patent, if issued, would provide us with any competitive advantages or would not be challenged by third parties, or that the patents of others will not adversely affect our ability to do business. Despite our efforts to protect our proprietary rights, unauthorized parties may attempt to copy aspects of our products or to obtain and use information that we regard as proprietary. In addition, the laws of some foreign countries do not protect proprietary rights to as great an extent as do the laws of the United States and so our expansion into international markets may expose our proprietary rights to increased risks. Litigation may be necessary to protect our proprietary technology which may be time-consuming and expensive, with no assurance of success. As a result, we cannot be sure that our means of protecting our proprietary rights will be adequate.
If we infringe the intellectual property rights of others, we may incur additional costs or be prevented from selling our products and services.
We cannot be certain that our products or services do not infringe the intellectual property rights of others. As a result, we may be subject to litigation and claims, including claims of misappropriation of trade secrets or infringement of patents, copyrights and other intellectual property rights of third parties that would be time-consuming and costly to resolve and may lead to unfavorable judgments or settlements. If we discovered that our products or services violated the intellectual property rights of third parties, we may have to make substantial changes to our products or services or obtain licenses from such third parties. We might not be able to obtain such licenses on favorable terms or at all, and we may be unable to change our products successfully or in a timely or cost-effective manner. Failure to resolve an infringement matter successfully or in a timely manner would damage our reputation and force us to incur significant costs, including payment of damages, redevelopment costs, diversion of
25
management's attention and satisfaction of indemnification obligations that we have with our clients, as well as prevent us from selling certain products or services.
Our investment portfolio may become impaired by deterioration of the capital markets.
Our cash equivalent and short-term investment portfolio as of December 31, 2010 consisted of US government and commercial debt securities. We follow an established investment policy and set of guidelines to monitor and help mitigate our exposure to interest rate and credit risk. The policy sets forth credit quality standards and limits our exposure to any one issuer, as well as our maximum exposure to various asset classes.
As a result of adverse financial market conditions, investments in some financial instruments may pose risks arising from recent market liquidity and credit concerns. As of December 31, 2010, we had no impairment charges associated with our short-term investment portfolio relating to such adverse financial market conditions. Although we believe our current investment portfolio has very little risk of material impairment, we cannot predict future market conditions or market liquidity and can provide no assurance that our investment portfolio will remain materially unimpaired. In addition, the decrease in interest rates has materially decreased the interest income we receive on our investments.
Catastrophic events could adversely affect our business.
We are a highly automated business and rely on our network infrastructure and enterprise applications, internal technology systems and our website for our development, marketing, operational, support, and sales activities. A disruption or failure of these systems in the event of major earthquake, fire, telecommunications failure, cyber-attack, terrorist attack or other catastrophic event could cause system interruptions, reputational harm, delays in our product development and loss of critical data and could affect our ability to sell and deliver products and services and other critical functions of our business. Our corporate headquarters, a significant portion of our research and development activities, our data centers and certain other critical business operations are located in the San Francisco Bay Area, which is a region of seismic activity. We have developed certain disaster recovery plans and certain backup systems to reduce the potentially adverse effect of such events, but a catastrophic event that results in the destruction or disruption of any of our data centers or our critical business or information technology systems could severely affect our ability to conduct normal business operations and, as a result, our future operating results could be adversely affected. Further, such disruptions could cause further instability in the financial markets or the spending of our clients and prospects upon which we depend.
In addition to the recent severe market conditions, other catastrophic events such as abrupt political change, terrorist acts, conflicts or wars may cause damage or disruption to the economy, financial markets and our customers. The potential for future attacks, the national and international responses to attacks or perceived threats to national security and other actual or potential conflicts, wars or political unrest, which has occurred recently in the Middle East, Egypt, Libya and Tunisia, have created many economic and political uncertainties. Although it is impossible to predict the occurrences or consequences of any such events, they could unsettle the financial markets or result in a decline in information technology spending, which could have a material adverse effect on our revenues.
Undetected errors or failures found in new products and services may result in loss of or delay in market acceptance of our products and services that could seriously harm our business.
Our products and services may contain undetected errors or scalability limitations at any point in their lives, but particularly when first introduced or as new versions are released. For example, during 2010, we released new versions of Axys, Geneva, APX and Tamale RMS. Despite testing by us and by current and potential customers, errors may not be found in new products and services until after
26
commencement of commercial shipments or use, resulting in a loss of or a delay in market acceptance, damage to our reputation, customer dissatisfaction and reductions in revenues and margins, any of which could seriously harm our business. Additionally, our agreements with customers that attempt to limit our exposure to liability claims may not be enforceable in jurisdictions where we operate, particularly as we expand into new international markets.
Two of our principal stockholders have an influence over our business affairs and may make business decisions with which you disagree and which may adversely affect the value of your investment.
Our Chief Executive Officer and the Chairman of our board of directors own or control, indirectly or directly, a substantial number of shares of our common stock (approximately 6% and 30%, respectively, as of February 28, 2011). As a result, if these parties were to act together, they would have the ability to exert significant influence on matters submitted to our stockholders for approval, such as the election or removal of directors, amendments to our certificate of incorporation or the approval of a business combination. These actions may be taken even if they are opposed by other stockholders or it may be difficult to approve these actions without their consent. This concentration of ownership may also have the effect of delaying or preventing a change of control of our company or discouraging others from making tender offers for our shares, which could prevent our stockholders from receiving a premium for their shares.
Changes in securities laws and regulations may increase our costs or may harm demand.
Most of our customers operate within a highly regulated environment. In light of the recent conditions in the US financial markets and economy, Congress and regulators have increased their focus on the regulation of the financial services industry. The information provided by, or resident in, the software or services we provide to our customers could be deemed relevant to a regulatory investigation or other governmental or private legal proceeding involving our customers, which could result in requests for information from us that could be expensive and time consuming for us. In addition, clients subject to investigations or legal proceedings may be adversely impacted possibly leading to their liquidation, bankruptcy, receivership, reductions in Assets Under Management or Assets Under Administration, or diminished operations that would adversely affect our revenues and collection of receivables.
Our customers must comply with governmental, self-regulatory organization and other rules, regulations, directives and standards. New legislation or changes in such rules, regulations, directives or standards may reduce demand for our services or increase our expenses. We develop, configure and market products and services to assist customers in meeting these requirements. New legislation, or a significant change in rules, regulations, directives or standards, could cause our services to become obsolete, reduce demand for our services or increase our expenses in order to continue providing services to clients.
The recently enacted Dodd-Frank Wall Street Reform and Protection Act of 2010 ("Dodd-Frank Act") represents a comprehensive overhaul of the financial services industry within the United States, establishes the new federal Bureau of Consumer Financial Protection (the "BCFP"), and will require the BCFP and other federal agencies to implement many new rules. While the general framework of the reforms is set forth in the Dodd-Frank Act, it provides for numerous studies and reports and the adoption and implementation of rules and regulations by regulatory agencies over the next four years to clarify and implement the Act's requirements fully.
We believe that it is too early to know the precise long-term impact on our business of the increased regulation of financial institutions. While it could lead to increased demand for Advent's products and services, demand could be negatively impacted by the deferral of purchase decisions by our customers until the new regulations have been adopted and the full impact and expense of the new
27
regulatory environment is more clearly understood. The Dodd-Frank Act contains numerous other provisions affecting financial institutions of all types, many of which may have an impact on our operating environment in substantial and unpredictable ways. Accordingly, it is difficult to predict at this time what specific impact the Dodd-Frank Act and the forthcoming implementing rules and regulations will have on our business and the financial services industry.
Additionally, as a publicly-traded company, we are subject to significant regulations including the Dodd-Frank Act and the Sarbanes-Oxley Act ("the Sarbanes-Oxley Act") of 2002. There are significant corporate governance and executive compensation-related provisions in the Dodd-Frank Act that require the SEC to adopt additional rules and regulations in these areas. Our efforts to comply with these requirements could result in an increase of our operating and compliance costs.
The Sarbanes-Oxley Act of 2002 required changes in some of our corporate governance and securities disclosure and/or compliance practices. As part of the Act's requirements, the SEC enacted new rules on a variety of subjects, and the Nasdaq Stock Market enacted new corporate governance listing requirements. These developments have increased and may in the future increase our accounting and legal compliance costs and could also expose us to additional liability if we fail to comply with these or other new rules and reporting requirements. In fiscal 2010, 2009 and 2008, we incurred approximately $0.4 million, $0.5 million and $0.8 million, respectively, in Sarbanes-Oxley related expenses consisting of external consulting costs. In addition, such developments may make retention and recruitment of qualified persons to serve on our board of directors, or as executive officers, more difficult.
Changes in, or interpretations of, accounting principles could result in unfavorable accounting charges.
We prepare our consolidated financial statements in conformity with accounting principles generally accepted in the United States of America. These principles are subject to interpretation by us, the SEC and various bodies formed to interpret and create accounting principles. A change in these principles or a change in the interpretations of these principles can have a significant effect on our reported results and may even retroactively affect previously reported transactions. Some of our accounting principles that have been or may be affected include:
- •
- Software revenue recognition;
- •
- Accounting for stock-based compensation;
- •
- Accounting for income taxes; and
- •
- Accounting for business combinations and related goodwill.
Changes in, or interpretations of, tax rules and regulations may adversely affect our effective tax rates.
We are a US based multinational company subject to tax in multiple US and foreign tax jurisdictions. Unanticipated changes in our tax rates could affect our future results of operations. Our future effective tax rates could be unfavorably affected by changes in, or interpretation of, tax rules and regulations in the jurisdictions in which we do business, by unanticipated decreases in the amount of revenue or earnings in countries with low statutory tax rates, by lapses of the availability of the US research and development tax credit, or by changes in the valuation of our deferred tax assets and liabilities.
In addition, we could be subject to examination of our income tax returns by the Internal Revenue Service and other domestic and foreign tax authorities. These examinations would be expected to focus on areas where considerable judgment is exercised by the Company. We regularly assess the likelihood of outcomes resulting from an examination to determine the adequacy of our provision for income taxes and have reserved for potential adjustments that may result from an examination. We believe
28
such estimates to be reasonable; however, there can be no assurance that the final determination of any of these examinations will not have an adverse effect on our operating results and financial position.
Security risks may harm our business.
Maintaining the security of computers, computer networks, hosted solutions and the transmission of confidential information over public networks is essential to commerce and communications, particularly in the market in which Advent operates. Efforts of others to seek unauthorized access to Advent's or its clients' information, computers and networks or introduce viruses, worms and other malicious software programs that disable or impair computers into our systems or those of our customers or other third parties, could disrupt or make our systems and services inaccessible or allow access to proprietary information and data of Advent or its clients. Advances in computer capabilities, new discoveries in the field of cryptography or other events or developments, could also result in compromises or breaches of our security systems. Our security measures may be inadequate to prevent security breaches, exposing us to a risk of data loss, financial loss, harm to reputation, business interruption, litigation and other possible liabilities, as well as possibly requiring us to expend significant capital and other resources to protect against the threat of security breaches or to alleviate problems caused by such breaches.
Potential changes in securities laws and regulations governing the investment industry's use of soft dollars may reduce our revenues.
Some of our clients utilized trading commissions ("soft dollar arrangements") to pay for software products and services. During each of fiscal 2010, 2009 and 2008, the total value of Advent products and services paid with soft dollars was approximately 3% of our total billings. Such soft dollar arrangements could be impacted by changes in the regulations governing those arrangements.
In July 2006, the SEC published an Interpretive Release that provides guidance on money managers' use of client commissions to pay for brokerage and research services under the safe harbor set forth in Section 28(e) of the Securities Exchange Act of 1934. The Interpretive Release clarifies that money managers may use client commissions ("soft dollars") to pay only for eligible brokerage and research services. Among other matters, the Interpretive Release states that eligible brokerage includes those products and services that relate to the execution of the trade from the point at which the money manager communicates with the broker-dealer for the purpose of transmitting an order for execution, through the point at which funds or securities are delivered or credited to the advised account. In addition, for potentially "mixed-use" items (such as trade order management systems) that are partly eligible and partly ineligible, the Interpretive Release states that money managers must make a reasonable allocation of client commissions in accordance with the eligible and ineligible uses of the items. Based on this guidance, our customers may change their method of paying all or a portion of certain Advent products or services from soft to hard dollars, and as a result reduce their usage of these products or services in order to avoid increasing expenses, which could cause our revenues to decrease.
If we fail to maintain an effective system of internal control, we may not be able to report our financial results accurately or our filings may not be timely. As a result, current and potential stockholders could lose confidence in our financial reporting, which would harm our business and the trading price of our stock.
Effective internal control is necessary for us to provide reliable financial reports. If we cannot provide reliable financial reports, our business and operating results could be harmed. We have in the past discovered, and may in the future discover, areas of our internal control that need improvement including control deficiencies that may constitute material weaknesses.
29
We do not expect that our internal control over financial reporting will prevent all errors or fraud. A control system, no matter how well designed and operated, can provide only reasonable, not absolute, assurance that the control system's objectives will be met. Further, the design of a control system must reflect the fact that there are resource constraints, and the benefits of controls must be considered relative to their costs. Controls can be circumvented by individual acts of some persons, by collusion of two or more people, or by management override of the controls. Over time, controls may become inadequate because changes in conditions or deterioration in the degree of compliance with policies or procedures may occur. Because of the inherent limitations in a cost-effective control system, misstatements due to error or fraud may occur and not be detected.
Any failure to implement or maintain improvements in our internal control over financial reporting, or difficulties encountered in the implementation of these improvements in our controls, could cause significant deficiencies or material weaknesses in our internal controls and consequently cause us to fail to meet our reporting obligations. Any failure to implement or maintain required new or improved internal controls could also cause investors to lose confidence in our reported financial information, which could have a negative impact on the trading price of our stock.
Item 1B. Unresolved Staff Comments
None.
30
Our principal executive offices are located in San Francisco, California. The table below summarizes the principal properties that we leased as of December 31, 2010:
| |
|
Use of Property | ||||||||||
|---|---|---|---|---|---|---|---|---|---|---|---|---|
Location
|
Approximate Square Footage |
Sales and Support |
Marketing | Product Development |
Administrative | |||||||
United States: |
||||||||||||
San Francisco, CA (2 properties)* |
196,384 | X | X | X | X | |||||||
New York, NY (2 properties)* |
37,451 | X | X | X | X | |||||||
New Rochelle, NY |
5,795 | X | X | |||||||||
Boston, MA (2 properties)* |
31,365 | X | X | X | X | |||||||
Europe and Middle East: |
||||||||||||
Copenhagen, Denmark |
3,475 | X | X | X | ||||||||
Zurich, Switzerland |
1,830 | X | ||||||||||
Oslo, Norway |
1,920 | X | X | X | ||||||||
Stavanger, Norway |
412 | X | X | |||||||||
London, United Kingdom |
3,586 | X | X | X | ||||||||
Bracknell, United Kingdom |
449 | X | ||||||||||
Stockholm, Sweden |
4,489 | X | X | X | ||||||||
Dubai, United Arab Emirates |
1,939 | X | ||||||||||
Asia: |
||||||||||||
Hong Kong, People's Republic of China |
445 | X | X | |||||||||
Beijing, People's Republic of China |
25,092 | X | X | |||||||||
Singapore |
490 | X | X | |||||||||
Total leased square footage |
315,122 | |||||||||||
- *
- As part of our restructuring activities, we have vacated properties in San Francisco, Boston and New York. Approximately 46,000 square feet of office space in these cities have been sub-leased as of December 31, 2010.
On October 1, 2009, Advent completed the sale of the Company's MicroEdge subsidiary. With the exception of the MicroEdge facilities in New York City, the leases related to MicroEdge have been transferred to the Purchaser. In connection with the sale of MicroEdge, the Company entered into a sub-lease agreement with Microedge LLC, whereby Microedge LLC will sub-lease approximately 24,000 square feet of the 29,000 square feet of office space located at 619 West 54th Street in New York, New York from the Company. MicroEdge LLC will sub-lease the premises for two years with the option to extend the sub-lease term through the end of the lease term in 2018. The sub-lease agreement became effective upon the close of sale of MicroEdge on October 1, 2009. The Company's contractual lease obligation related to this facility is not reflected in the table above.
We continue to assess our needs with respect to office space and may, in the future, vacate or add additional facilities. We believe that our current facilities are adequate for our needs in the immediate and foreseeable future.
On March 8, 2005, certain of the former shareholders of Kinexus and the shareholders' representative filed suit against Advent in the Delaware Chancery Court. The complaint alleges that Advent breached the Agreement and Plan of Merger dated as of December 31, 2001 pursuant to which
31
Advent acquired all of the outstanding shares of Kinexus due principally to the fact that no amount was paid by Advent on an earn-out of up to $115 million. The earn-out, which was payable in cash or stock at the election of Advent, was based upon Kinexus meeting certain revenue targets in both 2002 and 2003. The complaint seeks unspecified compensatory damages, an accounting and restitution for unjust enrichment. Advent advised the shareholders' representative in January 2003 that the earn-out terms had not been met in 2002 and accordingly no earn-out was payable for 2002 and would not be payable for 2003. After nearly two years of inactivity, plaintiff contacted Advent in November 2010, seeking to continue discovery in the case. Advent has filed a motion to dismiss the case for plaintiff's failure to prosecute in a timely manner and a ruling on the motion is pending. Advent disputes the plaintiffs' claims, believes that it has meritorious defenses and intends to vigorously defend this action. Management believes that any potential loss associated with this litigation is neither probable nor reasonably estimable at this time and accordingly has not accrued any amounts for any potential loss.
From time to time, we are involved in claims and legal proceedings that arise in the ordinary course of business. Based on currently available information, management does not believe that the ultimate outcome of these unresolved matters, individually or in the aggregate, is likely to have a material adverse effect on the Company's financial position or results of operations. However, litigation is subject to inherent uncertainties and our view of these matters may change in the future. Were an unfavorable outcome to occur, there exists the possibility of a material adverse impact on our financial position and results of operations for the period in which the unfavorable outcome occurs, and potentially in future periods.
Item 4. [Removed and Reserved]
None.
Item 5. Market for Registrant's Common Equity, Related Stockholder Matters and Issuer Purchases of Equity Securities
Market Information for Common Stock
Our common stock is listed on the NASDAQ Stock Market under the symbol "ADVS." The closing price of our common stock on February 28, 2011 was $29.00. The table below summarizes the range of high and low reported sales prices on the NASDAQ Stock Market for our common stock for the periods indicated.
| |
Price Range | ||||||
|---|---|---|---|---|---|---|---|
| |
High | Low | |||||
Fiscal 2009 |
|||||||
First quarter |
$ | 17.38 | $ | 9.73 | |||
Second quarter |
$ | 17.98 | $ | 14.64 | |||
Third quarter |
$ | 20.43 | $ | 15.05 | |||
Fourth quarter |
$ | 21.35 | $ | 18.60 | |||
Fiscal 2010 |
|||||||
First quarter |
$ | 22.69 | $ | 18.33 | |||
Second quarter |
$ | 24.62 | $ | 20.01 | |||
Third quarter |
$ | 26.92 | $ | 22.58 | |||
Fourth quarter |
$ | 29.13 | $ | 25.50 | |||
32
On December 13, 2010, the Company announced a two-for-one stock split effected in the form of a 100% stock dividend that was distributed on January 18, 2011. Accordingly, all share price information has been adjusted to reflect the stock split.
Stockholders
As of February 28, 2011, there were approximately 71 holders of record of our common stock. However, because many of our shares of common stock are held by brokers and other institutions on behalf of stockholders, we are unable to estimate with any level of accuracy the total number of stockholders represented by these record holders.
Dividends
We have never declared or paid any cash dividends on our common stock. We currently anticipate that we will retain future earnings to fund development and growth of our business and to repurchase our common stock, and do not anticipate paying cash dividends in the foreseeable future.
Recent Sales of Unregistered Securities
None.
Purchases of Equity Securities by the Issuer and Affiliated Purchasers
Our Board of Directors (the "Board") has approved common stock repurchase programs authorizing management to repurchase shares of the Company's common stock in the open market. The timing and actual number of shares subject to repurchase are at the discretion of management and are contingent on a number of factors, including the price of our stock, general market conditions and alternative investment opportunities. The purchases are funded from available working capital.
On October 30, 2008, Advent's Board authorized the repurchase of up to 6.0 million shares of the Company's outstanding common stock. In May 2010, Advent's Board authorized the repurchase of up to an additional 2.0 million shares of the Company's common stock. During the fourth quarter of 2010, Advent did not make any repurchases of common stock. At December 31, 2010, there remained approximately 2.3 million shares authorized by the Board for repurchase.
We have withheld shares through net share settlements during the three months ended December 31, 2010. The following tables provides a month-to-month summary of the repurchase activity upon the vesting of restricted stock units and the exercise of stock-settled stock appreciation rights under our equity compensation plan to satisfy tax and exercise withholding obligations during the three months ended December 31, 2010 (in thousands, except per share data):
Month
|
Total Number of Shares Repurchased(1) |
Average Price Per Share |
Maximum Number of Shares that May Yet Be Purchased Under the Plan |
||||||||
|---|---|---|---|---|---|---|---|---|---|---|---|
October |
11 | $ | 26.79 | — | |||||||
November |
36 | $ | 27.21 | — | |||||||
December |
5 | $ | 27.52 | — | |||||||
Total |
52 | $ | 27.15 | — | |||||||
- (1)
- These purchases represent shares cancelled when surrendered in lieu of cash payments for tax and exercise obligations due from employees. These shares were not purchased as part of a publicly announced program to purchase shares.
33
On December 13, 2010, the Company announced a two-for-one stock split effected in the form of a 100% stock dividend that was distributed on January 18, 2011. Accordingly, all share (except shares authorized) and share price information have been adjusted to reflect the stock split.
Securities Authorized for Issuance Under Equity Compensation Plans
Information regarding securities authorized for issuance under equity compensation plans is incorporated by reference from our Proxy Statement to be filed for our 2011 Annual Meeting of Stockholders.
Performance Graph
COMPARISON OF 5 YEAR CUMULATIVE TOTAL RETURN*
Among Advent Software, Inc., the S&P 500 Index
and the NASDAQ Computer & Data Processing Index
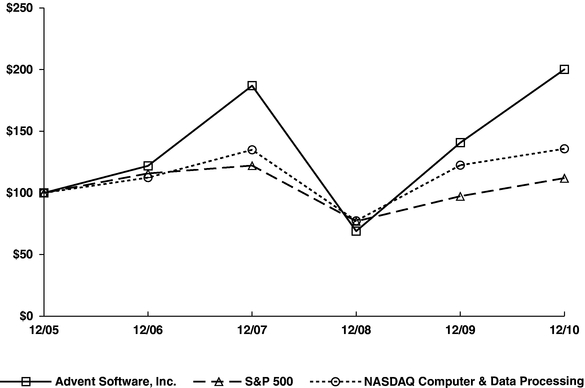
- *
- $100
invested on 12/31/05 in stock or index, including reinvestment of dividends.
Fiscal year ending December 31. - Copyright© 2011 Dow Jones & Co. All rights reserved.
34
Item 6. Selected Financial Data
The following selected financial data are derived from our consolidated financial statements. This data should be read in conjunction with the consolidated financial statements and notes thereto, and "Item 7. Management's Discussion and Analysis of Financial Condition and Results of Operations".
| |
Fiscal Years(1)(2) | |||||||||||||||||
|---|---|---|---|---|---|---|---|---|---|---|---|---|---|---|---|---|---|---|
| |
2010(3) | 2009(4) | 2008(5) | 2007(6) | 2006(7) | |||||||||||||
| |
(in thousands, except per share data) |
|||||||||||||||||
STATEMENT OF OPERATIONS |
||||||||||||||||||
Net revenues |
$ | 283,501 | $ | 259,508 | $ | 237,884 | $ | 191,570 | $ | 162,911 | ||||||||
Gross margin |
$ | 196,691 | $ | 176,963 | $ | 156,379 | $ | 129,510 | $ | 109,362 | ||||||||
Income (loss) from continuing operations |
$ | 36,305 | $ | 27,879 | $ | 17,995 | $ | 8,088 | $ | (4,168 | ) | |||||||
Net income from continuing operations |
$ | 24,319 | $ | 20,774 | $ | 17,316 | $ | 10,043 | $ | 79,142 | ||||||||
Net income (loss) from discontinued operation |
$ | (166 | ) | $ | 16,109 | $ | 1,579 | $ | 2,588 | $ | 3,460 | |||||||
Net income |
$ | 24,153 | $ | 36,883 | $ | 18,895 | $ | 12,631 | $ | 82,602 | ||||||||
Basic net income per share: |
||||||||||||||||||
Continuing operations |
$ | 0.47 | $ | 0.41 | $ | 0.33 | $ | 0.19 | $ | 1.36 | ||||||||
Discontinued operation |
$ | — | $ | 0.32 | $ | 0.03 | $ | 0.05 | $ | 0.06 | ||||||||
Total operations |
$ | 0.47 | $ | 0.72 | $ | 0.35 | $ | 0.24 | $ | 1.42 | ||||||||
Diluted net income per share: |
||||||||||||||||||
Continuing operations |
$ | 0.45 | $ | 0.39 | $ | 0.31 | $ | 0.18 | $ | 1.30 | ||||||||
Discontinued operation |
$ | — | $ | 0.30 | $ | 0.03 | $ | 0.05 | $ | 0.06 | ||||||||
Total operations |
$ | 0.44 | $ | 0.70 | $ | 0.34 | $ | 0.23 | $ | 1.35 | ||||||||
BALANCE SHEET |
||||||||||||||||||
Cash, cash equivalents and short-term marketable securities |
$ | 152,023 | $ | 89,150 | $ | 45,098 | $ | 48,809 | $ | 54,669 | ||||||||
Working capital |
$ | 45,801 | $ | (6,749 | ) | $ | (43,436 | ) | $ | (16,637 | ) | $ | 10,831 | |||||
Total assets of discontinued operation |
$ | 2,095 | $ | 2,589 | $ | 20,746 | $ | 21,242 | $ | 9,920 | ||||||||
Total assets |
$ | 490,826 | $ | 454,292 | $ | 419,594 | $ | 347,675 | $ | 335,776 | ||||||||
Long-term liabilities |
$ | 26,409 | $ | 23,963 | $ | 42,530 | $ | 17,635 | $ | 14,870 | ||||||||
Stockholders' equity |
$ | 273,848 | $ | 252,034 | $ | 195,823 | $ | 179,846 | $ | 209,627 | ||||||||
Net income per share is based on actual calculated values and totals may not sum due to rounding.
- (1)
- On
December 13, 2010, the Company announced that our Board of Directors declared a two-for-one stock split effected in the
form of a 100% stock dividend that was distributed on January 18, 2011. All per share information has been adjusted to reflect the two-for-one stock split.
- (2)
- Our
MicroEdge segment was divested on October 1, 2009. Accordingly, the results of MicroEdge have been reclassified as a discontinued operation for
all periods presented. Unless otherwise noted, selected financial data in the above table pertain to our continuing operations.
- (3)
- Our
results of operations for 2010 included stock-based compensation expense of $18.4 million, restructuring charges of $0.8 million, and the
operating results of Goya AS, subsequent to their acquisition in the first quarter of 2010.
- (4)
- Our results of operations for 2009 included stock-based compensation expense of $18.2 million, restructuring charges of $0.1 million, and a net gain on sale of private equity investments of $2.1 million. The Company has recorded an associated gain of $13.6 million resulting from the sale of MicroEdge in "net income from discontinued operation, net of applicable taxes" in its 2009 results.
35
- (5)
- Our
results of operations for 2008 included stock-based compensation expense of $16.1 million, restructuring charges of $0.1 million, acquired
in-process research and development expense of $0.4 million, a net gain on sale of private equity investments of $3.4 million, and the operating results of Tamale
Software, Inc., subsequent to their acquisition in the fourth quarter of 2008.
- (6)
- Our
results of operations for 2007 included stock-based compensation expense of $12.9 million, restructuring charges of $1.0 million, and a
net gain on sale of private equity investments of $3.7 million.
- (7)
- Our results of operations for 2006 included a benefit from income taxes of $79.5 million as a result of releasing the valuation allowance against our deferred tax assets originally recorded in fiscal 2003, stock-based employee compensation expense of $12.8 million and restructuring charges of $3.7 million.
Item 7. Management's Discussion and Analysis of Financial Condition and Results of Operations
SPECIAL NOTE REGARDING FORWARD-LOOKING STATEMENTS
You should read the following discussion in conjunction with our consolidated financial statements and related notes. The following discussion contains forward-looking statements within the meaning of Section 27A of the Securities Act of 1933 as amended and Section 21E of the Securities Exchange Act of 1934 as amended, including, but not limited to statements referencing our expectations relating to future revenues, expenses and operating margins. Forward-looking statements can be identified by the use of terminology such as "may," "will," "should," "expect," "plan," "anticipate," "believe," "estimate," "predict," "potential," "continue" or other similar terms and the negative of such terms regarding beliefs, plans, expectations or intentions regarding the future. Forward-looking statements include, among others, statements regarding the future of the investment management market and opportunities for us related thereto, future expansion, acquisition, divestment of or investment in other businesses and projections of revenues, future cost and expense levels, expected timing and amount of amortization expenses related to past acquisitions, the adequacy of resources to meet future cash requirements, estimates or predictions of actions by customers, suppliers, competitors or regulatory authorities, future client wins, future hiring and future product introductions and acceptance. Such forward-looking statements are based on our current plans and expectations and involve known and unknown risks and uncertainties which may cause our actual results or performance to be materially different from any results or performance expressed or implied by such forward-looking statements. Such factors include, but are not limited to the "Risk Factors" set forth in "Item 1A. Risk Factors" in this Form 10-K, as well as other risks identified from time to time in other Securities and Exchange Commission ("SEC") reports. You should not place undue reliance on our forward-looking statements, as they are not guarantees of future results, levels of activity or performance and represent our expectations only as of the date they are made.
Unless expressly stated or the context otherwise requires, the terms "we", "our", "us", the "Company" and "Advent" refer to Advent Software, Inc. and its subsidiaries.
Overview
We offer integrated software products and services for automating and integrating data and work flows across the investment management organization, as well as between the investment management organization and external parties. Our products are intended to increase operational efficiency, improve the accuracy of client information and enable better decision-making. Each solution focuses on specific mission-critical functions of the front, middle and back offices of investment management organizations and is designed to meet the needs of the particular client, as determined by size, assets under management and complexity of their investment process. On October 1, 2009, we completed the sale of our MicroEdge, Inc. subsidiary as further described below. The results of MicroEdge have been
36
reclassified as a discontinued operation for all periods presented. Unless otherwise noted, discussion in this document pertains to our continuing operations. See Notes 1 and 4 of Notes to Consolidated Financial Statements.
Current Economic Environment
During 2010, our business continued to benefit from an improved economic environment which began during the last half of 2009. For example, we grew bookings, revenues and renewal rates during 2010 as compared to 2009. We maintain our expectations of an improved demand environment for 2011, and are expecting to grow revenues by 8% to 11% in fiscal 2011 as a result of recent booking activity from the prior 12 months and our improved renewal rates. As the current economic situation evolves, we will continue to evaluate its impact on our business and we will remain focused on delivering innovative solutions for our customers. We remain positive about our market position, current product portfolio and future product pipeline. We intend to remain focused on executing in the areas we can influence by continuing to provide high value products while managing our expenses and headcount growth.
We believe we are well positioned to maintain our competitive position in the longer term for the following reasons:
- •
- Our portfolio accounting, trade order management, and compliance software is mission-critical to our customers;
- •
- Our technology can be utilized to increase operational efficiency;
- •
- We offer a wide range of deployment options to suit clients of any size and strategy;
- •
- As a market leader in investment management technology, customers who spend money will attempt to minimize risk and
therefore, favor our stability, reliability and scalability;
- •
- A more regulated, compliance-oriented industry will drive an increased need for our systems; and
- •
- Our recurring revenue model and large customer base will continue to provide longer term stability.
We also believe that investment managers will be increasingly focused on providing increased and differentiated levels of service to their customers. These factors have traditionally been demand drivers for our products.
We believe our recent financial results validate the strength and stability of our business and the attractiveness of our product portfolio to our customers. For example, our continuing operations have grown revenue, operating income and margin, and operating cash flows during 2010 compared to 2009 and 2009 grew compared to 2008 during a severe market downturn and global economic volatility. In addition, we expect to see a continuing increase in demand for our products during 2011 due to new regulation requiring more transparency and thus, sophisticated accounting software, and growth in the demand from international markets.
Business Focus
In 2011, we view several investment opportunities such as international expansion and build-out of our Advent OnDemand and Tamale RMS products that take precedence over expanding our near-term operating margins. As a result, we will invest in systems infrastructure, increase our hiring and adjust our compensation programs as required to manage our growth and develop and promote our products and services, and we anticipate our operating margin as a percentage of revenue to grow modestly in 2011.
37
We believe our internal, or organic, growth and continued innovation with respect to our software and services business are the foundation of our long-term strategic plan. We invested 18% of revenues in product development in 2010 to enhance our existing portfolio of products and services and to develop new products, features and services. We also believe that an acquisition program is a supporting element of our corporate strategy which can strengthen our competitive position, expand our customer base, and provide greater scale to accelerate innovation. We may continue to acquire companies, products, service and technologies in furtherance of our corporate strategy.
Operating Overview
Operating highlights of 2010 include:
- •
- Expanded customer relationships and continued acceptance of our product
offerings. We experienced continued demand for both our newest and largest portfolio management and accounting platforms: Advent
Portfolio Exchange ("APX") and Geneva. We signed 88 APX contracts, bringing the total number of licenses sold globally to 441, and we signed 44 new Geneva clients bringing the total number of Geneva
licenses sold to 288 as of December 31, 2010. We sold Tamale RMS to numerous firms including asset managers, endowment managers and funds of funds.
- •
- New and incremental bookings. The term license and Advent
OnDemand contracts signed in 2010 will contribute approximately $31.8 million in annual revenue ("annual contract value" or "ACV") once they are fully implemented. This represents a 25%
increase over the $25.5 million of ACV booked from term license and Advent OnDemand contracts signed in 2009.
- •
- Improvement in renewal rate. Our renewal rate improved to
a 91% initial renewal rate for the third quarter of 2010. This represents a 2-point improvement over the same period of 2009.
- •
- International traction. We continue to execute on our
international growth strategy, with revenues from international sources totaling 15% in 2010. This represents a 1-point improvement over 2009. Additionally, we signed new customers in
Bahrain, Singapore, Sweden, Switzerland and the United Kingdom in 2010.
- •
- Acquisition of Goya AS. During the first quarter of 2010,
our wholly-owned Norwegian subsidiary, Advent Norway AS, acquired the entire share capital of Goya AS, a Norwegian software company that provides transfer agency-related solutions to mutual fund
managers and mutual fund distributors. Cash consideration of $4.7 million, net of cash acquired, was paid upon closing in March 2010.
- •
- Advent client conference. We hosted a successful client
conference in September 2010 with more than 1,100 attendees, which included executives from the many market segments we serve including: asset managers, financial advisors, hedge funds, prime brokers,
fund administrators, family offices, banks, broker dealers and trusts.
- •
- Build-out of new facilities. During 2009, we
signed lease agreements to consolidate office facilities in New York City and Boston, and commenced the build-out of those facilities during the first quarter of 2010. We completed the
build-out and consolidated our operations in New York City and Boston during the second and third quarters of 2010, respectively.
- •
- Repurchase of common stock. We repurchased 1.7 million shares under our Board authorized share repurchase program for a total cash outlay of $35.9 million and an average price of $21.48 per share.
38
Stock Split
On December 13, 2010, we announced that our Board of Directors declared a two-for-one stock split, payable in the form of a 100% stock dividend, to stockholders of record at the close of business on January 3, 2011, paid on January 18, 2011. Unless otherwise indicated, all references to number of shares (except shares authorized) and per share information in this "Management's Discussion and Analysis of Financial Condition and Results of Operations" have been adjusted to reflect the stock split on a retroactive basis.
Divestiture of MicroEdge
During 2009, management determined that the continued growth in the not-for-profit community would require a significant investment of resources and decided to focus on the core business. In connection with this decision, management explored divesting the MicroEdge subsidiary and on October 1, 2009, we completed the sale of MicroEdge. See Note 4, "Discontinued Operation", to the consolidated financial statements for a description of the principal terms of the divestiture.
In accordance with FASB ASC 205-20, "Discontinued Operations", MicroEdge's results have been reclassified as a discontinued operation in the consolidated statements of operations for all periods presented. The results of operations and the related charges for our discontinued operation are classified as "net income from discontinued operation, net of applicable taxes" in the accompanying consolidated statements of operation for all periods presented. In addition, the assets and liabilities of MicroEdge have been reclassified as assets and liabilities of discontinued operation in the Company's consolidated balance sheet for all periods presented.
Unless noted otherwise, discussion in this document pertains only to continuing operations.
Recent Developments
In February 2011, we acquired Syncova Solutions, Ltd., a United Kingdom-based company that provides margin management and debt finance reconciliation and optimization software. Cash consideration of approximately $25 million was paid upon closing in February 2011.
Financial Overview
The components of revenue from continuing operations during 2010 and 2009, and associated dollar and percentage fluctuations were as follows (in thousands, except % change):
| |
Fiscal Years | |
|
|||||||||||
|---|---|---|---|---|---|---|---|---|---|---|---|---|---|---|
| |
$ Change |
% Change |
||||||||||||
| |
2010 | 2009 | ||||||||||||
Term license revenues |
$ | 108,837 | $ | 98,382 | $ | 10,455 | 11 | % | ||||||
Maintenance revenues |
72,907 | 74,410 | (1,503 | ) | (2 | )% | ||||||||
Other recurring revenues |
63,363 | 49,967 | 13,396 | 27 | % | |||||||||
Total term license, maintenance and other recurring revenues |
245,107 | 222,759 | 22,348 | 10 | % | |||||||||
Recurring revenue as % of total revenue |
86 | % | 86 | % | ||||||||||
Asset under administration (AUA) fees |
6,947 |
6,546 |
401 |
6 |
% |
|||||||||
Other perpetual license fees |
4,854 | 4,729 | 125 | 3 | % | |||||||||
Total perpetual license fees |
11,801 | 11,275 | 526 | 5 | % | |||||||||
Professional services and other |
26,593 |
25,474 |
1,119 |
4 |
% |
|||||||||
Total net revenues |
$ | 283,501 | $ | 259,508 | $ | 23,993 | 9 | % | ||||||
39
We recognized revenue of $283.5 million from continuing operations during 2010, which represented an increase of 9% over the prior year. This increase was driven by significant growth in other recurring revenues of $13.4 million, as we recognized revenues for the full year in 2010 from outsourced services and data services contracts that went live in September 2009, and to a lesser extent, from the increase in term license revenues of $10.5 million due to our bookings activity from the previous 12 months, growth in sales of our Geneva and APX products and our improved renewal rates. These increases were partially offset by a decrease in maintenance revenues of $1.5 million due to maintenance de-activations and perpetual license customers migrating to term licenses. Perpetual license fees in 2010 were up compared to 2009, primarily due to an increase of $0.4 million in incremental assets under administration fees as our clients' experienced modest growth in AUA balances. Professional services and other revenues also increased due to greater consulting activity as a result of the continued growth in bookings driving additional implementations during 2010 and revenues generated by our annual client conference that we hosted in September 2010.
Total expenses from continuing operations, including cost of revenues, were $247.2 million in 2010, compared with $231.6 million in 2009. Our expenses increased in 2010 from 2009 as a result of costs associated with our client conference, which did not occur in 2009, and investments made in product development to upgrade our products. Additionally, we made investments to expand our business which resulted in higher costs for travel and entertainment, payroll and related expenses, and facilities. The increase in facilities costs reflects new offices in Beijing and Singapore, which were opened in the fourth quarter of 2009 and second quarter of 2010, respectively. Domestic facility costs also increased as we consolidated our offices in New York City and Boston during 2010. In 2009, we signed lease agreements for our new facilities in these cities and during the first quarter of 2010, we commenced the build-out. We occupied our former facilities in New York City and Boston until the build-out for our new facilities was completed; as a result, we incurred rent and utilities expense in both our former and new facilities during 2010 in these cities. We completed the build-out of our new facilities in New York and Boston in May and August 2010, respectively, and moved our operations to consolidate our facility space in both locations.
Our operating income from continuing operations in 2010 increased to $36.3 million or 13% of revenue from $27.9 million or 11% of revenue in 2009 which is reflective of improved leverage in our operating expense categories. Product development and general and administrative costs were down by one percentage point in 2010 compared to last year.
Our continuing operations' income tax expense was $11.1 million resulting in a 31% effective tax rate during 2010, compared to $8.3 million or 29%, respectively, in 2009.
Net income from continuing operations was $24.3 million, resulting in diluted earnings per share of $0.45 for 2010, compared to $20.8 million or $0.39, respectively, in 2009.
Our continuing operations generated operating cash flow of $76.2 million in 2010, which compares to $72.4 million in 2009.
Term License and Term License Deferral
We are substantially through the process of converting the Company's license revenues from a perpetual model to a predominantly term model. When a customer purchases a term license together with implementation services, we do not recognize any revenue under the contract until the implementation services are complete and the remaining services are substantially complete. If the implementation services are still in progress as of quarter-end, we will defer all of the contract revenues to a subsequent quarter. At the point professional services are substantially completed, we recognize a pro-rata amount of the term license revenue, professional services fees earned and related expenses, based on the elapsed time from the start of the term license to the substantial completion of professional services. Term license revenue for the remaining contract years and the remaining deferred
40
professional services revenue and related expenses are recognized ratably over the remaining contract length.
The term license component of the deferred revenue balance related to implementations in process will increase or decrease in the future depending on the amount of new term license bookings relative to the number of implementations that reach completion in a particular quarter. During 2009, the revenue recognized from completed implementations exceeded the revenue deferred from projects being implemented, resulting in a net recognition of revenue of $6.1 million for fiscal 2009, composed of $3.5 million of term license revenue and $2.6 million of professional services revenue. Subsequently in 2010, we returned to our prior trend of net term license revenue deferral. During 2010, we deferred net revenues of $3.2 million and directly-related expenses of $0.8 million associated with our term licensing model. The impact of these deferrals on our operating income was approximately $2.4 million. The $3.2 million net deferral of revenue is composed of a net deferral of $0.9 million of professional services revenue and a net deferral of $2.3 million of term license revenue. We currently expect that the professional services component of the deferred revenue balance will continue to increase through at least 2011.
Amounts of revenues and directly-related expenses deferred as of December 31, 2010 and 2009 associated with our term licensing deferral were as follows (in millions):
| |
December 31 | |||||||
|---|---|---|---|---|---|---|---|---|
| |
2010 | 2009 | ||||||
Deferred revenues |
||||||||
Short-term |
$ | 22.7 | $ | 20.1 | ||||
Long-term |
5.2 | 4.6 | ||||||
Total |
$ | 27.9 | $ | 24.7 | ||||
Directly-related expenses |
||||||||
Short-term |
$ | 6.6 | $ | 6.2 | ||||
Long-term |
2.8 | 2.4 | ||||||
Total |
$ | 9.4 | $ | 8.6 | ||||
Deferred net revenues and directly-related expenses are classified as "Deferred revenues" (short-term and long-term), and "Prepaid expenses and other," and "Other assets," respectively, on the consolidated balance sheets.
Non-GAAP Financial Measures and Other Operational Data
We also consider certain financial and operating measures that are not prepared in accordance with accounting principles generally accepted in the United States ("GAAP"), including the annual contract value ("ACV") of term license and Advent OnDemand contracts, renewal rates, non-GAAP net income, non-GAAP net income per share and free cash flow in measuring the performance of our business. The non-GAAP measures are not based on any standardized methodology prescribed by GAAP and are not necessarily comparable to similar measures presented by other companies. However, we believe that this non-GAAP information is useful as an additional means for investors to evaluate our operating performance, when reviewed in conjunction with our GAAP financial statements. Therefore, these measures should not be considered in isolation or as a substitute for measures prepared in accordance with GAAP, and because these amounts are not determined in accordance with GAAP, they should not be used exclusively in evaluating our business and operations. In addition, undue reliance should not be placed upon non-GAAP or operating information because this information is neither standardized across companies nor subjected to the same control activities and audit procedures that produce our GAAP financial results.
41
Bookings
The following table summarizes the Company's quarterly term license and Advent OnDemand bookings (operational information) and the associated average term (in thousands):
| |
First Quarter |
Second Quarter |
Third Quarter |
Fourth Quarter |
Total | |||||||||||
|---|---|---|---|---|---|---|---|---|---|---|---|---|---|---|---|---|
2010 |
||||||||||||||||
Annual contract value(1) |
$ | 7,297 | $ | 6,502 | $ | 7,554 | $ | 10,489 | $ | 31,842 | ||||||
Average term(2) |
3.0 | 2.7 | 2.9 | 2.8 | 2.9 | |||||||||||
2009 |
||||||||||||||||
Annual contract value(1) |
$ | 4,408 | $ | 4,306 | $ | 6,762 | $ | 10,000 | $ | 25,476 | ||||||
Average term(2) |
2.3 | 2.0 | 2.8 | 3.0 | 2.7 | |||||||||||
2008(3) |
||||||||||||||||
Annual contract value(1) |
$ | 5,510 | $ | 6,853 | $ | 6,188 | $ | 9,553 | $ | 28,104 | ||||||
Average term(2) |
2.8 | 3.1 | 2.9 | 3.6 | 3.2 | |||||||||||
- (1)
- Annual
contract value represents the annual contribution to revenue, once they are fully implemented, from term license and Advent OnDemand contracts
signed.
- (2)
- Average
term is weighted by contract value for all new term licenses and Advent OnDemand contracts signed in the period.
- (3)
- Does not include Advent OnDemand.
While our bookings in 2009 were impacted by the economic downturn, we experienced an improvement during 2010 resulting from an improved demand environment.
Renewal Rates
Our renewal rates are based on cash collections and are disclosed one quarter in arrears. We disclose our renewal rates one quarter in arrears in order to include substantially all payments received against the invoices for that quarter. We also update our renewal rates from the initially disclosed rates to include all cash collections subsequent to the initial disclosure. The following summarizes our initial and updated renewal rates (operational metric) for the previous five quarters:
Renewal Rates
|
Q410 | Q310 | Q210 | Q110 | Q409 | |||||||||||
|---|---|---|---|---|---|---|---|---|---|---|---|---|---|---|---|---|
Based on cash collections relative to prior year collections |
||||||||||||||||
Initially disclosed rate(1) |
91 |
% |
91 |
% |
90 |
% |
89 |
% |
89 |
% |
||||||
Updated disclosed rate(2) |
n/a | 95 | % | 95 | % | 92 | % | 89 | % | |||||||
- (1)
- "Initially
disclosed rate" is based on cash collections and reported one quarter in arrears.
- (2)
- "Updated disclosed rate" reflects initially disclosed rate updated for subsequent cash collections.
While our renewal rates in 2009 were impacted by the economic downturn, we experienced an improvement during the second half of 2010.
42
Non-GAAP Net Income and Non-GAAP Net Income Per Share
Non-GAAP net income is calculated by adjusting GAAP net income for the provision for income taxes, stock-based compensation expense, amortization of purchased intangibles, restructuring charges and other non-recurring items. Non-GAAP net income per share is calculated by dividing non-GAAP net income by the weighted average number of diluted shares outstanding for the period. Non-GAAP net income and non-GAAP net income per share, and reconciliation to its most directly comparable GAAP financial measures, for fiscal 2010, 2009 and 2008 were as follows (in thousands, except per share amounts):
| |
Fiscal Years | |||||||||||||||||||
|---|---|---|---|---|---|---|---|---|---|---|---|---|---|---|---|---|---|---|---|---|
| |
2010 | 2009 | 2008 | |||||||||||||||||
GAAP net income / net income per share |
$ | 24,319 | $ | 0.45 | $ | 20,774 | $ | 0.39 | $ | 17,316 | $ | 0.31 | ||||||||
Amortization of acquired developed technology |
3,325 | 0.06 | 3,128 | 0.06 | 938 | 0.02 | ||||||||||||||
Stock-based compensation—cost of revenues |
2,915 | 0.05 | 2,966 | 0.06 | 2,369 | 0.04 | ||||||||||||||
Amortization of other acquired intangibles |
1,272 | 0.02 | 1,666 | 0.03 | 1,160 | 0.02 | ||||||||||||||
Stock-based compensation—operating expenses |
15,515 | 0.28 | 15,196 | 0.29 | 13,739 | 0.25 | ||||||||||||||
Restructuring charges |
840 | 0.02 | 130 | — | 101 | — | ||||||||||||||
Acquired in-process research and development |
— | — | — | — | 400 | 0.01 | ||||||||||||||
Investment gain |
— | — | (2,056 | ) | (0.04 | ) | (3,393 | ) | (0.06 | ) | ||||||||||
Income tax adjustment(1) |
(9,656 | ) | (0.18 | ) | (9,207 | ) | (0.17 | ) | (8,913 | ) | (0.16 | ) | ||||||||
Non-GAAP net income / net income per share |
$ | 38,530 | $ | 0.71 | $ | 32,597 | $ | 0.62 | $ | 23,717 | $ | 0.43 | ||||||||
- (1)
- The estimated non-GAAP effective tax rate was 35% for fiscal 2010, 2009 and 2008, respectively, and has been used to adjust the provision for income taxes for non-GAAP purposes.
The growth in non-GAAP net income and net income per share since 2008 reflected improved operating leverage in our business as we've been able to grow revenues at a faster pace than our variable costs. In 2010, we made additional investments to expand our international presence resulting in slower growth of non-GAAP net income and net income per share during 2010 compared to 2009.
Free Cash Flow
Free cash flow is defined as cash flow from operations less cash used for purchases of property and equipment and capitalized software development costs. Free cash flow, and reconciliation to its most directly comparable GAAP measure of operating cash flow, for fiscal 2010, 2009 and 2008 was as follows (in thousands):
| |
Fiscal Years | ||||||||||
|---|---|---|---|---|---|---|---|---|---|---|---|
| |
2010 | 2009 | 2008 | ||||||||
Cash provided by operating activities |
$ | 76,218 | $ | 72,427 | $ | 70,337 | |||||
Purchases of property and equipment |
(17,418 | ) | (4,575 | ) | (21,851 | ) | |||||
Capitalized software development costs |
(2,144 | ) | (2,893 | ) | (2,307 | ) | |||||
Free cash flow |
$ | 56,656 | $ | 64,959 | $ | 46,179 | |||||
The fluctuations in free cash flow during these periods primarily reflected our capital expenditure activity. We built-out our new office facilities in New York City and Boston during 2010, and additional space at our headquarters facility in San Francisco during 2008.
43
Critical Accounting Policies and Estimates
Management's discussion and analysis of our financial condition and results of operations are based upon our consolidated financial statements and related notes, which have been prepared in accordance with accounting principles generally accepted in the United States of America. We review the accounting policies used in reporting our financial results on a regular basis. The preparation of these financial statements requires us to make estimates and judgments that affect the reported amounts of assets, liabilities, revenues and expenses, and related disclosure of contingent liabilities.
On an ongoing basis, we evaluate the process we use to develop estimates. We base our estimates on historical experience and on other information that we believe is reasonable for making judgments at the time the estimates are made. Actual results may differ from our estimates due to actual outcomes being different from those on which we based our assumptions.
We believe the following accounting policies contain the more significant judgments and estimates used in the preparation of our consolidated financial statements:
- •
- Revenue recognition and deferred revenues;
- •
- Income taxes;
- •
- Stock-based compensation;
- •
- Restructuring charges and related accruals;
- •
- Business combinations;
- •
- Disposition;
- •
- Goodwill;
- •
- Impairment of long-lived assets;
- •
- Legal contingencies; and
- •
- Sales returns and accounts receivable allowances.
Revenue recognition. Our revenue recognition policies contain our most significant judgments and estimates. Our revenue policy is further described in Note 1, "Summary of Significant Accounting Policies", to the consolidated financial statements.
We recognize revenue from term license, maintenance and other recurring; perpetual license fees, and professional services and other. We offer a wide variety of products and services to a large number of financially sophisticated customers. While many of our lower-priced license transactions, maintenance contracts, subscription-based transactions and professional services projects conform to a standard structure, many of our larger transactions are complex and may require significant review and judgment in our application of generally accepted accounting principles.
Software licenses. We recognize revenue from the licensing of software when persuasive evidence of an arrangement exists, the product has been delivered, the fee is fixed or determinable and collection of the resulting receivable is probable. We generally use a signed license agreement as evidence of an arrangement. Sales through our distributors are evidenced by a master agreement governing the relationship together with binding order forms and signed contracts from the distributor's customers. Revenue is recognized once shipment to the distributor's customer has taken place and when all other revenue recognition criteria have been met. Delivery occurs when a product is delivered to a common carrier F.O.B shipping point, or upon confirmation that product delivered F.O.B shipping destination has been received, or upon notification that software is available for electronic download through our fulfillment vendor. Some of our arrangements include acceptance provisions, and if such acceptance provisions are present, delivery is deemed to occur upon acceptance. We assess whether the
44
fee is fixed or determinable based on the payment terms associated with the transaction. We assess whether the collectability of the resulting receivable is probable based on a number of factors, including the credit worthiness of the customer determined through review of credit reports, our transaction history with the customer, other available information and pertinent country risk if the customer is located outside the United States. Our standard payment terms are due at 180 days or less, but payment terms may vary based on the country in which the agreement is executed. Software licenses are sold with maintenance and, frequently, professional services.
We typically license our products on a per server, per user basis with the price per customer varying based on the selection of the products licensed, the assets under administration, the number of site installations and the number of authorized users. We have substantially completed our transition from selling mostly perpetual licenses to selling a mix of term and perpetual licenses, and expect term license revenue to continue to increase as a proportion of total recurring revenues (which we define as term license, maintenance and other recurring revenues) in the future. Term license revenue comprised approximately 44%, 44% and 35% of total term license, maintenance and other recurring revenues in 2010, 2009 and 2008, respectively. Revenue recognition for software licensed under term and perpetual license models differs depending on which type of contract a customer signs:
- •
- Term licenses
- •
- Perpetual licenses
Term license contracts include both the software license and maintenance services. We offer multi-year term licenses by which a customer makes a binding commitment that typically spans three years. For multi-year term licenses, we have not established vendor specific objective evidence, or VSOE, of fair value for the software license and maintenance components and, as a result, in situations where we are also performing related professional services, we defer all revenue and directly related expenses under the arrangement until the implementation services are complete and the remaining services are substantially complete. At the point professional services are substantially completed, we recognize a pro-rata amount of the term license revenue, professional services fees earned and related expenses, based on the elapsed time from the start of the term license to the substantial completion of professional services. We determine whether services are substantially complete by consulting with the professional services group and applying management judgment. Term license revenue for the remaining contract years and the remaining deferred professional services revenue and related expenses are recognized ratably over the remaining contract length. When multi-year term licenses are sold and do not include related professional services, we recognize the entire term license revenue ratably over the period of the contract term from the effective date of the license agreement assuming all other revenue recognition criteria have been met. Revenues from term licenses are included in "Term license, maintenance and other recurring" revenues on the consolidated statement of operations.
We allocate revenue to delivered components, normally the license component of the arrangement, using the residual method, based on VSOE of fair value of the undelivered elements (generally the maintenance and professional services components), which is specific to us. We determine the fair value of the undelivered elements based on the historical evidence of the Company's stand-alone sales of these elements to third parties and/or renewal rates. If VSOE of fair value does not exist for any undelivered elements, then the entire arrangement fee is deferred until delivery of that element has occurred unless the only undelivered element is maintenance. Revenues from perpetual licenses are included in "Perpetual license fees" revenue on the consolidated statement of operations.
45
Certain of our perpetual and term license contracts include asset-based fee structures that provide additional revenues based on the assets that the client manages using our software ("Assets Under Administration" or "AUA"). Contracts containing an AUA fee structure have a defined measurement period which requires the client to self-report actual AUA in arrears of the specified period. AUA fees above the stated minimum fee for the same period are considered incremental fees. Because incremental fees are not determinable until the conclusion of the measurement period, they are both earned and recognized upon completion of the measurement period, on a quarterly or annual basis. Incremental fees from perpetual AUA contracts are included in "Perpetual license fees" on the consolidated statement of operations. Incremental fees from term AUA contracts are included in "Term license, maintenance and other recurring" revenue on the consolidated statement of operations. The Company recognizes AUA contract minimum fees over the period of service and continues to recognize incremental fees in arrears once clients contractually report the AUA to the Company, because the incremental fees are not determinable until reported.
Maintenance and other recurring revenues. We offer annual maintenance programs on perpetual licenses that provide for technical support and updates to our software products. Maintenance fees are bundled with perpetual license fees in the initial licensing year and charged separately for renewals of annual maintenance in subsequent years. Fair value for maintenance is based upon either renewal rates stated in the contracts or separate sales of renewals to customers. Generally, we recognize maintenance revenue ratably over the contract term.
We offer other recurring revenue services that are either subscription or transaction based which primarily include the provision of software interfaces to download securities information from third party data providers, partial or full business process outsourcing, account aggregation, reconciliation, reference data management, and hosting of hardware and/or software. We recognize revenue from recurring revenue transactions either ratably over the subscription period or as the transactions occur based on the terms of the arrangement.
Professional services and other revenues. We offer a variety of professional services that include project management, implementation, data conversion, integration, custom report writing and training. We base fair value for professional services upon separate sales of these services to customers. Our professional services are generally billed based on hourly rates together with reimbursement for travel and accommodation expenses. We recognize revenue as professional services are performed, except in the case of multi-year term license contracts which are described in the "term licenses" section above. Certain professional services arrangements involve acceptance criteria and in these cases, revenue and related expenses are recognized upon acceptance. Professional services and other revenues also include revenue from our user conferences.
Directly related expenses. When we defer service revenues, we also defer the direct costs incurred in the delivery of those services to the extent those costs are recoverable through the future revenues on non-cancelable contracts as prepaid contract expense. We recognize those deferred costs as costs of professional services revenues proportionally and over the same period that the deferred revenue is recognized as service revenue. When we defer license revenue, we defer the direct incremental costs incurred as a result of selling the contract (i.e. sales commissions earned by the sales force as a part of their overall compensation) because those costs would not have been incurred but for the acquisition of that contract. We recognize those costs as sales and marketing expense proportionally and over the same period as the license revenues.
Income taxes. We account for worldwide income taxes under an asset and liability approach that requires the expected future tax consequences of temporary differences between book and tax bases of assets and liabilities to be recognized as deferred tax assets and liabilities. Significant judgment is required to determine our worldwide income tax provision. In the ordinary course of business, there are many transactions and calculations where the ultimate tax outcome is uncertain. Many of these
46
uncertainties arise as a consequence of cost reimbursement arrangements among related entities, the process of identifying items of revenue and expense that have differing or preferential tax treatment and segregation of foreign and domestic income and expense to the appropriate taxing jurisdictions to reasonably allocate earnings. Although we believe that our judgments and estimates are reasonable, the final outcome could be different from that which is reflected in our income tax provision and accruals.
A valuation allowance is recorded to reduce the recognized net deferred tax assets to an amount that will more likely than not be realized. In order for us to realize our deferred tax assets, we must be able to generate sufficient future taxable income in the jurisdiction where the tax asset is located. We consider forecasted earnings, identified future taxable income and prudent and reasonable tax planning strategies in assessing the need for a valuation allowance.
We calculate our current and deferred tax provision based on estimates and assumptions that could differ from the actual results reflected in income tax returns filed during the subsequent year. Adjustments based on filed returns are generally recorded in the period when the return is filed and the tax implication is known.
We are subject to audits by state, federal and foreign tax authorities. Our estimates for the potential outcome of any uncertain tax matter are judgmental. We believe we have adequately provided for any reasonably foreseeable outcome related to these matters. However, our future results may include adjustments to our estimated tax liabilities.
Stock-based compensation. We currently use the Black-Scholes option pricing model to determine the fair value of stock options, stock appreciation rights ("SAR") and employee stock purchase plan shares. The fair value of our restricted stock units is calculated based on the fair market value of our stock on the date of grant. The determination of the fair value of stock-based payment awards on the date of grant using an option-pricing model is affected by our stock price as well as assumptions regarding a number of complex and subjective variables. These variables include our expected stock price volatility over the term of the awards, actual and projected employee exercise behavior, the risk-free interest rate and expected dividends.
We estimate the volatility of our common stock based on an equally weighted average of historical and implied volatility of the Company's common stock. We determined that a blend of historical and implied volatility is more reflective of the market conditions and a better indicator of expected volatility than using purely historical volatility. We estimate the expected life of options and SARs granted based on historical experience of similar awards, giving consideration to the contractual terms of the stock-based awards, vesting schedules and expectations of future employee behavior. We base the risk-free interest rate on the US Treasury yield curve in effect at the time of grant for periods corresponding with the expected life of the option and SAR. We do not anticipate paying any cash dividends in the foreseeable future and therefore use an expected dividend yield of zero in the option pricing model.
These variables are sensitive and change on a daily basis. As a result, the financial result from issuing the same number of options or SARs can vary significantly over time. The following table reflects the change in the fair value of a hypothetical option or SAR as a result of a hypothetical change in one of the underlying assumptions:
Assumption
|
Base Case | Assumption Change |
Value Change |
Assumption Change |
Value Change |
|||||||||
|---|---|---|---|---|---|---|---|---|---|---|---|---|---|---|
Grant and stock price |
$ | 30.00 | +$1 | $ | 0.32 | -$1 | $ | (0.31 | ) | |||||
Risk-free interest rate |
2 | % | +0.5% | $ | 0.25 | -0.5% | $ | (0.24 | ) | |||||
Volatility |
36 | % | +5% | $ | 1.13 | -5% | $ | (1.15 | ) | |||||
Expected life (years) |
4.96 | +1 year | $ | 0.78 | -1 year | $ | (0.90 | ) | ||||||
Expected dividend yield |
1 | % | +1% | $ | (0.92 | ) | -1% | $ | 1.00 | |||||
Base Option Value |
$ | 9.38 | ||||||||||||
47
Historically, our SAR and stock option awards granted to employees cliff vest 20% after one year and monthly thereafter over the next 48 months. Starting in February 2009, we reduced the vesting period from 5 years to 4 years, and SARs and stock option awards granted to employees now cliff vest 25% after one year and monthly thereafter over the next 36 months. Our restricted stock unit ("RSU") awards cliff vest 50% after two years and 50% after four years. ASC 718, "Compensation—Stock Compensation", requires forfeitures to be estimated at the time of grant and revised, if necessary, in subsequent periods if actual forfeitures differ from those estimates. Forfeitures are estimated based on our annual forfeiture rate. The annual forfeiture rate is based on our historical forfeiture experience over the last ten years. Although we believe the assumptions and estimates we have made in the past have been reasonable and appropriate, different assumptions and estimates could materially impact our reported financial results. A decrease in our annual forfeiture rate assumption would increase stock-based compensation expense. The estimated impact of a hypothetical 500 basis point decrease in the annual forfeiture rate on stock-based compensation expense for 2010 would have been an increase of approximately $0.3 million.
Restructuring charges and related accruals. We have developed and implemented formalized plans for restructuring our business to better align our resources to market conditions and recorded significant charges. In connection with these plans, we recorded estimated expenses for severance and benefits, lease cancellations, asset write-offs and other restructuring costs. Given the significance of, and the timing of the execution of such activities, this process is complex and involves periodic reassessments of estimates made at the time the original decisions were made, including evaluating real estate market conditions for expected vacancy periods and sub-lease rents. We continually evaluate the adequacy of the remaining liabilities under our restructuring initiatives. Although we believe that these estimates accurately reflect the costs of our restructuring plans, actual results may differ, thereby requiring us to record additional provisions or reverse a portion of such provisions.
Business combinations. When we acquire businesses, we allocate the purchase price to tangible assets and liabilities and identifiable intangible assets acquired. Any residual purchase price is recorded as goodwill. The allocation of the purchase price requires management to make significant estimates in determining the fair values of assets acquired and liabilities assumed, especially with respect to intangible assets. These estimates are based on historical experience and information obtained from the management of the acquired companies. These estimates can include, but are not limited to, the cash flows that an asset is expected to generate in the future, the appropriate weighted-average cost of capital, and the cost savings expected to be derived from acquiring an asset. These estimates are inherently uncertain and unpredictable. In addition, unanticipated events and circumstances may occur which may affect the accuracy or validity of such estimates.
Disposition. When we dispose of a subsidiary, we account for the divestiture in accordance with ASC 205-20, "Discontinued Operations". The results of operations and the related charges for the discontinued operation are classified as "Net income from discontinued operation, net of applicable taxes" in the accompanying consolidated statements of operations for all periods presented. In addition, the assets and liabilities of the discontinued operation are reclassified as assets and liabilities of discontinued operation in our consolidated balance sheet for all periods presented.
The calculation of the gain on disposal of our discontinued operation required management to make significant estimates in the resulting facility exit costs. In connection with the sale of MicroEdge, the Company vacated its MicroEdge facilities in New York and entered into a sub-lease agreement with the Purchaser whereby the Purchaser will sub-lease the premises for two years with the option to extend the sub-lease term through the end of the lease term in 2018. Given the significance of, and the timing of the execution of such activities, this process is complex and involves periodic reassessments of estimates made at the time the original decisions were made, including evaluating the probability that the Purchaser will decide to sub-lease the premises beyond the initial two-year period and through
48
2018, evaluating real estate market conditions for expected vacancy periods and sub-lease rents. We continually evaluate the adequacy of the remaining liabilities related to this disposition. Although we believe that these estimates accurately reflect costs for our facility exit costs, actual results may differ, thereby requiring us to record additional provisions or reverse a portion of such provisions.
Additionally, $3.0 million of the Purchase Price has been placed in escrow for eighteen (18) months following the close to be held as security for losses incurred by the Purchaser in the event of certain breaches of the representations and warranties contained in the Agreement or certain other events. Given the uncertainty associated with the potential losses, any gain on sale associated with the $3.0 million held in escrow will be recorded by the Company when realized.
Goodwill. We review our goodwill for impairment annually during the fourth quarter of our fiscal year (as of November 1) and more frequently if an event or circumstance indicates that an impairment loss has occurred. We are required to test our goodwill for impairment at the reporting unit level. We determined that the Company has two reporting units, Domestic and International, which comprise our Advent Investment Management segment, for the goodwill impairment testing performed during the fourth quarter of 2010. The test for goodwill impairment is a two-step process:
The first step compares the fair value of each reporting unit with its respective carrying amount, including goodwill. If the fair value of the reporting unit exceeds its carrying amount, goodwill of our reporting unit is considered not impaired, thus the second step of the impairment test is unnecessary.
The second step, used to measure the amount of impairment loss, compares the implied fair value of each reporting unit's goodwill with the respective carrying amount of that goodwill. If the carrying amount of the reporting unit goodwill exceeds the implied fair value of that goodwill, an impairment loss shall be recognized in an amount equal to that excess.
Determining the fair value of a reporting unit is subjective and requires judgment at many points during the test including the development of future revenue and expense forecasts used to calculate future cash flows, the selection of risk-adjusted discount rates, and determination of market comparable entities. During the fourth quarter of 2010, Advent completed the first step of its annual impairment test and determined that Advent's reporting units as of the latest impairment testing date is substantially in excess of carrying value. As Advent determined that none of the reporting units were at risk for failing step one of the impairment testing, the second step of the impairment test was not necessary to perform.
Impairment of long-lived assets. We review our other long-lived assets including property and equipment and other intangibles for impairment whenever events or changes in circumstances indicate that the carrying amount of these assets may not be recoverable. Determining whether an impairment trigger has occurred is subjective and requires judgment. Our recoverability test compares the assets' carrying amount to their expected future undiscounted net cash flows. We estimate future revenue and expense amounts to calculate future cash flows. We believe our forecast revenue and expense amounts are reasonable but forecast amounts are inherently uncertain and unpredictable.
Legal contingencies. From time to time, Advent is involved in claims and legal proceedings that arise in the ordinary course of business. We use our judgment to assess both the likelihood and potential amount of a contingency. We periodically review our assessment whenever there is a change in the facts and circumstances of these proceedings. Litigation is subject to inherent uncertainties and our view of these matters may change in the future. Were an unfavorable outcome to occur, there exists the possibility of a material adverse impact on our financial position and results of operations for the period in which the unfavorable outcome occurs, and potentially in future periods.
Sales returns and accounts receivable allowances. Our standard practice is to enforce our contract terms and not allow our customers to return software. We have, however, allowed customers
49
to return software on a limited case-by-case basis and have recorded sales returns provisions as offsets to revenue in the period the sales return becomes probable. We use our judgment in estimating our sales returns. We analyze customer demand, acceptance of products and historical returns when evaluating the adequacy of the allowance for sales returns, which are not generally provided to customers. Beginning in the second quarter of 2007, we changed our methodology to supplement our judgment for calculating the value of reserves that considered the last 12 months of return experience.
Our ability to estimate returns is based on our long history of experience with relatively homogenous transactions and the fact that the return period is short. The estimates for returns are adjusted periodically based upon changes in historical rates of returns and other related factors. We have recorded a sales returns provision (benefit) to decrease (increase) revenue for these situations based on our historical experience of $(0.6) million, $0.3 million and $0.2 million in fiscal 2010, 2009 and 2008, respectively.
We use our judgment in estimating our allowance for doubtful accounts. In order to estimate our allowance for doubtful accounts, we analyze specific accounts receivables, historical bad debts, customer concentrations, customer credit-worthiness, current economic trends and changes in customer payment terms. We have recorded a provision for bad debt expense of $0.2 million, $0.2 million and $0.6 million in fiscal 2010, 2009 and 2008, respectively.
50
Results of Operations for Fiscal Years 2010, 2009 and 2008
The following table summarizes, for the periods indicated, certain items in the consolidated statements of operations as a percentage of net revenues. The financial information and the ensuing discussion should be read in conjunction with the accompanying consolidated financial statements and notes thereto.
| |
Fiscal Years | ||||||||||
|---|---|---|---|---|---|---|---|---|---|---|---|
| |
2010 | 2009 | 2008 | ||||||||
Net revenues: |
|||||||||||
Term license, maintenance and other recurring |
86 | % | 86 | % | 80 | % | |||||
Perpetual license fees |
4 | 4 | 7 | ||||||||
Professional services and other |
9 | 10 | 12 | ||||||||
Total net revenues |
100 | 100 | 100 | ||||||||
Cost of revenues: |
|||||||||||
Term license, maintenance and other recurring |
18 | 18 | 18 | ||||||||
Perpetual license fees |
* | * | * | ||||||||
Professional services and other |
10 | 11 | 14 | ||||||||
Amortization of developed technology |
2 | 2 | 1 | ||||||||
Total cost of revenues |
31 | 32 | 34 | ||||||||
Gross margin |
69 | 68 | 66 | ||||||||
Operating expenses: |
|||||||||||
Sales and marketing |
24 | 24 | 24 | ||||||||
Product development |
18 | 19 | 18 | ||||||||
General and administrative |
13 | 14 | 15 | ||||||||
Amortization of other intangibles |
* | 1 | * | ||||||||
Acquired in-process research and development |
* | * | * | ||||||||
Restructuring charges |
* | * | * | ||||||||
Total operating expenses |
57 | 57 | 58 | ||||||||
Income from continuing operations |
13 | 11 | 8 | ||||||||
Interest expense |
* |
* |
* |
||||||||
Interest income and other, net |
* | * | * | ||||||||
Gain on sale of equity investments, net |
* | 1 | 1 | ||||||||
Income from continuing operations before income taxes |
12 | 11 | 9 | ||||||||
Provision for income taxes |
4 | 3 | 2 | ||||||||
Net income from continuing operations |
9 | 8 | 7 | ||||||||
Discontinued operation: |
|||||||||||
Net income from discontinued operation |
* | 6 | 1 | ||||||||
Net income |
9 | % | 14 | % | 8 | % | |||||
Percentages are based on actual values. Totals may not sum due to rounding.
- *
- Less than 1%
51
NET REVENUES
| |
2010 | 2009 | 2008 | |||||||
|---|---|---|---|---|---|---|---|---|---|---|
| |
(in thousands, except percentages) |
|||||||||
Total net revenues |
$ | 283,501 | $ | 259,508 | $ | 237,884 | ||||
Change over prior year |
$ | 23,993 | $ | 21,624 | ||||||
Percent change over prior year |
9 | % | 9 | % | ||||||
Our net revenues are made up of three components: term license, maintenance and other recurring revenue; perpetual license fees; and professional services and other revenue. The revenues from a term license, which includes both software license and maintenance services, are earned under a time based contract. Maintenance revenues are derived from maintenance fees charged for perpetual license arrangements and other recurring revenues are derived from our subscription-based and transaction-based services. Perpetual license revenues are derived from the licensing of software products under a perpetual arrangement and include Assets Under Administration ("AUA") fees for certain perpetual arrangements. Professional services and other revenues include fees for consulting, fees from training, and project management services and our client conferences. Sales returns, which we generally do not provide to customers, are accounted for as deductions to these three revenue categories based on our historical experience.
As a percentage of net revenues, revenues from recurring sources have grown to over 85% since fiscal 2009, and conversely revenues from perpetual licenses have decreased as follows:
As a percentage of net revenues
|
2010 | 2009 | 2008 | ||||||
|---|---|---|---|---|---|---|---|---|---|
Revenues from recurring sources |
86% | 86% | 80% | ||||||
Revenues from perpetual license fees |
4% |
4% |
7% |
||||||
As we continue to sign term license agreements for new customers, grow our subscription, data management and outsourced services revenues, and our customers renew their perpetual maintenance, we expect our revenue from recurring sources to continue to increase slightly as a percent of net revenues.
Net revenues increased in 2010 and 2009 due to continued customer adoption for many of our products and services, which principally includes increases in sales of our APX and Geneva products. The year-over-year growth in total net revenues for 2010 was due to higher revenues from recurring sources, primarily other recurring revenues and term license revenues, which reflected 10% and 16% growth in term license, maintenance and other recurring revenues during 2010 and 2009, respectively. The increase in total net revenues for 2010 was due principally to revenue being recognized for a full year from several large data service and outsourcing arrangements where implementation was completed in September 2009 and the increase in term license revenue. The increase in professional services and other revenues was due to higher consulting services activity and our client conference which we returned to hosting in 2010.
Revenues derived from international sales were $43.0 million, $36.5 million and $37.0 million in 2010, 2009 and 2008, respectively. The increase in international revenue in dollar amount during 2010 is primarily due to an increase in new business in international locations due to an improvement in economic conditions in those regions, and to a lesser extent, increases in the market values of AUA balances for our EMEA customers. We plan to continue expanding our international sales efforts, both in our current markets and elsewhere. The revenues from customers in any single international country did not exceed 10% of total net revenues.
We expect net revenues to be in the range of $307 million to $314 million for fiscal 2011. Additionally, as we continue to sign term license and Advent OnDemand contracts with new customers,
52
we expect our revenue from recurring sources to continue to increase slightly as a percent of net revenues.
Term License, Maintenance and Other Recurring Revenues
| |
2010 | 2009 | 2008 | |||||||
|---|---|---|---|---|---|---|---|---|---|---|
| |
(in thousands, except percentages) |
|||||||||
Term license revenues |
$ | 108,837 | $ | 98,382 | $ | 66,053 | ||||
Maintenance revenues |
72,907 | 74,410 | 77,700 | |||||||
Other recurring revenues |
63,363 | 49,967 | 47,691 | |||||||
Total term license, maintenance and other recurring revenues |
$ | 245,107 | $ | 222,759 | $ | 191,444 | ||||
Percent of total net revenues |
86 | % | 86 | % | 80 | % | ||||
Change over prior year |
$ | 22,348 | $ | 31,315 | ||||||
Percent change over prior year |
10 | % | 16 | % | ||||||
We began our transition to a term license model in 2004 and have experienced growth in our term license ACV bookings through 2008. In 2009, we experienced a 9% decline in ACV bookings reflecting the dramatic market downturn and global economic volatility that began in the fourth quarter of 2008 and continued through most of 2009. In 2010, ACV bookings increased by 25% when compared to the prior year. Revenues from term licenses, which include both the software license and maintenance services for term licenses, grew 11% in 2010 from 2009 and represented 44% of total term license, maintenance and other recurring revenues in 2010 and 2009, respectively, and 35% in 2008. The growth of term license revenues in 2010 and 2009 reflects the continued layering of incremental ACV sold in previous periods into our term revenue and the continued market acceptance of our Geneva, APX, Axys, Partner, Moxy and Tamale products. As a percentage of total net revenues, total recurring revenues remained flat at 86% during 2010, as the increase was partially offset by the net term license revenue deferral for fiscal 2010. For our term licenses, we defer all revenue on new bookings until our implementation services are complete. For fiscal 2010, 2009 and 2008, the term license deferral/recognition increased (decreased) the Company's term license revenues as follows:
| |
2010 | 2009 | 2008 | |||||||
|---|---|---|---|---|---|---|---|---|---|---|
| |
(in thousands) |
|||||||||
Term license revenues |
$ | (2,316 | ) | $ | 3,507 | $ | (2,790 | ) | ||
Change over prior year |
$ |
(5,823 |
) |
$ |
6,297 |
|||||
During 2009, the revenue recognized from completed implementations exceeded the revenue deferred from projects being implemented as several large implementations were completed, resulting in a net recognition of term license revenue of $3.5 million in 2009. During 2010, we returned to our prior trend of net term license revenue deferral as our ACV bookings during this period increased 25% compared to 2009, resulting in the deferral of $2.3 million in 2010.
Maintenance revenues from perpetual licenses decreased by $1.5 million and $3.3 million during 2010 and 2009, respectively. These decreases were due to maintenance de-activations from customer attrition, maintenance level downgrades, reductions in products licensed or number of users by clients, perpetual license customers migrating to term licenses, and continued decrease in new perpetual license customers, partially offset by the impact of price increases.
Other recurring revenues, which primarily include revenues from the provision of software interfaces to download securities information from third party data providers, partial or full business process outsourcing, account aggregation, reconciliation, reference data management, and hosting of hardware and/or software, increased $13.4 million and $2.3 million during 2010 and 2009, respectively. In 2010, the increase in other recurring revenues was primarily due to growth in revenues of
53
$9.2 million from outsourced services as several large implementations went live in September 2009 and to a lesser extent, from the increase of $4.2 million in our subscription and data management revenues. In 2009, the increase in other recurring revenues was due to the growth in our outsourced services of $1.6 million and to a lesser extent, from the increase of $0.7 million in our subscription and data management revenues.
As we continue to sign term license agreements for new customers, we expect our revenue from recurring sources to continue to increase slightly as a percent of net revenues.
Perpetual License Fees
| |
2010 | 2009 | 2008 | |||||||
|---|---|---|---|---|---|---|---|---|---|---|
| |
(in thousands, except percentages) |
|||||||||
Assets under administration (AUA) fees |
$ | 6,947 | $ | 6,546 | $ | 8,417 | ||||
Other perpetual license fees |
4,854 | 4,729 | 8,391 | |||||||
Total perpetual license fees |
$ | 11,801 | $ | 11,275 | $ | 16,808 | ||||
Percent of total net revenues |
4 | % | 4 | % | 7 | % | ||||
Change over prior year |
$ | 526 | $ | (5,533 | ) | |||||
Percent change over prior year |
5 | % | (33 | )% | ||||||
Total perpetual license fees increased during 2010, primarily due to modest increases in the AUA balances of our clients. Incremental assets under administration fees from perpetual licenses increased by $0.4 million during 2010 when compared to 2009, as clients experienced growth in the market value of AUA balances due to improved market conditions. Total perpetual license fees decreased during 2009 as we licensed fewer perpetual seats and modules to our existing perpetual client base. Additionally, incremental assets under administration fees from perpetual licenses decreased by $1.9 million in 2009 compared to 2008, as clients experienced declines in the market value of AUA balances due to deteriorating market conditions.
Professional Services and Other Revenues
| |
2010 | 2009 | 2008 | |||||||
|---|---|---|---|---|---|---|---|---|---|---|
| |
(in thousands, except percentages) |
|||||||||
Professional services and other revenues |
$ | 26,593 | $ | 25,474 | $ | 29,632 | ||||
Percent of total net revenues |
9 | % | 10 | % | 12 | % | ||||
Change over prior year |
$ | 1,119 | $ | (4,158 | ) | |||||
Percent change over prior year |
4 | % | (14 | )% | ||||||
Professional services and other revenues include consulting, project management, custom integration, training and our client conference. Professional services projects related to Axys, Moxy and Partner products generally can be completed in a two-to six-month time period, while services related to Geneva and APX products may require a four- to nine-month implementation period.
We defer professional services revenue for services performed on term license implementations that are not considered substantially complete. Service revenue is deferred until the implementation is complete and remaining services are substantially completed. Upon substantial completion, we recognize a pro-rata amount of professional services fees earned based on the elapsed time from the start of the term license to the substantial completion of professional services. The remaining deferred professional services revenue is recognized ratably over the remaining contract length.
54
Professional services and other revenues fluctuated due to the following (in thousands):
| |
Change From 2009 to 2010 |
Change From 2008 to 2009 |
||||||
|---|---|---|---|---|---|---|---|---|
Increased (decreased) consulting services |
$ | 2,286 | $ | (7,611 | ) | |||
Increased (decreased) client conference |
1,043 | (1,665 | ) | |||||
Increased (decreased) reimbursable travel revenue |
566 | (1,466 | ) | |||||
Increased (decreased) custom report services |
443 | (1,248 | ) | |||||
Increased (decreased) project management |
60 | (984 | ) | |||||
(Increased) decreased term license implementation deferral |
(3,487 | ) | 9,417 | |||||
Various other items |
208 | (601 | ) | |||||
Total change |
$ | 1,119 | $ | (4,158 | ) | |||
The revenue increase in 2010 primarily reflected increased revenue from consulting services, reimbursable travel, and conference, partially offset by the revenue deferral impact associated with term license implementations. During 2010, we experienced an increase in new service engagements resulting in the increase in consulting services and related reimbursable travel revenue. Conference revenue also increased as we returned to hosting our client conference in 2010.
The revenue decrease in 2009 represented a contraction in new services engagements in addition to lower utilization of our consultants and related reimbursable travel resulting from a decrease in demand for consulting services in 2009 compared to 2008. In addition, we experienced a decline in revenues associated with our annual client conference as we did not hold a conference in 2009. These decreases were partially offset by the recognition of net professional services revenue related to the completion of term license implementations.
The impact of our term license implementation recognition (deferral) on professional services revenues was as follows:
| |
2010 | 2009 | 2008 | |||||||
|---|---|---|---|---|---|---|---|---|---|---|
| |
(in thousands, except percentages) |
|||||||||
Net recognition (deferral) of professional services revenue related to term license implementations |
$ | (875 | ) | $ | 2,612 | $ | (6,805 | ) | ||
Change over prior year |
$ |
(3,487 |
) |
$ |
9,417 |
|||||
During 2010, the net impact of the term license implementation deferral was minimal as the revenue deferred from implementations in process in 2010 was nearly offset by the revenue recognized from completed implementations. As our bookings activity contracted in 2009 and more professional service implementation projects were able to reach substantial completion during 2009, the revenue recognized from completed implementations exceeded the revenue deferred from projects being implemented, resulting in a net recognition of revenue of $2.6 million, representing a $9.4 million increase to professional services revenue compared to the net deferral of $6.8 million during 2008.
55
COST OF REVENUES
| |
2010 | 2009 | 2008 | |||||||
|---|---|---|---|---|---|---|---|---|---|---|
| |
(in thousands, except percentages) |
|||||||||
Total cost of revenues |
$ | 86,810 | $ | 82,545 | $ | 81,505 | ||||
Percent of total net revenues |
31 | % | 32 | % | 34 | % | ||||
Change over prior year |
$ | 4,265 | $ | 1,040 | ||||||
Percent change over prior year |
5 | % | 1 | % | ||||||
Our cost of revenues is made up of four components: cost of term license, maintenance and other recurring; cost of perpetual license fees; cost of professional services and other; and amortization of developed technology. The increase in total cost of revenues in absolute dollars in 2010 was due principally to increases in the cost of term license, maintenance and other recurring related to new hires to support our increase in demand for technical support and outsourcing data services, costs related to our client conference and to an increase in amortization of developed technology costs, partially offset by decreased payroll and related costs from our professional services group. Cost of revenues as a percent of total net revenues decreased in 2010 due to growth in term license, maintenance and other recurring revenues. The gross margin improvement in 2010 was primarily due to the redeployment of consulting employees to other areas of our business as we work more through third party providers, and higher utilization of our current consulting employees. However, consistent with historical trends, we are still experiencing negative gross margins on professional services revenues as a result of the significant deferral of professional services revenues and costs associated with our term license implementation.
Cost of Term License, Maintenance and Other Recurring
| |
2010 | 2009 | 2008 | |||||||
|---|---|---|---|---|---|---|---|---|---|---|
| |
(in thousands, except percentages) |
|||||||||
Cost of term license, maintenance and other recurring |
$ | 51,261 | $ | 46,823 | $ | 43,798 | ||||
Percent of total term license, maintenance and other recurring revenues |
21 | % | 21 | % | 23 | % | ||||
Change over prior year |
$ | 4,438 | $ | 3,025 | ||||||
Percent change over prior year |
9 | % | 7 | % | ||||||
Cost of term license fees consists primarily of royalties and other fees paid to third parties, the fixed direct labor and third-party costs involved in producing and distributing our software, and cost of product media including duplication, manuals and packaging materials. Cost of maintenance and other recurring revenues is primarily comprised of the direct costs of providing technical support services under maintenance agreements and other services for recurring revenues, and royalties paid to third party subscription-based and transaction-based vendors. Gross margins for term license, maintenance and other recurring were 79%, 79% and 77% during 2010, 2009 and 2008, respectively.
56
Cost of term license, maintenance and other recurring fluctuated due to the following (in thousands):
| |
Change From 2009 to 2010 |
Change From 2008 to 2009 |
||||||
|---|---|---|---|---|---|---|---|---|
Increased payroll and related |
$ | 2,546 | $ | 4,133 | ||||
Increased (decreased) allocation-in of facility and infrastructure expenses |
902 | (190 | ) | |||||
Increased (decreased) travel and entertainment |
813 | (35 | ) | |||||
Increased depreciation |
574 | 435 | ||||||
Increased (decreased) outside services |
327 | (214 | ) | |||||
Increased (decreased) recruiting |
96 | (235 | ) | |||||
Decreased royalties |
(939 | ) | (1,008 | ) | ||||
Various other items |
119 | 139 | ||||||
Total change |
$ | 4,438 | $ | 3,025 | ||||
The increase in absolute dollars in 2010 and 2009 was due primarily to an increase in compensation and related costs resulting from increases in salary costs and headcount which enables us to deliver the technical support services we provide to our growing number of clients in their day-to-day use of our software. During 2010, headcount increased to 292 employees at December 31, 2010 from 270 employees at December 31, 2009. During 2009, headcount decreased to 270 employees at December 31, 2009 from 278 employees at December 31, 2008, but was higher on average in 2009 as we increased headcount by 21 heads from our Tamale acquisition in October 2008. We allocate facility and infrastructure expenses based on headcount and consistent with the increase in departmental headcount, we allocated more of these costs to our term license, maintenance and other recurring departments in 2010. Allocation-in of facility and infrastructure costs decreased in 2009 when compared to 2008 as we did not include the headcount from Tamale in determining the amount of facility and infrastructure costs to allocate to the cost of term license, maintenance and other recurring.
Higher travel and entertainment, and outside services also contributed to the overall cost increase during 2010. Travel and entertainment costs increased due to increased travel by our employees associated with providing client support services as well as our client conference, which we suspended in 2009, but resumed in 2010. The increase to outside services reflects more activity and utilization of third party consultants during 2010 compared to 2009.
The impact of these cost increases during 2010 and 2009 was partially offset by lower royalty expenses resulting from decreased renewal activity with third party subscription-based and transaction-based vendors.
Cost of Perpetual License Fees
| |
2010 | 2009 | 2008 | |||||||
|---|---|---|---|---|---|---|---|---|---|---|
| |
(in thousands, except percentages) |
|||||||||
Cost of perpetual license fees |
$ | 274 | $ | 327 | $ | 488 | ||||
Percent of total perpetual license revenues |
2 | % | 3 | % | 3 | % | ||||
Change over prior year |
$ | (53 | ) | $ | (161 | ) | ||||
Percent change over prior year |
(16 | )% | (33 | )% | ||||||
Cost of perpetual license fees consists primarily of royalties and other fees paid to third parties, the fixed direct labor and third party costs involved in producing and distributing our software, and cost of product media including duplication, manuals and packaging materials. The cost of perpetual license fees decreased during 2010 and 2009 primarily as a result of a decrease in product media costs. During
57
2010 and 2009, we experienced a decrease in product related costs as we continued to transition away from perpetual licensing.
Cost of Professional Services and Other
| |
2010 | 2009 | 2008 | |||||||
|---|---|---|---|---|---|---|---|---|---|---|
| |
(in thousands, except percentages) |
|||||||||
Cost of professional services and other |
$ | 28,901 | $ | 29,777 | $ | 34,158 | ||||
Percent of total professional services revenues |
109 | % | 117 | % | 115 | % | ||||
Change over prior year |
$ | (876 | ) | $ | (4,381 | ) | ||||
Percent change over prior year |
(3 | )% | (13 | )% | ||||||
Cost of professional services and other revenue consists primarily of personnel related costs associated with the client services organization in providing consulting, custom report writing and conversions of data from clients' previous systems. Also included are direct costs associated with third-party consultants and travel expenses. Additionally, we defer direct professional services costs until we have completed the term license implementation services.
Cost of professional services and other fluctuated due to the following (in thousands):
| |
Change From 2009 to 2010 |
Change From 2008 to 2009 |
||||||
|---|---|---|---|---|---|---|---|---|
Decreased (increased) service cost deferral related to term implementations |
$ | (1,903 | ) | $ | 4,063 | |||
Decreased payroll and related |
(1,014 | ) | (1,782 | ) | ||||
Decreased allocation-in of facility and infrastructure expenses |
(163 | ) | (469 | ) | ||||
Increased (decreased) outside services |
(84 | ) | (1,997 | ) | ||||
Increased (decreased) marketing |
1 | (285 | ) | |||||
Increased (decreased) travel and entertainment |
780 | (2,101 | ) | |||||
Increased (decreased) conference |
1,514 | (1,447 | ) | |||||
Various other items |
(7 | ) | (363 | ) | ||||
Total change |
$ | (876 | ) | $ | (4,381 | ) | ||
We defer direct costs associated with services performed on term license implementations until a project reaches substantial completion. Indirect costs such as management and other overhead expenses are recognized in the period in which they are incurred, with no revenue to offset them. At the point professional services are substantially completed, we recognize a pro-rata amount of the term license revenue, professional services fees earned and related expenses, based on the elapsed time from the start of the term license to the substantial completion of professional services. Term license revenue for the remaining contract years and the remaining deferred professional services revenue and related expenses are recognized ratably over the remaining contract length.
During 2009, several large implementation projects related to our APX and Geneva products reached substantial completion, and the costs recognized from completed implementations exceeded the costs deferred from projects being implemented. During 2010, we returned to our prior trend of
58
deferring costs. The impact of our term license implementation recognition (deferral) on professional services costs for 2010, 2009 and 2008 was as follows:
| |
2010 | 2009 | 2008 | |||||||
|---|---|---|---|---|---|---|---|---|---|---|
| |
(in thousands, except percentages) |
|||||||||
Net recognition (deferral) of professional services costs related to term license implementations |
$ | (649 | ) | $ | 1,254 | $ | (2,809 | ) | ||
Change over prior year |
$ |
(1,903 |
) |
$ |
4,063 |
|||||
Percent change over prior year |
(152 | )% | (145 | )% | ||||||
Over the past several years, we have redeployed consulting employees to other areas of our business, resulting in the decreases in payroll related costs and allocation-in of facility and infrastructure expenses during 2010 and 2009. Headcount in our consulting group was 107, 105 and 132 at December 31, 2010, 2009 and 2008, respectively. Although consulting headcount was slightly higher at 107 employees as of the end of 2010 compared to 2009, average headcount was higher during 2009 at approximately 118 consulting employees.
The decrease in outside services, and travel and entertainment in 2009 reflects a lower level of professional service activity and lower utilization of consulting employees during 2009 compared to 2008. During 2010, consistent with the increase in professional service activity, we experienced an increase in travel and entertainment costs.
In lieu of hosting the Advent client conference in 2009, we elected to host smaller-scale road shows as customers and prospects were cautious about budgets during 2009. As the financial markets stabilized, we returned to hosting the Advent client conference in 2010 resulting in the fluctuations in conference related costs during 2010 and 2009.
Gross margins for professional services and other were (9)%, (17)% and (15)% during 2010, 2009 and 2008, respectively. The gross margin improvement in 2010 was primarily due to the redeployment of consulting employees to other areas of our business as we worked more through third party providers, and higher utilization of our current consulting employees. As the deferred professional services revenue and expense associated with our term licenses continue to flow back into our operating results, we believe the margin will continue to improve over time.
Amortization of Developed Technology
| |
2010 | 2009 | 2008 | |||||||
|---|---|---|---|---|---|---|---|---|---|---|
| |
(in thousands, except percentages) |
|||||||||
Amortization of developed techology |
$ | 6,374 | $ | 5,618 | $ | 3,061 | ||||
Percent of total net revenues |
2 | % | 2 | % | 1 | % | ||||
Change over prior year |
$ | 756 | $ | 2,557 | ||||||
Percent change over prior year |
13 | % | 84 | % | ||||||
Amortization of developed technology represents amortization of acquisition-related intangibles, and amortization of capitalized software development costs previously capitalized under ASC 985, "Costs of Software to be Sold, Leased, or Marketed". The increase in absolute dollars in 2010 resulted from additional amortization from software development costs capitalized during 2009 and 2010, and to a lesser extent, amortization from technology related intangible assets associated with Goya AS which we acquired in March 2010, partially offset by decreased amortization from other developed technology assets that were fully amortized during 2010. The increase in 2009 reflected increased amortization from technology-related intangible assets associated with Tamale which we acquired in October 2008, and to a lesser extent, amortization from software development costs previously capitalized under ASC 985.
59
OPERATING EXPENSES
Sales and Marketing
| |
2010 | 2009 | 2008 | |||||||
|---|---|---|---|---|---|---|---|---|---|---|
| |
(in thousands, except percentages) |
|||||||||
Sales and marketing |
$ | 69,151 | $ | 62,738 | $ | 57,939 | ||||
Percent of total net revenues |
24 | % | 24 | % | 24 | % | ||||
Change over prior year |
$ | 6,413 | $ | 4,799 | ||||||
Percent change over prior year |
10 | % | 8 | % | ||||||
Sales and marketing expenses consist primarily of the costs of personnel involved in the sales and marketing process, sales commissions, advertising and promotional materials, sales facilities expense, trade shows, and seminars.
Sales and marketing expense fluctuated due to the following (in thousands):
| |
Change From 2009 to 2010 |
Change From 2008 to 2009 |
||||||
|---|---|---|---|---|---|---|---|---|
Increased payroll and related |
$ | 2,309 | $ | 7,202 | ||||
Increased (decreased) travel and entertainment |
2,131 | (1,710 | ) | |||||
Increased (decreased) marketing |
1,213 | (211 | ) | |||||
Increased allocation-in of facility and infrastructure expenses |
1,143 | 516 | ||||||
Decreased outside services |
(309 | ) | (389 | ) | ||||
Decreased bad debt and broker fees |
(215 | ) | (422 | ) | ||||
Various other items |
141 | (187 | ) | |||||
Total change |
$ | 6,413 | $ | 4,799 | ||||
The dollar amount increase in expense in 2010 and 2009 reflects the growth of our sales and marketing efforts. As we continue to expand our sales and marketing efforts internationally, we have grown our headcount to 203 at December 31, 2010 from 185 and 181 (9 employees from the Tamale acquisition) at December 31, 2009 and 2008, respectively, resulting in an increase in payroll related costs and allocation-in of facility and infrastructure expenses in 2010 and 2009.
After hosting a road show in lieu of the Advent client conference in 2009, we resumed holding our client conference and offsite meetings for our sales groups in 2010. The costs associated with these events contributed to the fluctuations in travel and entertainment, and marketing costs in 2010 and 2009.
The decrease in outside services during 2010 primarily reflected the renegotiation of contract terms associated with a vendor as well as cost control measures implemented in 2009. In addition, as fewer accounts were sent to collections during 2010 and 2009, we experienced a corresponding decrease in bad debt expense during these periods.
In 2011, we expect sales and marketing expenses to increase in dollar amount but remain relatively flat as a percentage of total net revenues compared with 2010, as we will incur additional headcount and travel expenses to support our geographical expansion.
60
Product Development
| |
2010 | 2009 | 2008 | |||||||
|---|---|---|---|---|---|---|---|---|---|---|
| |
(in thousands, except percentages) |
|||||||||
Product development |
$ | 51,416 | $ | 48,443 | $ | 42,897 | ||||
Percent of total net revenues |
18 | % | 19 | % | 18 | % | ||||
Change over prior year |
$ | 2,973 | $ | 5,546 | ||||||
Percent change over prior year |
6 | % | 13 | % | ||||||
Product development expenses consist primarily of salary and benefits for our development staff as well as contractors' fees and other costs associated with the enhancements of existing products and services and development of new products and services. We expense costs incurred to develop computer software products until technological feasibility is reached for the products. Once technological feasibility is reached, all software costs are capitalized until the product is made available for general release to customers. The capitalized costs are amortized using the greater of the ratio of the product's current gross revenues to the total of current expected gross revenues or on a straight-line basis over the software's estimated economic life of approximately three years.
We invested 18%, 19% and 18% of our revenues in product development during 2010, 2009 and 2008, respectively. Product development expenses fluctuated due to the following (in thousands):
| |
Change From 2009 to 2010 |
Change From 2008 to 2009 |
||||||
|---|---|---|---|---|---|---|---|---|
Increased payroll and related |
$ | 2,071 | $ | 6,889 | ||||
Increased allocation-in of facility and infrastructure expenses |
1,244 | 6 | ||||||
Decreased (increased) capitalization of product development |
750 | (587 | ) | |||||
Increased computers and telecommunications |
58 | 203 | ||||||
Decreased outside services |
(1,186 | ) | (927 | ) | ||||
Various other items |
36 | (38 | ) | |||||
Total change |
$ | 2,973 | $ | 5,546 | ||||
The increases in product development expenses during fiscal 2010 and 2009 were primarily due to increases in payroll and related costs resulting from headcount additions to help continue the enhancement of our existing product suite including new versions of Geneva, APX, Axys, Moxy, Advent Rules Manager, Advent Revenue Center, Partner and Tamale RMS. Headcount increased to 287 (7 employees from the Goya AS acquisition in March 2010) at December 31, 2010, from 279 (50 individuals from third party contractor status to employee status in our new Beijing office in December 2009) and 216 (23 employees from the Tamale acquisition in October 2008) at December 31, 2009 and 2008, respectively. Consequently, we allocated more facility and infrastructure costs in 2010 to our product development department as a result of the increased headcount. Since the majority of the headcount additions for 2009 occurred in December, allocation-in of facility and infrastructure expenses was consistent between 2008 and 2009.
The fluctuations in the capitalization of our product development costs is attributable to the timing of product releases during fiscal 2010 and 2009 as we capitalized $2.2 million of costs during fiscal 2010 primarily associated with new releases of Geneva, Axys, Moxy, Partner and Revenue Center. In fiscal 2009, we capitalized $3.0 million of costs in fiscal 2009 associated with Geneva, APX, Axys, Partner, Revenue Center and Rules Manager.
61
These increases were partially offset by the decrease in outside service costs in 2010 and 2009, as we converted third party contractors in China to employees during the fourth quarter of 2009 and utilized an outside service provider to assist in the development of our Geneva product in 2008.
We expect product development expenses to increase in dollar amount in 2011 but to remain at approximately 18% of revenues in 2011.
General and Administrative
| |
2010 | 2009 | 2008 | |||||||
|---|---|---|---|---|---|---|---|---|---|---|
| |
(in thousands, except percentages) |
|||||||||
General and administrative |
$ | 37,707 | $ | 36,107 | $ | 35,887 | ||||
Percent of total net revenues |
13 | % | 14 | % | 15 | % | ||||
Change over prior year |
$ | 1,600 | $ | 220 | ||||||
Percent change over prior year |
4 | % | 1 | % | ||||||
General and administrative expenses consist primarily of personnel costs for information technology, finance, administration, operations and general management, as well as legal and accounting expenses.
General and administrative expenses fluctuated due to the following (in thousands):
| |
Change From 2009 to 2010 |
Change From 2008 to 2009 |
||||||
|---|---|---|---|---|---|---|---|---|
Increased facilities |
$ | 2,470 | $ | 1,059 | ||||
Increased payroll and related |
1,157 | 590 | ||||||
Increased (decreased) travel and entertainment |
520 | (191 | ) | |||||
Increased depreciation |
91 | 534 | ||||||
Increased allocation-out of facility and infrastructure expenses |
(2,305 | ) | (487 | ) | ||||
Decreased computers and telecom |
(328 | ) | (84 | ) | ||||
Decreased legal and professional |
(237 | ) | (1,115 | ) | ||||
Various other items |
232 | (86 | ) | |||||
Total change |
$ | 1,600 | $ | 220 | ||||
The increase in total general and administrative expenses in absolute dollars in 2010 and 2009 was primarily due to the increases in facilities costs related to our new facilities in New York and Boston and, to a lesser extent, our new offices in Beijing which we opened during the fourth quarter of 2009, and Singapore which we opened during the second quarter of 2010. During 2009, we signed lease agreements for our new facilities in New York City and Boston and commenced the build-out of those facilities in the first quarter of 2010. We continued to occupy our former facilities in New York and Boston until the build-out of our new facilities was completed. As a result, we incurred rent and utilities expense in both our former and new facilities. We completed the build-out of our new facilities in New York and Boston in May and August 2010, respectively, and moved our operations to consolidate our facility space in both locations.
Payroll and other related costs increased during fiscal 2010 as a result of lower capitalization of payroll costs associated with our internally developed software projects, higher bonus costs and higher salary expense due to annual merit increases. Headcount increased slightly to 161 at December 31, 2010 from 158 at December 31, 2009. The increase in travel and entertainment costs during 2010 is primarily due to higher travel-related activity by our general and administrative personnel associated with the growth of our business, international expansion and our client conference. These cost increases were partially offset by the allocation-out of corporate expenses to other departments. Corporate
62
expenses, such as facility and information costs, are initially recognized in our general and administrative department and then allocated out to other departments based on headcount. As headcount in our other departments grew at a higher rate during the past year than our general and administrative department, we allocated-out more facility and information technology costs resulting in less general and administrative expense during 2010. In addition, we reduced computers and telecom expense from lower computer supply expense and reduced legal and professional fees resulting from lower accounting fees for external audit.
Payroll and other related costs increased during fiscal 2009 due to headcount additions partially offset by a decrease from lower severance costs as we incurred severance costs associated with our former Chief Financial Officer during the third quarter of 2008. Headcount remained flat between December 31, 2009 and December 31, 2008 at 158, but was higher on average year-over-year as a result of our Tamale acquisition in October 2008. Additionally, depreciation was higher in 2009 as a result of a full year's depreciation of assets from the Tamale acquisition, which we acquired on October 2008 and accelerated depreciation associated with the planned exit of our facility in New York City in 2010. These cost increases were partially offset by a decrease in legal and professional fees as a result of lower accounting fees for external audit and Sarbanes-Oxley vendors, and lower legal fees. In addition, we incurred an increase in the allocation-out of facility and infrastructure expenses to other departments associated with higher allocable expenses (information technology and facilities charges) in 2009 and lower recruiting fees from a lower volume of external recruiting activities.
Amortization of Other Intangibles
| |
2010 | 2009 | 2008 | |||||||
|---|---|---|---|---|---|---|---|---|---|---|
| |
(in thousands, except percentages) |
|||||||||
Amortization of other intangibles |
$ | 1,272 | $ | 1,666 | $ | 1,160 | ||||
Percent of total net revenues |
0 | % | 1 | % | 0 | % | ||||
Change over prior year |
$ | (394 | ) | $ | 506 | |||||
Percent change over prior year |
(24 | )% | 44 | % | ||||||
Other intangibles represent non-technology related intangible assets. The decrease in amortization during 2010 is primarily due to the customer list from Advent Outsource Data Management, LLC ("Advent Outsource"), which we acquired in November 2002 becoming fully amortized in November 2009, partially offset by increased amortization from intangible assets associated with Goya AS, which we acquired in March 2010. The increase in amortization during 2009 was attributed to additional amortization from intangible assets acquired through the Tamale acquisition in October 2008.
Acquired In-Process Research and Development ("IPR&D")
| |
2010 | 2009 | 2008 | |||||||
|---|---|---|---|---|---|---|---|---|---|---|
| |
(in thousands, except percentages) |
|||||||||
Acquired in-process research and development |
$ | — | $ | — | $ | 400 | ||||
Percent of total net revenues |
0 | % | 0 | % | 0 | % | ||||
Change over prior year |
$ | — | $ | (400 | ) | |||||
During 2008, we expensed acquired IPR&D costs of $400,000 in connection with our Tamale acquisition. IPR&D was expensed as the acquired technology had not reached technological feasibility and had no alternative uses. Technological feasibility is defined as being equivalent to completion of a beta-phase working prototype in which there is no remaining risk relating to the development.
63
Restructuring Charges
| |
2010 | 2009 | 2008 | |||||||
|---|---|---|---|---|---|---|---|---|---|---|
| |
(in thousands, except percentages) |
|||||||||
Restructuring charges |
$ | 840 | $ | 130 | $ | 101 | ||||
Percent of total net revenues |
0 | % | 0 | % | 0 | % | ||||
Change over prior year |
$ | 710 | $ | 29 | ||||||
Percent change over prior year |
546 | % | 29 | % | ||||||
Restructuring initiatives have been implemented in our AIM segment in 2006 to reduce costs and improve operating efficiencies by better aligning our resources to near-term revenue opportunities. These initiatives have resulted in restructuring charges comprised primarily of costs related to properties abandoned in connection with facilities consolidation, related write-down of leasehold improvements, severance and associated employee termination costs related to headcount reductions. Our restructuring charges included accruals for estimated losses on facility costs based on our contractual obligations net of estimated sub-lease income. We reassess this liability periodically based on market conditions.
During 2010, we recorded restructuring charges of $0.8 million which primarily related to facility and exit costs associated with the relocation and consolidation of our facilities in New York City and Boston during the second and fourth quarter of 2010, respectively.
During 2009, we recorded restructuring charges of $0.1 million related to the present value amortization of facility exit obligations partially offset by adjustments to facility exit assumptions.
During 2008, we recorded additional restructuring charges which related to a partial lease surrender fee of $0.1 million to exit the data center portion of our facility space located at 303 2nd Street in San Francisco, California. These restructuring charges were partially offset by adjustments to our other facility exit assumptions.
For additional analysis of the components of the payments and charges made against the restructuring accrual in fiscal 2010, 2009, and 2008, see Note 8, "Restructuring Charges" to our consolidated financial statements.
At December 31, 2010, we had an accrual of $1.3 million of excess facility costs of which $0.8 million and $0.5 million are included in accrued liabilities and other long-term liabilities, respectively. The accrued facility exit costs of $1.3 million are stated at estimated fair value, net of estimated sub-lease income of $1.4 million. We expect to pay the remaining obligations in connection with vacated facilities over the remaining lease terms, which will expire on various dates through 2012.
Interest Expense
| |
2010 | 2009 | 2008 | |||||||
|---|---|---|---|---|---|---|---|---|---|---|
| |
(in thousands, except percentages) |
|||||||||
Interest expense |
$ | (54 | ) | $ | (484 | ) | $ | (584 | ) | |
Percent of total net revenues |
0 | % | 0 | % | 0 | % | ||||
Change over prior year |
$ | 430 | $ | 100 | ||||||
Percent change over prior year |
(89 | )% | (17 | )% | ||||||
The decrease in interest expense of $0.4 million during 2010 resulted from zero debt outstanding during the period, compared to a debt balance of up to $25 million in 2009.
The decrease in interest expense of $0.1 million during 2009 reflects the impact of a lower interest rate and a smaller amount of debt being outstanding during the year in 2009 compared to 2008. In November 2008, we drew down $25.0 million against our Credit Facility, which bore interest at the
64
Wells Fargo prime rate of 4.0%. During the first half of 2009 the Company repaid the balance of $20.0 million.
Interest Income and Other Expense, net
| |
2010 | 2009 | 2008 | |||||||
|---|---|---|---|---|---|---|---|---|---|---|
| |
(in thousands, except percentages) |
|||||||||
Interest income and other expense, net |
$ | (841 | ) | $ | (332 | ) | $ | 369 | ||
Percent of total net revenues |
0 | % | 0 | % | 0 | % | ||||
Change over prior year |
$ | (509 | ) | $ | (701 | ) | ||||
Percent change over prior year |
153 | % | (190 | )% | ||||||
Interest income and other expense, net consists of interest income, realized gains and losses on investments and foreign currency gains and losses.
Interest income and other expense, net fluctuated due to the following (in thousands):
| |
Change From 2009 to 2010 |
Change From 2008 to 2009 |
||||||
|---|---|---|---|---|---|---|---|---|
Increase (decrease) in interest income |
$ | 105 | $ | (900 | ) | |||
Decrease (increase) in foreign currency losses |
(557 | ) | 205 | |||||
Various other items |
(57 | ) | (6 | ) | ||||
Total change |
$ | (509 | ) | $ | (701 | ) | ||
The increase in interest income during 2010 reflects higher cash and investment balances in 2010 compared to the same periods in 2009. Declining market interest rates and a conservative investment portfolio contributed to the decrease in interest income during 2009, despite our higher overall cash balance.
Foreign exchange losses increased during 2010 as the US dollar strengthened against the Pound Sterling, the Euro and other foreign currencies in 2010 and decreased during 2009 as the US dollar weakened against foreign currencies in 2009.
Gain on Sale of Equity Investments, net
| |
2010 | 2009 | 2008 | |||||||
|---|---|---|---|---|---|---|---|---|---|---|
| |
(in thousands, except percentages) |
|||||||||
Gain on sale of equity investments, net |
$ | — | $ | 2,056 | $ | 3,393 | ||||
Percent of total net revenues |
0 | % | 1 | % | 1 | % | ||||
Change over prior year |
$ | (2,056 | ) | $ | (1,337 | ) | ||||
Percent change over prior year |
(100 | )% | (39 | )% | ||||||
Gain on sale of equity investments includes realized gains on sale and impairment losses of our investments in privately held companies. The gain in 2009 reflects the second and final deferred contingent payment of $2.1 million related to the sale of our ownership in LatentZero Limited ("LatentZero") to Fidessa group plc (formerly royalblue group plc) while the gain in 2008 reflects the initial deferred contingent payment of $3.4 million that we received in April 2008. The sale occurred in 2007 and total payments received by Advent from the sale of its LatentZero ownership were $15.4 million.
65
Provision For Income Taxes
| |
2010 | 2009 | 2008 | |||||||
|---|---|---|---|---|---|---|---|---|---|---|
| |
(in thousands, except percentages) |
|||||||||
Provision for income taxes |
$ | 11,091 | $ | 8,345 | $ | 3,857 | ||||
Effective tax rate |
31 | % | 29 | % | 18 | % | ||||
Our 2009 and 2010 effective tax rates differ from the statutory rate primarily due to the favorable effects of federal and state research credits. The effective tax rate for 2010 is higher than 2009 primarily due to the 2010 inclusion of unfavorable adjustments to state deferred tax assets resulting from a reduction in our anticipated future income apportionment to California due to a change in tax law taking effect in 2011.
We continue to maintain a valuation allowance against deferred tax assets relating to investment reserves and certain state net operating losses because the likelihood of their realization is not more likely than not. We expect our effective tax rate for fiscal 2011 to be in the range of 30% to 35% of profit before taxes. However, we expect our cash payments for federal income taxes to remain nominal through 2012 as we have significant net operating losses and tax credit carryforwards to utilize against current income taxes.
Discontinued Operation
| |
2010 | 2009 | 2008 | |||||||
|---|---|---|---|---|---|---|---|---|---|---|
| |
(in thousands, except percentages) |
|||||||||
Net revenues |
$ | — | $ | 18,859 | $ | 26,948 | ||||
Change over prior year |
$ | (18,859 | ) | $ | (8,089 | ) | ||||
Percent change over prior year |
(100 | )% | (30 | )% | ||||||
Income (loss) from operation of discontinued operation (net of applicable taxes of $(46), $1,337, and $1,097, respectively) |
$ |
(166 |
) |
$ |
2,486 |
$ |
1,579 |
|||
Gain on disposal of discontinued operation (net of applicable taxes of $0, $4,302, and $0, respectively) |
— | 13,623 | — | |||||||
Net income (loss) from discontinued operation |
$ | (166 | ) | $ | 16,109 | $ | 1,579 | |||
Change over prior year |
$ |
(16,275 |
) |
$ |
14,530 |
|||||
Percent change over prior year |
(101 | )% | 920 | % | ||||||
Net revenues of $18.9 million and income from operation of $2.5 million from our discontinued operation, MicroEdge, for fiscal 2009 represents revenues and expenses for the nine months ending September 30, 2009. In conjunction with the sale of MicroEdge on October 1, 2009, we recorded a gain on sale of discontinued operation of $13.6 million, net of applicable taxes. See Note 4, "Discontinued Operation", for further discussion on the divestiture of MicroEdge.
Associated with the sale of MicroEdge, $3.0 million of the proceeds are being held in escrow. The escrow period will lapse in 2011 and our discontinued operation will record any gain on sale associated with escrow amounts released to Advent, if and when realized.
66
Liquidity and Capital Resources
Cash, Cash Equivalents, Marketable Securities and Cash Flows
The following is a summary of our cash, cash equivalents and marketable securities (in thousands):
| |
December 31 | ||||||
|---|---|---|---|---|---|---|---|
| |
2010 | 2009 | |||||
Cash and cash equivalents |
$ | 81,948 | $ | 57,877 | |||
Short-term and long-term marketable securities |
$ | 70,075 | $ | 59,768 | |||
Cash and cash equivalents, short-term and long-term marketable securities primarily consist of money market mutual funds, US government and US Government Sponsored Entities (GSE's) and high credit quality corporate debt securities. Cash and cash equivalents are comprised of highly liquid investments purchased with an original or remaining maturity of 90 days or less at the date of purchase. Our short-term and long-term marketable securities are classified as available-for-sale, with long-term investments having a maturity date greater than one year from the end of the period.
The table below, for the periods indicated, provides selected consolidated cash flow information (in thousands):
| |
Fiscal Years | |||||||||
|---|---|---|---|---|---|---|---|---|---|---|
| |
2010 | 2009 | 2008 | |||||||
Net cash provided by operating activities from continuing operations |
$ | 76,218 | $ | 72,427 | $ | 70,337 | ||||
Net cash used in investing activities from continuing operations |
$ | (34,281 | ) | $ | (64,964 | ) | $ | (48,788 | ) | |
Net cash used in financing activities from continuing operations |
$ | (17,657 | ) | $ | (27,017 | ) | $ | (27,274 | ) | |
Net cash provided by (used in) operating activities from discontinued operation |
$ | (377 | ) | $ | 2,621 | $ | 6,650 | |||
Net cash provided by (used in) investing activities from discontinued operation |
$ | — | $ | 26,358 | $ | (1,417 | ) | |||
Cash Flows from Operating Activities for Continuing Operations
Our cash flows from operating activities represent the most significant source of funding for our operations. The major uses of our operating cash include funding payroll (salaries, commissions, bonuses and benefits), general operating expenses (marketing, travel, computer and telecommunications, legal and professional expenses, and office rent) and cost of revenues. Our cash provided by operating activities generally follows the trend in our net revenues, operating results and bookings.
Our cash provided by operating activities from continuing operations of $76.2 million during fiscal 2010 was primarily the result of our net income and non-cash charges including stock-based compensation and depreciation and amortization. Cash inflows resulting from changes in assets and liabilities included increases in accrued liabilities and deferred revenues. The increase in accrued liabilities reflects fiscal 2010 liabilities including year-end bonuses, commissions, and payroll taxes and the increase in deferred revenue reflects customer renewals and additional bookings. Under the term model, we generally bill and collect for a term agreement in equal installments in advance of each annual period. These amounts are deferred at billing and recognized over the annual term period. Cash outflows resulting from changes in assets and liabilities include an increase to accounts receivable and a decrease in income taxes payable. Several new contracts were executed in December 2010 and collected in January 2011, resulting in an increase in accounts receivable at December 31, 2010 compared to December 31, 2009. During 2010, Advent utilized tax deductions from stock-based compensation to reduce income taxes payable by $3.9 million. As a result, cash flow from operating activities includes a
67
cash outflow of $3.9 million related to the reduction of income taxes payable resulting from excess tax benefit deductions.
Our cash provided by operating activities from continuing operations of $72.4 million during fiscal 2009 was primarily the result of our net income of $20.8 million and non-cash charges including stock-based compensation of $18.2 million and depreciation and amortization of $16.7 million, partially offset by a gain from our equity investment activity of $2.1 million. Cash flows resulting from changes in assets and liabilities included increases in deferred revenue and accrued liabilities. The increase in deferred revenue reflected customer renewals and additional bookings. The increase in accrued liabilities primarily reflects an increase in accrued bonuses. Other changes in assets and liabilities include a decrease in accounts receivable, which primarily reflects an overall improvement in collections during 2009 of invoices billed in our previous fourth quarter. Days' sales outstanding were 62, 60, 55, and 61 days during the first, second third and fourth quarters of 2009, respectively, compared to 67, 60, 70 and 64 days during the first, second, third and fourth quarters of 2008.
Cash provided by operating activities from continuing operations of $70.3 million during fiscal 2008 was primarily the result of our net income of $17.3 million and non-cash charges including stock-based compensation of $16.1 million, depreciation and amortization of $12.7 million, partially offset by a gain from our equity investment activity of $3.4 million. Cash flows resulting from changes in assets and liabilities included increases in deferred revenue and accounts payable. Other changes in assets and liabilities include a decrease in accrued liabilities, which reflected a decrease in accrued commissions and restructuring expenses.
We expect that cash provided by operating activities may fluctuate in future periods as a result of a number of factors including fluctuations in our net revenues and operating results, new term license bookings that increase deferred revenue, collection of accounts receivable, and timing of payments. Additionally, as we anticipate tax benefits relating to excess stock-based compensation deductions to be approximately $6 million for fiscal 2011, we expect operating cash flow to be between $81 million to $85 million for fiscal 2011.
Cash Flows from Investing Activities for Continuing Operations
Net cash used in investing activities from continuing operations of $34.3 million in 2010 reflects purchases of marketable securities of $46.5 million, capital expenditures of $17.4 million primarily related to the build-out of our new facilities in New York and Boston and, to a lesser extent, computer and software equipment purchases, net cash used of $4.7 million related to the acquisition of Goya AS and capitalized software development costs of $2.1 million. These expenditures were partially offset by proceeds received from the sales and maturities of short-term marketable securities of $36.5 million.
Net cash used in investing activities from continuing operations of $65.0 million in 2009 reflects purchases of short-term and long-term marketable securities of $60.0 million, capital expenditures of $4.6 million primarily related to the purchase of computer equipment, external software and capitalization of costs associated with internal use software, capitalized software development costs of $2.9 million and cash used for acquisition of $0.2 million related to an earn out payment to East Circle Solutions. These expenditures were partially offset by the receipt of $2.1 million for the final deferred contingent consideration from the sale of our ownership interest in LatentZero and a net decrease in our restricted cash balance of $0.6 million. During the third quarter of 2009, we reduced our restricted cash balance as a result of the reduction of the letter of credit associated with the lease of our San Francisco headquarters and in the fourth quarter of 2009 we increased our restricted cash balance to secure a letter of credit associated with the lease of our future New York City office.
Net cash used in investing activities from continuing operations of $48.8 million in 2008 reflects cash used for the acquisition of Tamale totaling $27.8 million, capital expenditures of $21.9 million primarily related to the build-out of additional space at our San Francisco headquarters, and capitalized
68
software development costs of $2.3 million, partially offset by the receipt of $3.4 million for the initial deferred contingent consideration of our sale of our ownership to LatentZero.
We expect capital expenditures to be between $12 million to $15 million for fiscal 2011, which includes our normal rate of capital expenditure plus additional investment for the build-out of our China office, enhancements to our IT infrastructure including a significant upgrade to our enterprise software system and OnDemand infrastructure, both domestically and in our EMEA region.
Cash Flows from Financing Activities for Continuing Operations
Net cash used in financing activities from continuing operations of $17.7 million in 2010 reflects the repurchase of approximately 1.7 million shares of our common stock for $35.9 million and payments totaling $5.5 million to satisfy withholding taxes on equity awards that are net share settled. These financing cash outflows were partially offset by cash received from the exercise of employee stock options of $14.0 million, proceeds from the issuance of common stock under the employee stock purchase plan of $5.8 million and tax benefits relating to excess stock-based compensation deductions of $3.9 million. During 2010, Advent utilized tax deductions from stock-based compensation to reduce income taxes payable by $3.9 million. As a result, cash flow from financing activities includes a cash inflow of $3.9 million related to the reduction of income taxes payable resulting from excess tax benefit deductions.
Net cash used in financing activities from continuing operations of $27.0 million in 2009 reflected the repayment of $25.0 million on our credit facility, repurchase of 1.4 million shares of our common stock for $14.6 million, and payments totaling $2.2 million to satisfy withholding taxes on equity awards that are net share settled. This was partially offset by cash received from the exercise of employee stock options of $8.6 million, proceeds of $5.6 million from the issuance of common stock under the Company's employee stock purchase plan and tax benefits relating to excess stock-based compensation deductions of $0.5 million.
Net cash used in financing activities from continuing operations of $27.3 million in 2008 reflected the repurchase of 4.7 million shares of our common stock for $61.6 million and withholding taxes paid of $2.1 million associated with the exercise of stock-settled stock appreciation rights and vesting of restricted stock units, partially offset by the draw-down of $25.0 million against our credit facility, proceeds of $6.1 million received from the exercise of employee stock options, $5.0 million from the issuance of common stock under the employee stock purchase plan and tax benefits relating to excess stock-based compensation deductions of $0.3 million.
We expect tax benefits relating to excess stock-based compensation deductions to be approximately $6 million for fiscal 2011.
Cash Flows from Operating Activities for Discontinued Operation
Our cash used in operating activities from discontinued operation of $0.4 million in 2010 was primarily the result of its net loss. Cash flows resulting from changes in assets and liabilities included decreases in prepaid and other assets, accrued liabilities and income taxes payable. The decrease in accrued liabilities and income taxes payable primarily reflects cash payments of sales and income taxes.
Our cash provided by operating activities from discontinued operation of $2.6 million in 2009 was primarily the result of our income from discontinued operation for the nine months ended September 30, 2009 of $2.5 million and non-cash charges including stock-based compensation of $0.3 million and depreciation and amortization of $0.9 million. Cash flows resulting from changes in assets and liabilities included decreases in accounts receivable, accounts payable, accrued liabilities and deferred revenue. The decrease in accounts receivable primarily reflects an improvement in collections during the first nine months of 2009 of invoices billed in our previous fourth quarter. Days' sales
69
outstanding were 51, 55 and 51 days during the first, second and third quarters of 2009, respectively, compared to 52, 52, 52 and 59 days during the first, second and third and fourth quarters of 2008. The decrease in accounts payable and accrued liabilities reflects cash payments of fiscal 2008 liabilities including year-end payables and bonuses, commissions and payroll taxes. The decrease in deferred revenue reflects the recognition of revenue and lower level of bookings during the nine months ended September 30, 2009.
Our cash provided by operating activities from discontinued operation of $6.7 million in 2008 was primarily the result of our net income of $1.6 million and non-cash charges including stock-based compensation of $0.7 million, depreciation and amortization of $1.8 million and a non-cash impairment charge of $0.8 million. Cash flows resulting from changes in assets and liabilities include increases in accounts receivable and deferred revenue. The increase in accounts receivable reflected strong revenue growth in the fourth quarter of 2008 and an increase in days' sales outstanding. The increase in deferred revenue reflected an increased level of bookings in 2008.
Cash Flows from Investing Activities for Discontinued Operation
Net cash provided by investing activities from discontinued operation of $26.4 million in 2009 reflects cash received from the sale of MicroEdge of $27.1 million, partially offset by capital expenditures of $0.6 million primarily related to the purchase of computer equipment and capitalization of costs associated with internal use software, and capitalized software development costs of $0.1 million.
Net cash used in investing activities from discontinued operation of $1.4 million in 2008 reflects capital expenditures of $1.4 million primarily related to the purchase of computer equipment and software, and capitalized software development costs of $0.1 million.
Working Capital
At December 31, 2010, we had working capital of $45.8 million, compared to negative working capital of $(6.7) million at December 31, 2009. The increase in our working capital at December 31, 2010 was primarily due to the generation of operating cash flow of $76.2 million, and the shift of $28.5 million of marketable securities from long-term to short-term, partially offset by common stock repurchases of $35.9 million, capital expenditures of $17.4 million, and cash paid to acquire Goya AS of $4.7 million. Our negative working capital in 2009 was due to our common stock repurchases of $14.6 million, our repayment on our credit facility of $25.0 million, our purchase of long-term marketable securities of $28.5 million and our deferred revenue balance, which reflects our term pricing model. Excluding deferred revenues and deferred taxes, we had working capital of $177.3 million at December 31, 2010, compared to $118.4 million at December 31, 2009.
Credit Facility and Expiration
In February 2007, Advent and certain of our domestic subsidiaries entered into a senior secured credit facility agreement (the "Credit Facility") with Wells Fargo Foothill, Inc. (the "Lender"). Under the Credit Facility, the Lender provided the Company with a revolving line of credit up to an aggregate amount of $75 million, subject to a borrowing base formula, to provide backup liquidity for general corporate purposes, including stock repurchases, or investment opportunities for a period of three years. During its three-year term, we utilized the Credit Facility to facilitate the timing of stock repurchases.
In February 2010, the Credit Facility expired and we elected not to renew the Credit Facility due to the limited expected use of the Credit Facility. We believe our existing cash, cash equivalents, short-term and long-term marketable securities, together with cash expected to be generated from operations, will be sufficient to fund our operating activities, anticipated capital expenditures and
70
authorized stock repurchases. Although the expiration of the Credit Facility may restrict our liquidity, we believe the costs associated with the Credit Facility would exceed the anticipated benefit of the additional liquidity. For example, our interest expense decreased by $0.4 million during 2010.
Common Stock Repurchases
Advent's Board has approved common stock repurchase programs authorizing management to repurchase shares of the Company's common stock. The timing and actual number of shares subject to repurchase are at the discretion of Advent's management and are contingent on a number of factors and limitations, including the price of Advent's stock, corporate and regulatory requirements, alternative investment opportunities and other market conditions. The stock repurchase programs specify a maximum number of shares subject to repurchase, do not have an expiration date and may be limited or terminated at any time without prior notice. Repurchased shares are returned to the status of authorized and unissued shares of common stock. The purchases are funded from combination of available working capital and debt.
The purchase price for the shares of our common stock repurchased was reflected as a reduction to stockholders' equity. In accordance with ASC 505-30, "Treasury Stock", we are required to allocate the purchase price of the repurchased shares as (i) an increase to accumulated deficit and (ii) a reduction of common stock and additional paid-in capital. Issuance of common stock and the tax benefit related to employee stock option plans are recorded as an increase to common stock and additional paid-in capital. As a result of future repurchases, we may continue to report an accumulated deficit included in stockholders' equity in our consolidated balance sheets.
The following is a summary of the repurchase programs authorized by the Board since fiscal 2008 (in thousands):
Date of Authorization
|
Number of Shares Authorized |
||||
|---|---|---|---|---|---|
May 2008 |
2,000 | ||||
October 2008 |
6,000 | ||||
May 2010 |
2,000 | ||||
Total |
10,000 | ||||
The following is a summary of the Company's repurchase activity since fiscal 2008 (in thousands, except per share data):
Fiscal Year
|
Total Number of Shares Repurchased |
Cost | Average Price Paid Per Share |
||||||||
|---|---|---|---|---|---|---|---|---|---|---|---|
2008 |
4,662 | $ | 61,572 | $ | 13.21 | ||||||
2009 |
1,380 | $ | 14,578 | $ | 10.57 | ||||||
2010 |
1,670 | $ | 35,881 | $ | 21.48 | ||||||
Total |
7,712 | $ | 112,031 | $ | 14.53 | ||||||
All share and per share information has been adjusted to reflect the two-for-one stock split effected in the form of 100% stock dividend that was announced on December 13, 2010 and distributed on January 18, 2011.
At December 31, 2010, there remained approximately 2.3 million shares authorized by the Board for repurchase.
71
Off-Balance Sheet Arrangements and Contractual Obligations
The following table summarizes our contractual cash obligations as of December 31, 2010 (in thousands):
| |
Fiscal Years | |
|
|||||||||||||||||||
|---|---|---|---|---|---|---|---|---|---|---|---|---|---|---|---|---|---|---|---|---|---|---|
| |
2011 | 2012 | 2013 | 2014 | 2015 | Thereafter | Total | |||||||||||||||
Operating lease obligations, net of sub-lease income |
$ | 8,900 | $ | 7,564 | $ | 6,983 | $ | 7,345 | $ | 7,539 | $ | 27,891 | $ | 66,222 | ||||||||
On October 1, 2009, we completed the sale of our MicroEdge subsidiary. See Note 4, "Discontinued Operation", to the consolidated financial statements for a description of the principal terms of the divestiture. With the exception of the MicroEdge facilities in New York City, the leases related to MicroEdge have been transferred to the Purchaser.
In connection with the sale of MicroEdge, the Company entered into a sub-lease agreement with Microedge LLC, whereby Microedge LLC will sub-lease approximately 24,000 square feet of the 29,000 square feet of office space located at 619 West 54th Street in New York, New York from the Company. MicroEdge LLC will sub-lease the premises for two years with the option to extend the sub-lease term through the end of the lease term in 2018. The sub-lease agreement became effective upon the close of sale of MicroEdge on October 1, 2009. As of December 31, 2010, MicroEdge had operating lease commitments totaling $8.6 million, less sublease income of $0.7 million, which are not reflected in the above table.
At December 31, 2010 and 2009, we had a gross liability of $9.5 million and $7.5 million, respectively, for uncertain tax positions associated with the adoption of ASC 740-10-25, "Income Taxes—Overall—Recognition". If recognized, the impact on our statement of operations would be to decrease our income tax expense and increase our net income by $7.9 million. The impact on net income reflects the liabilities for unrecognized tax benefits net of the federal tax benefit of state income tax items. Since almost all of this liability relates to reserves against deferred tax assets that we do not expect to utilize in the short term, we cannot estimate the timing of potential future cash settlements and have not included any estimates in the table of contractual cash obligations above. Our cash payments for federal income taxes will continue to be nominal through 2012 as we have significant net operating losses and tax credit carryforwards to utilize.
At December 31, 2010 and 2009, we did not have any relationships with unconsolidated entities or financial partnerships, such as entities often referred to as structured finance or special purpose entities, which would have been established for the purpose of facilitating off-balance sheet arrangements or other contractually narrow or limited purposes. As such, we are not materially exposed to any financing, liquidity, market or credit risk that could arise if we had engaged in such relationships.
Other Liquidity and Capital Resources Considerations
As noted above, we expect our cash payments for federal income taxes to remain nominal over the next few years as we have significant net operating losses and tax credit carryforwards to utilize against current income taxes. However, our cash payments for federal income taxes could increase as early as fiscal 2013.
Our liquidity and capital resources in any period could also be affected by the exercise of outstanding employee stock options and SARs, and issuance of common stock under our employee stock purchase plan. The resulting increase in the number of outstanding shares from this and from the issuance of common stock from our RSUs could also affect our per share results of operations.
72
However, we cannot predict the timing or amount of proceeds from the exercise of these securities, or whether they will be exercised at all.
We expect that for the next year, our operating expenses will continue to constitute a significant use of cash flow. In addition, we may use cash to fund other acquisitions, repurchase additional common stock, or invest in other businesses, when opportunities arise. Based upon the predominance of our revenues from recurring sources, term license bookings performance and current expectations, we believe that our cash and cash equivalents, and cash generated from operations will be sufficient to satisfy our working capital needs, capital expenditures, investment requirements, stock repurchases and financing activities for the next year. However, if we identify opportunities that exceed our current expectation, we may choose to seek additional capital resources through debt or equity financing. However, such financing may not be available at all particularly in the current economic environment, or if available may not be obtainable on terms favorable to us and could be dilutive.
Recent Accounting Pronouncements
Refer to Note 1, "Summary of Significant Accounting Policies", to our consolidated financial statements for a discussion of recent accounting standards and pronouncements.
Item 7A. Quantitative and Qualitative Disclosures About Market Risk
We are exposed to financial market risks, including changes in foreign currency exchange rates and interest rates. Historically, much of our revenues and capital spending was transacted in US dollars. However, since the acquisitions of Advent Denmark, Advent Norway, Advent Sweden, Advent Netherlands, and Advent Europe's remaining distributors in the United Kingdom and Switzerland, whose service and certain license revenues and capital spending, are transacted in local country currencies, we have greater exposure to foreign currency fluctuations. Additionally as of December 31, 2010, $39.9 million of goodwill from the acquisition of these entities are denominated in foreign currency. Therefore a hypothetical change of 10% could increase or decrease our assets and equity by $4.0 million and could increase or decrease our consolidated results of operations or cash flows by approximately $0.5 million.
We maintain an investment portfolio of various holdings, types, and maturities. Our interest rate risk relates primarily to our investment portfolio, which consisted of $152.0 million in cash and cash equivalents, and short-term marketable securities as of December 31, 2010. Our short-term marketable securities are generally classified as available-for-sale and, consequently, are recorded on our consolidated balance sheet at fair value with unrealized gains or losses reported as a separate component of accumulated other comprehensive income. At any time, a rise in interest rates could have a material adverse impact on the fair value of our investment portfolio. Conversely, declines in interest rates could have a material impact on interest earnings of our investment portfolio. We do not currently hedge these interest rate exposures.
The following table presents hypothetical changes in fair value of our short-term marketable securities of $70.1 million at December 31, 2010. For December 31, 2010 the market changes reflect an immediate hypothetical parallel shifts in the yield curve of plus or minus 25 basis points ("BPS"), plus 50 BPS, and plus 100 BPS. For balances at December 31, 2010 the hypothetical fair values are as follows (in millions, except percentages):
| DECREASE IN INTEREST RATES | INCREASE IN INTEREST RATES | |||||||||
|---|---|---|---|---|---|---|---|---|---|---|
| -100 Basis Points | -50 Basis Points | -25 Basis Points | 25 Basis Points | 50 Basis Points | 100 Basis Points | |||||
| $70.2 | $70.0 | $69.9 | $69.8 | $69.7 | $69.6 | |||||
| 0.42% | 0.21% | 0.10% | -0.10% | -0.21% | -0.42% | |||||
73
We have also invested in several privately-held companies. These non-marketable investments are classified as other assets on our consolidated balance sheets. Our investments in privately-held companies could be affected by an adverse movement in the financial markets for publicly-traded equity securities, although the impact cannot be directly quantified. These investments are inherently risky as the market for the technologies or products these privately-held companies have under development are typically in the early stages and may never materialize. It is our policy to review investments in privately held companies on a regular basis to evaluate the carrying amount and economic viability of these companies. This policy includes, but is not limited to, reviewing each of the companies' cash position, financing needs, earnings/revenue outlook, operational performance, management/ownership changes and competition. The evaluation process is based on information that we request from these privately held companies. This information is not subject to the same disclosure regulations as US publicly traded companies, and as such, the basis for these evaluations is subject to timing and the accuracy of the data received from these companies.
Our investments in privately held companies are assessed for impairment when a review of the investee's operations indicates that a decline in value of the investment is other than temporary. Such indicators include, but are not limited to, limited capital resources, limited prospects of receiving additional financing, and prospects for liquidity of the related securities. Impaired investments in privately held companies are written down to estimated fair value. We estimate fair value using a variety of valuation methodologies. Such methodologies include comparing the private company with publicly traded companies in similar lines of business, applying revenue and price/earnings multiples to estimated future operating results for the private company and estimating discounted cash flows for that company. We could lose our entire investment in these companies. At December 31, 2010, our net investments in privately-held companies totaled $0.5 million. See Note 6, "Balance Sheet Detail", to our consolidated financial statements for further discussion.
74
Item 8. Financial Statements and Supplementary Data
MANAGEMENT'S REPORT ON INTERNAL CONTROL OVER FINANCIAL REPORTING
Management of the Company is responsible for establishing and maintaining adequate internal control over financial reporting as defined in Rules 13a-15(f) and 15d-15(f) under the Securities Exchange Act of 1934. The Company's internal control over financial reporting is a process designed to provide reasonable assurance regarding the reliability of financial reporting and the preparation of financial statements for external purposes in accordance with generally accepted accounting principles in the United States of America. Internal control over financial reporting includes those policies and procedures that (i) pertain to the maintenance of records that, in reasonable detail, accurately and fairly reflect the transactions and dispositions of assets of the Company; (ii) provide reasonable assurance that transactions are recorded as necessary to permit preparation of financial statements in accordance with generally accepted accounting principles in the United States of America, and that receipts and expenditures of the Company are being made only in accordance with authorizations of management and directors of the Company; and (iii) provide reasonable assurance regarding prevention or timely detection of unauthorized acquisition, use or disposition of the Company's assets that could have a material effect on the financial statements.
Because of its inherent limitations, internal control over financial reporting may not prevent or detect misstatements. Also, projections of any evaluation of effectiveness to future periods are subject to the risk that controls may become inadequate because of changes in conditions or that the degree of compliance with the policies or procedures may deteriorate.
The Company's management assessed the effectiveness of the Company's internal control over financial reporting as of December 31, 2010. In making this assessment, management used the criteria set forth by the Committee of Sponsoring Organizations of the Treadway Commission (COSO) in Internal Control—Integrated Framework. Based on management's assessment using the COSO criteria, management has concluded that the Company maintained effective internal control over financial reporting as of December 31, 2010.
The effectiveness of the Company's internal control over financial reporting as of December 31, 2010 has been audited by PricewaterhouseCoopers LLP, an independent registered public accounting firm, as stated in its report which is included herein.
| /s/ STEPHANIE G. DIMARCO Stephanie G. DiMarco Chief Executive Officer (Principal Executive Officer) |
/s/ JAMES S. COX James S. Cox Senior Vice President and Chief Financial Officer (Principal Financial Officer and Accounting Officer) |
75
REPORT OF INDEPENDENT REGISTERED PUBLIC ACCOUNTING FIRM
To the Board of Directors and Shareholders of Advent Software, Inc.:
In our opinion, the consolidated financial statements listed in the index appearing under Item 15(a)(1) present fairly, in all material respects, the financial position of Advent Software, Inc. and its subsidiaries at December 31, 2010 and December 31, 2009, and the results of their operations and their cash flows for each of the three years in the period ended December 31, 2010 in conformity with accounting principles generally accepted in the United States of America. In addition, in our opinion, the financial statement schedule appearing under item 15(a)(2) presents fairly, in all material respects, the information set forth therein when read in conjunction with the related consolidated financial statements. Also in our opinion, the Company maintained, in all material respects, effective internal control over financial reporting as of December 31, 2010, based on criteria established in Internal Control—Integrated Framework issued by the Committee of Sponsoring Organizations of the Treadway Commission (COSO). The Company's management is responsible for these financial statements and financial statement schedule, for maintaining effective internal control over financial reporting and for its assessment of the effectiveness of internal control over financial reporting, included in Management's Report on Internal Control over Financial Reporting. Our responsibility is to express opinions on these financial statements, on the financial statement schedule, and on the Company's internal control over financial reporting based on our integrated audits. We conducted our audits in accordance with the standards of the Public Company Accounting Oversight Board (United States). Those standards require that we plan and perform the audits to obtain reasonable assurance about whether the financial statements are free of material misstatement and whether effective internal control over financial reporting was maintained in all material respects. Our audits of the financial statements included examining, on a test basis, evidence supporting the amounts and disclosures in the financial statements, assessing the accounting principles used and significant estimates made by management, and evaluating the overall financial statement presentation. Our audit of internal control over financial reporting included obtaining an understanding of internal control over financial reporting, assessing the risk that a material weakness exists, and testing and evaluating the design and operating effectiveness of internal control based on the assessed risk. Our audits also included performing such other procedures as we considered necessary in the circumstances. We believe that our audits provide a reasonable basis for our opinions.
A company's internal control over financial reporting is a process designed to provide reasonable assurance regarding the reliability of financial reporting and the preparation of financial statements for external purposes in accordance with generally accepted accounting principles. A company's internal control over financial reporting includes those policies and procedures that (i) pertain to the maintenance of records that, in reasonable detail, accurately and fairly reflect the transactions and dispositions of the assets of the company; (ii) provide reasonable assurance that transactions are recorded as necessary to permit preparation of financial statements in accordance with generally accepted accounting principles, and that receipts and expenditures of the company are being made only in accordance with authorizations of management and directors of the company; and (iii) provide reasonable assurance regarding prevention or timely detection of unauthorized acquisition, use, or disposition of the company's assets that could have a material effect on the financial statements.
Because of its inherent limitations, internal control over financial reporting may not prevent or detect misstatements. Also, projections of any evaluation of effectiveness to future periods are subject to the risk that controls may become inadequate because of changes in conditions, or that the degree of compliance with the policies or procedures may deteriorate.
/s/PricewaterhouseCoopers LLP
San Jose, California
March 9, 2011
76
ADVENT SOFTWARE, INC.
CONSOLIDATED BALANCE SHEETS
(In thousands, except per share amounts)
| |
December 31 | ||||||||
|---|---|---|---|---|---|---|---|---|---|
| |
2010 | 2009 | |||||||
ASSETS |
|||||||||
Current assets: |
|||||||||
Cash and cash equivalents |
$ | 81,948 | $ | 57,877 | |||||
Short-term marketable securities |
70,075 | 31,273 | |||||||
Accounts receivable, net of allowance for doubtful accounts of $168 and $267, respectively |
49,960 | 44,246 | |||||||
Deferred taxes, current |
16,358 | 15,081 | |||||||
Prepaid expenses and other |
17,864 | 22,350 | |||||||
Current assets of discontinued operation |
— | 494 | |||||||
Total current assets |
236,205 | 171,321 | |||||||
Property and equipment, net |
41,524 | 33,945 | |||||||
Goodwill |
145,580 | 144,827 | |||||||
Other intangibles, net |
19,772 | 22,965 | |||||||
Long-term marketable securities |
— | 28,495 | |||||||
Deferred taxes, long-term |
33,591 | 40,502 | |||||||
Other assets |
12,059 | 10,142 | |||||||
Noncurrent assets of discontinued operation |
2,095 | 2,095 | |||||||
Total assets |
$ | 490,826 | $ | 454,292 | |||||
LIABILITIES AND STOCKHOLDERS' EQUITY |
|||||||||
Current liabilities: |
|||||||||
Accounts payable |
$ | 6,737 | $ | 4,708 | |||||
Accrued liabilities |
34,080 | 31,066 | |||||||
Deferred revenues |
147,896 | 140,186 | |||||||
Income taxes payable |
1,691 | 1,616 | |||||||
Current liabilities of discontinued operation |
165 | 719 | |||||||
Total current liabilities |
190,569 | 178,295 | |||||||
Deferred revenues, long-term |
6,337 | 5,879 | |||||||
Other long-term liabilities |
14,844 | 12,969 | |||||||
Noncurrent liabilities of discontinued operation |
5,228 | 5,115 | |||||||
Total liabilities |
216,978 | 202,258 | |||||||
Commitments and contingencies (See Note 11) |
|||||||||
Stockholders' equity: |
|||||||||
Preferred stock; $0.01 par value: 2,000 shares authorized; none issued |
— | — | |||||||
Common stock; $0.01 par value: 120,000 shares authorized; 51,974 and 51,734 shares issued and outstanding |
520 | 517 | |||||||
Additional paid-in capital |
411,600 | 386,365 | |||||||
Accumulated deficit |
(146,887 | ) | (145,584 | ) | |||||
Accumulated other comprehensive income |
8,615 | 10,736 | |||||||
Total stockholders' equity |
273,848 | 252,034 | |||||||
Total liabilities and stockholders' equity |
$ | 490,826 | $ | 454,292 | |||||
The accompanying notes are an integral part of these consolidated financial statements.
77
ADVENT SOFTWARE, INC.
CONSOLIDATED STATEMENTS OF OPERATIONS
(In thousands, except per share data)
| |
Years Ended December 31 | |||||||||||
|---|---|---|---|---|---|---|---|---|---|---|---|---|
| |
2010 | 2009 | 2008 | |||||||||
Net revenues: |
||||||||||||
Term license, maintenance and other recurring |
$ | 245,107 | $ | 222,759 | $ | 191,444 | ||||||
Perpetual license fees |
11,801 | 11,275 | 16,808 | |||||||||
Professional services and other |
26,593 | 25,474 | 29,632 | |||||||||
Total net revenues |
283,501 | 259,508 | 237,884 | |||||||||
Cost of revenues: |
||||||||||||
Term license, maintenance and other recurring |
51,261 | 46,823 | 43,798 | |||||||||
Perpetual license fees |
274 | 327 | 488 | |||||||||
Professional services and other |
28,901 | 29,777 | 34,158 | |||||||||
Amortization of developed technology |
6,374 | 5,618 | 3,061 | |||||||||
Total cost of revenues |
86,810 | 82,545 | 81,505 | |||||||||
Gross margin |
196,691 | 176,963 | 156,379 | |||||||||
Operating expenses: |
||||||||||||
Sales and marketing |
69,151 | 62,738 | 57,939 | |||||||||
Product development |
51,416 | 48,443 | 42,897 | |||||||||
General and administrative |
37,707 | 36,107 | 35,887 | |||||||||
Amortization of other intangibles |
1,272 | 1,666 | 1,160 | |||||||||
Acquired in-process research and development |
— | — | 400 | |||||||||
Restructuring charges |
840 | 130 | 101 | |||||||||
Total operating expenses |
160,386 | 149,084 | 138,384 | |||||||||
Income from continuing operations |
36,305 | 27,879 | 17,995 | |||||||||
Interest expense |
(54 |
) |
(484 |
) |
(584 |
) |
||||||
Interest income and other expense, net |
(841 | ) | (332 | ) | 369 | |||||||
Gain on sale of equity investments, net |
— | 2,056 | 3,393 | |||||||||
Income from continuing operations before income taxes |
35,410 | 29,119 | 21,173 | |||||||||
Provision for income taxes |
11,091 | 8,345 | 3,857 | |||||||||
Net income from continuing operations |
$ | 24,319 | $ | 20,774 | $ | 17,316 | ||||||
Discontinued operation: |
||||||||||||
Net income (loss) from discontinued operation (net of applicable taxes of $(46), $5,639, and $1,097, respectively) |
(166 | ) | 16,109 | 1,579 | ||||||||
Net income |
$ | 24,153 | $ | 36,883 | $ | 18,895 | ||||||
Basic net income per share: |
||||||||||||
Continuing operations |
$ | 0.47 | $ | 0.41 | $ | 0.33 | ||||||
Discontinued operation |
— | 0.32 | 0.03 | |||||||||
Total operations |
$ | 0.47 | $ | 0.72 | $ | 0.35 | ||||||
Diluted net income per share: |
||||||||||||
Continuing operations |
$ | 0.45 | $ | 0.39 | $ | 0.31 | ||||||
Discontinued operation |
— | 0.30 | 0.03 | |||||||||
Total operations |
$ | 0.44 | $ | 0.70 | $ | 0.34 | ||||||
Weighted average shares used to compute basic and diluted net income per share |
||||||||||||
Basic |
51,535 | 50,899 | 53,279 | |||||||||
Diluted |
54,476 | 52,909 | 55,786 | |||||||||
The accompanying notes are an integral part of these consolidated financial statements.
Net income per share is based on actual calculated values and totals may not sum due to rounding.
78
ADVENT SOFTWARE, INC.
CONSOLIDATED STATEMENTS OF STOCKHOLDERS' EQUITY AND
COMPREHENSIVE INCOME
(In thousands)
| |
|
Common Stock | |
|
Accumulated Other Comprehensive Income |
|
||||||||||||||||
|---|---|---|---|---|---|---|---|---|---|---|---|---|---|---|---|---|---|---|---|---|---|---|
| |
Comprehensive Income |
Additional Paid-In Capital |
Accumulated Deficit |
Total Stockholders' Equity |
||||||||||||||||||
| |
Shares | Amount | ||||||||||||||||||||
Balances, December 31, 2007 |
52,995 | $ | 530 | $ | 326,699 | $ | (161,685 | ) | $ | 14,302 | $ | 179,846 | ||||||||||
Common stock issued for Tamale acquisition |
$ |
— |
1,812 |
18 |
39,886 |
— |
— |
39,904 |
||||||||||||||
Stock-based award activity |
— | 913 | 9 | 4,008 | — | — | 4,017 | |||||||||||||||
Common stock repurchased and retired |
— | (4,662 | ) | (47 | ) | (27,831 | ) | (33,694 | ) | — | (61,572 | ) | ||||||||||
Common stock issued under employee stock purchase plan |
— | 399 | 4 | 5,014 | — | — | 5,018 | |||||||||||||||
Stock-based compensation |
— | — | — | 17,141 | — | — | 17,141 | |||||||||||||||
Tax benefit from exercise of stock options |
— | — | — | 177 | — | — | 177 | |||||||||||||||
Net income |
18,895 | — | — | — | 18,895 | — | 18,895 | |||||||||||||||
Foreign currency translation adjustments |
(7,603 | ) | — | — | — | — | (7,603 | ) | (7,603 | ) | ||||||||||||
Comprehensive income for fiscal 2008 |
$ | 11,292 | ||||||||||||||||||||
Balances, December 31, 2008 |
51,457 | $ | 514 | $ | 365,094 | $ | (176,484 | ) | $ | 6,699 | $ | 195,823 | ||||||||||
Stock-based award activity |
$ |
— |
1,104 |
11 |
6,430 |
— |
— |
6,441 |
||||||||||||||
Common stock repurchased and retired |
— | (1,380 | ) | (14 | ) | (8,581 | ) | (5,983 | ) | — | (14,578 | ) | ||||||||||
Common stock issued under employee stock purchase plan |
— | 553 | 6 | 5,615 | — | — | 5,621 | |||||||||||||||
Stock-based compensation |
— | — | — | 18,648 | — | — | 18,648 | |||||||||||||||
Tax shortfall from exercise of stock options |
— | — | — | (853 | ) | — | — | (853 | ) | |||||||||||||
Other |
— | — | — | 12 | — | — | 12 | |||||||||||||||
Net income |
36,883 | — | — | — | 36,883 | — | 36,883 | |||||||||||||||
Unrealized loss on marketable securities |
(62 | ) | — | — | — | — | (62 | ) | (62 | ) | ||||||||||||
Foreign currency translation adjustments |
4,099 | — | — | — | — | 4,099 | 4,099 | |||||||||||||||
Comprehensive income for fiscal 2009 |
$ | 40,920 | ||||||||||||||||||||
Balances, December 31, 2009 |
51,734 | $ | 517 | $ | 386,365 | $ | (145,584 | ) | $ | 10,736 | $ | 252,034 | ||||||||||
Stock-based award activity |
$ |
— |
1,572 |
16 |
8,537 |
— |
— |
8,553 |
||||||||||||||
Common stock repurchased and retired |
— | (1,670 | ) | (16 | ) | (10,409 | ) | (25,456 | ) | — | (35,881 | ) | ||||||||||
Common stock issued under employee stock purchase plan |
— | 338 | 3 | 5,790 | — | — | 5,793 | |||||||||||||||
Stock-based compensation |
— | — | — | 18,430 | — | — | 18,430 | |||||||||||||||
Tax benefit from exercise of stock options |
— | — | — | 2,899 | — | — | 2,899 | |||||||||||||||
Other |
— | — | — | (12 | ) | — | — | (12 | ) | |||||||||||||
Net income |
24,153 | — | — | — | 24,153 | — | 24,153 | |||||||||||||||
Unrealized gain on marketable securities |
69 | — | — | — | — | 69 | 69 | |||||||||||||||
Foreign currency translation adjustments |
(2,190 | ) | — | — | — | — | (2,190 | ) | (2,190 | ) | ||||||||||||
Comprehensive income for fiscal 2010 |
$ | 22,032 | ||||||||||||||||||||
Balances, December 31, 2010 |
51,974 | $ | 520 | $ | 411,600 | $ | (146,887 | ) | $ | 8,615 | $ | 273,848 | ||||||||||
The accompanying notes are an integral part of these consolidated financial statements.
79
ADVENT SOFTWARE, INC.
CONSOLIDATED STATEMENTS OF CASH FLOWS
(In thousands)
| |
Years Ended December 31 | ||||||||||||
|---|---|---|---|---|---|---|---|---|---|---|---|---|---|
| |
2010 | 2009 | 2008 | ||||||||||
Cash flows from operating activities: |
|||||||||||||
Net income |
$ | 24,153 | $ | 36,883 | $ | 18,895 | |||||||
Adjustment to net income for discontinued operation |
166 | (16,109 | ) | (1,579 | ) | ||||||||
Net income from continuing operations |
$ | 24,319 | $ | 20,774 | $ | 17,316 | |||||||
Adjustments to reconcile net income to net cash provided by operating activities from continuing operations: |
|||||||||||||
Stock-based compensation |
18,430 | 18,162 | 16,108 | ||||||||||
Depreciation and amortization |
17,610 | 16,692 | 12,657 | ||||||||||
Acquired in-process research and development |
— | — | 400 | ||||||||||
Provision for doubtful accounts |
188 | 215 | 611 | ||||||||||
Provision for (reduction of) sales returns |
(616 | ) | 315 | 219 | |||||||||
Loss on disposition of fixed assets |
22 | 93 | 6 | ||||||||||
Gain on investments |
— | (2,056 | ) | (3,393 | ) | ||||||||
Deferred income taxes |
8,423 | 8,129 | 3,060 | ||||||||||
Other |
241 | 199 | (126 | ) | |||||||||
Changes in operating assets and liabilities, net of effect of acquisitions: |
|||||||||||||
Accounts receivable |
(5,619 | ) | 2,094 | (2,658 | ) | ||||||||
Prepaid and other assets |
2,393 | (1,906 | ) | (588 | ) | ||||||||
Accounts payable |
1,997 | (262 | ) | 1,147 | |||||||||
Accrued liabilities |
3,053 | 7,829 | (3,489 | ) | |||||||||
Deferred revenues |
8,519 | 4,450 | 29,409 | ||||||||||
Income taxes payable |
(2,742 | ) | (2,301 | ) | (342 | ) | |||||||
Net cash provided by operating activities from continuing operations |
76,218 | 72,427 | 70,337 | ||||||||||
Cash flows from investing activities: |
|||||||||||||
Cash used in acquisitions, net of cash acquired |
(4,719 | ) | (200 | ) | (27,775 | ) | |||||||
Purchases of property and equipment |
(17,418 | ) | (4,575 | ) | (21,851 | ) | |||||||
Capitalized software development costs |
(2,144 | ) | (2,893 | ) | (2,307 | ) | |||||||
Proceeds from sales of investments |
— | 2,056 | 3,393 | ||||||||||
Purchases of marketable securities |
(46,496 | ) | (60,000 | ) | — | ||||||||
Sales and maturities of marketable securities |
36,496 | — | — | ||||||||||
Proceeds from disposition of fixed assets |
— | 37 | — | ||||||||||
Change in restricted cash |
— | 611 | (248 | ) | |||||||||
Net cash used in investing activities from continuing operations |
(34,281 | ) | (64,964 | ) | (48,788 | ) | |||||||
Cash flows from financing activities: |
|||||||||||||
Proceeds from exercises of stock options |
14,020 | 8,637 | 6,095 | ||||||||||
Withholding taxes related to equity award net share settlement |
(5,467 | ) | (2,196 | ) | (2,078 | ) | |||||||
Common stock repurchased and retired |
(35,881 | ) | (14,578 | ) | (61,572 | ) | |||||||
Proceeds from common stock issued under the employee stock purchase plan |
5,793 | 5,621 | 5,018 | ||||||||||
Proceeds from long-term borrowing |
— | — | 25,000 | ||||||||||
Repayment of long-term borrowing |
— | (25,000 | ) | — | |||||||||
Excess tax benefits from stock-based compensation |
3,878 | 499 | 263 | ||||||||||
Net cash used in financing activities from continuing operations |
(17,657 | ) | (27,017 | ) | (27,274 | ) | |||||||
Net cash transferred from (to) discontinued operation |
(112 | ) | 31,959 | 2,707 | |||||||||
Effect of exchange rate changes on cash and cash equivalents |
(97 |
) |
374 |
(693 |
) |
||||||||
Net change in cash and cash equivalents from continuing operations |
24,071 | 12,779 | (3,711 | ) | |||||||||
Cash and cash equivalents of continuing operations at beginning of period |
57,877 | 45,098 | 48,809 | ||||||||||
Cash and cash equivalents of continuing operations at end of period |
$ | 81,948 | $ | 57,877 | $ | 45,098 | |||||||
The accompanying notes are an integral part of these consolidated financial statements.
80
ADVENT SOFTWARE, INC.
CONSOLIDATED STATEMENTS OF CASH FLOWS (Continued)
(In thousands)
| |
Years Ended December 31 | ||||||||||
|---|---|---|---|---|---|---|---|---|---|---|---|
| |
2010 | 2009 | 2008 | ||||||||
Supplemental disclosure of cash flow information: |
|||||||||||
Cash paid for income taxes, net of refunds |
$ | 1,687 | $ | 2,309 | $ | 569 | |||||
Cash paid for interest |
$ | — | $ | 316 | $ | 299 | |||||
Cash flow from discontinued operation: |
|||||||||||
Net cash provided by (used in) operating activities |
$ | (377 | ) | $ | 2,621 | $ | 6,650 | ||||
Net cash provided by (used in) investing activities |
— | 26,358 | (1,417 | ) | |||||||
Net cash transferred from (to) continuing operations |
112 | (31,959 | ) | (2,707 | ) | ||||||
Effect of exchange rates on cash and cash equivalents |
(1 | ) | (7 | ) | (52 | ) | |||||
Net change in cash and cash equivalents from discontinued operation |
(266 | ) | (2,987 | ) | 2,474 | ||||||
Cash and cash equivalents of discontinued operation at beginning of period |
266 | 3,253 | 779 | ||||||||
Cash and cash equivalents of discontinued operation at end of period |
$ | — | $ | 266 | $ | 3,253 | |||||
The accompanying notes are an integral part of these consolidated financial statements.
81
ADVENT SOFTWARE, INC.
NOTES TO CONSOLIDATED FINANCIAL STATEMENTS
Note 1—Summary of Significant Accounting Policies
Business description: Advent Software, Inc. ("Advent" or "the Company") provides stand-alone and client/server software products, data and data interfaces and related maintenance and services that automate, integrate and support certain mission-critical functions of the front, middle and back offices of investment management organizations. Advent's clients vary significantly in size and assets under management and include investment advisors, brokerage firms, hedge funds, foundations and endowments, universities and banks.
Basis of presentation: The consolidated financial statements include the accounts of Advent and its wholly-owned subsidiaries after elimination of all intercompany transactions and amounts. The Company has prepared the accompanying consolidated financial statements in accordance with accounting principles generally accepted in the United States of America and pursuant to the rules and regulations of the SEC.
On December 13, 2010, the Company announced that its Board of Directors declared a two-for-one stock split of the Company's common stock, payable in the form of a 100% stock dividend. On January 18, 2011, one additional share of common stock was distributed for each share held of record as of the close of business on January 3, 2011. An amount equal to the par value of the shares issued was transferred from the additional paid-in capital account to the common stock account. All references to number of shares (except shares authorized)and to per share information in the consolidated financial statements have been adjusted to reflect the stock split on a retroactive basis.
Divestiture of the MicroEdge Segment and Discontinued Operation Reclassification: On October 1, 2009, Advent completed the sale of MicroEdge, Inc. ("MicroEdge") a wholly-owned subsidiary of the Company pursuant to an Agreement and Plan of Merger (the "Agreement") entered into on July 27, 2009, by and among the Company, Microedge Holdings, LLC, a Delaware limited liability company and an affiliate of Vista Equity Partners III, LLC, Microedge Merger Sub, LLC, a New York limited liability company and a wholly-owned subsidiary of Microedge Holdings, LLC, MicroEdge, and, with respect to Article VII, Article VIII and Article IX thereof only, U.S. Bank National Association as escrow agent. Pursuant to the Agreement, MicroEdge merged with and into Merger Sub.
In accordance with FASB Accounting Standards Codification ("ASC") ASC 360, "Property, Plant, and Equipment" and ASC 205-20, "Discontinued Operations", the assets, liabilities and results of MicroEdge have been reclassified as a discontinued operation in the consolidated financial statements for all periods presented. The results of operations and the related charges for the discontinued operation are classified as "Net income from discontinued operation, net of applicable taxes" in the accompanying consolidated statements of operations. For comparative purposes, the Company restated all prior periods presented to reflect the reclassifications on a consistent basis. See Note 4, "Discontinued Operation," for further discussion.
Unless noted otherwise, discussions in the notes to the consolidated financial statements pertain only to continuing operations.
Year End: Advent's fiscal year ends on December 31st.
Foreign currency translation: The functional currencies of the Company's foreign subsidiaries are their local currencies. All assets and liabilities denominated in foreign functional currencies are translated into US dollars at the exchange rate on the balance sheet date. Revenues, costs and expenses in foreign functional currencies are translated at the average rate of exchange during the period.
82
ADVENT SOFTWARE, INC.
NOTES TO CONSOLIDATED FINANCIAL STATEMENTS (Continued)
Note 1—Summary of Significant Accounting Policies (Continued)
Foreign currency measurement: Asset and liabilities denominated in currencies other than the functional currencies are re-measured into the functional currency with gains or losses recorded in "interest income and other expense, net" on the consolidated statement of operations.
Use of estimates: The preparation of financial statements in conformity with accounting principles generally accepted in the United States of America requires management to make estimates and assumptions that affect the reported amounts of assets and liabilities, the disclosure of contingent assets and liabilities at the date of the financial statements and the reported amounts of revenues and expenses during the reporting period. These estimates are based on information available as of the date of the financial statements. Actual results could differ from those estimates. Advent believes the following critical accounting policies affect its more significant judgments and estimates used in the preparation of its consolidated financial statements: Business Combinations; Dispositions; Goodwill; Revenue Recognition and Deferred Revenues; Income Taxes; Restructuring Charges and Related Accruals; Impairment of Long-Lived Assets; Legal Contingencies; Sales Returns and Accounts Receivable Allowances; and Stock-Based Compensation.
Cash and cash equivalents: Cash equivalents are comprised of highly liquid investments purchased with an original or remaining maturity of 90 days or less at the date of purchase.
Marketable securities: All of Advent's marketable securities are classified as available-for-sale and are carried at fair value. The unrealized gains and losses, net of any related tax effect, are reported in accumulated comprehensive income in stockholders' equity in the accompanying consolidated financial statements. Realized gains and losses and declines in value judged to be other-than-temporary on available-for-sale securities are included in "interest income and other expense, net".
Investments: Investments are recorded at cost and reviewed for impairment. Investments are included in "other assets" on the consolidated balance sheets and consist of non-marketable investments in privately held companies, most of which can be considered in the start-up or development stages. It is Advent's policy to review investments in privately held companies on a regular basis to evaluate the carrying amount and economic viability of these companies. This policy includes, but is not limited to, reviewing each of the companies cash position, financing needs, earnings/revenue outlook, operational performance, management/ownership changes and competition. The evaluation process is based on information that Advent requests from these privately held companies. This information is not subject to the same disclosure regulations as US publicly traded companies, and as such, the basis for these evaluations is subject to timing and the accuracy of the data received from these companies.
The Company's investments in privately held companies are assessed for impairment when a review of the investee's operations indicate that there exists a decline in value of the investment and the decline is other than temporary. Such indicators include, but are not limited to, limited capital resources, limited prospects of receiving additional financing, and prospects for liquidity of the related securities. Impaired investments in privately held companies are written down to estimated fair value. The Company estimates fair value using a variety of valuation methodologies. Such methodologies include comparing the private company with publicly traded companies in similar lines of business, applying revenue multiples to estimated future operating results for the private company and estimating discounted cash flows for that company.
83
ADVENT SOFTWARE, INC.
NOTES TO CONSOLIDATED FINANCIAL STATEMENTS (Continued)
Note 1—Summary of Significant Accounting Policies (Continued)
Product development: Product development expenses consist primarily of salary, benefits and stock-based compensation for the Company's development and technical support staff, contractors' fees and other costs associated with the enhancements of existing products and services and development of new products and services. Costs incurred for software development prior to technological feasibility are expensed as product development costs in the period incurred. Once the point of technological feasibility is reached, which is generally the completion of a working prototype that has no critical bugs and is a release candidate, development costs are capitalized until the product is ready for general release and are classified "other intangibles, net" on the consolidated balance sheets. The Company amortizes capitalized software development costs using the greater of the ratio of the products' current gross revenues to the total of current expected gross revenues or on a straight-line basis over the estimated economic life of the related product, which is typically three years.
Capitalization of internal use software: Certain costs related to computer software developed or obtained for internal use are capitalized in accordance with ASC 350-40, "Internal Use Software". The Company amortizes internal use software costs over their estimated useful lives, which typically range from two to five years.
Property and equipment: Property and equipment are stated at cost, less accumulated depreciation and amortization. Advent calculates depreciation and amortization using the straight-line method over the assets' estimated useful lives. Amortization of leasehold improvements is computed using the straight-line method over the shorter of the estimated useful life of the assets or the remaining lease term. The cost and related accumulated depreciation applicable to property and equipment sold or no longer in service are eliminated from the accounts and any gains or losses are generally included in operating expenses. Useful lives by principal classifications are as follows:
Computer equipment and software |
3 to 5 years | |
Leasehold improvements |
Shorter of useful life or end of lease term | |
Furniture and fixtures |
3 to 5 years | |
Telephone system |
3 to 5 years |
Repairs and maintenance expenditures, which are not considered improvements and do not extend the useful life of the property and equipment, are expensed as incurred.
Goodwill: Advent reviews goodwill for impairment annually during the fourth quarter of the fiscal year (as of November 1) and more frequently if an event or circumstance indicates that an impairment loss has occurred. Advent is required to test goodwill for impairment at the reporting unit level. Advent has determined that the Company has two reporting units, Domestic and International, which comprise the Advent Investment Management segment, for the goodwill impairment testing performed during the fourth quarter of 2010. The test for goodwill impairment is a two-step process:
The first step compares the fair value of each reporting unit with its respective carrying amount, including goodwill. If the fair value of the reporting unit exceeds its carrying amount, goodwill of the reporting unit is considered not impaired, thus the second step of the impairment test is unnecessary.
The second step, used to measure the amount of impairment loss, compares the implied fair value of each reporting unit's goodwill with the respective carrying amount of that goodwill. If the carrying amount of the reporting unit goodwill exceeds the implied fair value of that goodwill, an impairment loss shall be recognized in an amount equal to that excess.
84
ADVENT SOFTWARE, INC.
NOTES TO CONSOLIDATED FINANCIAL STATEMENTS (Continued)
Note 1—Summary of Significant Accounting Policies (Continued)
The process for evaluating the potential impairment of goodwill is subjective and requires judgment at many points during the test including future revenue forecasts, discount rates and various reporting unit allocations. During the fourth quarter of 2010, Advent completed the first step of its annual impairment test and determined that Advent's reporting units as of the latest impairment testing date is substantially in excess of carrying value. As Advent determined that none of the reporting units were at risk for failing step one of the impairment testing, the second step of the impairment test was not necessary to perform.
Accounting for long-lived assets: Advent also reviews its other long-lived assets including property and equipment and other intangibles for impairment whenever events or changes in circumstances indicate that the carrying amount of these assets may not be recoverable.
Recoverability is measured by a comparison of the assets' carrying amount to their expected future undiscounted net cash flows. If such assets are considered to be impaired, the impairment to be recognized is measured based on the amount by which the carrying amount of the asset exceeds its fair value.
Other intangible assets mainly represent completed technology, distributor licenses, customer lists, trademark/tradenames and non-compete agreements acquired in business combinations. Acquired identifiable intangibles are amortized on a straight-line basis over their estimated useful lives as follows:
Purchased technology |
4 to 5 years | |
Customer relationships |
4 to 8 years | |
Other intangibles |
2 to 7 years |
Revenue recognition: Advent recognizes revenue from term license, maintenance, other recurring; perpetual license fees; and professional services and other. Advent offers a wide variety of products and services to a large number of financially sophisticated customers. While many of the Company's lower-priced license transactions, maintenance contracts, subscription-based transactions and professional services projects conform to a standard structure, many of Advent's larger transactions are complex and may require significant review and judgment in Advent's application of generally accepted accounting principles.
Software license fees. Advent recognizes revenue from the licensing of software when persuasive evidence of an arrangement exists, the product has been delivered, the fee is fixed or determinable and collection of the resulting receivable is probable. Advent generally uses a signed license agreement as evidence of an arrangement. Revenue is recognized once shipment to the distributor's customer has taken place and when all other revenue recognition criteria have been met. Delivery occurs when a product is delivered to a common carrier F.O.B shipping point, or upon confirmation that product delivered F.O.B shipping destination has been received, or upon notification that software is available for electronic download through the Company's fulfillment vendor. Some of Advent's arrangements include acceptance provisions, and if such acceptance provisions are present, delivery is deemed to occur upon acceptance. Advent assesses whether the fee is fixed or determinable based on the payment terms associated with the transaction. The Company assesses whether the collectability of the resulting receivable is probable based on a number of factors, including the credit worthiness of the customer determined through review of credit reports, Advent's transaction history with the customer, other available information and pertinent country risk if the customer is located outside the United States.
85
ADVENT SOFTWARE, INC.
NOTES TO CONSOLIDATED FINANCIAL STATEMENTS (Continued)
Note 1—Summary of Significant Accounting Policies (Continued)
Advent's standard payment terms are due at 180 days or less but payment terms may vary based on the country in which the agreement is executed. Software licenses are sold with maintenance and, frequently, professional services.
Advent typically licenses its products on a per server, per user basis with the price per customer varying based on the selection of the products licensed, the assets under administration, the number of site installations and the number of authorized users. Advent has continued its transition from selling mostly perpetual licenses to selling a mix of term and perpetual licenses, and the Company expects term license revenue to increase as a proportion of total recurring revenues (which Advent defines as term license, maintenance and other recurring revenues) in the future. Term license revenue comprised approximately 44%, 44% and 35% of total term license, maintenance and other recurring revenues in 2010, 2009, and 2008, respectively. Revenue recognition for software licensed under term and perpetual license models differs depending on which type of contract a customer signs:
- •
- Term licenses
- •
- Perpetual licenses
Term license contracts include both the software license and maintenance services. Advent offers multi-year term licenses by which a customer makes a binding commitment that typically spans three years. For multi-year term licenses, Advent has not established vendor specific objective evidence, or VSOE, of fair value for the software license and maintenance components and, as a result, in situations where the Company is also performing related professional services, it defers all revenue and directly related expenses under the arrangement until the implementation services are complete and the remaining services are substantially complete. At the point professional services are substantially completed, Advent recognizes a pro-rata amount of the term license revenue, professional services fees earned and related expenses, based on the elapsed time from the start of the term license to the substantial completion of professional services. The Company determines whether services are substantially complete by consulting with the professional services group and applying management judgment. Term license revenue for the remaining contract years and the remaining deferred professional services revenue and related expenses are recognized ratably over the remaining contract length. When multi-year term licenses are sold and do not include related professional services, Advent recognizes the entire term license revenue ratably over the period of the contract term from the effective date of the license agreement assuming all other revenue recognition criteria have been met. Revenues from term licenses are included in "Term license, maintenance and other recurring" revenues on the consolidated statement of operations.
Advent allocates revenue to delivered components, normally the license component of the arrangement, using the residual method, based on VSOE of fair value of the undelivered elements (generally the maintenance and professional services components), which is specific to the Company. Advent determines the fair value of the undelivered elements based on the historical evidence of the Company's stand-alone sales of these elements to third parties and/or renewal rates. If VSOE of fair value does not exist for any undelivered elements, then the entire arrangement fee is deferred until delivery of that element has occurred, unless the only undelivered element is maintenance in which case the entire arrangement fee would be recognized ratably over the maintenance period. Revenues from perpetual licenses are included in "Perpetual license fees" revenue on the consolidated statement of operations.
86
ADVENT SOFTWARE, INC.
NOTES TO CONSOLIDATED FINANCIAL STATEMENTS (Continued)
Note 1—Summary of Significant Accounting Policies (Continued)
Certain of Advent's perpetual and term license contracts include asset-based fee structures that provide additional revenues based on the assets that the client manages using the Company's software ("Assets Under Administration" or "AUA"). Contracts containing an AUA fee structure have a defined measurement period which requires the client to self-report actual AUA in arrears of the specified period. AUA fees above the stated minimum fee for the same period are considered incremental fees. Because incremental fees are not determinable until the conclusion of the measurement period, they are both earned and recognized upon completion of the measurement period, on a quarterly or annual basis. Incremental fees from perpetual AUA contracts are included in "Perpetual license fees" on the consolidated statement of operations. Incremental fees from term AUA contracts are included in "Term license, maintenance and other recurring" revenue on the consolidated statement of operations. The Company recognizes AUA contract minimum fees over the period of service and continues to recognize incremental fees in arrears once clients contractually report the AUA to the Company, because the incremental fees are not determinable until reported.
Maintenance and other recurring revenues. Advent offers annual maintenance programs on perpetual licenses that provide for technical support and updates to the Company's software products. Maintenance fees are bundled with perpetual license fees in the initial licensing year and charged separately for renewals of annual maintenance in subsequent years. Fair value for maintenance is based upon either renewal rates stated in the contracts or separate sales of renewals to customers. Generally, Advent recognizes maintenance revenue ratably over the contract term.
Advent offers other recurring revenue services that are either subscription or transaction based which primarily include the provision of software interfaces to download securities information from third party data providers, partial or full business process outsourcing, account aggregation, reconciliation, reference data management, and hosting of hardware and/or software. The Company recognizes revenue from recurring revenue transactions either ratably over the subscription period or as the transactions occur based on the terms of the arrangement.
Professional services and other revenues. Advent offers a variety of professional services that include project management, implementation, data conversion, integration, custom report writing and training. Fair value for professional services is based upon separate sales of these services by the Company to customers. Advent's professional services are generally billed based on hourly rates together with reimbursement for travel and accommodation expenses. Advent generally recognizes revenue as these professional services are performed, except when sold with multi-year term license contracts which are described in the "term licenses" section above. Certain professional services arrangements involve acceptance criteria. In these cases, revenue and related expenses are recognized upon acceptance. Advent's professional services and other revenue also include revenue from the Company's annual user conferences.
Directly related expenses. When Advent defers service revenues, it also defers the direct costs incurred in the delivery of those services to the extent those costs are recoverable through the future revenues on non-cancellable contracts as prepaid contract expense. Advent recognizes those deferred costs as costs of professional services revenues proportionally and over the same period that the deferred revenue is recognized as service revenue. When Advent defers license revenue, the Company defers the direct incremental costs incurred as a result of selling the contract (i.e. sales commissions earned by the sales force as a part of their overall compensation) because those costs would not have
87
ADVENT SOFTWARE, INC.
NOTES TO CONSOLIDATED FINANCIAL STATEMENTS (Continued)
Note 1—Summary of Significant Accounting Policies (Continued)
been incurred but for the acquisition of that contract. Advent recognizes those costs as sales and marketing expense proportionally and over the same period as the license revenues.
Allowance for doubtful accounts and sales returns: Advent analyzes specific accounts receivable, historical bad debts, customer concentrations, customer credit-worthiness, current economic trends and changes in its customer payment terms when evaluating the adequacy of the allowance for doubtful accounts. Advent has recorded a provision for bad debt of $0.2 million, $0.2 million and $0.6 million in fiscal 2010, 2009 and 2008, respectively.
Advent also analyzes customer demand and acceptance of product and historical returns when evaluating the adequacy of the allowance for sales returns, which are not generally provided to customers. Allowances for sales returns are accounted for as deductions to net revenues and increases to reserves within deferred revenues. Advent's standard practice is to enforce its contract terms and not allow its customers to return software. The Company has, however, allowed customers to return software on a limited case-by-case basis. The Company only provides a contractual limited right of return to the end-user customer when it sells shrink-wrap license agreements. The shrink-wrap license agreement provides for a right of return within seven days of delivery of the software.
Advent has the ability to estimate returns based on a long history of experience with relatively homogenous transactions and the fact that the return period is short. The Company has recorded sales returns provisions as offsets to revenue in the period the sales return becomes probable, in accordance with ASC 605-15-25, "Revenue Recognition—Products—Recognition". The estimates for returns are adjusted periodically based upon historical rates of returns and other related factors. Advent has a methodology for calculating the value of reserves that takes the previous 12 months of experience into account. Advent has recorded a sales returns provision (benefit) to decrease (increase) revenue for these situations based on the Company's historical experience of $(0.6) million, $0.3 million and $0.2 million in fiscal 2010, 2009 and 2008, respectively.
Advertising costs: The Company expenses advertising costs as incurred and classifies these costs under sales and marketing expense. Total advertising expenses were $0.7 million, $0.5 million, and $0.8 million for fiscal 2010, 2009 and 2008, respectively.
Stock-based compensation: Stock-based compensation cost is measured at the grant date based on the fair value of the award and is recognized as expense on a straight-line basis over the requisite service period, which is the vesting period.
Advent uses the Black-Scholes option pricing model to determine the fair value of stock options, stock appreciation rights ("SAR") and employee stock purchase plan shares. The fair value of the Company's restricted stock units is calculated based on the fair market value of Advent's stock on the date of grant. The determination of the fair value of stock-based payment awards on the date of grant using an option-pricing model is affected by Advent's stock price as well as assumptions regarding a number of complex and subjective variables. These variables include Advent's expected stock price volatility over the term of the awards, actual and projected employee exercise behaviors, risk-free interest rate and expected dividends.
As the stock-based compensation expense recognized on the consolidated statements of operations for fiscal 2010, 2009 and 2008 is based on awards ultimately expected to vest, such amount has been reduced for estimated forfeitures. ASC 718, "Compensation—Stock Compensation" requires forfeitures
88
ADVENT SOFTWARE, INC.
NOTES TO CONSOLIDATED FINANCIAL STATEMENTS (Continued)
Note 1—Summary of Significant Accounting Policies (Continued)
to be estimated at the time of grant and revised, if necessary, in subsequent periods if actual forfeitures differ from those estimates. Forfeitures were estimated based on the Company's historical experience over the last ten years.
Advent makes quarterly assessments of the adequacy of the Company's pool of windfall tax benefits to determine if there are any deficiencies which require recognition in the Company's consolidated statements of operations.
Restructuring charges and related accruals: Advent has developed and implemented formalized plans for restructuring the business to better align its resources to market conditions and recorded significant charges resulting from the restructuring plans. In connection with the restructuring plans Advent has recorded estimated expenses for severance and benefits, lease cancellations, asset write-offs and other restructuring costs. Given the significance of, and the timing of the execution of such activities, this process is complex and involves periodic reassessments of estimates made at the time the original decisions were made, including evaluating real estate market conditions for expected vacancy periods and sub-lease rental income. Advent continually evaluates the adequacy of the remaining liabilities under the restructuring initiatives. Although the Company believes that these estimates accurately reflect the costs of the restructuring plans, actual results may differ, thereby requiring Advent to record additional provisions or reverse a portion of such provisions.
Income taxes: Advent accounts for worldwide income taxes under an asset and liability approach that requires the expected future tax consequences of temporary differences between book and tax bases of assets and liabilities be recognized as deferred tax assets and liabilities. A valuation allowance is recorded to reduce the net deferred tax assets to an amount that is more likely than not to be realized.
The Company has elected to use the "with and without" approach as described in ASC 740-20, "Intraperiod Tax Allocation", in determining the order in which tax attributes are utilized. As a result, the Company will only recognize a tax benefit from stock-based awards in additional paid-in capital if an incremental tax benefit is realized after all other tax attributes currently available to the Company have been utilized. In addition, the Company has elected to account for the impact of stock-based awards on other tax attributes, such as the research tax credit, through the consolidated statement of operations.
Net income per share: Basic net income per share is computed by dividing net income by the weighted average number of common shares outstanding for that period. Diluted net income per share is computed giving effect to all dilutive potential common shares that were outstanding during the period. Dilutive potential shares consist of incremental common shares issuable upon exercise of stock options and stock appreciation rights, vesting of restricted stock units and conversion of preferred stock (none outstanding) for all periods, except in situations where inclusion is anti-dilutive.
Comprehensive income: Comprehensive income consists of net income, net unrealized foreign currency translation adjustments and net unrealized gains or losses on available-for-sale marketable securities and is presented in the consolidated statements of stockholders' equity and comprehensive income.
Segment information: Historically, the Company determined that its operations were organized into two reportable segments: Advent Investment Management, and MicroEdge. On October 1, 2009,
89
ADVENT SOFTWARE, INC.
NOTES TO CONSOLIDATED FINANCIAL STATEMENTS (Continued)
Note 1—Summary of Significant Accounting Policies (Continued)
Advent completed the sale its MicroEdge subsidiary and accordingly, the results of MicroEdge have been classified as a discontinued operation in the consolidated statements of operations for all periods presented. The Company now operates under a single reportable segment, Advent Investment Management. See Note 4, "Discontinued Operation," for further information regarding the divestiture of MicroEdge.
International sales, which are based on the location to which the product is shipped or services are delivered, represented 15%, 14%, and 16% of the Company's net revenues for fiscal 2010, 2009 and 2008, respectively. No single customer accounted for more than 10% of net revenues for fiscal 2010, 2009 or 2008.
Certain risks and concentrations: Product revenues are concentrated in the investment management software industry, which is highly competitive and rapidly changing. Significant technological changes in the industry or customer requirements, or the emergence of competitive products with new capabilities or technologies could adversely affect operating results. Additionally, Advent derives a significant portion of its revenues from its Axys, Geneva and Advent Portfolio Exchange applications and ancillary products and services, and therefore their market acceptance is essential to the Company's success.
Financial instruments that potentially subject the Company to concentrations of credit risks comprise, principally, cash, cash equivalents, and trade accounts receivable. Advent invests excess cash through banks, mutual funds, and brokerage houses primarily in highly liquid securities and has investment policies and procedures that attempt to minimize credit risk. Advent's marketable securities consist of diversified investment grade securities traded in the United States of America. The Company believes no significant concentration of credit risk exists with respect to these securities.
With respect to accounts receivable, Advent performs ongoing credit evaluations of its customers and generally does not require collateral. The Company maintains reserves for potential credit losses on customer accounts when deemed necessary. At December 31, 2010 and 2009, no single customer accounted for more than 10% of accounts receivable.
Common Stock Repurchases: Advent accounts for common stock repurchases by allocating the cash paid in excess of par value to additional paid-in capital and accumulated deficit. The Company calculates the average additional paid-in capital per outstanding share at the beginning of each monthly period in which stock was repurchased and records the difference between the repurchase price per share and the sum of the par value and average paid-in capital per share as an increase to accumulated deficit.
Recent Accounting Pronouncements:
In October 2009, the Financial Accounting Standards Board ("FASB") issued Accounting Standards Update ("ASU") 2009-13, Multiple-Deliverable Revenue Arrangements, (amendments to FASB Accounting Standards Codification ("ASC") Topic 605, Revenue Recognition) ("ASU 2009-13") and ASU 2009-14, Certain Arrangements That Include Software Elements, (amendments to FASB ASC Topic 985, Software) ("ASU 2009-14"). ASU 2009-13 requires entities to allocate revenue in an arrangement using estimated selling prices of the delivered goods and services based on a selling price hierarchy. The amendments eliminate the residual method of revenue allocation and require revenue to be allocated using the relative selling price method. ASU 2009-14 removes tangible products from the
90
ADVENT SOFTWARE, INC.
NOTES TO CONSOLIDATED FINANCIAL STATEMENTS (Continued)
Note 1—Summary of Significant Accounting Policies (Continued)
scope of software revenue guidance and provides guidance on determining whether software deliverables in an arrangement that includes a tangible product are covered by the scope of the software revenue guidance. ASU 2009-13 and ASU 2009-14 should be applied on a prospective basis for revenue arrangements entered into or materially modified in fiscal years beginning on or after June 15, 2010, with early adoption permitted. The adoption of this guidance is not expected to have a material impact on the Company's consolidated financial statements.
In January 2010, the FASB issued guidance to amend the disclosure requirements related to recurring and nonrecurring fair value measurements. The guidance requires new disclosures on the transfers of assets and liabilities between Level 1 (quoted prices in active market for identical assets or liabilities) and Level 2 (significant other observable inputs) of the fair value measurement hierarchy, including the reasons and the timing of the transfers. Additionally, the guidance requires a roll forward of activities on purchases, sales, issuance, and settlements of the assets and liabilities measured using significant unobservable inputs (Level 3 fair value measurements). The guidance became effective for entities with a reporting period beginning January 1, 2010, except for the disclosure on the roll forward activities for Level 3 fair value measurements, which will become effective for the reporting period beginning April 1, 2011. The adoption of these changes had no material impact on the Company's consolidated financial statements.
In December 2010, the FASB issued ASU 2010-29, Disclosure of Supplementary Pro Forma Information for Business Combinations (amendments to FASB ASC Topic 805, Business Combinations). The guidance in ASU 2010-29 provides amendments to clarify the acquisition date which should be used for reporting the pro forma financial information disclosures in Topic 805 when comparative financial statements are presented. The amendments also improve the usefulness of the pro forma revenue and earnings disclosures by requiring a description of the nature and amount of material, nonrecurring pro forma adjustments directly attributable to the business combination(s). The amendments in this update are effective prospectively for business combinations for which the acquisition date is on or after the beginning of the first annual reporting period beginning on or after December 15, 2010. Early adoption is permitted. The adoption of this guidance is not expected to have a material impact on the Company's consolidated financial statements.
In December, 2010, the FASB issued ASU 2010-28, When to Perform Step 2 of the Goodwill Impairment Test for Reporting Units with Zero or Negative Carrying Amounts (amendments to FASB ASC Topic 350, Intangibles—Goodwill and Other). The objective of this ASU is to address diversity in practice in the application of goodwill impairment testing by entities with reporting units with zero or negative carrying amounts, eliminating an entity's ability to assert that a reporting unit is not required to perform Step 2 because the carrying amount of the reporting unit is zero or negative despite the existence of qualitative factors that indicate the goodwill is more likely than not impaired. This ASU is effective for interim periods after January 1, 2011. The adoption of this ASU is not expected to have a material impact on the Company's consolidated financial statements.
Note 2—Cash Equivalents and Marketable Securities
At December 31, 2010 and 2009, cash and cash equivalents, short-term and long-term marketable securities primarily consisted of money market mutual funds, US government and US Government Sponsored Entities (GSE's) and high credit quality corporate debt securities. The Company's short-term
91
ADVENT SOFTWARE, INC.
NOTES TO CONSOLIDATED FINANCIAL STATEMENTS (Continued)
Note 2—Cash Equivalents and Marketable Securities (Continued)
and long-term marketable securities are classified as available-for-sale, with long-term investments having a maturity date greater than one year from the end of the period.
Marketable securities are summarized as follows (in thousands):
Balance at December 31, 2010
|
Amortized Cost |
Gross Unrealized Gains |
Gross Unrealized Losses Less than 12 Months |
Gross Unrealized Losses 12 Months or Longer |
Aggregate Fair Value |
||||||||||||
|---|---|---|---|---|---|---|---|---|---|---|---|---|---|---|---|---|---|
Corporate debt securities |
$ | 22,597 | $ | 6 | $ | (3 | ) | $ | — | $ | 22,600 | ||||||
US government debt securities |
47,466 | 12 | (3 | ) | — | 47,475 | |||||||||||
Total |
$ | 70,063 | $ | 18 | $ | (6 | ) | $ | — | $ | 70,075 | ||||||
Balance at December 31, 2009
|
Amortized Cost |
Gross Unrealized Gains |
Gross Unrealized Losses Less than 12 Months |
Gross Unrealized Losses 12 Months or Longer |
Aggregate Fair Value |
||||||||||||
|---|---|---|---|---|---|---|---|---|---|---|---|---|---|---|---|---|---|
Corporate debt securities |
$ | 20,302 | $ | 1 | $ | (40 | ) | $ | — | $ | 20,263 | ||||||
US government debt securities |
39,571 | — | (66 | ) | — | 39,505 | |||||||||||
Total |
$ | 59,873 | $ | 1 | $ | (106 | ) | $ | — | $ | 59,768 | ||||||
The following table summarizes marketable securities with unrealized losses by contractual maturity dates at December 31, 2010 (in thousands):
| |
Less than 12 months |
Greater than 12 months |
Total | |||||||||||||||||
|---|---|---|---|---|---|---|---|---|---|---|---|---|---|---|---|---|---|---|---|---|
| |
Fair Value |
Gross Unrealized Losses |
Fair Value |
Net Unrealized Losses |
Fair Value |
Net Unrealized Losses |
||||||||||||||
Corporate debt securities |
$ | 10,632 | $ | (3 | ) | $ | — | $ | — | $ | 10,632 | $ | (3 | ) | ||||||
US government debt securities |
36,417 | (3 | ) | — | — | 36,417 | (3 | ) | ||||||||||||
Total |
$ | 47,049 | $ | (6 | ) | $ | — | $ | — | $ | 47,049 | $ | (6 | ) | ||||||
Advent regularly reviews its investment portfolio to identify and evaluate investments that have indications of possible impairment. Factors considered in determining whether a loss is temporary include the length of time and extent to which fair value has been less than the cost basis, the financial condition, credit quality and near-term prospects of the investee, and Advent's ability to hold the investment for a period of time sufficient to allow for any anticipated recovery in market value.
92
ADVENT SOFTWARE, INC.
NOTES TO CONSOLIDATED FINANCIAL STATEMENTS (Continued)
Note 2—Cash Equivalents and Marketable Securities (Continued)
The gross unrealized losses related to investments are primarily due to a decrease in the fair value of debt securities as a result of an increase in interest rates during fiscal 2010. For fixed income securities that have unrealized losses as of December 31, 2010, the Company has determined that (i) it does not have the intent to sell any of these investments and (ii) it is not more likely than not that it will be required to sell any of these investments before recovery of the entire amortized cost basis. In addition, the Company has evaluated these fixed income securities and has determined that no credit losses exist. As of December 31, 2010, all securities in an unrealized loss position have been in an unrealized loss position for less than one year. The Company's management has determined that the unrealized losses on its fixed income securities as of December 31, 2010 were temporary in nature.
The Company had no realized gains or losses related to the Company's investments for the years ending December 31, 2010, 2009 and 2008.
Note 3—Derivative Financial Instruments
The Company enters into foreign currency forward contracts with financial institutions to reduce the risk that the Company's cash flows and earnings will be adversely affected by foreign currency exchange rate fluctuations. The program is not designated for trading or speculative purposes.
The Company recognizes derivative instruments as either assets or liabilities on the accompanying consolidated balance sheets at fair value based on current market rates. The Company records changes in the fair value (e.g., gains or losses) of the derivatives in "interest income and other expense, net" on the accompanying consolidated statements of operations.
Non-designated Hedges
In October 2010, the Company began using foreign currency forward contracts to hedge a portion of the balances denominated in Euro, Swedish Krona and British Pounds. These derivative instruments are not designated as hedging instruments. The Company recognizes gains and losses on these contracts, as well as related costs, in "interest income and other expense, net" along with the gains and losses of the related hedged items. No such contracts were outstanding at December 31, 2010. The effect of the derivative financial instruments on the consolidated statements of operations for fiscal 2010 was to reduce foreign exchange losses by $13,000.
Note 4—Discontinued Operation
During 2009, the Company decided to discontinue its operations in the not-for-profit business community to concentrate on its core investment management business. In connection with this decision, the Company completed the sale of MicroEdge on October 1, 2009 to an affiliate of Vista Equity Partners III, LLC ("Purchaser"). The Company sold net assets in MicroEdge totaling $3.0 million. The total consideration received by the Company in connection with the divestiture was approximately $30 million in cash, of which $27 million in cash was paid on the closing date. The remaining $3 million of the Purchase Price has been placed in escrow for eighteen (18) months from the date of the close and will be held as security for losses incurred by the Purchaser in the event of certain breaches of the representations and warranties contained in the Agreement or certain other events. Any gain on sale associated with the $3.0 million held in escrow will be recorded when realized. In connection with the sale of MicroEdge, the Company recorded an associated gain of $13.6 million in "net income from discontinued operation, net of applicable taxes" in its fourth quarter of 2009 results.
93
ADVENT SOFTWARE, INC.
NOTES TO CONSOLIDATED FINANCIAL STATEMENTS (Continued)
Note 4—Discontinued Operation (Continued)
As part of the disposition, certain assets and obligations of the Company's discontinued operation were excluded from the sale and are reflected on the Company's balance sheet as of December 31, 2010 and 2009. Assets excluded from the sale include cash and deferred tax assets. Liabilities excluded from the sale include sales tax and other tax-related obligations, future payments related to a two year service and maintenance agreement, certain legal costs and employee related compensation payments incurred as of the period ended September 30, 2009, and continuing lease obligations included as part of the restructuring noted below. Legal costs and liabilities related to employee compensation were all paid as of December 31, 2009 and certain sales tax obligations have been paid through December 31, 2010.
In connection with the sale of MicroEdge, the Company vacated its MicroEdge facilities in New York and entered into a sub-lease agreement with the Purchaser whereby the Purchaser will sub-lease the premises for two years with the option to extend the sub-lease term through the end of the lease term in 2018.
The following table sets forth an analysis of the components of the restructuring charges related to the Company's discontinued operation and the payments and non-cash charges made against the accrual during fiscal 2010 and 2009 (in thousands):
| |
Facility Exit Costs |
Severance and Benefits |
Total | ||||||||
|---|---|---|---|---|---|---|---|---|---|---|---|
Balance of restructuring accrual at December 31, 2008 |
$ | — | $ | 142 | $ | 142 | |||||
Restructuring charges |
4,322 |
179 |
4,501 |
||||||||
Reversal of deferred rent related to facilities exited |
778 | — | 778 | ||||||||
Cash payments |
(26 | ) | (321 | ) | (347 | ) | |||||
Adjustment of prior restructuring costs |
41 | — | 41 | ||||||||
Balance of restructuring accrual at December 31, 2009 |
$ | 5,115 | $ | — | $ | 5,115 | |||||
Restructuring charges |
9 |
8 |
17 |
||||||||
Reversal of deferred rent related to facilities exited |
— | — | — | ||||||||
Cash payments |
(40 | ) | (8 | ) | (48 | ) | |||||
Adjustment of prior restructuring costs |
165 | — | 165 | ||||||||
Balance of restructuring accrual at December 31, 2010 |
$ | 5,249 | $ | — | $ | 5,249 | |||||
Of the remaining restructuring accrual of $5.2 million at December 31, 2010, $22,000 is included in accrued liabilities of discontinued operations. The remaining facility exit costs of $5.2 million will be paid over the remaining lease term through 2018.
94
ADVENT SOFTWARE, INC.
NOTES TO CONSOLIDATED FINANCIAL STATEMENTS (Continued)
Note 4—Discontinued Operation (Continued)
Net revenues and income from the Company's discontinued operation are as follows for the following periods (in thousands):
| |
Fiscal Years | |||||||||
|---|---|---|---|---|---|---|---|---|---|---|
| |
2010 | 2009 | 2008 | |||||||
Net revenues |
$ | — | $ | 18,859 | $ | 26,948 | ||||
Income (loss) from operation of discontinued operation (net of applicable taxes of $(46), $1,337, and $1,097, respectively) |
$ | (166 | ) | $ | 2,486 | $ | 1,579 | |||
Gain on disposal of discontinued operation (net of applicable taxes of $0, $4,302, and $0, respectively) |
— | 13,623 | — | |||||||
Net (loss) income from discontinued operation |
$ | (166 | ) | $ | 16,109 | $ | 1,579 | |||
The following table sets forth the assets and liabilities of the MicroEdge discontinued operation included in the consolidated balance sheets of the Company (in thousands):
| |
December 31 | ||||||||
|---|---|---|---|---|---|---|---|---|---|
| |
2010 | 2009 | |||||||
Assets: |
|||||||||
Cash and cash equivalents |
$ | — | $ | 266 | |||||
Prepaid expenses and other |
— | 228 | |||||||
Total current assets of discontinued operation |
$ | — | $ | 494 | |||||
Deferred taxes, long-term |
2,095 | 2,095 | |||||||
Total noncurrent assets of discontinued operation |
$ | 2,095 | $ | 2,095 | |||||
Liabilities: |
|||||||||
Total current liabilities of discontinued operation |
$ | 165 | $ | 719 | |||||
Accrued restructuring, long-term portion |
5,228 |
5,115 |
|||||||
Total noncurrent liabilities of discontinued operation |
$ | 5,228 | $ | 5,115 | |||||
Note 5—Acquisition of Tamale Software, Inc. ("Tamale")
On October 1, 2008, Advent completed the acquisition of Tamale. Tamale provides software solutions designed specifically to help investment professionals manage their investment ideas more effectively and easily access all of the firm's research. The total purchase price of approximately $68 million included cash of $28 million and 1,812,000 shares of common stock valued at approximately $40 million. The value of the equity consideration was calculated using the average closing stock price on the two days before and after, as well as the date of, the announcement date of the acquisition. The per share value was calculated to be $22.03.
95
ADVENT SOFTWARE, INC.
NOTES TO CONSOLIDATED FINANCIAL STATEMENTS (Continued)
Note 5—Acquisition of Tamale Software, Inc. ("Tamale") (Continued)
Purchase Price Allocation
The acquisition was accounted for in accordance with the purchase method of accounting. The total purchase price was allocated to net tangible and intangible assets based on their estimated fair values as of October 1, 2008. The excess purchase price over the value of the net tangible and identifiable assets was recorded as goodwill. The allocation of the purchase price and the estimated useful lives associated with certain assets is as follows:
| |
Estimated Useful Life (Years) |
Purchase Price Allocation (in thousands) |
||||||
|---|---|---|---|---|---|---|---|---|
Identifiable intangible assets: |
||||||||
Existing technology |
5 | $ | 12,100 | |||||
Core technology |
5 | 2,500 | ||||||
Customer relationships |
8 | 7,100 | ||||||
Trademark/tradenames |
5 | 900 | ||||||
Non-competition agreements |
2 | 300 | ||||||
In-process research and development |
400 | |||||||
Goodwill |
49,650 | |||||||
Deferred tax asset |
4,738 | |||||||
Deferred tax liability |
(9,402 | ) | ||||||
Net tangible assets |
138 | |||||||
Total purchase price |
$ | 68,424 | ||||||
The purchase price of $68.4 million was paid during the fourth quarter of 2008. Of the issuable shares, 452,196 shares of the Company's common stock were held in escrow and were released in the fourth quarter of 2009.
Tangible assets and current liabilities
Tamale's tangible assets and liabilities as of October 1, 2008 were reviewed and adjusted to their fair value as necessary. Current assets include accounts receivable, inventory and other current assets. Non-current assets are primarily comprised of facility deposits and fixed assets. Current liabilities were adjusted to fair value and include accrued liabilities, direct costs associated with the acquisition and deferred revenues. In connection with the acquisition of Tamale, Advent assumed Tamale's contractual obligations related to its deferred revenue. Tamale's deferred revenue was derived primarily from subscription services. As a result, Advent recorded an adjustment to reduce the carrying value of deferred revenue to represent the Company's estimate of the fair value of the contractual obligations assumed.
Identifiable intangible assets
Existing technology relates to Tamale's Research Management Solution (RMS) product modules that have reached technological feasibility. Core technology represents a combination of Tamale's processes, technology and trade secrets that are the building blocks for current and planned new versions of existing products. Advent is amortizing the fair value of these assets to cost of revenues in the consolidated statement of operations on a straight-line basis over their estimated lives of 5 years.
96
ADVENT SOFTWARE, INC.
NOTES TO CONSOLIDATED FINANCIAL STATEMENTS (Continued)
Note 5—Acquisition of Tamale Software, Inc. ("Tamale") (Continued)
Customer relationships represent existing contracts and the underlying customer relationships. Advent is amortizing the fair value of these assets to operating expenses in the consolidated statement of operations on a straight-line basis over an estimated life of 8 years.
Tradename/trademarks related to the Tamale product names and Tamale pepper logo will continue to be used. Advent is amortizing the fair values of these assets to operating expenses in the consolidated statement of operations on a straight-line basis over an estimated life of 5 years.
Non-competition agreements represent agreements which allow Advent to operate without competition from specified Tamale employees. Advent is amortizing the fair value of this asset to operating expenses in the consolidated statement of operations on a straight-line basis over an estimated life of 2 years.
Goodwill
Approximately $49.7 million of the purchase price has been allocated to goodwill. Goodwill represents the excess of the purchase price over the fair value of the underlying net tangible and intangible assets. The goodwill was attributed to the premium paid for the opportunity to better leverage Tamale's technology utilizing Advent's broader market reach in order to achieve greater long-term growth opportunities.
In-process research and development ("IPR&D")
During fiscal 2008, Advent wrote-off acquired IPR&D related to a new module, Tamale Central, of $400,000 in connection with its acquisition of Tamale. The IPR&D was written off because the acquired technologies had not reached technological feasibility and had no alternative uses. Technological feasibility is defined as being equivalent to completion of a working prototype in which there is no remaining risk relating to the development.
The value assigned to IPR&D was determined by estimating costs to develop the purchased IPR&D into commercially viable products, estimating the resulting net cash flow from the projects when completed, and discounting the net cash flows to their present value. The revenue estimates used in the cash flow forecasts were based on estimates of relevant market sizes and growth factors, expected trends in technology, and the nature and expected timing of new product introductions by Tamale and its competitors.
The rate utilized to discount the net cash flows to their present value was based on Tamale's weighted average cost of capital. The weighted average cost of capital was adjusted to reflect the difficulties and uncertainties in completing each project and thereby achieving technological feasibility, the percentage of completion of each project, anticipated market acceptance and penetration, market growth rates, and risks related to the impact of potential changes in future target markets. Based on these factors, a discount rate of 21% was deemed appropriate for valuing the IPR&D.
The estimates used in valuing IPR&D were based upon assumptions believed to be reasonable but which are inherently uncertain and unpredictable. Assumptions may be incomplete or inaccurate, and unanticipated events and circumstances may occur.
97
ADVENT SOFTWARE, INC.
NOTES TO CONSOLIDATED FINANCIAL STATEMENTS (Continued)
Note 5—Acquisition of Tamale Software, Inc. ("Tamale") (Continued)
Pro forma results
The following supplemental unaudited pro forma information presents selected financial information as though the purchase of Tamale had been completed at the beginning of each period presented after giving effect to purchase accounting adjustments. The pro forma financial information is presented for informational purposes only and is not indicative of the results of operations that would have been achieved if the acquisition had taken place on January 1, 2008 or of results that may occur in the future. The pro forma consolidated net income and net income per share amounts include certain pro forma adjustments, primarily the amortization of identifiable intangible assets and the elimination of interest income on cash used in the acquisition (in thousands, except per share data):
| |
Fiscal Year 2008 |
||||
|---|---|---|---|---|---|
Net revenues |
$ | 245,594 | |||
Net income |
$ | 13,841 | |||
Net income per share: |
|||||
Basic |
$ | 0.26 | |||
Diluted |
$ | 0.25 | |||
Note 6—Balance Sheet Detail
Prepaid expenses and other
The following is a summary of prepaid expenses and other assets (in thousands):
| |
December 31 | |||||||
|---|---|---|---|---|---|---|---|---|
| |
2010 | 2009 | ||||||
Prepaid commission |
$ | 5,729 | $ | 5,483 | ||||
Prepaid royalty |
803 | 1,138 | ||||||
Prepaid contract expense |
6,043 | 5,815 | ||||||
Tenant improvement allowance |
182 | 3,863 | ||||||
Other |
5,107 | 6,051 | ||||||
Total prepaid expenses and other |
$ | 17,864 | $ | 22,350 | ||||
98
ADVENT SOFTWARE, INC.
NOTES TO CONSOLIDATED FINANCIAL STATEMENTS (Continued)
Note 6—Balance Sheet Detail (Continued)
Property and equipment, net
The following is a summary of property and equipment (in thousands):
| |
December 31 | |||||||
|---|---|---|---|---|---|---|---|---|
| |
2010 | 2009 | ||||||
Computer equipment and software |
$ | 46,706 | $ | 41,584 | ||||
Leasehold improvements |
31,678 | 27,629 | ||||||
Furniture and fixtures |
7,866 | 6,377 | ||||||
Telephone system |
803 | 595 | ||||||
Construction in process |
1,316 | 1,635 | ||||||
Property and equipment, gross |
$ | 88,369 | $ | 77,820 | ||||
Accumulated depreciation |
(46,845 | ) | (43,875 | ) | ||||
Property and equipment, net |
$ | 41,524 | $ | 33,945 | ||||
Depreciation expense was $10.0 million, $9.4 million and $8.4 million for fiscal 2010, 2009 and 2008, respectively. Costs of $0.7 million, $2.0 million and $3.6 million related to the development of internal use software were capitalized in 2010, 2009 and 2008, respectively, and are included in "computer equipment and software" in the table above.
Goodwill
The changes in the carrying value of goodwill for fiscal 2010 and 2009 were as follows (in thousands):
| |
Goodwill | |||
|---|---|---|---|---|
Balance at December 31, 2008 |
$ | 143,044 | ||
Translation adjustments |
1,836 |
|||
Purchase price adjustments |
(53 | ) | ||
Balance at December 31, 2009 |
$ | 144,827 | ||
Additions |
3,175 |
|||
Translation adjustments |
(2,422 | ) | ||
Balance at December 31, 2010 |
$ | 145,580 | ||
Additions to goodwill of $3.2 million relate to the acquisition of Goya AS. In March 2010, the Company's wholly-owned Norwegian subsidiary, Advent Norway AS, acquired the entire share capital of Goya AS, a Norwegian software company that provides transfer agency-related solutions to mutual fund managers and mutual fund distributors. Cash consideration of $4.7 million, net of cash acquired, was paid upon closing in March 2010.
Foreign currency translation adjustments totaling $2.4 million reflect the general strengthening of the US dollar versus the Danish Krone (DKK), the Euro (EUR) and Pound Sterling (GBP) during fiscal 2010.
99
ADVENT SOFTWARE, INC.
NOTES TO CONSOLIDATED FINANCIAL STATEMENTS (Continued)
Note 6—Balance Sheet Detail (Continued)
Foreign currency translation adjustments totaling $1.8 million reflect the general weakening of the US dollar versus the Pound Sterling (GBP) during fiscal 2009.
Other intangibles, net
The following is a summary of intangible assets (in thousands, except weighted average amortization period):
| |
Weighted Average Amortization Period (Years) |
Other Intangibles, Gross |
Accumulated Amortization |
Other Intangibles, Net |
||||||||||
|---|---|---|---|---|---|---|---|---|---|---|---|---|---|---|
Purchased technologies |
5.0 | $ | 28,118 | $ | (18,730 | ) | $ | 9,388 | ||||||
Product development costs |
3.0 | 13,714 | (9,477 | ) | 4,237 | |||||||||
Developed technology sub-total |
41,832 | (28,207 | ) | 13,625 | ||||||||||
Customer relationships |
6.0 |
27,589 |
(22,006 |
) |
5,583 |
|||||||||
Other intangibles |
4.0 | 1,585 | (1,021 | ) | 564 | |||||||||
Other intangibles sub-total |
29,174 | (23,027 | ) | 6,147 | ||||||||||
Balance at December 31, 2010 |
$ | 71,006 | $ | (51,234 | ) | $ | 19,772 | |||||||
| |
Weighted Average Amortization Period (Years) |
Other Intangibles, Gross |
Accumulated Amortization |
Other Intangibles, Net |
||||||||||
|---|---|---|---|---|---|---|---|---|---|---|---|---|---|---|
Purchased technologies |
4.9 | $ | 26,556 | $ | (15,416 | ) | $ | 11,140 | ||||||
Product development costs |
3.0 | 11,468 | (6,428 | ) | 5,040 | |||||||||
Developed technology sub-total |
38,024 | (21,844 | ) | 16,180 | ||||||||||
Customer relationships |
6.0 |
27,038 |
(21,040 |
) |
5,998 |
|||||||||
Other intangibles |
3.9 | 1,507 | (720 | ) | 787 | |||||||||
Other intangibles sub-total |
28,545 | (21,760 | ) | 6,785 | ||||||||||
Balance at December 31, 2009 |
$ | 66,569 | $ | (43,604 | ) | $ | 22,965 | |||||||
100
ADVENT SOFTWARE, INC.
NOTES TO CONSOLIDATED FINANCIAL STATEMENTS (Continued)
Note 6—Balance Sheet Detail (Continued)
The changes in the carrying value of intangible assets for fiscal 2010 and 2009 were as follows (in thousands):
| |
Gross | Accumulated Amortization |
Net | |||||||
|---|---|---|---|---|---|---|---|---|---|---|
Balance at December 31, 2008 |
$ | 63,537 | $ | (36,320 | ) | $ | 27,217 | |||
Additions |
2,894 |
— |
2,894 |
|||||||
Stock-based compensation additions |
138 | — | 138 | |||||||
Amortization |
— | (7,284 | ) | (7,284 | ) | |||||
Balance at December 31, 2009 |
$ | 66,569 | $ | (43,604 | ) | $ | 22,965 | |||
Additions |
4,369 |
— |
4,369 |
|||||||
Stock-based compensation additions |
102 | — | 102 | |||||||
Amortization |
— | (7,646 | ) | (7,646 | ) | |||||
Translation adjustments |
(34 | ) | 16 | (18 | ) | |||||
Balance at December 31, 2010 |
$ | 71,006 | $ | (51,234 | ) | $ | 19,772 | |||
Additions to intangible assets of $4.4 million in 2010 include intangible asset additions of $2.2 million from the acquisition of Goya AS and capitalized product development costs of approximately $2.2 million.
Additions to intangible assets of $2.9 million in 2009 related to capitalized product development costs.
Advent did not incur net translation adjustments during 2009 as intangibles held by foreign subsidiaries were fully amortized.
The following is a summary of amortization of the Company's developed technology and other intangible assets for the periods presented (in thousands):
| |
Fiscal Years | |||||||||||
|---|---|---|---|---|---|---|---|---|---|---|---|---|
| |
2010 | 2009 | 2008 | |||||||||
Developed technology: |
||||||||||||
Amortization—purchased technologies |
$ | 3,325 | $ | 3,128 | $ | 938 | ||||||
Amortization—product development costs |
3,049 | 2,490 | 2,123 | |||||||||
Amortization of developed technology |
6,374 | 5,618 | 3,061 | |||||||||
Other intangibles: |
||||||||||||
Amortization—customer relationships |
970 | 1,336 | 1,078 | |||||||||
Amortization—other intangibles |
302 | 330 | 82 | |||||||||
Amortization of other intangibles |
1,272 | 1,666 | 1,160 | |||||||||
Total amortization |
$ | 7,646 | $ | 7,284 | $ | 4,221 | ||||||
101
ADVENT SOFTWARE, INC.
NOTES TO CONSOLIDATED FINANCIAL STATEMENTS (Continued)
Note 6—Balance Sheet Detail (Continued)