Attached files
| file | filename |
|---|---|
| 8-K - 8-K - HMS HOLDINGS CORP | a12-17140_18k.htm |
| EX-99.1 - EX-99.1 - HMS HOLDINGS CORP | a12-17140_1ex99d1.htm |
Exhibit 99.2
|
|
Q2 2012 Investor Call July 27, 2012 Bill Lucia, President and CEO Walter Hosp, EVP and CFO Contact: Christine Saenz csaenz@hms.com 212.857.5986 7/27/2012 |
|
|
Safe Harbor Statement This presentation contains “forward-looking statements” within the meaning of the U.S. Private Securities Litigation Reform Act of 1995. Such statements give our expectations or forecasts of future events; they do not relate strictly to historical or current facts. Forward-looking statements can be identified by words such as “anticipates,” “estimates,” “expects,” “projects,” “intends,” “plans,” “believes,” “will,” “target,” “seeks,” “forecast” and similar expressions and references to guidance. In particular, these include statements relating to future actions, business plans, objects and prospects, and future operating or financial performance. Forward-looking statements are based on our current expectations and assumptions regarding our business, the economy and other future conditions. Should known or unknown risks or uncertainties materialize, or should underlying assumptions prove inaccurate, actual results could differ materially from past results and those anticipated, estimated or projected. We caution you therefore against relying on any of these forward-looking statements. Factors that could cause or contribute to such differences include, but are not limited to: regulatory actions, budgetary pressures and political influences that could affect the procurement practices and operations of healthcare organizations and agencies; our ability to retain clients or the loss of one or more major clients; client dissatisfaction or early termination of contracts triggering significant costs or liabilities; the development by competitors of new or superior products or services; the emergence of new competitors, or the development by our clients of in-house capacity to perform the services we offer; all the risks inherent in the development, introduction, and implementation of new products and services; our ability to manage our growth and its demands on our resources and infrastructure; our ability to successfully integrate our acquisitions; our compliance with the covenants and obligations under the terms of our credit facility and our ability to generate sufficient cash to cover our interest and principal payments thereunder; variations in our results of operations; negative results of government reviews, audits or investigations to verify our compliance with contracts and applicable laws and regulations; changing conditions in the healthcare industry which could simplify the payment process and reduce the need for and price of our services; our ability to continue to secure contracts through the competitive bidding process and to accurately predict the cost and time to complete such contracts; our failure to comply with laws and regulations governing health data or to protect such data from theft and misuse; and, our ability to maintain effective information systems and protect them from damage or interruption. A further description of these and other risks, uncertainties, and related matters can be found in our Annual Report on Form 10-K for the fiscal year ended December 31, 2011, which is available at www.hms.com under the “Investor Relations” tab. Any forward-looking statements made by us in this presentation speak only as of the date of this presentation. Factors or events that could cause actual results to differ may emerge from time to time and it is not possible for us to predict all of them. We undertake no obligation to publicly update forward-looking statements, whether as a result of new information, future events or otherwise, except as may be required by law. Use of Non-GAAP Measures This presentation contains non-GAAP measures. A reconciliation of these measures to GAAP measures is set forth in our press release issued on July 27, 2012, which is available under the Investor Relations Tab on the Company’s website (www.hms.com). 7/27/2012 2 |
|
|
Discussion Outline Financial Performance New Business Supreme Court Decision Strategic Outlook 7/27/2012 3 |

|
|
Consolidated Statements of Income ($ in thousands except per share amounts) 7/27/2012 4 June 30, 2012 % y/y June 30, 2012 % y/y $ 120,069 34% $ 227,383 32% 40,043 27% 79,319 26% 8,026 42% 14,920 40% 4,194 13% 8,314 10% 13,200 19% 26,043 26% 5,986 30% 11,113 26% 8,149 394% 16,298 381% 79,598 37% 156,007 37% 14,875 39% 29,739 39% 94,473 37% 185,746 37% 25,596 25% 41,637 14% (3,947) - (8,040) - 21,649 4% 33,597 -9% 8,669 4% 13,574 -9% $ 12,980 4% $ 20,023 -10% $ 0.15 7% $ 0.23 -11% 88,351 2% 88,429 2% Amortization of acquisition related software Net income Total operating expenses Weighted average common shares, diluted and intangibles Other operating costs Operating income Cost of services: Occupancy Total cost of services Compensation Net interest and other expense Direct project costs Six months ended Data processing Revenue Income taxes Selling, general & administrative expenses Three months ended Net income per diluted share Income before income taxes |
|
|
Condensed Balance Sheets ($ in thousands) 7/27/2012 5 June 30, December 31, 2012 2011 Assets Current assets: Cash and cash equivalents 105,364 $ 97,003 $ Accounts receivable, net of allowance of $811 at June 30, 2012 and $1,158 at December 31, 2011 112,351 112,505 Prepaid expenses and other current assets 26,808 20,700 Total current assets 244,523 230,208 Property and equipment, net 128,982 127,177 Other non-current assets 495,216 504,566 Total assets 868,721 $ 861,951 $ Liabilities and Shareholders' Equity Current Liabilities: Accounts payable, accrued expenses, and other liabilities 29,398 $ 40,546 $ Acquisition-related contingent consideration 2,300 2,300 Current portion of term loan 26,250 17,500 Total Current Liabilities 57,948 60,346 Long-term Liabilities 389,867 410,368 Total liabilities 447,815 470,714 Total shareholders' equity 420,906 391,237 Total liabilities and shareholders' equity 868,721 $ 861,951 $ |
|
|
Condensed Statements of Cash Flow ($ in thousands) 7/27/2012 6 2012 2011 Net income 20,023 $ 22,239 $ Net cash provided by operating activities 37,952 24,194 Net cash used in investing activities (23,142) (15,194) Net cash ( used in )/ provided by financing activities (6,449) 13,820 Net increase in cash and cash equivalents 8,361 22,820 Cash and cash equivalents at beginning of period 97,003 94,836 Cash and cash equivalents at end of period 105,364 $ 117,656 $ Six Months Ended June 30 |
|
|
Q2 Sales: State Government Extensions/Expansions Georgia TPL Louisiana Child Support Massachusetts Cost Avoidance New York Cost Avoidance 7/27/2012 7 |

|
|
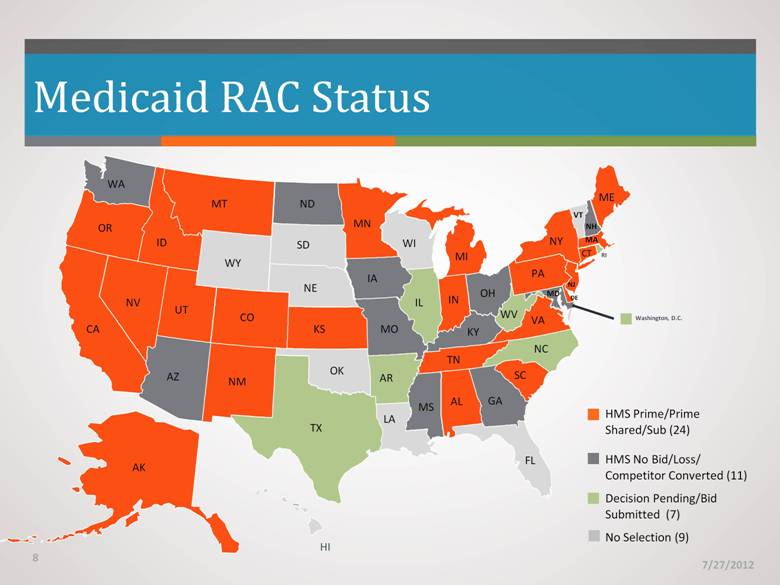
Medicaid RAC Status 7/27/2012 WA OR CA AK HI TX NM AZ NV ID MT WY ND SD NE CO UT KS MO MN IA IL AR OK LA MS AL TN KY IN MI OH GA FL VA NC SC WV PA NY WI ME VT NH CT NJ RI MD DE MA HMS Prime/Prime Shared/Sub (24) HMS No Bid/Loss/Competitor Converted (11) Decision Pending/Bid Submitted (7) No Selection (9) Washington, D.C. 8 |
|
|
Q2 Sales: Managed Care New Health Partners of Minnesota Windsor Health Group Extensions/Expansions Fidelis Humana Neighborhood Health Plan: Massachusetts and New York United Health Care 9 7/27/2012 |
|
|
Supreme Court Decision Individual mandate ruled constitutional Existing federal funding cannot be withheld from States that don’t expand Medicaid Medicaid expansion is now optional for States All other provisions upheld, including Medicaid RAC and Health Insurance Exchanges 7/27/2012 10 |
|
|
Supreme Court Decision - Impact on HMS Medicaid Expansion Medicaid RAC Health Insurance Exchanges 7/27/2012 11 |
|
|
Strategic Outlook Well-positioned in all markets Continued high growth Favorable regulatory environment Medicare and Medicaid RAC leader 7/27/2012 12 |
|
|
7/27/2012 |