Attached files
| file | filename |
|---|---|
| 8-K - CURRENT REPORT - PACER INTERNATIONAL INC | d383103d8k.htm |
EXHIBIT 99.1
Pacer International Reports Second Quarter Results
DUBLIN Ohio, July 26, 2012 (BUSINESS WIRE)–Pacer International, Inc. (Nasdaq: PACR), the asset-light North American freight transportation and logistics services provider, today reported financial results for the three and six month periods ended June 30, 2012.
SECOND QUARTER RESULTS
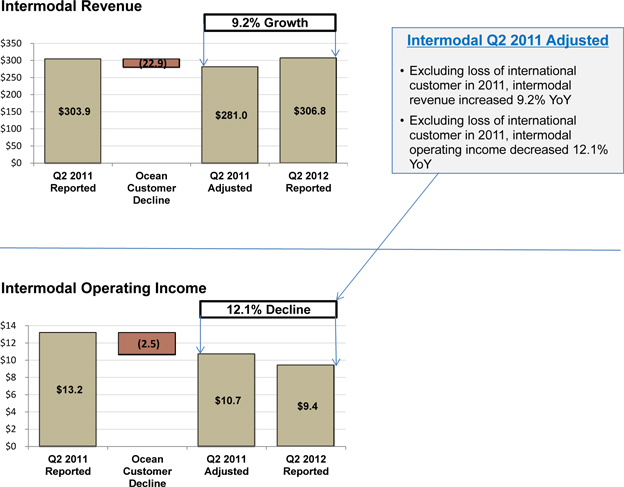
| • | Total intermodal revenue improved $2.9 million or 1.0%. Excluding the impact in volume from an ocean carrier customer of $22.9 million in the second quarter of 2011, intermodal revenues grew by 9.2%. Logistics revenues declined to $61.8 million. In total, revenues decreased by 4.7% to $368.3 million; |
| • | Intermodal gross margin declined by $5.6 million. Excluding the reduced volume from the ocean carrier customer, intermodal gross margin decreased by $3.1 million. Logistics gross margin declined by $2.1 million; |
| • | Income from operations decreased by $5.0 million in the 2012 period compared to the 2011 period. Income from operations in the intermodal segment decreased $3.8 million to $9.4 million. Excluding the reduced volume from the ocean carrier customer, intermodal income from operations decreased year over year by $1.3 million; |
| • | Selling, general and administrative expenses improved by $2.8 million or 7.6%; |
| • | Net income decreased $2.9 million to $1.3 million; and |
| • | Earnings per share decreased from $0.12 in the 2011 period to $0.04 in the 2012 period. |
(In millions, except for per share data)
| 2012 | 2011 | |||||||||||
| Q1 | Q2 | Q2 | ||||||||||
| Revenue |
$ | 345.9 | $ | 368.3 | $ | 386.3 | ||||||
| Gross margin |
$ | 37.8 | $ | 38.6 | $ | 46.3 | ||||||
| Gross margin % |
10.9 | % | 10.5 | % | 12.0 | % | ||||||
| SG&A |
$ | 36.0 | $ | 34.2 | $ | 37.0 | ||||||
| Income from operations |
— | 2.5 | 7.5 | |||||||||
| Net income (loss) |
(0.3 | ) | 1.3 | 4.2 | ||||||||
| Earnings (loss) per share |
$ | (0.01 | ) | $ | 0.04 | $ | 0.12 | |||||
“Our second quarter proved to be a very challenging quarter for us. While our intermodal revenues grew at 9.2% and our domestic volumes in this segment grew by 17.0%, we were unable to take full advantage of this growth with margin and profitability improvement. Our logistics segment operating loss (excluding severance) improved sequentially by $0.9 million, and we have taken several actions in the quarter to improve the financial performance of this segment, however the global freight forwarding market continues to remain quite sluggish,” said Chief Financial Officer John J. Hafferty
“Overall we were pleased with growth in revenue in our intermodal segment as our domestic volumes grew by double digits for the quarter. However, we were disappointed with the overall margins in this segment as we were unable to secure the incremental pricing needed from the railroads to offset our costs. We are committed to continuing our drive for operational excellence in all of our businesses to enhance our competitiveness and improve our margins,” said Chief Executive Officer Dan Avramovich
A tabular reconciliation detailing the adjustments made to arrive at the adjusted financial results set forth above and elsewhere in this press release from financial results determined in accordance with accounting principles generally accepted in the United States of America (“GAAP”) is contained in the reconciliation schedules attached to this press release.
YEAR-TO-DATE RESULTS
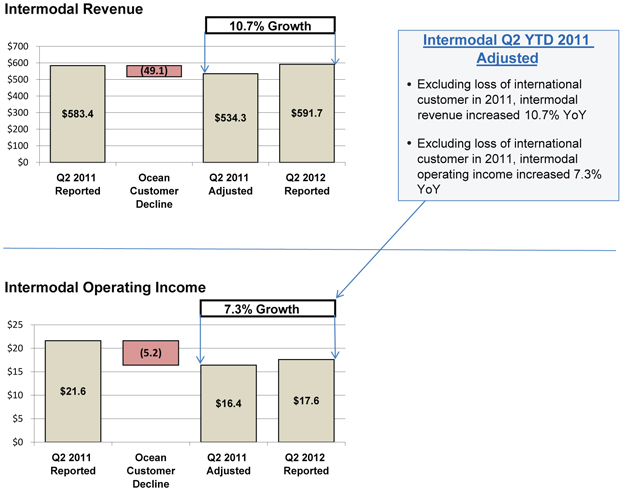
| • | Total intermodal revenue improved $8.3 million or 1.4%. Excluding the impact from the previously announced reduction in volume from an ocean carrier customer of $49.1 million in the first half of 2011, intermodal revenues grew by 10.7%. Logistics revenues declined by 23.9% to $122.9 million. In total, revenues decreased by 4.1% to $714.2 million; |
| • | Intermodal gross margin declined by $7.5 million. Excluding the reduced volume from the ocean carrier customer, intermodal gross margin decreased by $2.3 million. Logistics gross margin declined by $4.5 million; |
| • | Income from operations decreased by $8.9 million in the 2012 period compared to the 2011 period. Income from operations in the intermodal segment decreased $4.0 million to $17.6 million. Excluding the reduced volume from the ocean carrier customer, intermodal income from operations grew year over year by $1.2 million or 7.3%; |
| • | Selling, general and administrative expenses improved by $3.3 million or 4.5%; |
| • | Net income decreased $5.2 million to $1.0 million; and |
| • | Earnings per share decreased from $0.18 in the 2011 period to $0.03 in the 2012 period. |
(In millions, except for per share data)
| 2012 Year-to-Date |
2011 Year-to-Date |
|||||||
| Revenue |
$ | 714.2 | $ | 744.7 | ||||
| Gross margin |
$ | 76.4 | $ | 88.4 | ||||
| Gross margin % |
10.7 | % | 11.9 | % | ||||
| SG&A |
$ | 70.2 | $ | 73.5 | ||||
| Income from operations |
2.5 | 11.4 | ||||||
| Net income |
1.0 | 6.2 | ||||||
| Earnings per share |
$ | 0.03 | $ | 0.18 | ||||
2012 GUIDANCE
We are revising our 2012 guidance and expect our full year revenues to range between $1.450 billion and $1.500 billion, and earnings per share to range between $0.15 and $0.25.
CONFERENCE CALL TODAY Pacer International will hold a conference call for investors, analysts, business and trade media, and other interested parties at 8:30 a.m. ET, today (Thursday, July 26, 2012). To participate, please call five minutes early by dialing (800) 230-1059 (in USA) and ask for “Pacer International Earnings Call.” International callers can dial (612) 234-9959.
An audio-only, simultaneous Webcast of the live conference call can be accessed through the Investors link on the company’s website at www.pacer.com. For persons unable to participate in either the conference call or the Webcast, a digitized replay will be available from July 26, 2012 at 12:30 p.m. ET to August 26, 2012 at 11:59 p.m. ET. For the replay, dial (800) 475-6701 (USA) or (320) 365-3844 (international), using access code 252020. During such period, the replay also can be accessed through the Events Calendar within the Investors link on the company’s website at www.pacer.com
ABOUT PACER INTERNATIONAL (www.pacer.com)
Pacer International, a leading asset-light North American freight transportation and logistics services provider, offers a broad array of services to facilitate the movement of freight from origin to destination through its intermodal and logistics operating segments. The intermodal segment offers container capacity, integrated local transportation services, and door-to-door intermodal shipment management. The logistics segment provides truck brokerage, warehousing and distribution, international freight forwarding, and supply-chain management services. For more information on Pacer International visit www.pacer.com.
SOURCE: Pacer International, Inc.
USE OF NON-GAAP FINANCIAL MEASURES: This press release contains “non-GAAP financial measures” as defined by the Securities and Exchange Commission. These non-GAAP measures are adjusted intermodal revenue, adjusted intermodal gross margin and adjusted intermodal operating income, each of which excludes from 2011 results the impact of the previously announced volume reduction of the ocean carrier customer that transitioned its western business directly to the railroad. Non-GAAP measures are used by management and the Board of Directors in their analysis of the company’s ongoing core operating performance. Management believes that these non-GAAP financial measures provide useful supplemental information that is essential to a proper understanding of the operating results of the company’s core businesses and allows investors to more easily compare operating results from period to period. A tabular reconciliation of the differences between the non-GAAP financial information discussed in this release and the most directly comparable financial information calculated and presented in accordance with GAAP is contained in the financial summary statements attached to this press release.
CERTAIN FORWARD-LOOKING STATEMENTS—This press release contains or may contain forward-looking statements, including earnings per share and revenue guidance for fiscal year 2012, within the meaning of Section 27A of the Securities Act of 1933, as amended, and Section 21E of the Securities Exchange Act of 1934, as amended. These forward-looking statements are based on the company’s current expectations and beliefs and are subject to a number of risks, uncertainties and assumptions. Among the important factors that could cause actual results to differ materially from those expressed or implied in the forward-looking statements are general economic and business conditions including the current U.S. and global economic environment and the timing and strength of economic recovery in the U.S. and internationally; industry trends, including changes in the costs of services from rail, motor, ocean and air transportation providers; changes in contracts and rate agreements with rail service providers; and other risks discussed in the company’s Form 10-K and other filings with the Securities and Exchange Commission, which are incorporated herein by reference. Should one or more of these risks or uncertainties materialize, or should underlying assumptions or estimates prove incorrect, actual results may vary materially from those described herein as anticipated, believed, expected or intended. Except as otherwise required by federal securities laws, the company does not undertake any obligation to update such forward-looking statements whether as a result of new information, future events or otherwise.
####
INVESTOR CONTACT:
Pacer International, Inc.
Steve Markosky, 614-923-1703
VP Investor Relations & Financial Planning & Analysis
steve.markosky@pacer.com
MEDIA CONTACT:
Princeton Partners
Erin Bijas
Senior Account Manager, Public Relations
(609) 452-8500 x118; 732-895-0792 (mobile)
ebijas@princetonpartners.com
Pacer International, Inc.
Unaudited Condensed Consolidated Balance Sheet
(in millions)
| June 30, 2012 | December 31, 2011 | |||||||
| Assets | ||||||||
| Current assets |
||||||||
| Cash and cash equivalents |
$ | 9.0 | $ | 24.0 | ||||
| Accounts receivable, net |
147.0 | 133.5 | ||||||
| Prepaid expenses and other |
19.3 | 12.3 | ||||||
| Deferred income taxes |
3.3 | 4.0 | ||||||
|
|
|
|
|
|||||
| Total current assets |
178.6 | 173.8 | ||||||
|
|
|
|
|
|||||
| Property and equipment |
||||||||
| Property and equipment, cost |
105.8 | 99.8 | ||||||
| Accumulated depreciation |
(59.0 | ) | (56.1 | ) | ||||
|
|
|
|
|
|||||
| Property and equipment, net |
46.8 | 43.7 | ||||||
|
|
|
|
|
|||||
| Other assets |
||||||||
| Deferred income taxes |
14.4 | 14.1 | ||||||
| Other assets |
11.3 | 11.7 | ||||||
|
|
|
|
|
|||||
| Total other assets |
25.7 | 25.8 | ||||||
|
|
|
|
|
|||||
| Total assets |
$ | 251.1 | $ | 243.3 | ||||
|
|
|
|
|
|||||
| Liabilities and Stockholders’ Equity | ||||||||
| Current liabilities |
||||||||
| Accounts payable and other accrued liabilities |
132.8 | 127.1 | ||||||
| Long-term liabilities |
||||||||
| Other |
1.7 | 0.9 | ||||||
|
|
|
|
|
|||||
| Total liabilities |
134.5 | 128.0 | ||||||
|
|
|
|
|
|||||
| Stockholders’ equity |
||||||||
| Common stock |
0.4 | 0.4 | ||||||
| Additional paid-in-capital |
305.4 | 304.7 | ||||||
| Accumulated deficit |
(189.2 | ) | (190.2 | ) | ||||
| Accumulated other comprehensive income |
— | 0.4 | ||||||
|
|
|
|
|
|||||
| Total stockholders’ equity |
116.6 | 115.3 | ||||||
|
|
|
|
|
|||||
| Total liabilities and stockholders’ equity |
$ | 251.1 | $ | 243.3 | ||||
|
|
|
|
|
|||||
Pacer International, Inc.
Unaudited Condensed Consolidated Statements of Operations
(in millions, except share and per share data)
| Three Months Ended | Six Months Ended | |||||||||||||||
| June 30, 2012 | June 30, 2011 | June 30, 2012 | June 30, 2011 | |||||||||||||
| Revenues |
$ | 368.3 | $ | 386.3 | $ | 714.2 | $ | 744.7 | ||||||||
| Operating Expenses: |
||||||||||||||||
| Cost of purchased transportation and services |
307.1 | 315.5 | 592.9 | 607.8 | ||||||||||||
| Direct operating expenses (excluding depreciation) |
22.6 | 24.5 | 44.9 | 48.5 | ||||||||||||
| Selling, general and administrative expenses |
34.2 | 37.0 | 70.2 | 73.5 | ||||||||||||
| Depreciation and amortization |
1.9 | 1.8 | 3.7 | 3.5 | ||||||||||||
|
|
|
|
|
|
|
|
|
|||||||||
| Total operating expenses |
365.8 | 378.8 | 711.7 | 733.3 | ||||||||||||
|
|
|
|
|
|
|
|
|
|||||||||
| Income from operations |
2.5 | 7.5 | 2.5 | 11.4 | ||||||||||||
| Interest expense |
(0.3 | ) | (0.7 | ) | (0.8 | ) | (1.3 | ) | ||||||||
|
|
|
|
|
|
|
|
|
|||||||||
| Income before income taxes |
2.2 | 6.8 | 1.7 | 10.1 | ||||||||||||
| Income tax expense |
(0.9 | ) | (2.6 | ) | (0.7 | ) | (3.9 | ) | ||||||||
|
|
|
|
|
|
|
|
|
|||||||||
| Net income |
$ | 1.3 | $ | 4.2 | $ | 1.0 | $ | 6.2 | ||||||||
|
|
|
|
|
|
|
|
|
|||||||||
| Earnings per share: |
||||||||||||||||
| Basic: |
||||||||||||||||
| Earnings per share |
$ | 0.04 | $ | 0.12 | $ | 0.03 | $ | 0.18 | ||||||||
|
|
|
|
|
|
|
|
|
|||||||||
| Weighted average shares outstanding |
35,090,580 | 34,987,453 | 35,052,353 | 34,968,654 | ||||||||||||
|
|
|
|
|
|
|
|
|
|||||||||
| Diluted: |
||||||||||||||||
| Earnings per share |
$ | 0.04 | $ | 0.12 | $ | 0.03 | $ | 0.18 | ||||||||
|
|
|
|
|
|
|
|
|
|||||||||
| Weighted average shares outstanding |
35,354,393 | 34,999,279 | 35,314,237 | 34,982,579 | ||||||||||||
|
|
|
|
|
|
|
|
|
|||||||||
Pacer International, Inc.
Unaudited Condensed Consolidated Statement of Cash Flows
(in millions)
| Six Months Ended | ||||||||
| June 30, 2012 | June 30, 2011 | |||||||
| Cash Flows from Operating Activities |
||||||||
| Net income |
$ | 1.0 | $ | 6.2 | ||||
| Adjustments to reconcile net income to net cash (used in) provided by operating activities: |
||||||||
| Depreciation and amortization |
3.7 | 3.5 | ||||||
| Amortization of deferred gain on sale lease-back transactions |
(0.4 | ) | (0.3 | ) | ||||
| Deferred taxes |
0.4 | 3.5 | ||||||
| Stock based compensation expense |
0.9 | 1.0 | ||||||
| Changes in operating assets and liabilities: |
||||||||
| Accounts receivable, net |
(13.5 | ) | 0.4 | |||||
| Prepaid expenses and other |
(7.0 | ) | 2.6 | |||||
| Accounts payable and other accrued liabilities |
4.9 | (7.4 | ) | |||||
| Other long-term assets |
0.4 | 0.2 | ||||||
| Other long-term liabilities |
(0.7 | ) | (0.6 | ) | ||||
|
|
|
|
|
|||||
| Net cash (used in) provided by operating activities |
(10.3 | ) | 9.1 | |||||
|
|
|
|
|
|||||
| Cash Flows from Investing Activities |
||||||||
| Capital expenditures |
(6.4 | ) | (3.4 | ) | ||||
| Purchase of railcar assets |
(28.4 | ) | (17.7 | ) | ||||
| Net proceeds from sale lease-back transaction |
30.2 | — | ||||||
| Net proceeds from sales of property and equipment |
0.1 | 0.2 | ||||||
|
|
|
|
|
|||||
| Net cash used in investing activities |
(4.5 | ) | (20.9 | ) | ||||
|
|
|
|
|
|||||
| Cash Flows from Financing Activities |
||||||||
| Net borrowings under revolving line of credit |
— | 11.1 | ||||||
| Repurchase and retirement of Pacer common stock |
(0.1 | ) | (0.1 | ) | ||||
| Withholding tax paid upon vesting of restricted and performance stock units |
(0.1 | ) | — | |||||
|
|
|
|
|
|||||
| Net cash (used in) provided by financing activities |
(0.2 | ) | 11.0 | |||||
|
|
|
|
|
|||||
| Net decrease in cash and cash equivalents |
(15.0 | ) | (0.8 | ) | ||||
| Cash and cash equivalents - beginning of period |
24.0 | 4.2 | ||||||
|
|
|
|
|
|||||
| Cash and cash equivalents - end of period |
$ | 9.0 | $ | 3.4 | ||||
|
|
|
|
|
|||||
Pacer International, Inc.
Unaudited Results by Segment
(in millions)
| Three Months Ended June 30, | Six Months Ended June 30, | |||||||||||||||||||||||||||||||
| 2012 | 2011 | Change | % Change | 2012 | 2011 | Change | % Change | |||||||||||||||||||||||||
| Revenues |
||||||||||||||||||||||||||||||||
| Intermodal |
$ | 306.8 | $ | 303.9 | $ | 2.9 | 1.0 | % | $ | 591.7 | $ | 583.4 | $ | 8.3 | 1.4 | % | ||||||||||||||||
| Logistics |
61.8 | 82.5 | (20.7 | ) | (25.1 | ) | 122.9 | 161.5 | (38.6 | ) | (23.9 | ) | ||||||||||||||||||||
| Inter-segment eliminations |
(0.3 | ) | (0.1 | ) | (0.2 | ) | N/M | (0.4 | ) | (0.2 | ) | (0.2 | ) | N/M | ||||||||||||||||||
|
|
|
|
|
|
|
|
|
|
|
|
|
|
|
|
|
|||||||||||||||||
| Total |
368.3 | 386.3 | (18.0 | ) | (4.7 | ) | 714.2 | 744.7 | (30.5 | ) | (4.1 | ) | ||||||||||||||||||||
| Cost of purchased transportation and services and direct operating expense 1/ |
||||||||||||||||||||||||||||||||
| Intermodal |
279.1 | 270.6 | 8.5 | 3.1 | 537.2 | 521.4 | 15.8 | 3.0 | ||||||||||||||||||||||||
| Logistics |
50.9 | 69.5 | (18.6 | ) | (26.8 | ) | 101.0 | 135.1 | (34.1 | ) | (25.2 | ) | ||||||||||||||||||||
| Inter-segment eliminations |
(0.3 | ) | (0.1 | ) | (0.2 | ) | N/M | (0.4 | ) | (0.2 | ) | (0.2 | ) | N/M | ||||||||||||||||||
|
|
|
|
|
|
|
|
|
|
|
|
|
|
|
|
|
|||||||||||||||||
| Total |
329.7 | 340.0 | (10.3 | ) | (3.0 | ) | 637.8 | 656.3 | (18.5 | ) | (2.8 | ) | ||||||||||||||||||||
| Gross margin |
||||||||||||||||||||||||||||||||
| Intermodal |
27.7 | 33.3 | (5.6 | ) | (16.8 | ) | 54.5 | 62.0 | (7.5 | ) | (12.1 | ) | ||||||||||||||||||||
| Logistics |
10.9 | 13.0 | (2.1 | ) | (16.2 | ) | 21.9 | 26.4 | (4.5 | ) | (17.0 | ) | ||||||||||||||||||||
|
|
|
|
|
|
|
|
|
|
|
|
|
|
|
|
|
|||||||||||||||||
| Total |
$ | 38.6 | $ | 46.3 | $ | (7.7 | ) | (16.6 | )% | $ | 76.4 | $ | 88.4 | $ | (12.0 | ) | (13.6 | )% | ||||||||||||||
| Gross margin percentage |
||||||||||||||||||||||||||||||||
| Intermodal |
9.0 | % | 11.0 | % | (2.0 | )% | 9.2 | % | 10.6 | % | (1.4 | )% | ||||||||||||||||||||
| Logistics |
17.6 | 15.8 | 1.8 | 17.8 | 16.3 | 1.5 | ||||||||||||||||||||||||||
|
|
|
|
|
|
|
|
|
|
|
|
|
|||||||||||||||||||||
| Total |
10.5 | % | 12.0 | % | (1.5 | )% | 10.7 | % | 11.9 | % | (1.2 | )% | ||||||||||||||||||||
| Income (loss) from operations |
||||||||||||||||||||||||||||||||
| Intermodal |
9.4 | 13.2 | (3.8 | ) | (28.8 | ) | 17.6 | 21.6 | (4.0 | ) | (18.5 | ) | ||||||||||||||||||||
| Logistics |
(2.5 | ) | (0.2 | ) | (2.3 | ) | N/M | (5.7 | ) | (0.4 | ) | (5.3 | ) | N/M | ||||||||||||||||||
| Corporate |
(4.4 | ) | (5.5 | ) | 1.1 | (20.0 | ) | (9.4 | ) | (9.8 | ) | 0.4 | (4.1 | ) | ||||||||||||||||||
|
|
|
|
|
|
|
|
|
|
|
|
|
|
|
|
|
|||||||||||||||||
| Total |
$ | 2.5 | $ | 7.5 | $ | (5.0 | ) | (66.7 | )% | $ | 2.5 | $ | 11.4 | $ | (8.9 | ) | (78.1 | )% | ||||||||||||||
| 1/ | Direct operating expenses are only incurred in the intermodal segment |
Pacer International, Inc.
Reconciliation of GAAP Results to Adjusted Results
For the Three and Six Months Ended June 30, 2012 and June 30, 2011
(in millions)
| Three Months Ended June 30, 2012 |
Three Months Ended June 30, 2011 | Adjusted Variance 2012 vs 2011 |
% Adjusted Variance 2012 vs 2011 |
|||||||||||||||||||||
| GAAP Results | GAAP Results |
Adjustments | Adjusted Results |
|||||||||||||||||||||
| Revenues |
||||||||||||||||||||||||
| Intermodal |
$ | 306.8 | $ | 303.9 | $ | (22.9 | ) /1 | $ | 281.0 | $ | 25.8 | 9.2 | % | |||||||||||
| Cost of purchased transportation and services and direct operating expense |
||||||||||||||||||||||||
| Intermodal |
279.1 | 270.6 | (20.4 | ) /1 | $ | 250.2 | 28.9 | 11.6 | ||||||||||||||||
| Gross margin |
||||||||||||||||||||||||
| Intermodal |
27.7 | 33.3 | (2.5 | ) | 30.8 | (3.1 | ) | (10.1 | ) | |||||||||||||||
| Gross margin percentage |
||||||||||||||||||||||||
| Intermodal |
9.0 | % | 11.0 | % | 11.0 | % | 11.0 | % | (2.0 | )% | ||||||||||||||
| Income (loss) from operations |
||||||||||||||||||||||||
| Intermodal |
$ | 9.4 | $ | 13.2 | $ | (2.5 | ) | $ | 10.7 | $ | (1.3 | ) | (12.1 | )% | ||||||||||
| Six Months Ended June 30, 2012 |
Six Months Ended June 30, 2011 | Adjusted Variance 2012 vs 2011 |
% Adjusted Variance 2012 vs 2011 |
|||||||||||||||||||||
| GAAP Results | GAAP Results |
Adjustments | Adjusted Results |
|||||||||||||||||||||
| Revenues |
||||||||||||||||||||||||
| Intermodal |
$ | 591.7 | $ | 583.4 | $ | (49.1 | ) /1 | $ | 534.3 | $ | 57.4 | 10.7 | % | |||||||||||
| Cost of purchased transportation and services and direct operating expense |
||||||||||||||||||||||||
| Intermodal |
537.2 | 521.4 | (43.9 | ) /1 | $ | 477.5 | 59.7 | 12.5 | ||||||||||||||||
| Gross margin |
||||||||||||||||||||||||
| Intermodal |
54.5 | 62.0 | (5.2 | ) | 56.8 | (2.3 | ) | (4.0 | ) | |||||||||||||||
| Gross margin percentage |
||||||||||||||||||||||||
| Intermodal |
9.2 | % | 10.6 | % | 10.6 | % | 10.6 | % | (1.4 | )% | ||||||||||||||
| Income (loss) from operations |
||||||||||||||||||||||||
| Intermodal |
$ | 17.6 | $ | 21.6 | $ | (5.2 | ) | $ | 16.4 | $ | 1.2 | 7.3 | % | |||||||||||
| 1/ | Adjustment to reflect previously announced reduction in volume from an ocean carrier customer that transitioned its western U.S. intermodal business directly to the railroad. Purchased transportation and direct operating expenses were adjusted at the average intermodal margin percentage for the 2011 period. |