Attached files
Table of Contents
UNITED STATES
SECURITIES AND EXCHANGE COMMISSION
Washington, D.C. 20549
FORM 10-K
x ANNUAL REPORT PURSUANT TO SECTION 13 OR 15(D) OF THE SECURITIES EXCHANGE ACT OF 1934
For the fiscal year ended December 31, 2009
OR
¨ TRANSITION REPORT PURSUANT TO SECTION 13 OR 15(D) OF THE SECURITIES EXCHANGE ACT OF 1934
For the transition period from to
Commission file number 000-49828
PACER INTERNATIONAL, INC.
(Exact name of registrant as specified in its charter)
| Tennessee |
62-0935669 | |
| (State or other jurisdiction of organization) |
(I.R.S. employer identification no.) |
2300 Clayton Road, Suite 1200
Concord, CA 94520
Telephone Number (887) 917-2237
Securities registered pursuant to Section 12(b) of the Act:
| Title of each class |
Name of exchange on which registered | |
| Common Stock, par Value $0.01 |
The NASDAQ Stock Market, LLC |
Securities registered pursuant to Section 12(g) of the Act: None
Indicate by check mark if the registrant is a well-known seasoned issuer, as defined in Rule 405 of the Securities Act. Yes No x
Indicate by check mark if the registrant is not required to file reports pursuant to Section 13 or Section 15(d) of the Act. Yes No x
Indicate by checkmark whether the registrant (1) has filed all reports required to be filed by Section 13 or 15(d) of the Securities Exchange Act of 1934 during the preceding 12 months (or for such shorter period that the registrant was required to file such reports), and (2) has been subject to such filing requirements for the past 90 days. Yes x No
Indicate by check mark whether the registrant has submitted electronically and posted on its corporate Web site, if any, every Interactive Data File required to be submitted and posted pursuant to Rule 405 of Regulation S-T (section 232.405 of this chapter) during the preceding 12 months (or for such shorter period that the registrant was required to submit and post such files). Yes No
Indicate by check mark if disclosure of delinquent filers pursuant to Item 405 of Regulation S-K is not contained herein, and will not be contained, to the best of registrant’s knowledge, in definitive proxy or information statements incorporated by reference in Part III of this Form 10-K or any amendment to this Form 10-K. x
Indicate by check mark whether the registrant is a large accelerated filer, an accelerated filer, a non-accelerated filer or a smaller reporting company. See definition of “large accelerated filer,” “accelerated filer” and “smaller reporting company” in Rule 12b-2 of the Exchange Act. (Check one):
| Large accelerated filer | Accelerated filer x | |
| Non-accelerated filer (Do not check if a smaller reporting company) | Smaller reporting company |
Indicate by check mark whether the registrant is a shell company (as defined in Rule 12b-2 of the Exchange Act). Yes No x
The aggregate market value of the voting stock held by non-affiliates of the registrant was approximately $77,466,213 at June 30, 2009 (based on the NASDAQ National Market closing price on that date). For purposes of this calculation, the registrant has assumed that its directors and executive officers are affiliates. On February 3, 2010, the registrant had 34,904,051 outstanding shares of Common Stock, par value $.01 per share.
Documents Incorporated by Reference – Portions of the registrant’s definitive Proxy Statement for the 2010 annual meeting of shareholders which will be filed with the Securities and Exchange Commission within 120 days after the end of the registrant’s fiscal year ended December 31, 2009, have been incorporated by reference into Part III of this Annual Report on Form 10-K to the extent described herein.
Table of Contents
| 3 | ||||
| 3 | ||||
| Item 1. |
5 | |||
| 5 | ||||
| 6 | ||||
| 6 | ||||
| 9 | ||||
| 10 | ||||
| 10 | ||||
| 11 | ||||
| 12 | ||||
| 13 | ||||
| 14 | ||||
| 15 | ||||
| 15 | ||||
| 15 | ||||
| 16 | ||||
| 16 | ||||
| 18 | ||||
| 18 | ||||
| 18 | ||||
| Item 1A. |
18 | |||
| 18 | ||||
| 34 | ||||
| Item 1B. |
35 | |||
| Item 2. |
35 | |||
| Item 3. |
35 | |||
| Item 4. |
36 | |||
| 36 | ||||
| Item 5. |
39 | |||
| Item 6. |
42 | |||
| Item 7. |
Management’s Discussion and Analysis of Financial Condition and Results of Operations |
44 | ||
| Item 7A. |
66 | |||
| Item 8. |
66 | |||
| Item 9. |
Changes in and Disagreements with Accountants on Accounting and Financial Disclosure |
66 | ||
| Item 9A. |
66 | |||
| Item 9B. |
68 | |||
| Item 10. |
69 | |||
| Item 11. |
69 | |||
| Item 12. |
Security Ownership of Certain Beneficial Owners and Management and Related Stockholder Matters |
70 | ||
| Item 13. |
Certain Relationships and Related Transactions, and Director Independence |
71 | ||
| Item 14. |
71 | |||
| Item 15. |
72 | |||
| 78 | ||||
| Index to Consolidated Financial Statements and Financial Statement Schedules |
F-1 | |||
2
Table of Contents
In this Annual Report on Form 10-K, “our company,” “Pacer International,” “we,” “us” and “our” refer to Pacer International, Inc., and its consolidated subsidiaries. Our subsidiary that provides intermodal equipment and arranges rail transportation operates under the name Pacer Stacktrain and is referred to as “Stacktrain” or “Pacer Stacktrain” in this Annual Report on Form 10-K. References to our intermodal segment operations include our Stacktrain operations, our local cartage operations (also referred to as local trucking and drayage) conducted through our subsidiary Pacer Cartage, Inc., and our intermodal marketing operations (also referred to as rail brokerage) conducted through our subsidiary Pacer Transportation Solutions, Inc., formerly known as Pacer Global Logistics, Inc. and is referred to as “Pacer Transportation Solutions” in this Annual Report on Form 10-K. References to our logistics segment operations include our businesses providing highway brokerage, international freight forwarding, supply chain management services and warehousing and distribution services. Our highway brokerage and supply chain management services are conducted through our Pacer Transportation Solutions subsidiary; our warehousing and distribution services and associated port drayage are conducted through our subsidiaries Pacer Distribution Services, Inc., and PDS Trucking, Inc.; and our international freight forwarding operations are conducted through our subsidiaries RF International, Ltd., and Ocean World Lines, Inc. Our former truck services operations which were sold in August 2009 were conducted through our subsidiaries Pacer Transport, Inc., S&H Transport, Inc. and S&H Leasing, Inc. Statements in this Annual Report on Form 10-K as to our size or position relative to our competitors are based on revenues.
Special Note Regarding Forward-looking Statements
This Annual Report on Form 10-K contains forward looking statements, within the meaning of Section 27A of the Securities Act of 1933, as amended, and Section 21E of the Securities Exchange Act of 1934, as amended, that reflect our current estimates, expectations and projections about our future results, performance, prospects and opportunities. Forward-looking statements include, among other things, the information concerning our possible future consolidated results of operations, business and growth strategies, financing plans, our competitive position and the effects of competition, the projected growth of the industries in which we operate, and the benefits to be obtained from our cost reduction initiatives. Forward-looking statements include all statements that are not historical facts and can be identified by forward-looking words such as “anticipate,” “believe,” “could,” “estimate,” “expect,” “intend,” “plan,” “may,” “should,” “will,” “would,” “project” and similar expressions. These forward-looking statements are based on information currently available to us and are subject to a number of risks, uncertainties and other factors that could cause our actual results, performance, prospects or opportunities to differ materially from those expressed in, or implied by, these forward-looking statements. Important factors that could cause our actual results to differ materially from the results referred to in the forward-looking statements we make in this Annual Report on Form 10-K are discussed under “Item 1A. Risk Factors” and elsewhere in this Annual Report on Form 10-K and include:
| · | general economic and business conditions, including the length and severity of the current economic recession; |
| · | industry trends, including changes in the costs of services from rail and motor transportation providers; |
| · | changes resulting from our new arrangements with Union Pacific that will reduce revenues and may compress margins, result in operational difficulties, and reduce our results of operation; |
| · | the terms of new or replacement contracts with our major underlying rail carriers that are less favorable to us relative to our legacy contracts as these expire (including our legacy contract with Union Pacific Railroad Company (“Union Pacific”), expiring in 2011 which continues to apply to our automotive and international lines of business, and our legacy contract with CSX Intermodal (“CSX”), expiring in 2014); |
| · | our ability to borrow amounts under our credit agreement due to borrowing base limitations and/or to comply with the financial ratio and other covenants in our credit agreement; |
3
Table of Contents
| · | increases in interest rates; |
| · | the loss of one or more of our major customers; |
| · | the success of our cost reduction initiatives in improving our operating results and cash flows; |
| · | the effect of the current economic recession and credit market disruption on our customers, including reduced transportation needs and an inability to pay us on time or at all; |
| · | the impact of competitive pressures in the marketplace; |
| · | the frequency and severity of accidents, particularly involving our trucking operations; |
| · | changes in, or the failure to comply with, government regulations; |
| · | changes in our business strategy, development plans or cost savings plans; |
| · | congestion, work stoppages, equipment and capacity shortages, weather related issues and service disruptions affecting our rail and motor transportation providers; |
| · | the degree and timing of changes in fuel prices, including changes in the fuel costs and surcharges that we pay to our vendors and those that we are able to collect from our customers; |
| · | our ability to successfully defend or resolve customer and vendor rate and volume adjustment claims against us; |
| · | changes in international and domestic shipping patterns; |
| · | availability of qualified personnel; |
| · | selecting, developing and implementing applications and solutions to update or replace our diverse legacy systems; |
| · | increases in our leverage; |
| · | our ability to integrate acquired businesses; and |
| · | terrorism and acts of war. |
Our actual consolidated results of operations and the execution of our business strategy could differ materially from those expressed in, or implied by, the forward-looking statements contained in this Annual Report on Form 10-K. In addition, past financial or operating performance is not necessarily a reliable indicator of future performance and you should not use our historical performance to anticipate future results or future period trends. This is especially important given the August 17, 2009 sale of certain assets of our truck services business unit and the new rail carrier transportation arrangements entered into on November 3, 2009 with Union Pacific, which, among other changes, is expected to result in our intermodal marketing company customers transitioning their domestic east-west big box traffic away from us. We can give no assurances that any of the events anticipated or implied by the forward-looking statements we make will occur or, if any of them do occur, what impact they will have on our consolidated results of operations, financial condition or cash flows. In evaluating our forward-looking statements, you should specifically consider the risks and uncertainties discussed under “Item 1A. Risk Factors” in this Annual Report on Form 10-K. Except as otherwise required by federal securities laws, we undertake no obligation to publicly revise our forward-looking statements to reflect events or circumstances that arise after the date of this Annual Report on Form 10-K. All forward-looking statements attributable to us or persons acting on our behalf are expressly qualified in their entirety by the cautionary statements included in this Annual Report on Form 10-K.
4
Table of Contents
We are a leading asset-light North American transportation and logistics services provider. Our strategy is to focus on the end-customer—by coordinating our capabilities with our customers’ transportation network needs we create efficiency and value for shippers—and deliver world-class customer service. Within North America, we operate on one of the largest integrated intermodal services networks and provide complementary logistics services to our customers that are customized to their specific needs. As one of the premier intermodal providers in North America, our intermodal segment represents approximately 75% of our historical total revenues (and approximately 70% of our historical revenues on a pro forma basis after giving effect to intermodal revenues transitioning away from us as a result of our new multi-year contractual arrangements with Union Pacific).
We believe that our competitive advantages include:
| · | our ability to seamlessly operate one of the largest intermodal networks in North America; |
| · | our access to one of the largest intermodal equipment fleets in North America; |
| · | our ability to provide competitive rates and economies of scale to our customers; |
| · | a comprehensive portfolio of transportation and logistics services; |
| · | our opportunity to cross-sell services to existing and potential customers; |
| · | the flexibility to tailor services to our customers’ needs in rapidly changing freight markets; and |
| · | the ability to provide reliable and consistent services. |
We provide transportation and logistics services to numerous Fortune 500 and multi-national companies, including Costco, General Electric, Proctor & Gamble, The Home Depot, Shaw Industries, Union Pacific, Toyota and ConAgra. These companies together represented approximately 18% of our revenues for the fiscal year ending December 31, 2009. We expect that under our new arrangements with Union Pacific, much of the domestic east-west big-box business from third party intermodal marketing companies that we have served in the past will transition away from us during the first quarter of 2010.
Our focus is on delivering a superior, integrated door-to-door intermodal product to the end-shipper/beneficial cargo owners, along with complementary logistics services. In addition, we deliver products and services to two industry verticals – automotive (referred to as the automotive line of business of our intermodal operation) and steamship lines (referred to as the international line of business of our intermodal operation)—tailored specifically to the needs of those industries. Products and services in these verticals include ramp-to-ramp and door-to-door intermodal transportation, on-site operational services, trucking and drayage services, expedited transportation, and customized logistics services.
We utilize an asset-light strategy by which we seek to limit our investment in equipment and facilities and reduce working capital requirements through arrangements with transportation carriers and equipment providers, while continuing with operational strategies that allow us end-to-end control of our intermodal containers. This strategy provides us with access to freight terminals and facilities and control over transportation-related equipment without owning significant assets while also allowing us to have capacity at the right place and the right time to meet our customers’ needs.
In our intermodal segment, our contractual arrangements with our underlying rail carriers and local trucking or drayage companies generally do not require us to pay for rail or truck transportation services that are not needed to service our customers’ shipping needs. We can leverage our controlled intermodal equipment and network so our customers can have access to capacity and transportation at competitive rates.
5
Table of Contents
In our logistics segment, our contractual arrangements with ocean carriers, truck carriers and equipment providers also generally do not require us to purchase or pay for carrier services or for equipment usage or availability that are not required to service our customers’ shipping needs. We believe that this is customary in the non-asset based highway brokerage industries in which our logistics segment competes.
We file or furnish with or to the Securities and Exchange Commission (“SEC”) our quarterly reports on Form 10-Q, annual reports on Form 10-K, current reports on Form 8-K, annual reports to shareholders and annual proxy statements and amendments to such filings. Our SEC filings are available to the public on the SEC’s website at http://www.sec.gov. These reports are also available free of charge from our website at http://www.pacer.com, as soon as reasonably practical after we electronically file or furnish such material with or to the SEC. Information contained on our website is not part of this Annual Report on Form 10-K or of any registration statement that incorporates this Annual Report on Form 10-K by reference.
We provide our transportation services from two operating segments, our intermodal segment, which provides intermodal transportation services principally to beneficial cargo owners (end-user customers), transportation intermediaries and steamship lines who use intermodal transportation, and our logistics segment, which provides highway brokerage, supply chain management services, international freight forwarding, ocean shipping, and warehousing and distribution services to a wide variety of end-user customers.
Intermodal transportation is the movement of freight via trailer or container using two or more modes of transportation which nearly always include rail and truck segments. Our intermodal segment consists of (1) our Stacktrain unit which provides ramp-to-ramp and door-to-door services to third party customers (such as intermodal marketing companies and brokers), primarily in the big box Mexico and small box domestic markets, and to steamship lines, primarily in the international small box market; (2) our Rail Brokerage unit (an intermodal marketing company), which provides integrated door-to-door services to beneficial cargo owners; (3) our Cartage unit, which provides transportation service for our own door-to-door operations as well as for external customers between the customer’s door, ports and rail ramps.
Our logistics segment consists of the following services: Highway Brokerage; International Shipping; Non-Vessel Operating Common Carrier (“NVOCC”) and Freight Forwarding Services; Warehousing and Distribution Services; and Supply Chain Management Services.
Both segments have dedicated management teams and offer different but related products and services. Information about our segments, including revenues, income from operations, and geographic information, is included in Note 10 to the notes to consolidated financial statements included in this report.
Intermodal Services
Rail Brokerage
Our intermodal marketing unit (Rail Brokerage), which is a division of our Pacer Transportation Solutions, Inc. subsidiary, arranges for and optimizes the movement of our end-user customers’ freight in containers and trailers throughout North America using truck and rail transportation. We provide box capacity, drayage capacity, door-to-door shipment management and high quality customer service for our intermodal customers. We arrange for a container or trailer shipment to be picked up at origin by truck (using either our cartage services or other truck carriers directly) and transported to a site for loading onto a train. The shipment is then transported via railroad (using either our Stacktrain services or rail carriers directly) to a site for unloading from the train in the vicinity of the final destination. After the shipment has
6
Table of Contents
been unloaded from the train and is available for pick-up, we arrange for the shipment to be transported by truck (using either our Cartage services or other truck carriers directly) to the final destination. We provide customized electronic tracking and analysis of charges and our own negotiated rail, truck and intermodal rates, and we determine the optimal routes. We also track and monitor shipments in transit, consolidate billing, handle claims of freight loss or damage on behalf of our customers and manage the handling, consolidation and storage of freight throughout the process. Our rail brokerage operations are based in Commerce, CA, Rutherford, NJ, Dublin, OH, and Jacksonville, FL. Our experienced transportation personnel are responsible for operations, customer service, management information systems and our relationships with the rail carriers.
Through our rail brokerage operations, we assist the railroads and our intermodal operation in balancing freight resulting in improved asset utilization. In addition, we serve our customers by passing on economies of scale that we achieve as a volume buyer from railroads, trucking companies and other third party transportation providers, providing access to large equipment pools and streamlining the paperwork and logistics of an intermodal move.
Stacktrain
Our Stacktrain unit has been a leader in the development and use of double-stack intermodal equipment and methodologies. Double-stack intermodal transportation consists of the movement of cargo containers stacked two high on special railcars, which significantly improves the efficiency of our service by increasing capacity at a low incremental cost without sacrificing quality of service. We are a major non-railroad provider of intermodal rail service in North America. We sell intermodal service primarily to intermodal marketing companies, steamship lines, highway brokerage companies, large automotive intermediaries, as well as to our own wholly-owned internal intermodal marketing company, which we refer to in this Form 10-K as our Rail Brokerage unit. We offer both ramp-to-ramp services (rail only services) as well as a door-to-door service offering called PacerDirect. We expect that under our new arrangements with Union Pacific, much of the domestic east-west big-box business from intermodal marketing companies will transition away from us during the first quarter of 2010.
Through multi-year contracts and other operating arrangements with North American railroads, including Union Pacific, CSX, KCSM in Mexico, Norfolk Southern and Canadian National Railroad, we have access to over a 60,000-mile North American rail network serving most major population and commercial centers in the United States, Canada and Mexico. These contracts and arrangements provide for, among other things, competitive rates, minimum service standards, capacity assurances, priority handling and the utilization of nationwide terminal facilities.
We maintain an extensive fleet of double-stack railcars, containers and chassis, substantially all of which are leased. As of December 31, 2009, our equipment fleet consisted of 1,843 double-stack railcars, 25,841 containers and 27,617 chassis (steel frames with rubber tires used to transport containers over the highway). In addition, through arrangements with APL Limited and other shipping companies, we provide customers with access to a large fleet of smaller International Standards Organization (“ISO”) international containers, allowing us to provide additional transportation capacity using these containers as they are being repositioned from destinations within North America back to the West Coast. Our fleet, combined with ocean shipping companies’ ISO containers, makes us a major provider of capacity in all container sizes. The November 3, 2009 agreement with Union Pacific also provides for a fleet sharing arrangement that allows Union Pacific customer access to our equipment fleet and grants us expanded access to Union Pacific’s equipment fleet. Under this equipment arrangement, Union Pacific pays the costs and assumes maintenance and repair responsibilities for the portion of our 53-foot equipment fleet estimated to be necessary to support the domestic east-west big-box traffic from third party intermodal marketing companies that are transitioning to Union Pacific. We retain operating control over the portion of our equipment fleet necessary to support our business. The arrangement also contains mechanisms that allow us to adjust the size of our fleet up or down in the future to address estimated changes in our equipment needs. See Note 5 of the consolidated financial statements for further discussion.
The size of our leased and owned equipment fleet (as well as the smaller ISO international container westbound fleet), the frequent departures available to us through our rail contracts and the
7
Table of Contents
geographic coverage of our rail network provide our customers with single-company control over their transportation requirements, which we believe gives us an advantage in attaining, at a competitive price, the responsiveness and reliability required by our customers. In addition, our access to information technology enables us to continuously track containers, chassis and railcars throughout our transportation network. Through our equipment fleet and arrangements with rail carriers, we can control the equipment used in our intermodal operations and employ full-time personnel on-site at many terminals to ensure close coordination of the services provided at these facilities.
Local Cartage
Our subsidiary, Pacer Cartage, Inc., provides local truck transportation (also called local cartage or drayage) largely in and around major U.S. cities, rail ramps and ports. We contract with independent trucking owner-operators and maintain interchange agreements with many major steamship lines, railroads and intermodal equipment providers for the interchange and use of equipment supplied by these providers. This network allows us to supply door-to-door transportation across the country for shippers, ocean carriers and transportation intermediaries. Currently approximately 915 owner-operator trucks are under contract with us to haul freight for our local cartage operations.
Logistics Services
Highway Brokerage
Through our highway brokerage unit, which is a division of our Pacer Transportation Solutions subsidiary, we arrange the movement of freight in containers or trailers by truck using a nationwide network of over 7,000 available highway carriers. By utilizing our aggregate volumes to negotiate rates, we are able to provide quality service at attractive prices. We provide highway brokerage services throughout North America through our customer service centers in Rutherford, NJ, and Dublin, OH, and our network of independent agents and agencies. We manage all aspects of these services for our customers, including selecting qualified carriers, negotiating rates, tracking shipments, billing and resolving disputes.
As a result of our August 2009 sale of certain assets of our truck services unit, we no longer directly provide flatbed and specialized heavy-haul trucking services to our customers. We now arrange for these services through our highway brokerage operation.
International Freight Forwarding and NVOCC Services
As an international freight forwarder, our subsidiary, RF International, Ltd., provides freight forwarding and customs brokerage services that involve transportation of freight into or out of the United States. As a non-vessel operating common carrier (NVOCC), our subsidiary Ocean World Lines, Inc., manages international shipping for our customers and provides or connects them with the range of services necessary to run a global business. We also provide airfreight forwarding services as an indirect air carrier. Our international product offerings serve more than 1,000 clients internationally through offices in Lake Success, NY, Norfolk, VA, Chicago, IL, Seattle, WA, San Francisco, CA, Los Angeles, CA, Miami, FL, Dublin, OH, Cincinnati, OH, and regional offices in Hamburg, Germany, and Ipswich, U.K., Hong Kong and Shanghai, China and approximately 100 agents worldwide.
As a NVOCC, we arrange the transportation of our customers’ freight by contracting with the actual vessel operator to obtain transportation for a fixed number of containers between various points during a specified time period at an agreed wholesale discounted volume rate. We then are able to charge our customers rates lower than the rates they could obtain directly from actual vessel operators for similar type shipments. We consolidate the freight bound for a particular destination from a common shipping point, prepare all required shipping documents, arrange for any inland transportation, deliver the freight to the vessel operator and arrange transportation to the final destination. At the destination port, acting directly or through our agent, we deliver the freight to the receivers of the goods, which may include customs clearance and inland freight transportation to the final destination. Our contracts with ocean carriers generally require us to pay a small liquidated damage amount for each committed container that we do not ship during the relevant contract period. The aggregate amount of such damages that we have been required to pay in the past has not been material, however, and management believes that such contract terms will not have a material adverse effect on our operating results in the future.
8
Table of Contents
As a customs broker, we are licensed by the U.S. Customs and Border Protection Service to act on behalf of importers in handling customs formalities and other details critical to the importation of goods. We prepare and file formal documentation required for clearance through customs agencies, obtain customs bonds, facilitate the payment of import duties on behalf of the importer, arrange for the payment of collect freight charges, assist with determining and obtaining the best commodity classifications for shipments and assist with qualifying for duty drawback refunds. We provide customs brokerage services to direct domestic importers in connection with many of the shipments that we handle as a non-vessel operating common carrier, as well as shipments arranged by other freight forwarders, non-vessel operating common carriers or vessel operating common carriers.
Warehousing and Distribution
Our warehousing and distribution unit, Pacer Distribution Services, Inc., primarily specializes in servicing the needs of importers looking to move their goods in a timely and efficient manner, either directly to a retailer or to an inland distribution point. To accomplish this objective and deliver superior service to our import customers, we operate multiple facilities in the Los Angeles area that occupy approximately 800,000 square feet. All of these facilities are located within 18 miles of the Southern California ports, making possible a timely and efficient flow of ocean containers to and from our warehouses. To further improve the quality of service and expedite the delivery of ocean freight, our subsidiary, PDS Trucking, Inc., manages a trucking fleet of over 100 owner-operators, many of whom service the Southern California ports on a daily basis. To help our customers reduce their import costs, we have extended the hours of operation of our harbor trucking fleet to take maximum advantage of the program implemented by the Ports of Los Angeles and Long Beach to encourage the movement of cargo at night and on weekends to reduce truck traffic during peak daytime hours.
Our warehousing and distribution unit performs multiple services specifically designed for importers, including:
| · | warehousing/distribution – receiving inventory to stock in order to fulfill future outbound orders, |
| · | value-added services – labeling, price tagging, palletizing, pick/pack and reworking, |
| · | transloading – transferring freight from ocean containers to domestic equipment, rail or road, |
| · | deconsolidation – the sorting of freight for distribution to multiple outbound destinations, and |
| · | consolidation – the collecting of multiple smaller inbound shipments to build full truckloads. |
Supply Chain Management
We use the information from our advanced information system to provide consulting and supply chain management services to our customers. These specialized services, offered through our Pacer Transportation Solutions subsidiary, allow our customers to realize cost savings and concentrate on their core competencies by outsourcing to us the management and transportation of their materials and inventory throughout their supply chain. We provide infrastructure and equipment, integrated with our customers’ existing systems, to handle distribution planning, just-in-time delivery and automated ordering. We also manage warehouses, distribution centers and other facilities for selected customers and consult on identifying bottlenecks in our customers’ supply chains by analyzing freight patterns and costs, optimizing facility locations and developing internal policies and procedures. We leverage these capabilities to drive additional volume to our other service offerings.
Our current intermodal and logistics transportation technology systems provide a scalable migration path designed for the electronic interchange of data between our customers and us, and an Internet-based connectivity that allows us to communicate directly with our customers and transportation service providers. Our systems provide us with performance, utilization and profitability indicators as they
9
Table of Contents
monitor and track shipments across various transportation modes, providing timely visibility regarding shipment status, location and estimated delivery times. Our exception notification system informs us of any potential delays so we can alert our customers to minimize the impact of any problems. Our systems also report transit times, rates, equipment availability and the logistics activity of our transportation service providers, enabling us to plan and execute freight movements more reliably, efficiently and cost effectively.
We manage our intermodal services through the continuous monitoring and tracking of our containers, chassis and railcars throughout the network. This allows us to monitor equipment location and availability and therefore plan and provide for increased equipment utilization and balanced freight flows. We can also prepare and distribute customized accounting and billing reports for our customers as well as management reports to meet federal highway authority requirements.
Pursuant to a long-term information technology services agreement, APL Limited provides us with the computers, software and other information technology services necessary for the operation of our Stacktrain business. We paid an annual fee of $10.7 million in 2009 to APL Limited under this agreement (of which $3.4 million has been subject to a 3% compounded annual increase since May 2003). This agreement with APL Limited has a term expiring in May 2019, and is cancelable by us on 120 days notice without penalty.
On September 30, 2007, we entered into a software license agreement with SAP America, Inc. (“SAP”) under which an enterprise suite of applications was licensed, including the latest release of SAP’s transportation management solution. During 2008 and 2009, the finance and accounting modules of the new system were implemented at all business units. On June 25, 2009, we entered into an amendment to the software license agreement with SAP, under which the software licensed was limited to the financial and accounting applications. In connection with the amendment, we received a cash payment of $22.5 million and wrote-off $22.4 million of previously capitalized software and other associated costs related to the development of the SAP transportation operations modules. We are currently working to develop internally new transportation management and operations solutions to replace and enhance the systems currently provided by APL. The new solutions are expected to include equipment management, pricing, billing and tracking and tracing applications. We expect to complete the development and implementation efforts in 2010 and have notified APL that we intend to cease using its information technology services during the second quarter of 2010. The total capital budget for this project is $6.9 million. We anticipate that annual operating expense savings will be approximately $9 million.
We provide transportation and logistics services to numerous Fortune 500 and multi-national companies, including Costco, General Electric, Proctor & Gamble, The Home Depot, Shaw Industries, Union Pacific, Toyota and ConAgra. These companies together represented approximately 18% of our 2009 revenues. In addition, we provide transportation and logistics services to numerous other shippers and transportation third parties. Other notable customers include The Scotts Company and Whirlpool. Approximately 19% of our 2009 total revenues were related to the automotive industry.
For the fiscal years ended December 31, 2009, December 26, 2008 and December 28, 2007, one customer contributed 10.0%, 10.5%, and 10.4% of our consolidated revenues, respectively.
As of December 31, 2009, we have over 150 direct sales and customer service representatives in our intermodal and logistics segments that sell and support our portfolio of services to a diverse customer base which includes beneficial cargo owners, steamship lines, logistics companies, truck brokers, transportation third parties such as intermodal marketing companies and brokers, and truckload carriers.
Our sales representatives are directly responsible for managing our business relationships with our customers. They expand our business base by cross-selling our portfolio of services to our current and future customer base. They also collaborate with our customer service groups in an effort to provide
10
Table of Contents
problem-solving, cargo tracking services, reporting and the efficient processing of customer orders and inquiries. The domestic direct sales force is also supplemented with approximately 40 sales agents and agencies.
In addition to our direct domestic sales force, we also have an extensive network of sales and customer service representatives for our international NVOCC and freight forwarding business located in nine offices in North America, and regional offices in Hamburg, Germany, and Ipswich, UK, Hong Kong and Shanghai, China along with approximately 100 agents worldwide.
In 2009, our corporate marketing team continued to focus on improving new customer acquisition and existing customer growth through media, public relations, and customer and corporate communications to rapidly connect customers to new products, service improvements, and network expansions. The marketing department also completed surveys and research projects to ascertain customer buying behavior patterns by industry, helping to ensure our services are updated to meet evolving customer requirements.
The marketing team also continued to lead the effort of unifying our business units under a single Pacer brand identity and tag line, “Making Your World Run Smoother,” to more effectively communicate the services capabilities of the Pacer portfolio of services and improve our customers’ ease of doing business with Pacer. This effort included the reduction of eight legacy websites into the newly launched pacer.com website which we expect will improve our customers’ online experience and more effectively communicate the value of the entire Pacer portfolio of services.
We commenced operations as an independent, stand-alone company upon our recapitalization in May 1999. From 1984 until our recapitalization, our Stacktrain business was conducted by various entities owned directly or indirectly by APL Limited.
In May 1999, we were recapitalized through the purchase of shares of our common stock from APL Limited by two affiliates of Apollo Management, and an affiliate of each of Credit Suisse First Boston LLC and Deutsche Bank Securities Inc. and our redemption of a portion of the remaining shares of common stock held by APL Limited. On the date of the recapitalization, we also began providing retail and logistics services to customers through our acquisition of Pacer Logistics, Inc. In connection with these transactions, our name was changed from APL Land Transport Services, Inc. to Pacer International, Inc.
Pacer Logistics, Inc. was originally incorporated on March 5, 1997, under the name PMT Holdings, Inc., and acquired the successor to a company formed in 1974. Between the time of its formation and our acquisition of Pacer Logistics in May 1999, Pacer Logistics acquired and integrated six logistics services companies. On May 31, 2003, Pacer Logistics was merged into Pacer International, Inc.
In 2000, we acquired four companies that complemented our business operations and expanded our geographic reach and service offerings for intermodal marketing, highway brokerage, international freight forwarding and other logistics services. In 2001, we integrated our intermodal marketing, highway brokerage and supply chain services business operations into our Pacer Transportation Solutions subsidiary.
In June 2002, we completed our initial public offering of common stock and used the net proceeds to repay a significant portion of our outstanding long-term debt. During June and July 2003, we completed the refinancing of our credit facilities, including the early redemption of $150 million of 11.75% senior subordinated notes originally issued in connection with our May 1999 recapitalization. In August 2003, we completed an underwritten secondary public offering of common stock on behalf of a number of selling stockholders; no new shares were issued and we received no proceeds from this offering.
On January 7, 2004, we filed with the SEC a “shelf” registration statement, providing for our issuance of up to $150 million in additional common stock, preferred stock and warrants to purchase any of such securities and for the sale by a number of selling stockholders of 8,702,893 shares of common stock.
11
Table of Contents
In offerings under the registration statement in April and November 2004, all 8,702,893 shares of common stock of the selling stockholders were sold with no new shares issued or proceeds received by the company. Upon completion of the offerings, Apollo Management and its affiliated entities no longer owned any shares of our common stock. There are currently no arrangements in place for the company to issue any additional securities, and the registration statement has expired.
On August 17, 2009, we closed the sale of certain assets of Pacer Transport, Inc., S&H Transport, Inc. and S&H Leasing, Inc., which comprised our former truck services unit, to subsidiaries of Universal Truckload Services, Inc. (“UTSI”) under a Limited Asset Purchase Agreement signed on July 24, 2009. In connection with the sale, subsidiaries of UTSI assumed the real property leases and equipment leases for tractors and trailers used by the former truck services unit – as well as certain customer, agent and other agreements. As a result of this transaction, we no longer directly provide flatbed and specialized heavy-haul trucking services to our customers. We now arrange for these services through our highway brokerage operation.
On November 3, 2009, we entered into new arrangements with Union Pacific whereby we agreed that rates for domestic big box shipments payable by us to Union Pacific for transportation on the Union Pacific network would adjust gradually over a two-year period to “market” rates and would continue on competitive terms after October 11, 2011, the expiration date of our legacy agreement with Union Pacific. We also entered into a fleet sharing arrangement with Union Pacific that allows Union Pacific customer access to our equipment fleet and grants us expanded access to Union Pacific’s equipment fleet. The arrangement also contains mechanisms that allow us to adjust the size of our fleet up or down in the future to address estimated changes in our equipment needs. The new commercial agreement has a multi-year term and thereafter will automatically renew for one-year periods subject to certain conditions, including a minimum volume requirement, and subject to cancellation by either party with specified notice. See “Item 1A. Risk Factors” below and Note 5 of the consolidated financial statements for further discussion.
Railroads
We have multi-year contracts and other operating arrangements with most of the major North American railroads, including Union Pacific, CSX, Norfolk Southern, KCSM in Mexico, and Canadian National Railroad. These contracts and arrangements generally provide for access to terminals controlled by the railroads as well as support services related to our Stacktrain operations. Through these contracts and arrangements, our intermodal business has established an extensive North American rail transportation network. Our rail brokerage business also maintains contracts with the railroads that govern the transportation services and payment terms pursuant to which the railroads handle intermodal shipments. These contracts are typically of short duration, usually twelve-month terms, and subject to regular renewal or extension. We maintain close working relationships with all of the major railroads in the United States and will continue to focus our efforts on strengthening these relationships. The rail contracts with Union Pacific and CSX represent a majority of our Stacktrain unit’s cost of purchased transportation, while other business with CSX is covered by shorter-term commercial arrangements. Business with other railroads, including the Burlington Northern Santa Fe, Canadian National Railroad and KCSM, constituted approximately 13% of our Stacktrain unit’s cost of purchased transportation in 2009.
Through our contracts and arrangements with these rail carriers, we have access to over a 60,000 mile rail network throughout North America. Our rail contracts and arrangements generally require the rail carriers to perform point-to-point linehaul transportation and terminal services for us. Pursuant to the service provisions, the rail carriers provide transportation of our intermodal equipment across their rail networks and terminal services related to loading and unloading of containers, equipment movement and general administration. Our rail contracts and arrangements generally establish per container rates for Stacktrain shipments made on the rail carriers’ transportation networks. The terms of our rail contracts and arrangements, including rates, are generally subject to adjustment or renegotiation throughout the term of the contract or arrangement, based on factors such as the continuing fairness of the contract terms, prevailing market conditions and changes in the rail carriers’ costs to provide rail service. Based upon these provisions, and the volume of freight that we ship with each of the rail carriers, we believe that we enjoy competitive transportation rates for our intermodal shipments.
12
Table of Contents
Agents and Independent Contractors
In our local trucking operations, we rely on the services of independent owner-operators who supply tractors and drivers for us as well as a few agents, who procure business for and manage a group of trucking contractors. Although we have leased a number of new tractors as part of our program to comply with California-emissions reducing rules, the majority of our truck equipment and drivers are provided by independent contractors. Our relationships with independent contractors and agents allow us to provide customers with local trucking services without the need to commit capital to acquire and maintain a large trucking fleet. Although our agreements with independent trucking contractors and agents are typically long-term in practice, they are generally terminable by either party on short notice.
Independent trucking contractors and agents are compensated on the basis of mileage rates, fixed fees between particular origins and destinations, fixed fees within certain distance-based zones or a fixed percentage of the revenue generated from the shipments that they arrange or haul. Under the terms of our typical tractor lease contracts, independent trucking contractors must pay all of the expenses of operating their equipment, including driver wages and benefits, fuel, physical damage insurance, maintenance and debt service.
Local Trucking Companies
To support our intermodal operations, we have established a good working relationship with a large network of local truckers in many major urban centers throughout the United States. The quality of these relationships helps ensure reliable pickups and deliveries, which is a major differentiating factor among intermodal marketing companies. Our strategy has been to concentrate business with a select group of local truckers in a particular urban area, which increases our economic value to the local truckers and in turn raises the quality of service that we receive from them.
Our intermodal equipment fleet consists of a large number of double-stack railcars, containers and chassis that are owned or subject to short and long-term leases. We lease approximately 95% of our containers, approximately 88% of our chassis and approximately 89% of our double-stack railcars.
At December 31, 2009, a substantial portion of the chassis and containers included in the table below were under the operational management and control of Union Pacific pursuant to the November 3, 2009 agreement between Pacer and Union Pacific. The November 3, 2009 agreement provides for a fleet sharing arrangement that allows Union Pacific customer access to our equipment fleet and grants us expanded access to Union Pacific’s equipment fleet. Under the new equipment arrangement, Union Pacific pays the costs and assumes maintenance and repair responsibilities for the portion of our 53-foot equipment fleet estimated to be necessary to support the domestic east-west big-box traffic from third party intermodal marketing companies that are transitioning to Union Pacific. We retain operating control over the portion of our equipment fleet necessary to support our business. The arrangement also contains mechanisms that allow us to adjust the size of our fleet up or down in the future to address estimated changes in our equipment needs. See Note 5 to the consolidated financial statements for further discussion.
All of our railcar equipment is associated with revenue generating arrangements. Our railcar fleet consists of “free running” railcars operating under the publicly reported “BRAN” mark. These railcars are in general service with railroads throughout North America to haul not only our own intermodal containers but also those of the railroads and their other customers. Under this system, our railcars are freely interchanged from one rail carrier to another throughout the North American rail system. To use our railcars, the rail carrier pays us a fee, known as the car hire rate, which takes into account the miles traveled by a railcar and the railcar’s time in service with a railroad. The actual rate payable is determined under our bilateral rate agreement with the railroad, or in the case of a railroad with which we have no rate agreement, under our schedule of car hire rates maintained in the Car Hire Accounting Rate Master (CHARM) administered by Railinc in association with the Association of American Railroads. We are solely responsible for the costs of operating our railcars and do not have any recourse to our customers for the lease or purchase of our railcars.
13
Table of Contents
As of December 31, 2009, our Stacktrain equipment fleet consisted of the following:
| Owned | Leased | Total | ||||
| Containers |
||||||
| 48’ Containers |
4 | 1,080 | 1,084 | |||
| 53’ Containers |
1,186 | 23,571 | 24,757 | |||
| Total |
1,190 | 24,651 | 25,841 | |||
| Chassis |
||||||
| 20’and 40’ Chassis |
1 | 907 | 908 | |||
| 48’ Chassis |
2,797 | 688 | 3,485 | |||
| 53’ Chassis |
483 | 22,741 | 23,224 | |||
| Total |
3,281 | 24,336 | 27,617 | |||
| Double-stack Railcars |
203 | 1,640 | 1,843 | |||
During 2009, we returned 2,250 primarily 53-ft. leased containers and sold 597 primarily 53-ft. owned containers, returned 2,396 leased chassis, and sold 709 primarily 48-ft. owned chassis and received 818 primarily 53-ft. leased chassis. During 2009, six leased railcars were destroyed.
During 2008, we received 3,079 primarily 53-ft. leased containers and 3,038 primarily 53-ft leased chassis, and returned 2,423 primarily 48-ft. leased containers, 2,275 primarily 48-ft. and 40-ft. leased chassis, and sold 1,282 48-ft. owned chassis. During 2008, one leased railcar was destroyed.
During 2007, we received 1,658 primarily 53-ft. leased containers and 1,072 53-ft., 48-ft. and 40-ft. leased chassis, and we returned 2,191 primarily 48-ft. leased containers, 1,596 primarily 48-ft. and 40-ft. leased chassis, and sold 618 48-ft. owned. During 2007, four railcars were destroyed.
We also lease a limited amount of equipment to support our local trucking operations. The majority of our local trucking operations are conducted through contracts with independent trucking companies and contractors that own and operate their own equipment. In late 2008 and early 2009, the fleets of our local trucking and port drayage operations in Southern California transitioned to 230 new tractors operated by independent contractors in response to the Clean Truck Program of the Port of Los Angeles and the Port of Long Beach. The California Air Resources Board (“CARB”) has also issued regulations that impact drayage trucks that operate within 80 miles of California’s ports and rail yards. Beginning January 1, 2010, trucks with model year 1993 and older model year engines and 1994-2003 engines not equipped with certified devices (e.g. particulate filters) were banned from entering California ports and intermodal rail yards. On October 9, 2009, the Port of Oakland adopted a strict dirty truck ban effective January 1, 2010. Drayage trucks with engine year models between 1994 and 2003 will have to be retrofitted with particulate filters to enter the port. To allow our drayage operations to continue to operate in California, we transitioned the existing owner-operator fleet to 110 new trucks that comply with the CARB regulations in late 2009.
In our rail and highway brokerage operations, we typically require all motor carriers to which we tender freight to carry at least $1,000,000 in truckers’ commercial automobile liability insurance and $100,000 in motor truck cargo insurance. Some carriers provide insurance exceeding these minimums. Railroads, which are largely self-insured, provide limited common carrier liability protection, generally up to $250,000 per container. We maintain an all-risk form of cargo insurance to protect us against cargo damage claims that may not be recoverable from the responsible carriers or their insurers.
In our operations as an authorized carrier or warehouseman, we maintain legal liability insurance to protect us against catastrophic claims arising from damage or loss to freight in transit or warehouse storage. We also maintain property damage insurance to protect us against damage to our railcars and intermodal equipment.
14
Table of Contents
Our terms of carriage on international and ocean shipments limit our liability consistent with industry standards. We offer our NVOCC and freight forwarding customers the option to purchase all risk cargo insurance for their shipments.
We also purchase insurance policies for commercial automobile liability, truckers’ commercial automobile liability, commercial general liability, employers’ liability, and umbrella and excess umbrella liability, with a total insurance limit of $50 million. Our historical self-retained (deductible) levels vary based on claim frequency, severity and timing factors. Our current deductible level per occurrence for commercial automobile liability is $25,000. Our current deductible level per occurrence for truckers’ commercial automobile liability is $500,000 for our Pacer Cartage operations and $100,000 for our PDS Trucking operation. Our current deductible level per occurrence for commercial general liability is $100,000. Our current workers compensation and employers liability deductible is $150,000 per incident. Our current deductible per occurrence for freight damage as an authorized carrier or warehouseman is $250,000, with the exception of our cartage operations which carry a $10,000 deductible.
We are a party to a long-term agreement with APL Limited involving domestic transportation of APL Limited’s international freight by our Stacktrain operation. The majority of APL Limited’s imports to the United States are transported by rail from ports on the West Coast to population centers in the Midwest and Northeast. Our agreement with APL also permits Pacer to place empty APL equipment into domestic intermodal freight service originating predominantly in eastern and mid-western production centers to consumption centers on the West Coast thereby repositioning APL’s international equipment to their respective return ports at a reduced cost. Combining the typical westbound freight movement with the predominantly eastbound APL Limited freight movement allows us to achieve higher train-set utilization (loads per train) and higher eastbound/westbound volumes. We also provide APL Limited with equipment repositioning services through which we transport APL Limited’s empty containers from destinations within North America to their West Coast points of origin. To the extent we are able to fill these empty containers with the westbound freight of other customers, we receive compensation from both APL Limited for our repositioning service on a cost reimbursement basis and from the other customers for the shipment of their freight.
APL Limited also supplies us with computer software and other information technology services for our Stacktrain business. See “Information Technology,” above.
The transportation industry has historically performed cyclically as a result of economic recession, customers’ business cycles, increases in prices charged by third-party carriers, interest rate fluctuations and other economic factors, many of which are beyond our control. Beginning in 2008 and continuing throughout 2009, the U.S. and global economy underwent a severe economic slowdown, characterized by many as a recession, which has impacted the viability of our rail and truck transportation providers and our customer’s demands for our services. While some improvement in economic conditions was seen in the second half of 2009, the pace of recovery and even the continuation thereof can not be predicted. During economic downturns, reduced overall demand for transportation services will likely reduce demand for our services and exert downward pressures on rates and margins. In periods of strong economic growth, demand for limited transportation resources can result in increased rail network congestion and resulting operating inefficiencies. Although rail service deterioration increases our costs and may slow demand, we believe that our personnel on-site at many terminals, access to an extensive equipment fleet and customer service capabilities enable us to provide comparatively better service than others affected by rail service deterioration and thereby to retain shipping volumes. We also participate during periods of business expansion when speed of service to fill inventories increases in importance.
The transportation services industry is highly competitive. Our intermodal business competes primarily with over-the-road full truckload carriers, conventional intermodal movement of trailers-on-flatcars and containerized intermodal rail services offered directly by railroads and other intermodal services
15
Table of Contents
providers. Our logistics business competes primarily against other domestic non-asset-based transportation and logistics companies, asset-based transportation and logistics companies, third-party freight brokers, freight forwarders and private shipping departments. We also compete with transportation services companies for the services of independent commissioned agents, and with trucklines for the services of independent contractors and drivers. Competition in our intermodal and logistics business is based primarily on freight rates, quality of service, such as damage-free shipments, on-time delivery and consistent transit times, reliable pickup and delivery and scope of operations. Our major competitors include Union Pacific, CSX Intermodal, J.B. Hunt Transport, Schneider National and the Hub Group. Other competitors include C.H. Robinson, Exel, Alliance Shippers, Burlington Northern Santa Fe and the supply chain solutions divisions of Ryder and Menlo Worldwide. Some of these competitors, such as C.H. Robinson, Expeditors International, Union Pacific and CSX Intermodal, have significantly larger operations, revenues and resources than we have.
As of December 31, 2009, we had a total of 1,042 employees. None of our employees are represented by unions, and we generally consider our relationships with our employees to be satisfactory.
Regulation of Our Trucking and Intermodal Operations
The transportation industry has been subject to legislative and regulatory changes that have affected the economics of the industry by requiring changes in operating practices or influencing the demand for, and cost of, providing transportation services. We cannot predict the effect, if any, that future legislative and regulatory changes may have on our business or consolidated results of operations.
Our highway brokerage operations are licensed by the U.S. Department of Transportation, or “DOT,” as a national freight broker in arranging for the transportation of general commodities by motor vehicle. The DOT prescribes qualifications for acting as a national freight broker, including surety bonding requirements. Our local cartage operations provide motor carrier transportation services that require registration with the DOT and compliance with economic regulations administered by the DOT, including a requirement to maintain insurance coverage in minimum prescribed amounts. Other sourcing and distribution activities may be subject to various federal and state food and drug statutes and regulations. Although Congress enacted legislation in 1994 that substantially preempts the authority of states to exercise economic regulation of motor carriers and brokers of freight, we continue to be subject to a variety of state vehicle registration and licensing requirements. We and the carriers upon which we rely are also subject to various federal and state safety and environmental regulations.
Our operations serving ports and rail yards are also subject to recent regulatory initiatives such as the Ports of Los Angeles and Long Beach clean truck program, CARB drayage truck regulation and Port of Oakland truck ban. The CARB has issued regulations that impact drayage trucks that operate within 80 miles of California’s ports and rail yards. By January 1, 2010, trucks with model year 1994-2003 engines must be equipped with certified devices (e.g. particulate filters) that meet California and Federal emission standards. Trucks with model year 1993 and older will be banned from entering California ports and intermodal rail yards commencing January 1, 2010. On October 9, 2009, the Port of Oakland adopted a strict dirty truck ban effective January 1, 2010. Drayage trucks with engine year models between 1994 and 2003 will have to be retrofitted with particulate filters to enter the port. This truck ban goes beyond the requirements of the CARB regulations by establishing a turn-away requirement for non-compliant trucks at the port, whereas the CARB intends to assess fines against the motor carrier and owner-operator for entering a port or ramp with a non-compliant truck. The Ports of Los Angeles and Long Beach also instituted a Clean Truck Program which bans pre-1989 trucks from the Ports, imposes fees on shipments handled with trucks that do not meet 2007 emission standards, and requires trucking companies to comply with a variety of requirements to remain eligible for port access.
In addition to the these “clean truck” regulations affecting our California drayage operations, we may be subject to climate change regulation, including restrictions, caps, taxes, or other controls on emissions of greenhouse gases, including diesel exhaust. Such regulation could significantly increase our
16
Table of Contents
operating costs. Restrictions on emissions could also affect our customers that manufacture or produce goods that consume significant amounts of energy or burn fossil fuels, including automakers and other manufacturers, and thereby affect demand for our transportation services.
Although compliance with regulations governing licenses in these areas has not had a material adverse effect on our consolidated results of operations, financial condition or cash flows in the past, there can be no assurance that these regulations or changes in these regulations will not adversely affect our consolidated results of operations, financial condition or cash flows in the future. Violations of these regulations could also subject us to fines or, in the event of serious violations, suspension or revocation of operating authority or port access as well as increased claims liability.
Intermodal operations like ours were exempted from virtually all active regulatory supervision by the U.S. Interstate Commerce Commission, predecessor to the regulatory responsibilities now held by the U.S. Surface Transportation Board. Such exemption is revocable by the Surface Transportation Board, but the standards for revocation of regulatory exemptions issued by the Interstate Commerce Commission or Surface Transportation Board are high. While that exemption remains in place, the DOT issued final regulations in December 2008, which became effective in June 2009, that make intermodal equipment providers like our Stacktrain unit subject to the Federal Motor Carrier Safety Regulations for the first time. The regulation, among other requirements, obligates Stacktrain to register and file with the Federal Motor Carrier Safety Administration an Intermodal Equipment Provider Report, establish a systematic inspection, repair and maintenance program on its chassis and maintain documentation of the program. Intermodal equipment providers must comply with portions of the new regulations by December 2009. Some elements of the federal regulations that were supposed to become effective in December 2009, including the obligation to submit Driver Vehicle Inspection Reports and Driver Vehicle Examination Reports, have been delayed until June 30, 2010. Our annual incremental additional cost of the chassis maintenance and repair program required under the new regulations will be between $0.5 million and $1.0 million. Under the new equipment agreement with Union Pacific, compliance with these federal regulations for our 53-foot equipment being operated in the Union Pacific network will be the responsibility of Union Pacific.
Regulation of Our International Freight Forwarding Operations
We maintain licenses issued by the U.S. Federal Maritime Commission as an ocean transportation intermediary. These licenses govern both our operations as an ocean freight forwarder and as a non-vessel operating common carrier. The Federal Maritime Commission has established qualifications for ocean transportation intermediaries, including surety bond requirements. The Federal Maritime Commission also is responsible for the regulation and oversight of non-vessel operating common carriers that contract for space with vessel operating carriers and sell that space to commercial shippers and other non-vessel operating common carriers for freight originating and/or terminating in the United States. Non-vessel operating common carriers are required to publish and maintain tariffs that establish the rates to be charged for the movement of specified commodities into and out of the United States. The Federal Maritime Commission has the power to enforce these regulations by commencing enforcement proceedings seeking the assessment of penalties for violation of these regulations. For ocean shipments not originating or terminating in the United States, the applicable regulations and licensing requirements typically are less stringent than in the United States. We believe that we are in substantial compliance with all applicable regulations and licensing requirements in all countries in which we transact business.
We are also licensed as a customs broker by the U.S. Customs and Border Protection Service of the Department of Treasury in each United States customs district in which we do business. All United States customs brokers are required to maintain prescribed records and are subject to periodic audits by the Customs Service. In other jurisdictions in which we perform customs brokerage services, we are licensed, where necessary, by the appropriate governmental authority. We believe we are in substantial compliance with these requirements.
17
Table of Contents
In connection with certain pending litigation and other claims, we have estimated the range of probable loss and provided for such losses through charges to our consolidated statements of operations. These estimates have been based on our assessment of the facts and circumstances at each balance sheet date and are subject to change based upon new information and future events.
From time to time, we are involved in disputes that arise in the ordinary course of business, and we expect such disputes to continue to arise from time to time in the future. We are currently involved in certain legal proceedings as discussed in “Item 3. Legal Proceedings,” and “Note 9. – Commitments and Contingencies” to our consolidated financial statements included in this report. Based on currently available information and advice of counsel, we believe that we have meritorious defenses to the claims against us and that, except as discussed in “Item 3. Legal Proceedings,” and “Note 9. – Commitments and Contingencies” to our consolidated financial statements included in this report, none of these claims will have a material adverse impact on our consolidated financial position, results of operations or cash flows. Our present assessment of these claims could change, however, based on new information and future events. In addition, even if successful, our defense against certain actions could be costly and could divert the time and resources of our management and staff.
Our facilities and operations are subject to federal, state and local environmental, hazardous materials transportation and occupational health and safety requirements, including those relating to the handling, labeling, shipping and transportation of hazardous materials, discharges of substances into the air, water and land, the handling, storage and disposal of wastes and the cleanup of properties affected by pollutants. See the discussion above under the heading “Government Regulation” for more information about environmental regulations affecting our businesses. In particular, a number of our facilities have underground and above-ground storage tanks for diesel fuel and other petroleum products. These facilities are subject to requirements regarding the storage of such products and the clean-up of any leaks or spills. We could also have liability as a responsible party for costs to clean-up contamination at off-site locations where we have sent, or arranged for the transport of, wastes. We have not received any notices that we are potentially responsible for material clean-up costs at any off-site waste disposal location. We do not currently anticipate any material adverse effect on our capital expenditures, consolidated results of operations or competitive position as a result of our efforts to comply with environmental requirements, nor do we believe that we have any material environmental liabilities. We also do not expect to incur material capital expenditures for environmental controls in 2010. However, future changes in environmental regulations or liabilities from newly discovered environmental conditions could have a material adverse effect on our business, competitive position, results of operations, financial condition or cash flows.
Our revenues generally show a seasonal pattern as some customers reduce shipments during and after the winter holiday season. In addition, the auto companies that we serve generally shut down their assembly plants for new model re-tooling during the summer months.
Adverse economic conditions may harm our business and results of operations.
During 2008 and continuing in 2009, the U.S. and global economies slowed dramatically as a result of a variety of serious problems, including turmoil in the credit and financial markets, concerns regarding the stability and viability of major financial institutions and the Big Three U.S. automakers, the state of the housing markets and volatility in fuel prices and worldwide stock markets. Given the magnitude and widespread nature of these nearly unprecedented circumstances, the U.S. and global
18
Table of Contents
economies could remain significantly challenged in a recessionary state for an indeterminate period of time. While we are closely watching and evaluating the development of these conditions and taking steps to mitigate their effect on our operations, these economic conditions, which are beyond our control, could cause many of our existing and potential customers to reduce or discontinue their use of our products and services for some time and possibly be unable to meet contractual terms or payment obligations with us, which in turn would harm our business by adversely affecting our revenues, results of operations, cash flows and financial condition. We cannot predict the duration of these economic conditions, the extent to which they may worsen or the impact they will have on our customers, vendors or business. The economic recession negatively impacted our freight volumes in 2008 and 2009 and thus our income from operations and is expected to continue to adversely affect our results in 2010.
Continuation or further worsening of these difficult financial and macroeconomic conditions could have a significant adverse effect on our revenues, profitability and results of operations.
Changes in freight rates, as a result of competition in our industry and pricing strategies of our transportation suppliers, could adversely affect our business and results of operations.
The transportation services industry is highly competitive. Our logistics segment competes primarily against other domestic asset-based and non-asset based transportation and logistics companies, third-party freight brokers, shipping departments of our customers and other freight forwarders. Our intermodal segment competes primarily with over-the-road full truckload carriers, conventional intermodal movement of trailers on flat cars, and containerized intermodal rail services offered by railroads and other intermodal service providers. Some of our competitors have substantially greater financial, marketing and other resources than we do, which may allow them to withstand better an economic downturn, reduce their prices more easily than we can or expand or enhance the marketing of their products. There are a number of large companies competing in one or more segments of our industry, although the number of companies with a North American network that offer a full complement of logistics services is more limited. Depending on the location of the customer and the scope of services requested, we must compete against both the niche players and larger entities. In addition, customers are increasingly soliciting competitive bids for transportation services from a number of competitors, including competitors that are larger than we are. We also face competition from Internet-based freight exchanges, or electronic bid environments, that provide an online marketplace for buying and selling supply chain services.
Historically, competition has created downward pressure on freight rates. In the past and in the current economic recession, we have experienced downward pressure in the pricing of our intermodal and logistics services that has affected our revenues and operating results. In particular, our intermodal segment has offered lower rates to our customers to match lower rates offered by our railroad competitors in the intermodal business. Rate reductions by truckload carriers may also exert downward pressures on intermodal rates. Such rate reductions have in the past and could continue to adversely affect the yields of our intermodal product.
Rate increases, particularly when taken by our railroad and motor transportation suppliers, may also have an adverse impact if our brokerage operations are unable to obtain commensurate price increases from our customers, on a timely basis or at all. Because transportation costs represent such a significant portion of our costs, even a relatively small increase in transportation costs, if we are unable to pass them through to customers, is likely to have a significant effect on our margins and operating income. Even variances between the time that the supplier assesses higher charges and the time we are able to begin collecting higher charges from our customers can deteriorate margins and operating income. Transportation rate increases may also have the impact of slowing overall demand for intermodal and other transportation services and thereby affect our consolidated results of operations.
Our new arrangements with Union Pacific which replaced significant portions of our Union Pacific legacy agreement are expected to adversely affect our revenues and may compress margins and reduce our results of operation.
As discussed in Note 5 of the consolidated financial statements and the MD&A, on November 3, 2009, we entered into agreements with Union Pacific under which, among other things, the rates, terms and
19
Table of Contents
conditions of the legacy contract between Pacer and Union Pacific will no longer apply to our domestic big box shipments and rates payable by Pacer to Union Pacific for domestic big box shipments will gradually adjust over a two-year period to “market” rates. As anticipated, under these new arrangements with Union Pacific, the domestic big box business that we have historically handled for IMC customers on the Union Pacific network is transitioning away from us. Such business accounted for $248.8 million and $391.3 million of our total revenues in 2009 and 2008, respectively. In addition to the loss of revenues from IMC big box traffic, the transition of these IMC volumes will change our historical equipment flows, requiring us to intensify efforts to match freight between origins and destinations and undertake further efforts to maintain equipment balance. Any failure or delay in managing our equipment flows would negatively affect our operating costs and our results of operations. Lower pricing to maintain equipment flows, higher empty repositioning charges and similar activities related to equipment balance may also compress margins.
While the rates we will pay for domestic big box transportation on Union Pacific adjust to “market” levels over the next two years, to the extent that such rate adjustments cannot be passed through to our customers or competitive pressures and excess capacity continue to depress transportation rates, our margins and profitability would decrease. Similarly, to the extent that we are not able to reduce our employment levels and other costs to match the reduced revenues resulting from the transition out of the IMC domestic big box business, our business and results of operation will be further adversely affected. We will face additional adverse operational and financial consequences if we are unable to increase our market share among shippers, increase volumes and gain efficiencies in our local drayage operation, or achieve other strategic objectives to improve our performance and operating results.
The transition of our east-west IMC big box container business volumes and the fleet sharing arrangements with Union Pacific will require changes to our systems and operations. While we maintain a daily focus on delivering seamless transportation services to our customers, these systems and operational changes could adversely impact orderly transportation processing, equipment location data integrity and operating efficiency, and, consequently, may have an adverse effect on customer relationships and resultant freight volumes.
Our business and results of operations could be further adversely affected when the remaining portions of our legacy contract with Union Pacific expire in October 2011.
In October 2011, the rates we pay under the legacy Union Pacific agreement for specified international customer (i.e., ocean carrier) shipments (20-, 40- and 45-foot containers) expire. Although the new arrangements with Union Pacific establish terms and conditions that will apply after October 11, 2011 to provide Pacer with a continued exclusive position on the Union Pacific network with regard to offering services to meet ocean carrier customers’ needs in conjunction with and in addition to the Union Pacific rail transportation service, our revenues and margins from the international line of business may decline. Revenues from this line of business accounted for 8.4%, 10.6% and 9.8% of our consolidated revenues in 2009, 2008 and 2007, respectively.
In addition, we will continue to service our north/south Mexico automotive business under the terms of our legacy agreement with Union Pacific through its October 11, 2011 expiration date. While we are continuing to discuss with Union Pacific the terms and conditions, including rates, upon which we will be able to continue to provide our north/south automotive products and services beyond the term of the legacy agreement, no assurance can be given as to whether we will be able to agree with Union Pacific on any such new terms and conditions or whether any such new terms and conditions agreed upon will be as favorable as the terms and conditions provided to us under the legacy contract. As approximately 19% of our revenues in 2009 and 20% of our revenues in 2008 and 2007 were from customers in the automotive industry, our failure to enter into new arrangements with Union Pacific with respect to the continued provision of our north/south Mexico automotive business beyond the term of the legacy contract would have a material adverse effect on our revenues and results of operations. In addition, any such new arrangements that we may enter into with Union Pacific with respect to this business, including with respect to rates, may be less favorable to us than the terms of our current arrangements under the legacy contract which could have a material adverse effect on our operating margins and results of operations.
20
Table of Contents
We are dependent on the automotive industry which has experienced significant declines as a result of the current economic downturn.
Approximately 19% of our revenues in 2009 and 20% of our revenues in 2008 and 2007 were to customers in the automotive industry. Our automotive industry volumes declined significantly through the first half of 2009 reflecting the significant declines in sales of vehicles that automotive manufacturers globally have experienced because of the current economic downturn, deteriorating credit conditions, and volatile fuel costs. In particular, there has been significant concern regarding the long-term viability of the Big Three U.S. auto manufacturers, whose sales of vehicles have also shown significant erosion. Chrysler and General Motors each received emergency funding from the U.S. government in late 2008 and on April 30, 2009 and June 1, 2009, respectively, filed for Chapter 11 bankruptcy protection. General Motors, which emerged from bankruptcy on July 10, 2009, has closed dozens of factories, dropped U.S. brands and shut down up to 40% of its network of 6,000 dealerships. Chrysler, which emerged from bankruptcy on June 10, 2009, idled most of its manufacturing operations during May 2009 pending completion of its alliance with Fiat. Notwithstanding any further federal support provided to the domestic automotive industry, the financial prospects of certain of our significant direct and indirect customers in the automotive industry remain highly uncertain.
These extended automotive plant shutdowns and significant production cuts that occurred during the first half of 2009, greatly reduced shipments to and from affected plants. While our automotive volumes have increased since August 2009 from earlier lows due, in part, to the “cash for clunkers” program which ended in 2009, there can be no assurance that this improvement will continue in the future. Besides the traffic reductions from the Big Three U.S. auto manufacturers, a large number of our customers are also suppliers of automotive products whose own viability and operating results are tied to the long-term viability and operating results of automotive manufacturers. Continued deterioration in the business of North American automobile manufacturers and suppliers would adversely affect our revenues, both from the automobile manufacturers and suppliers of automotive products, as well as our results of operations and cash flows.
The borrowing base formula under our A&R Credit Agreement could limit the amount of borrowings available to us thereunder and may limit our flexibility to react to industry or economic conditions.
On August 28, 2009, we entered into an Amended and Restated Credit Agreement (the “A&R Credit Agreement”) with Bank of America, N.A., as Administrative Agent and Swing Line Lender, the letter of credit issuers parties thereto, the lenders parties thereto, and Banc of America Securities, LLC, as Sole Lead Arranger and Sole Book Manager. The A&R Credit Agreement provides for a $125 million revolving credit facility subject to increase to $175 million if certain conditions are met. While the A&R Credit Agreement is expected to adequately provide for our capital needs, the amount of borrowings available to us thereunder is subject to a daily determination which is based upon a detailed borrowing base formula which is calculated on a monthly basis by reference to the amount of our outstanding borrowings (including outstanding letters of credit), 85% of our eligible accounts receivable and certain equipment, an availability reserve and an availability block, each as defined in the A&R Credit Agreement. See “Item 7. Management’s Discussion and Analysis of Financial Condition and Results of Operations – Liquidity and Capital Resources” and Note 3 of the consolidated financial statements included in this Annual Report on Form 10-K for a more detailed description of the borrowing base formula.
As a result of the borrowing base formula in the A&R Credit Agreement, changes in the amount of our eligible account receivables and equipment or the value thereof could limit the amount of borrowings available to us under the facility and thus our liquidity. In addition, the amount of the availability reserve is subject to increase at the reasonable discretion of the administrative agent of the A&R Credit Agreement which could further limit the amount of our available borrowings and our liquidity.
If outstanding borrowings (including outstanding letters of credit) exceed the available borrowing base at any time, we must immediately repay any borrowings in excess of the borrowing base (or in some cases cash collateralize outstanding letters of credit). In such event we may not have available other sources of liquidity to make such payment which would result in an event of default under the A&R Credit Agreement, allowing the lenders thereunder to declare all borrowings under the facility to be immediately
21
Table of Contents
due and payable. Due to these terms, from time to time we may experience liquidity and capital constraints which could limit our flexibility to react to industry or economic conditions or changes in our business and operating results. Under the borrowing base calculation determined as of December 31, 2009, $45.2 million was available under the A&R Credit Agreement, net of $23.0 million in outstanding loans and $22.7 million of outstanding letters of credit and a $2.0 million availability block.
Our debt agreements require us to maintain lockbox accounts and contain other operating and financial restrictions which may limit our business and financing activities.
As required by the A&R Credit Agreement, our cash collections are deposited into lockbox accounts managed by our lenders. The deposited cash receipts are automatically swept to reduce our outstanding loan balance. Consequently, our ability to direct our funds to parties other than our lenders is compromised, and all of our operating working capital needs are financed through borrowings under the A&R Credit Agreement. If the lenders do not provide funding under the A&R Credit Agreement to the maximum extent permitted under the borrowing base formula due to the occurrence of an event of default or otherwise, our liquidity, results of operations and financial condition would be materially adversely affected.
Along with the lockbox requirements, the A&R Credit Agreement includes other operating and financial restrictions and covenants that adversely affect our ability to finance future operations or capital needs or to engage in other business activities. For instance, the A&R Credit Agreement limits our annual capital expenditures to $6.5 million for 2010 and thereafter plus 50% of any prior years’ under-usage. Accordingly, maximum annual permitted capital expenditures for 2010 are $8.1 million. The A&R Credit Agreement also restricts or limits our ability to: (1) pay dividends and redeem or repurchase capital stock; (2) prepay, redeem or purchase debt; (3) incur liens and engage in sale and leaseback transactions; (4) make loans and investments; (5) incur additional indebtedness; (6) amend or otherwise change debt and other material agreements; (7) engage in mergers, acquisitions and asset sales; (8) enter into transactions with affiliates; and (9) change our primary business. Our credit facility also requires us to meet a fixed charge coverage ratio as more specifically described in “Item 7. Management’s Discussion and Analysis of Financial Condition and Results of Operations—Liquidity and Capital Resources.” The A&R Credit Agreement also contains customary representations and warranties and is secured by a first priority, perfected security interest in substantially all of the present and future tangible and intangible assets, intercompany debt, stock or other equity interests owned by us, our domestic subsidiaries, and a portion of the stock or other equity interests of certain of our foreign subsidiaries.
A breach of any of the representations, restrictions, covenants, or ratios in the A&R Credit Agreement could result in a default under that agreement. Other events of default include our failure to pay certain debt, the occurrence of a default with respect to any indebtedness of the company and its subsidiaries resulting in, or which permits, the acceleration, repurchase, repayment or redemption of such indebtedness, certain insolvency and bankruptcy proceedings, certain ERISA events, unpaid judgments over a specified amount, or a change in control as defined in the A&R Credit Agreement. A default under the A&R Credit Agreement (which would trigger a cross-default under some of our equipment leases) could, depending on actions taken by our lenders and lessors, have a material adverse effect on our liquidity, financial condition, results of operations, business and prospects. If we are in default under the A&R Credit Agreement and/or our other financing arrangements and our obligations thereunder were declared immediately due and payable, we would not have sufficient cash flow from operations or other available sources of liquidity to repay such obligations.
Since our relationships with the major North American railroads are critical to our ability to provide intermodal transportation services, our business may be adversely affected by any adverse change to those relationships.
We have important relationships with most of the major U.S. railroads supported by multi-year contracts and other operating arrangements. To date, the railroads have chosen to allow us, other intermodal marketing companies and other intermodal competitors to market their intermodal services and supply intermodal equipment to many beneficial cargo owners rather than marketing their services directly to all beneficial cargo owners. Under the new Union Pacific arrangements, we have agreed to reduce the
22
Table of Contents
amount of IMC business handled by our Stacktrain operation in 48- and 53-foot domestic east-west equipment and to focus on offering our services directly to beneficial cargo owners. While we believe our new Union Pacific arrangements demonstrate Union Pacific’s commitment to us and other intermediaries, if one or more of the major railroads were to decide to change their strategy regarding our business and other intermodal intermediaries, the margins and volume of intermodal shipments we arrange would likely decline, which could adversely affect our results of operations and financial condition.
Our multi-year rail contracts, which have varied expiration dates, contain favorable provisions that we believe enable us to provide competitive transportation rates and services to our customers. In particular, our new multi-year arrangements with Union Pacific automatically renew for one-year periods subject to certain conditions, our legacy contract with Union Pacific expires in October 2011, and our current CSX Intermodal contract expires in December 2014. Our loss of one or more of these contracts or failure to enter into renewal or replacement contracts with comparably favorable terms upon expiration of the current contract or contracts could materially adversely affect our business, results of operations and cash flows. While we expect to be able to continue to obtain competitive terms and conditions from our railroad vendors, no assurance can be given that such terms and conditions will be comparable to those in our current rail contracts. See “Our business and results of operations could be adversely affected when the remaining portions of our legacy agreement with Union Pacific expire in October 2011.”
We are dependent upon third parties for equipment, capacity and services essential to operate our business, and if we fail to secure sufficient equipment, capacity or services, we could lose customers and revenues.
We are dependent upon rail, truck and ocean transportation services and transportation equipment such as chassis and containers provided by independent third parties, and, after transition to the new Union Pacific arrangement, our chassis and containers will be provided through Union Pacific, rather than directly procured and managed by us. Under the November 3, 2009 equipment arrangement, Union Pacific is responsible for the costs and management of the portion of the 53-foot chassis and containers leased by us estimated to be necessary to support the domestic east-west big-box traffic from third party intermodal marketing companies that are transitioning to Union Pacific. We retain operating control over the portion of our equipment fleet necessary to support our business consistent with our historical control over that equipment. We expect that our expanded access to Union Pacific’s equipment fleet will help accommodate short-term surges in demand for intermodal equipment. The new equipment arrangement also contains mechanisms that allow us to adjust the size of our fleet up or down in the future to address estimated changes in our equipment needs. Historically, procuring new chassis and containers, which are manufactured overseas, has required several months lead time, and we expect the schedule for obtaining additional equipment under the new Union Pacific arrangement to be similar to our historical experience. Although the new Union Pacific equipment arrangement is not intended to, and we do not expect that it will, affect our access to or control over the intermodal equipment necessary to support our business, we are still in the transition period under the new Union Pacific equipment arrangements and cannot predict its full impact. We, along with competitors in our industry, have experienced equipment and capacity shortages in the past, particularly during peak shipping season in October and November.
We also depend upon the rail carriers to provide sufficient rail slots on the train to transport our containers and access to the rail terminal for the delivery of our containers for shipment. From time to time, as with other users of Union Pacific’s rail service, we have not been able to obtain sufficient gate reservations for all containers to be shipped on a particular day and have had to wait for the gate reservation necessary to allow the container to enter the rail terminal and to be loaded on the train. If we cannot secure sufficient transportation equipment, capacity or services from these third parties to meet our customers’ needs and schedules, customers may seek to have their transportation and logistics needs met by other providers on a temporary or permanent basis, which could materially adversely affect our business, consolidated results of operations and financial condition.
Likewise, the intermodal industry from time to time faces excess demand for the current rail network size, which causes network congestion and service delays and allows rail carriers to implement rate increases and to limit volumes. In addition, the trucking industry, including the local drayage community, has difficulty from time to time maintaining a consistent supply of qualified drivers. Shortages
23
Table of Contents
such as this may cause our motor transportation suppliers to increase drivers’ compensation, thereby increasing our cost of providing motor transportation, including the local cartage portion of an intermodal move, to our customers. Driver shortages and tight rail capacity could adversely impact our profitability and limit our ability to expand our intermodal and highway service offerings.
Network changes, lane closures, rail congestion, carrier consolidation and other reductions or deterioration in rail services could increase costs, decrease demand for our intermodal services and adversely affect our operating results.
We depend on the major railroads in the United States for substantially all of the intermodal transportation services that we provide. In many markets, rail service is limited to a few railroads or even a single railroad. As a result, any reduction or elimination of service to a particular market may limit our ability to serve some of our customers. Furthermore, reductions in service by the railroads are likely to increase the cost of the rail-based services that we provide and reduce the reliability, timeliness and overall attractiveness of our intermodal product. Increases in the cost of rail service reduce some of the advantages of intermodal transportation compared to truck and other transportation modes, and may reduce demand for our intermodal services.
From 2003 to 2007, train resource shortages, severe weather, operating inefficiencies and high demand for rail transportation resulted in increased transit times, terminal congestion and decreased equipment velocity. With slowing volumes in 2008 and 2009 combined with the railroad’s recent capital investments and operating improvements, rail transit times have improved. While we believe that our customer service capabilities, access to an extensive equipment fleet and network of personnel on-site at many terminals enables us to lessen the impact to our intermodal customers of these service disruptions, rail service issues increase our costs and create a challenging operating environment. To the extent that we operate on rail carriers that experience poor service performance, demand for our intermodal services may be adversely affected, and customers may switch to alternate providers to avoid intermodal transportation delays.
In addition to reducing or eliminating routes and experiencing service disruptions, rail carriers may engage in further consolidations. Rail consolidations have caused service disruptions in the past and would further reduce service choices and bargaining power for rail customers. As a result, further consolidation among railroads might adversely affect intermodal transportation and our results of operations.
Congestion, work stoppages, capacity shortages, weather related issues or other disruptions affecting the transportation network could adversely affect our operating results.
As transportation services are provided through a network of rail and trucking transportation providers, a disruption in one area or in one sector can affect the flow of traffic over the entire network. In addition, our business could be adversely affected by labor disputes between the railroads and their union employees. Negotiations that began in November 2004 between the railroads and rail unions for new collective bargaining agreements were concluded with the remaining unions (yardmasters, United Transportation Union and International Association of Machinists) in 2008. These union agreements resolve all wages, work rule and benefit issues through December 31, 2009 and continue until amended. In late 2009, negotiations began between the railroads and rail unions for new collective bargaining agreements. Our business could also be adversely affected by a work stoppage at one or more railroads.
Our business could also be adversely affected by a work stoppage affecting providers of local trucking services to and from rail terminals. For example, during 2004, independent owner-operators providing local drayage services in parts of California refused to transport shipments to and from the rail facilities, leading to terminal congestion and a Union Pacific embargo on shipments to Northern California destinations which adversely affected our consolidated results of operations in the second quarter of 2004. In 2008, independent owner-operators in Northern California again refused to transport shipments to protest high fuel prices which negatively impacted our second quarter results. We have also experienced service disruptions due to other conditions, such as hurricanes, flooding and other adverse weather conditions, that hinder the railroads’ and local trucking companies’ ability to provide transportation services and negatively impact our operating results.
24
Table of Contents
Work stoppages affecting seaports may also adversely impact our operations as we experienced in the second half of 2002 when West Coast ports were shut down as a result of a labor dispute with the longshoremen who offload freight that we subsequently transport. Third party international loadings, container repositioning revenue and railcar utilization revenues from our intermodal segment were adversely impacted during the port shutdown. The shutdown also impacted our local cartage and harbor drayage on the West Coast with lower volumes and our international freight forwarding operations with reduced ship sailings. Other work stoppages, slowdowns or other disruptions, such as those that could result from an act of terrorism or war, are beyond our control and could adversely affect our operating income and cash flows in both our intermodal and logistics segments, particularly if they have a material effect on major railroad interchange facilities or areas through which significant amounts of our rail shipments pass, such as the Los Angeles and Chicago gateways.
Continued disruption in credit markets may adversely affect our customers and as a result our business, financial condition, and results of operations.
Disruptions and constraints in the financial and credit markets, such as those experienced in 2008 and 2009, may adversely affect our business and our financial results. The tightening of credit markets may reduce the funds available to our customers to purchase our services for an unknown, and perhaps lengthy, period. It may also result in customers extending times for payment and may result in our having higher customer receivables with increased default rates. Furthermore, as we are moving products and services for other businesses, the tight credit markets may reduce funds available to consumers and businesses purchasing from our shipping customers and thereby reduce demand for our shipper’s products and services and their consequent need for our transportation services. Likewise, general concerns about the fundamental soundness of domestic and foreign economies may also cause consumers and others to reduce the amount of products and services they purchase from our shipping customers, which would translate into reduced shipping volumes, even if consumers, businesses and shippers have cash or if credit is available to them.
Our revenues could be reduced by the loss of major customers.
We have derived, and believe we will continue to derive, a significant portion of our revenues from our largest customers. In 2009, Union Pacific affiliate(s) accounted for approximately 10% of our revenues and our 10 largest customers accounted for approximately 39% of our revenues. The loss of one or more of our major customers or a significant change in their shipping patterns could have a material adverse effect on our revenues, business and prospects.
Ongoing insurance and claims expenses could adversely affect our earnings.
We are exposed to claims related to property damage, personal injury, cargo loss and damage and workers’ compensation. We carry significant insurance with third party insurance carriers. The cost of such insurance has varied over the past five years, reflecting the level of our operations, the insurance environment for our industry, our claim experience and our self-retained (deductible) level. We have maintained self-retained (deductible) levels for our public liability exposures to optimize cost efficiency, reflecting our claims experience and the insurance environment for our industry. Our current deductible per occurrence for commercial automobile liability is $25,000. Our current deductible level for truckers’ commercial automobile liability is $500,000 for our Pacer Cartage operations and $100,000 for our PDS Trucking operations. Our current deductible level per occurrence for commercial general liability is $100,000. Our current workers compensation and employers liability deductible is $150,000 per incident. Our current deductible per occurrence for freight damage as an authorized motor carrier or warehouseman is $250,000, except for our cartage operations which carry a $10,000 deductible. We are also responsible for legal expenses within our deductible levels for liability and workers’ compensation claims. We currently accrue the estimated probable loss for incurred and reported but not yet paid claim amounts and expenses, and regularly evaluate and adjust our claim accruals to reflect actual experience. If the ultimate results differ from our estimates, we could incur costs in excess of accrued amounts. To cover claims and expense in excess of our deductible levels, we maintain insurance with insurance companies that we believe are financially sound. Although we believe our aggregate insurance limits are sufficient to cover
25
Table of Contents
reasonably expected claims, it is possible that one or more claims could exceed those limits. If the number or severity of claims within our deductible levels increases, or if we are required to accrue or pay additional amounts because the claims prove to be more severe than our original assessment, our operating results would be adversely affected.
Clean truck requirements in California could adversely affect our business and profitability.
The CARB has issued regulations that impact drayage trucks that operate within 80 miles of California’s ports and rail yards. As of January 1, 2010, trucks with model year 1994-2003 engines must be equipped with certified devices (e.g. particulate filters) to meet California and Federal emission standards. Trucks with engine model years 1993 and older are banned from entering California ports and intermodal rail yards commencing January 1, 2010. CARB plans to collect fines against the motor carrier and the owner-operator for entering a port or ramp with a non-compliant truck.
On October 9, 2009, the Port of Oakland adopted a strict dirty truck ban effective January 1, 2010. Drayage trucks with engine year models earlier than 1994 will be banned at the Port of Oakland and trucks with engine year models between 1994 and 2003 will have to be retrofitted with particulate filters to enter the port. This truck ban goes beyond the requirements of the CARB regulations by establishing a turn-away requirement for non-compliant trucks at the port.
On October 1, 2008, the ports of Los Angeles and Long Beach began implementing clean truck plans that ban the use of pre-1989 trucks in the ports, require trucks accessing the ports to comply with phased-in emission standards and require trucking companies accessing the ports to sign concession agreements that impose a number of conditions. In February 2009, the ports began charging shippers a $70 per container fee for each 40-foot or longer container ($35 per 20-foot container) moving in and out of the ports by trucks that do not meet 2007 emissions standards.
We have initiated programs that have transitioned our California owner-operator fleets to trucks that comply with the emission standards in order to allow continued access to the ports and ramps. Among other increased costs, we have been and will continue to be required to pay the owner-operators higher fees for their services due to expected demand for the limited supply of emission compliant tractors and the owner-operators’ need and desire to recover the increased lease or acquisition costs of such tractors. Our ability to meet our customers’ requirements, maintain our competitive position and preserve our profitability would be adversely impacted if we are unable to bring a sufficient number of emission-compliant trucks into our contractor fleet. Furthermore, our profitability will also be adversely affected if we are unable to collect higher charges from our customers to cover our increased costs.
New Port of Los Angeles employee driver requirements could adversely affect our business and operations by requiring us to significantly change how we provide our services at the port or cause us to cease doing business at the port.
In addition to the requirements described in the preceding risk factor, the port of Los Angeles clean truck plan has a requirement that would require trucking companies to increase the percentage of employee drivers servicing the port of Los Angeles from 20% by December 31, 2009 to 100% by December 31, 2013. While a federal court has ordered the port of Los Angeles to suspend enforcement of this and other provisions of the port of Los Angeles plan until litigation about these provisions is resolved, should this element of the port plan become effective, we would either have to change from our current owner-operator structure to an employee driver structure to service the port of Los Angeles or cease business at this location. Operating an employee fleet to service the port of Los Angeles and an independent owner-operator fleet for the rest of our local transportation network could result in operational inefficiencies, increased costs, and reduced profitability. In addition, no assurance can be given that other California ports will not impose similar employee driver requirements.
26
Table of Contents
We may not have sufficient cash to service our indebtedness.
Our ability to service our indebtedness will depend upon, among other things:
| · | Our future financial and operating performance, which will be affected by prevailing economic conditions and financial, business, regulatory and other factors, some of which are beyond our control; and |
| · | The future availability of borrowings under our credit facility or any successor facility, the availability of which may depend on, among other things, our complying with certain covenants. |
If our operating results and borrowings under our credit facility are not sufficient to service our current or future indebtedness, we will be forced to take actions such as reducing or delaying investments, strategic alliances or capital expenditures, and may be required to sell assets or restructure or refinance our indebtedness, or seek additional equity capital or bankruptcy protection. There is no assurance that we can affect any of these remedies on satisfactory terms, or at all.
Our customers who are also competitors could transfer their business to their non-competitors and our suppliers who are also competitors could provide preferences to others, including their own competing operations, which in both cases would decrease our profitability.
As a result of our company operating in two distinct but related channels, we buy and sell transportation services from and to many companies with which we compete. For example, the Hub Group, NYK Logistics and Alliance Shippers, who together accounted for 6.4% of the 2009 revenues of our intermodal segment operations, are also competitors. As expected under the new arrangement with Union Pacific, most of these IMC customers that are also competitors are transitioning their domestic east-west big box traffic away from us, but we continue to offer our 20-foot, 40-foot and 48-foot container services and Mexico cross border services to these IMC customers. The loss of one or more of these customers will have a material adverse effect on our revenues and could have a material adverse effect on the profitability of our intermodal operations. In addition, rather than outsourcing their transportation logistics requirements to us, some of our customers could decide to provide these services internally, which could further adversely affect our business volumes and revenues.
Similarly, our Stacktrain business competes in some cases with the intermodal service offerings of our rail transportation providers and their affiliated equipment provider operations. For example, CSX Intermodal and Union Pacific, two of our primary rail transportation providers, offer transcontinental and other long-haul intermodal transportation services that compete with our Stacktrain services. Our rail transportation providers may provide preferences to their internal service offerings or to other customers that are not competitors. These preferences could have a material adverse effect on the profitability of our intermodal operations and on our ability to continue to provide efficient intermodal services to our customers.
If we fail to develop, integrate, upgrade or replace our information technology systems, we may lose orders and customers or incur costs beyond our expectations.
Increasingly, we compete for customers based upon the flexibility and sophistication of the information technologies that support our current services or any new services that we may introduce. The failure of the hardware or software that supports our information technology systems, the loss of data contained in the systems, or our customers’ inability to access or interact with our website and other systems could significantly disrupt our operations, prevent our customers from placing orders, or cause us to lose orders or customers. If our information technology systems are unable to handle additional volume for our operations as our business and scope of services grow, our service levels, operating efficiency and future freight volumes will decline. In addition, we expect customers to continue to demand more sophisticated, fully integrated information systems from their supply chain management service providers. If we fail to hire qualified personnel to implement and maintain our information technology systems or fail to upgrade or replace our information technology systems to handle increased volumes, meet the demands of our customers and protect against disruptions of our operations, we may lose orders and customers which could adversely affect our business.
27
Table of Contents
As discussed above under “Item 1. Business—Information Technology,” after successfully implementing the finance and accounting modules licensed from SAP at all business units during 2008 and early 2009, in June 2009, we entered into an amendment to the software license agreement with SAP, under which the software licensed was limited to the financial and accounting applications. We are currently working to develop internally new transportation management and operations solutions to replace and enhance the systems annually provided by APL. The new solutions are expected to include equipment management, pricing, billing and tracking and tracing applications. We expect to complete the development and implementation efforts in 2010 and have notified APL that we intend to cease using its information technology services during the second quarter of 2010. If replacement systems do not operate as anticipated or contain unforeseen problems, our business, consolidated results of operations, financial condition and cash flows could be materially adversely affected. We may also experience operational difficulties consolidating our current systems, moving to a common set of operational processes and implementing a successful change management process. These difficulties may impact our clients and our ability to efficiently meet their needs. Any such delays or difficulties may have a material and adverse impact on our business, client relationships and financial results.
If we have difficulty attracting and retaining independent contractors and agents, our consolidated results of operations could be adversely affected.
We rely extensively on the services of independent contractors and, to a lesser extent, agents to provide our local and port drayage services. We rely on a fleet of vehicles which are owned and operated by independent trucking contractors as well as agents representing groups of trucking contractors to transport customers’ goods by truck. Although we believe our relationships with our independent contractors and agents are good, we may not be able to maintain our relationships with them. Contracts with independent contractors and agents are, in most cases, terminable upon short notice by either party. If an agent terminates its relationship with us, some customers and independent contractors with which such agent has a direct relationship may also terminate their relationship with us. We may have difficulty replacing our independent contractors and agents with equally qualified persons. We compete with transportation service companies and trucking companies for the services of agents and with trucking companies for the services of independent contractors and drivers. The pool of contractors, drivers and agents is limited, and therefore competition from other transportation service companies and trucking companies can increase the price we must pay to obtain services from contractors, drivers and agents. From time to time the trucking industry experiences a shortage of independent contractors resulting in increased compensation expenses to us and our competitors who also rely on them. In addition, because independent contractors are not employees, they may not be as loyal to our company, requiring us to pay more to retain their services and to implement aggressive recruitment efforts to offset turnover. If we are unable to attract or retain independent contractors and agents or need to increase the amount paid for their services, our consolidated results of operations could be adversely affected and we could experience difficulty increasing our business volume. This adverse effect was seen in 2005 and 2006 as the cost of qualified driver acquisition and retention increased and negatively impacted our consolidated results of operations. Driver acquisition and retention issues remain a focus of our drayage operations, and we continue to implement programs to manage driver turnover.
We, our suppliers and our customers are subject to changes in government regulation which could result in additional costs and thereby affect our consolidated results of operations.
The transportation industry is subject to legislative and regulatory changes that can affect its economics. Although we primarily operate in the intermodal segment of the transportation industry, which has been essentially deregulated, changes in the levels of regulatory activity in the intermodal segment could potentially affect us and our suppliers and customers. Our trucking operations and those of the trucking companies and independent contractors whom we engage are subject to regulation by the DOT and various state and local agencies, which govern such activities as authorization to engage in motor carrier operations, safety, and insurance requirements.
Future laws and regulations may be more stringent and require changes in our operating practices, influence the demand for our transportation services or require the outlay of significant additional costs.
28
Table of Contents
Additional expenditures incurred by us, or by our suppliers and passed on to us, could adversely affect our consolidated results of operations. For instance, as discussed above under the heading “Regulation of Our Trucking and Intermodal Operations,” our Stacktrain operation is subject to DOT issued final regulations, which became partially effective in December 2009, regulating intermodal equipment providers like our Stacktrain unit by requiring them to establish a systematic inspection, repair and maintenance program for chassis and to provide a means to effectively respond to driver and motor carrier reports about chassis defects and deficiencies. Our annual incremental additional cost of the chassis maintenance and repair program required under the new regulations will be between $0.5 million and $1.0 million. Under the new equipment agreement with Union Pacific, compliance with these federal regulations for our 53-foot equipment being operated in the Union Pacific network will be the responsibility of Union Pacific. Similarly, a January 2007 ruling by the Surface Transportation Board found that the railroad’s practice of assessing fuel surcharges based on a percentage calculation of the base rate charged to the shipper was unreasonable. Although the ruling expressly does not apply to intermodal shipments, if the railroads change their methodology for assessing fuel surcharges on intermodal traffic to a per mile or other calculation, our Pacer Stacktrain and rail brokerage units may also be required to change their fuel surcharge methodology. Such a change may adversely affect our revenues. Other potential effects are more difficult to quantify as we generally pass through fuel surcharges to our customers but we may experience timing issues where we are unable to adjust charges to our customers to match fuel adjustments from our suppliers.
Similar to the “clean truck” regulations adopted by CARB and the Ports of Los Angeles, Long Beach and Oakland affecting our California drayage operations that are described above, we may be subject to climate change regulation, including restrictions, caps, taxes, or other controls on emissions of greenhouse gases, including diesel exhaust. Such regulation could significantly increase our operating costs. Restrictions on emissions could also affect our customers that manufacture or produce goods that consume significant amounts of energy or burn fossil fuels, including automakers and other manufacturers, and thereby affect demand for our transportation services.
In addition, we have a substantial number of wholesale customers who provide ocean carriage of intermodal shipments. These wholesale customers and our own international freight forwarding operations are subject to regulation by the Federal Maritime Commission, U.S. Customs and other international, foreign, federal and state authorities. Regulatory changes in the ocean shipping or international freight forwarding industries could adversely affect our freight forwarding operations or have a material impact on the competitiveness or efficiency of operations of our various ocean carrier customers, which could adversely affect our business.
As a publicly-traded company, we are also affected by new and changing laws, regulations and standards relating to corporate governance and public disclosure, including the Sarbanes-Oxley Act of 2002, SEC rules and regulations and the NASDAQ Stock Market rules. Our efforts to comply with these continually evolving laws, regulations and standards have resulted in, and are likely to continue to result in, increased general and administrative expenses and a diversion of management time and attention from revenue-generating activities to compliance activities as well as the risks of noncompliance, including damage to our reputation with investors and our stock price.
We are not able to accurately predict how new governmental laws and regulations, or changes to existing laws and regulations, will affect the transportation industry generally, or us in particular. Although government regulation that affects us and our competitors may simply result in higher costs that can be passed to customers, there can be no assurance that this will be the case. Any additional measures that may be required by future laws and regulations or changes to existing laws and regulations may require us to make changes to our operating practices or services provided to our customers and may result in additional costs, all of which could have an adverse effect on us.
A determination by regulators that our independent contractors are employees could expose us to various liabilities and additional costs and adversely affect our operating results.
From time to time, tax and other regulatory authorities have sought to assert that independent contractors in the trucking industry are employees, rather than independent contractors. In the future these authorities could be successful in asserting this position, or the interpretations and tax laws that consider
29
Table of Contents
these persons independent contractors could change. If our independent contractors are determined to be our employees, that determination could materially increase our exposure under a variety of federal and state tax, worker’s compensation, unemployment benefits, labor, employment and tort laws, as well as our potential liability for employee benefits. Our business model assumes that our independent contractors are not deemed to be our employees, and exposure to any of the above increased costs would impair our competitiveness in the industry and materially adversely affect our operating results.
If we fail to comply with or lose any required licenses, governmental regulators could assess penalties against us or issue a cease and desist order against our operations which are not in compliance.
Our rail and highway brokerage and Stacktrain operations are licensed by the DOT as a broker in arranging for the transportation of general commodities by motor vehicle. The DOT has established requirements for acting in this capacity, including insurance and surety bond requirements. Our local cartage operations are regulated as motor carriers by the DOT and various state agencies, subjecting these operations to insurance, surety bond, safety and other regulatory requirements. Our international NVOCC and freight forwarding operation is licensed as an ocean transportation intermediary by the U.S. Federal Maritime Commission. The Federal Maritime Commission regulates ocean freight forwarders and non-vessel operating common carriers like us that contract for space with the actual vessel operator and sell that space to commercial shippers and other non-vessel operating common carriers for freight originating or terminating in the United States. Non-vessel operating common carriers must publish and maintain tariffs for the movement of specified commodities into and out of the United States. The Federal Maritime Commission may enforce these regulations by instituting proceedings seeking the assessment of penalties for violations of these regulations. For ocean shipments not originating or terminating in the United States, the applicable regulations and licensing requirements typically are less stringent than in the United States. Our international freight forwarding operation is also licensed, regulated and subject to periodic audit as a customs broker by the Customs Service of the Department of Treasury in each United States customs district in which we do business. In other jurisdictions where we perform customs brokerage services, we are licensed, where necessary, by the appropriate governmental authority. Our failure to comply with the laws and regulations of any of these governmental regulators, and any resultant suspension or loss of our licenses, could result in penalties or a cease and desist order against any operations that are not in compliance. Such an occurrence would have an adverse effect on our consolidated results of operations, financial condition and liquidity.
Access to the funds available under our amended and restated asset-based credit facility and to the public capital markets could be adversely affected by the turmoil and uncertainty impacting credit markets generally.
As a result of current economic conditions, including turmoil and uncertainty in the capital markets, credit markets have tightened significantly such that the ability to obtain new capital has become more challenging and more expensive. In addition, during 2008 and 2009 several large financial institutions have recently failed or became dependent on the assistance of the U.S. federal government to continue to operate. Although we believe that the banks under the A&R Credit Agreement have adequate capital and resources, we can provide no assurance that all of these banks will continue to operate as a going concern in the future. If any of the banks in our lending group were to fail or otherwise fail to provide us funds as required under the A&R Credit Agreement, it is possible that the borrowing capacity under our credit facility would be reduced. In the event that the availability under the A&R Credit Agreement was reduced significantly, we could be required to obtain capital from alternate sources in order to finance our operations or capital needs. Our options for addressing such capital constraints would include, but not be limited to (i) seeking to obtain commitments from the remaining banks in our lending group or from new banks to fund increased amounts under the terms of our credit facility, (ii) accessing the public capital markets, or (iii) delaying or reducing our capital expenditures or certain of our projects. If it became necessary to access additional capital, it is possible that any such alternatives in the current market would be on terms less favorable than under our amended and restated credit facility, which could have a material effect on our consolidated financial position, results of operations and cash flows.
The public capital markets are also currently experiencing a period of dislocation and instability as evidenced by a lack of liquidity in both the equity and debt capital markets, significant write-offs in the
30
Table of Contents
financial services sector, the re-pricing of credit risk in the broadly syndicated credit market and the failure of certain major financial institutions. These events have contributed to worsening general economic conditions that are materially and adversely impacting the broader financial and credit markets and reducing the availability of debt and equity capital for the market as a whole. Such conditions may exist for the foreseeable future. If we were required to access the public equity or debt capital markets to fund our operations and capital expenditures or any acquisitions that we may decide to make, given the current economic environment, no assurance can be given that we would be able to do so on favorable terms or at all. In addition, in view of the steep, sustained decline in the price of our common stock that began in 2008 and continued in 2009, our shareholders could suffer substantial dilution if we were required to access the equity capital markets given the current depressed price of our common stock.
Changes in shipping patterns that reduce container volumes into West Coast ports could adversely affect our revenues and operating results.
A significant portion of the intermodal shipments we handle are transcontinental moves originating from West Coast ports. For example, approximately 29% of our Stacktrain unit’s total volumes in 2009 (33% in 2008) were from the West Coast ports. Furthermore, our warehouse and distribution operation is concentrated in Southern California, and a significant portion of our local cartage revenues derive from our Southern California terminals. Reductions in West Coast shipping volume can therefore have a material adverse effect on our operations. The development of a Suez Canal route from China, the planned expansion of the Panama Canal that would allow an all-water route from China to East Coast ports, and/or onerous port and other West Coast regulations may result in the diversion of volumes from West Coast ports. Developments such as these and others that would reduce shipments into the West Coast ports could adversely affect our revenues and operating results.
If the markets in which we operate do not grow, our business could be adversely affected.
The failure of the transportation and logistics industries and their segments, including the third-party logistics market, to continue to grow may have a material adverse effect on our business and the market price of our common stock.
Our debt levels may limit our flexibility in obtaining additional financing and in pursuing other business opportunities.
As of December 31, 2009, our outstanding debt was $23.3 million. We have the ability to incur new debt, subject to borrowing base restrictions and other limitations in our credit agreement. Our level of indebtedness could have important consequences to us, including the following:
| · | Payments on our indebtedness will reduce the funds that would otherwise be available for our operations and future business opportunities; |
| · | A substantial decrease in our net operating cash flows could inhibit our ability to meet our debt service requirements and force us to modify our operations; |
| · | We may be more highly leveraged than our competitors, which may place us at a competitive disadvantage; |
| · | Our debt level may make us more vulnerable than our competitors to a downturn in our business or the economy generally; |
| · | Our debt level reduces our flexibility in responding to changing business and economic conditions; |
| · | Our ability to obtain additional financing, if necessary, for working capital, capital expenditures, acquisitions or other purposes may be impaired or such financing may not be available on favorable terms; and |
| · | All of our debt has a variable rate of interest, which increases our vulnerability to interest rate fluctuations. |
31
Table of Contents
If we lose key personnel and qualified technical staff, our ability to manage the day-to-day aspects of our business will be weakened which could adversely affect our operating results and ability to grow our business.
We believe that the attraction and retention of qualified personnel is critical to our success. If we lose key personnel or are unable to recruit qualified personnel, our ability to manage the day-to-day aspects of our business will be adversely affected. Our operations and prospects depend in large part on the performance of our senior management team. The loss of the services of one or more members of our senior management team could have a material adverse effect on our business, results of operation, financial condition or cash flows. We face significant competition in attracting and retaining personnel who possess the skill sets that we seek. Because our senior management team has unique experience with our company and within the transportation industry, it would be difficult to replace them without adversely affecting our business operations. In addition to their unique experience, our management team has fostered key relationships with our suppliers and customers. Such relationships are especially important for an asset-light company such as ours. Loss of these relationships could have a material adverse effect on our profitability.
We have an extensive relationship with APL Limited, and we depend on APL Limited for essential services. Our business and consolidated results of operations could be adversely affected if APL Limited failed or refused to provide such services or terminated the relationship.
Pursuant to long-term contracts that expire in May 2019, APL Limited, the former owner of our Stacktrain services business, supplies us with chassis from its equipment fleet for the transport of international freight on behalf of other international shippers. In addition, we transport APL Limited’s international cargo on our Stacktrain network to locations in the United States using chassis and equipment supplied by APL Limited. The additional volume attributable to the transport of APL Limited’s international cargo contributes to our ability to obtain favorable provisions in our rail contracts. APL Limited pays us a fee for repositioning its empty containers within North America so that the containers can be reused in trans-Pacific shipping operations. In addition, APL Limited is currently providing us with computers, software and other information technology services necessary for the operation of our Stacktrain business under a long-term contract that expires in May 2019. We have replaced the finance and accounting modules of the APL Limited information technology services with SAP software and we are in the process of developing internally new transportation operations modules that are expected to replace the transportation operations modules of the information technology services currently provided by APL Limited. We expect to complete the development and implementation efforts in 2010 and have notified APL that we intend to cease using its information technology services during the second quarter of 2010. If any of our contracts with APL Limited were terminated or if APL Limited were unwilling or unable to fulfill its obligations to us under the terms of these contracts, or if the replacement systems to be implemented do not operate as anticipated or contain unforeseen problems, our business, consolidated results of operations, financial condition and cash flows could be materially adversely affected.
Volatility in our revenue stream and resultant operational results may result in stock price declines.
As discussed in this report, we are subject to a variety of events, such as economic conditions, customers’ business cycles, rate changes, rail network changes, severe weather and other rail service disruptions, strikes, interest rate and fuel cost fluctuations, and claims, over which we have little or no control. These factors may unexpectedly affect one or more quarters’ results. Any unexpected reduction in revenues or operating income for a particular quarter could cause our quarterly operating results to be below the expectations of public market analysts or stockholders. In this event, the trading price of our common stock may fall significantly.
If we make future acquisitions, they may be financed in a way that reduces our reported earnings or imposes additional restrictions on our business.
If we make future acquisitions, we may issue shares of capital stock that dilute other stockholders, incur debt, assume significant liabilities or create additional expenses related to intangible assets, any of
32
Table of Contents
which might reduce our reported earnings or reduce earnings per share and cause our stock price to decline. In addition, any financing that we might need for future acquisitions may be available to us only on terms that restrict our business.
If we are unable to identify, make and successfully integrate acquisitions, our profitability could be adversely affected.
Identifying, acquiring and integrating businesses require substantial management, financial and other resources and may pose risks with respect to customer service and market share. Further, acquisitions involve a number of special risks, some or all of which could have a material adverse effect on our business, results of operation, financial condition and cash flows. These risks include:
| · | unforeseen operating difficulties and expenditures; |
| · | difficulties in assimilation of acquired personnel, operations and technologies; |
| · | the need to manage a significantly larger and more geographically dispersed business; |
| · | impairment of goodwill and other intangible assets; |
| · | the cost of integrating and documenting the internal controls of the acquired business and potential material weaknesses in internal control over financial reporting under Section 404 of the Sarbanes-Oxley Act of 2002; |
| · | diversion of management’s attention from ongoing development of our business or other business concerns; |
| · | potential loss of customers; |
| · | failure to retain key personnel of the acquired businesses; and |
| · | the use of substantial amounts of our available cash. |
We have acquired a number of businesses in the past and we may consider acquiring businesses in the future that provide complementary services to those we currently provide or that expand our geographic presence. We cannot predict whether we will be able to identify suitable acquisition candidates or to acquire them on reasonable terms or at all, and a failure to do so could limit our ability to expand our business. While we believe that we have sufficient financial and management resources and experience to successfully conduct our acquisition activities and integrate the acquired businesses into our operations, our acquisition activities involve more difficult integration issues than those of many other companies because the value of the companies we acquire comes mostly from their business relationships, rather than their tangible assets. The integration of business relationships poses more of a risk than the integration of tangible assets because relationships may suddenly weaken or terminate, or key personnel responsible for those relationships may depart. Further, logistics businesses that we have acquired and that we may acquire in the future compete with many customers of our Stacktrain operations, and these customers may shift their business elsewhere if they believe our logistics operations receive favorable treatment from our Stacktrain operations. If we are unable to successfully integrate any business that we may acquire in the future, we could experience difficulties with customers, personnel or others, and our acquisitions might not enhance our competitive position, business or financial prospects.
As we expand our services internationally, we may become subject to international economic and political risks.
A portion of our business is providing services internationally. International revenues account for approximately 10% to 15% of our revenues on an annual basis. Doing business outside the United States subjects us to various risks, including changing economic and political conditions, major work stoppages, exchange controls, currency fluctuations, armed conflicts and unexpected changes in United States and
33
Table of Contents
foreign laws relating to tariffs, trade restrictions, transportation regulations, foreign investments and taxation. Significant expansion of our services in foreign countries will expose us to the increased effect of foreign currency fluctuations and exchange controls as well as longer accounts receivable payment cycles. We have no control over most of these risks and may be unable to anticipate changes in international economic and political conditions and, therefore, unable to alter our business practices in time to avoid the adverse effect of any of these changes.
Risks Related to Our Common Stock
Because we have various mechanisms in place to discourage takeover attempts, a change in control of our company that a stockholder may consider favorable could be prevented.
Provisions of our charter and bylaws or Tennessee law may discourage, delay or prevent a change in control of our company that a stockholder may consider favorable. These provisions could also discourage proxy contests and make it more difficult for stockholders to elect directors and take other corporate actions. These provisions include:
| · | Authorizing the issuance of “blank check” preferred stock that could be issued by our Board of Directors to increase the number of outstanding shares in order to thwart a takeover attempt; |
| · | A classified Board of Directors with staggered, three-year terms, which may lengthen the time required to gain control of the Board of Directors; |
| · | Prohibiting cumulative voting in the election of directors, which would otherwise allow less than a majority of stockholders to elect director candidates; |
| · | Requiring super-majority voting to effect particular amendments to our restated charter and amended bylaws; |
| · | Limitations on who may call special meetings of stockholders; |
| · | Requiring all stockholder actions to be taken at a meeting of the stockholders unless the stockholders unanimously agree to take action by written consent in lieu of a meeting; |
| · | Establishing advance notice requirements for nominations of candidates for election to the Board of Directors or for proposing matters that can be acted upon by stockholders at stockholder meetings; and |
| · | Prohibiting business combinations with interested stockholders unless particular conditions are met. |
As a result, these provisions could limit the price that investors are willing to pay in the future for shares of our common stock. In addition, the Tennessee Greenmail Act and the Tennessee Control Share Acquisition Act may discourage, delay or prevent a change in control of our company.
We have suspended payment of the dividend on our common stock. Should we not declare and pay cash dividends in the future, our stock price could be negatively impacted.
We paid quarterly dividends of $0.15 per common share from October 2005 through January 2009. However, in view of the challenges we face in the current economic environment and in order to conserve cash, in February 2009 our Board of Directors decided to discontinue the payment of dividends. The declaration of future dividends by the company and the amount thereof is in the discretion of our Board of Directors and will depend on our consolidated results of operations, financial condition, compliance with financial ratios and other limitations in the A&R Credit Agreement, cash requirements, future prospects and other factors deemed relevant by the Board of Directors including prevailing and forecasted economic conditions. We cannot predict when we might resume paying dividends in the future, if ever, or whether any such dividends will be at the same level as in the past. The suspension of our
34
Table of Contents
dividend and the failure to pay dividends in the future may adversely affect the market price of our common stock. In addition, our A&R Credit Agreement prohibits our payment of dividends prior to August 28, 2010 and thereafter imposes significant conditions which we may not be able to satisfy on our ability to pay dividends. Accordingly, we may not be able to begin paying dividends again for the foreseeable future.
A determination that we have a material weakness in our internal controls over financial reporting or that our disclosure controls and procedures are not effective could adversely affect our ability to report our financial condition and results of operations accurately and in a timely manner which could negatively impact our stock price and damage our reputation with stakeholders.
As discussed in our 2008 Annual Report on Form 10-K and Quarterly Reports on Form 10-Q filed with the SEC in 2009, our management team under the supervision and direction of our CEO and CFO concluded that our disclosure controls and procedures and our internal control over financial reporting were not effective as a result of certain material weakness described in such reports in our internal controls over financial reporting. While in connection with the assessment of our internal controls over financial reporting and disclosure controls and procedures at December 31, 2009, we determined that such material weaknesses had been fully remediated and that our internal controls over financial reporting and disclosure controls and procedures at December 31, 2009 were effective, the failure to maintain the adequacy of our internal controls over financial reporting may cause our internal controls over financial reporting and disclosure controls and procedures to be ineffective and any determination that a material weakness in our internal controls over financial reporting exists would cause our internal controls over financial reporting and disclosure controls and procedures to be ineffective. Any such a conclusion that our internal controls over financial reporting or disclosure controls and procedures are not effective could adversely affect our ability to report our financial condition and results of operations accurately and in a timely manner and could negatively impact our stock price and our reputation with investors, customers and vendors.
ITEM 1B. UNRESOLVED STAFF COMMENTS
None.
We lease space in office buildings in Concord, California for our Stacktrain operation and corporate headquarters and an office building in Dublin, Ohio for our Pacer Transportation Solutions headquarters. We also lease space in office buildings in many other locations including Fort Worth, Texas, Oakbrook, Illinois, Commerce, California, Jacksonville, Florida, Lake Success, New York, and Memphis, Tennessee. We lease four facilities in Los Angeles, California for dock space, warehousing and parking for tractors and trailers. In addition, we lease terminal facilities for our cartage operations in approximately 21 cities across the U.S.
Our Stacktrain transportation network operates out of more than 80 railroad terminals across North America. Substantially all of the terminals we use are owned and managed by rail or highway carriers. However, we employ full-time personnel on-site at many major locations to ensure close coordination of the services provided at the facilities. In addition to these terminals, other locations throughout the eastern United States serve as stand-alone container depots, where empty containers can be picked up or dropped off, or supply points, where empty containers can be picked up only.
We are subject to routine litigation arising in the ordinary course of business, none of which is expected to have a material adverse effect on our business, consolidated results of operations, financial condition or cash flows, except as described below. Most of the lawsuits to which the company is a party are covered by insurance and are being defended in cooperation with insurance carriers.
Union Pacific has asserted a claim against us for retroactive and prospective rate adjustments which is in the pre-trial stage of arbitration before a neutral third party arbitrator and relates to domestic
35
Table of Contents
shipments in 20-, 40- and 45 ft. international containers. The information available to us at December 31, 2009 does not indicate that it is probable that a liability had been incurred as of the year ended as of December 31, 2009, and we could not make an estimate of the amount, or range of amounts, of any liability that would be incurred if this claim were resolved against us. Accordingly, we have not accrued any liability for this claim in our financial statements at and for the year ended December 31, 2009. We dispute this claim in its entirety and believe that we have meritorious defenses to it and that Union Pacific is not entitled to the claimed rate adjustments. We intend to vigorously defend against this claim by Union Pacific and to pursue our other related rights and remedies.
One of our other vendors has asserted a claim against us seeking to recover payment of alleged volume shortfalls under a contract for the provision of transportation services. This claim was submitted to arbitration on April 17, 2009. The vendor’s calculation of the dollar amount of shortfall payments that it claims from the Company as of December 31, 2009, is approximately $3.4 million. On January 28, 2010, we reached a settlement with the vendor in regards to the arbitration matter and several other claims between the parties for a net payment from us to the vendor of $1.2 million, which has been accrued at December 31, 2009. As part of the agreement, the parties also renegotiated certain ongoing contractual terms.
ITEM 4. SUBMISSION OF MATTERS TO A VOTE OF SECURITY HOLDERS
None.
EXECUTIVE OFFICERS OF THE REGISTRANT
The following table sets forth information regarding our executive officers.
| Name |
Age | Title | ||
| Daniel W. Avramovich |
58 | Chairman and Chief Executive Officer | ||
| Alan E. Baer |
54 | President, RF International, Ltd. and Ocean World Lines, Inc. | ||
| Adriene B. Bailey |
46 | Executive Vice President, Chief Commercial Officer | ||
| Peter K. Baumhefner |
61 | Executive Vice President, Operations—Intermodal (Pacer Stacktrain, Inc.) | ||
| Marc L. Jensen |
55 | Vice President, Corporate Controller | ||
| Brian C. Kane |
54 | Executive Vice President, Chief Financial Officer | ||
| Michael F. Killea |
47 | Executive Vice President, Chief Legal Officer and General Counsel | ||
| Peter A. Mettra |
60 | Executive Vice President, Transportation Purchasing (Pacer Stacktrain, Inc.) | ||
| F. Franklin Sutherland |
56 | Executive Vice President, Network Services (Pacer Transportation Solutions, Inc.) | ||
| James E. Ward |
58 | Executive Vice President, Chief Information Officer |
Daniel W. Avramovich joined our company effective in June 2008 as Retail Intermodal Services President. He was promoted to Chief Operating Officer in May 2009 and to Chairman and Chief Executive
Officer in December 2009. Prior to joining Pacer, Mr. Avramovich served as Executive Vice President, Sales & Marketing of Kansas City Southern, a rail carrier, from May 2006 to May 2008 and as President, Network Services Americas for Exel plc, a provider of contract logistics and supply chain management, from 2003 to 2006. From 2000 to 2003, he served as President, Exel Direct for Exel plc.
Alan E. Baer has served as President of RF International, Ltd. since April 2003 and as President of Ocean World Lines, Inc. since 1989. He served as Chief Operating Officer of RFI Group, Inc. from January 1998 until April 2003. Prior to joining Ocean World Lines, Mr. Baer served as Line Manager for United States Navigation since 1982. Mr. Baer earned his Masters in Business Administration from the Stern School of Business at New York University.
Adriene B. Bailey has served as Chief Commercial Officer since May 2009. Prior to that promotion, she served as Wholesale Intermodal Services President from June 2008 to May 2009 and as Executive Vice President, Strategy and Organizational Development from October 2007 until June 2008.
36
Table of Contents
From February 2007 until October 2007, she led our Development Team focused on cost efficiencies and organizational effectiveness across all of our company’s operations. Since joining our company in 2000 as Vice President of Planning, Ms. Bailey has held many executive management positions with our Stacktrain operation, including Executive Vice President, Wholesale Product Development from November 2005 to February 2007, Executive Vice President, Business Development and Transportation Purchasing from November 2002 to November 2005, and Executive Vice President, Equipment and Logistics from January 2001 to November 2002. Prior to joining our company, her positions included Assistant Vice President for Service Planning and Operations Research for CSX Transportation, Vice President of Service Planning and Design for Southern Pacific Railroad, and consultant for Mercer Management Consulting and its predecessor firm, Temple, Barker & Sloane.
Peter K. Baumhefner has served as Executive Vice President, Operations – Intermodal since May 2008 and has responsibility for integrating and synchronizing Pacer’s drayage and warehousing operations with Pacer’s intermodal rail and terminal network operations. From November 2002 to May 2008, Mr. Baumhefner was Executive Vice President, Operations for our wholesale rail intermodal operation, Pacer Stacktrain. He has over 40 years of experience in transportation, including various operating and marketing positions at the Southern Pacific Railroad and American President Lines. Mr. Baumhefner is a graduate of the University of California at Los Angeles.
Marc L. Jensen has served as Vice President, Corporate Controller since June 2007. From January 2006 until June 2007, he was Assistant Vice President, Internal Audit and Compliance. Before joining the company, Mr. Jensen was President of MLJ Consulting, Inc. from May 2000 to December 2005, providing business process and systems consulting services, primarily to the company. Previously, Mr. Jensen served as Director of Worldwide System Support of ACS Logistics, Inc., a subsidiary of American President Lines, LTD, from 1998 to 2000 and as Director of Customer Information Support of ACS Logistics, Inc. from 1997 to 1998. Effective March 31, 2010, Mr. Jensen will leave the company in connection with the relocation of his position to the company’s offices in Ohio.
Brian C. Kane has served as Executive Vice President and Chief Financial Officer since September 2008. From October 2006 until September 2008, he served as Executive Vice President and Chief Operating Officer of our Intermodal segment. Mr. Kane served as Vice President and Corporate Controller of our company from November 2003 until October 2006. Mr. Kane served as Vice President and Controller of Pacer Stacktrain from May 1999 until November 2003 and prior to that as Director of Financial Reporting from May 1998 until May 1999. Prior to joining our company, Mr. Kane was Vice President of Finance for the Shell Martinez Refining Company from November 1996 until May 1998 and Controller for Southern Pacific Transportation Company from April 1990 until November 1996.
Michael F. Killea has served as Executive Vice President, Chief Legal Officer and General Counsel of our company since August 2001. From October 1999 through July 2001, he was a partner at the law firm of Holland & Knight LLP in New York City and Jacksonville, Florida, and from September 1987 through September 1999, he was a partner and an associate at the law firm of O’Sullivan LLP (now O’Melveny & Myers LLP) in New York City.
Peter A. Mettra has served as Executive Vice President, Transportation Purchasing since November 2005. His background includes over 34 years in the rail transportation industry, including over 20 years with Pacer Stacktrain and its predecessor, American President Lines. From November 2002 to November 2005, he was Vice President of Domestic Sales for Pacer Stacktrain. In 1985, Mr. Mettra joined APL in its Transportation Purchasing group, and later held positions in regional operations, logistics, and sales. In 1972, Mr. Mettra started his career with the Santa Fe Railroad in pricing and sales. In 1979, he joined the Southern Pacific Railroad holding various marketing positions in intermodal, international, chemicals, food, and forest products. Mr. Mettra earned a Bachelors of Arts degree in Business Administration from the University of Iowa.
F. Franklin Sutherland served as Vice President, Service & Yield Management from August 2008 to May 2009 when he was promoted to Executive Vice President, Network Services. From January 2000 to August 2008, he served as an independent consultant providing financial performance and operating management expertise, primarily within the logistic and supply chain industry.
37
Table of Contents
James E. Ward has served as Executive Vice President, Chief Information Officer of the company since April 2007. As an independent contractor, Mr. Ward served as acting Chief Information Officer for the company from August 2006 until joining the company as an employee. From May 2003 to April 2007, Mr. Ward served as a consultant to Dynotech, LLC, a consulting firm focusing on global ERP implementations, IT evaluations, offshore development, interim CIO positions, and data center outsourcing. During his time as a consultant, he also held interim CIO positions with Clark Steel framing, a steel framing manufacturer (from April 2005 to April 2007) and with Norton Lilly International, a provider of shipping, logistics and marine services in the United States, Canada, Panama and Caribbean ports (from May 2004 to December 2006). From July 1996 to April 2003, Mr. Ward served as Senior Vice President and Chief Information Officer of Inchcape Shipping Services, a leading marine services provider.
Effective with Mr. Jensen’s leaving the company on March 31, 2010, Michael Gordon, age 43, will become our principal accounting officer. Mr. Gordon joined the company effective January 1, 2010 as Vice President, Corporate Controller. From June 2009 until joining the company, Mr. Gordon served as a financial consultant for the company. From November 2007 to December 2009, Mr. Gordon worked for Resources Global Professionals where he provided financial consulting services to a number of clients, including a Fortune 500 specialty chemical company and Pacer. Prior to that, Mr. Gordon spent eight years with DHL Exel Supply Chain serving as the Financial Controller for North and South America where he was responsible for developing Exel’s shared services accounting function. Mr. Gordon also spent eight years with Ernst & Young LLP where he served as a Senior Manager providing audit services to both public and private companies.
Messrs. Baer, Baumhefner, Mettra and Sutherland became executive officers of the company, effective February 9, 2010.
There is no family relationship between any of our executive officers or directors, and there are no arrangements or understandings between any of our executive officers or directors and any other person under which any of them was appointed or elected as an officer or director, other than arrangements or understandings with our directors or officers acting solely in their capacities as such.
38
Table of Contents
ITEM 5. MARKET FOR REGISTRANT’S COMMON EQUITY, RELATED STOCKHOLDER MATTERS AND ISSUER PURCHASES OF EQUITY SECURITIES
Market Information
Our common stock is listed and traded on The NASDAQ Stock Market’s Global Select Market (“NASDAQ”) under the symbol “PACR.”
The following table sets forth, for our two most recent fiscal years, the per share range of high and low sales prices of our common stock as reported on NASDAQ and dividends declared.
| High | Low | Cash Dividends Declared | |||||||
| 2009 |
|||||||||
| 1st quarter |
$ | 11.35 | $ | 1.57 | $ | - | |||
| 2nd quarter |
$ | 5.39 | $ | 1.66 | $ | - | |||
| 3rd quarter |
$ | 4.62 | $ | 1.70 | $ | - | |||
| 4th quarter |
$ | 4.29 | $ | 2.50 | $ | - | |||
| 2008 |
|||||||||
| 1st quarter |
$ | 18.25 | $ | 11.73 | $ | 0.15 | |||
| 2nd quarter |
$ | 22.85 | $ | 17.20 | $ | 0.15 | |||
| 3rd quarter |
$ | 25.21 | $ | 15.51 | $ | 0.15 | |||
| 4th quarter |
$ | 18.47 | $ | 7.19 | $ | 0.15 | |||
As of December 31, 2009 there were approximately 37 record holders of our common stock.
Dividends
We paid quarterly dividends of $0.15 per common share ($0.60 per common share per annum) from October 2005 through January 2009. However, in view of the challenges we face in the current economic environment and in order to conserve cash, in February 2009 our Board of Directors decided to discontinue the declaration and payment of dividends.
The declaration of future dividends and the amount thereof is in the discretion of our Board of Directors and will depend on our consolidated results of operations, financial condition, cash requirements, future prospects and other factors deemed relevant by the Board of Directors including prevailing and forecasted economic conditions. Our A&R Credit Agreement prohibits the payment of dividends prior to August 28, 2010. Thereafter, the A&R Credit Agreement imposes restrictions on our ability to pay cash dividends, including that (1) no event of default has occurred, or would result therefrom, (2) the aggregate amount of all cash dividends or other distributions paid in respect of our common stock, including payments in respect of the purchase, redemption or other acquisition of our common stock, does not exceed $10 million in any fiscal year, and (3) we provide to the Administrative Agent at least 30 business days prior to any such payment (A) projections which reflect that we will have availability under the A&R Credit Agreement for the one-year period following the date of such payment of at least $60 million, (B) pro forma financial statements reflecting availability under the A&R Credit Agreement for the thirty day period preceding the date of payment of more than $60 million on a pro forma basis, that no default or event of default shall have occurred or would result therefrom and that we would have been in compliance with the fixed charge coverage ratio contained in the A&R Credit Agreement on the last day of the month most recently ended prior to such payment, and (C) a solvency certificate executed by our chief financial officer. For a further description of our A&R Credit Agreement, including descriptions of the fixed charge coverage ratio and the borrowing base formula that determines the availability under the A&R Credit Agreement, see note 3 to the notes to our audited consolidated financial statements and “Item 7. Management’s Discussion and Analysis of Financial Condition and Results of Operations—Liquidity and Capital Resources” included elsewhere in this Annual Report on Form 10-K.
39
Table of Contents
Equity Compensation Plan Information
Information concerning our equity compensation plans is shown under “Item 12. Security Ownership of Certain Beneficial Owners and Management and Related Stockholder Matters” included elsewhere in this Annual Report on Form 10-K.
Recent Sales of Unregistered Securities
None.
Purchases of Equity Securities by the Issuer and Affiliated Purchasers
Pursuant to authorizations which expired on June 15, 2009, our Board of Directors had authorized the purchase of up to $160 million of our common stock. We repurchased a total of 2,938,635 shares at an average price of $24.64 per share through December 28, 2007, 19,039 shares at an average price of $21.54 per share during 2008, and 21,569 shares at an average price of $3.08 during 2009. Our A&R Credit Agreement restricts our ability to purchase, redeem or otherwise acquire our Common Stock as described under “Dividends” above.
Common Stock Repurchases
There were no common stock repurchases during the fourth quarter of 2009.
40
Table of Contents
Performance Graph*
The graph below shows, for the five years ended December 31, 2009, the cumulative total return on an investment of $100 assumed to have been made on December 31, 2004 in our common stock. The graph compares such return with that of comparable investments assumed to have been made on the same date in the NASDAQ Composite Index and the NASDAQ Transportation Index. Cumulative total stockholder returns for our common stock, the NASDAQ Composite Index and the NASDAQ Transportation Index are based on our fiscal year.
The total return for the assumed investment assumes the reinvestment of all dividends. We paid dividends from October 2005 through January 2009. In view of the challenges we face in the current economic environment and in order to conserve cash, in February 2009 our Board of Directors discontinued the declaration and payment of dividends.
Our common stock is listed and traded on The NASDAQ Stock Market’s Global Select Market (trading symbol: PACR).
The comparisons in the graph below are based upon historical data and are not indicative of, or intended to forecast, future performance of our common stock.
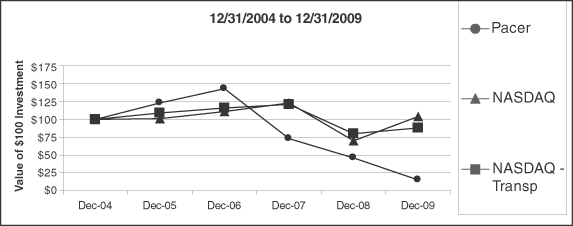
| Dec-04 | Dec-05 | Dec-06 | Dec-07 | Dec-08 | Dec-09 | |||||||||||||
| Pacer International |
$ | 100 | $ | 123 | $ | 143 | $ | 73 | $ | 46 | $ | 15 | ||||||
| NASDAQ Composite |
$ | 100 | $ | 101 | $ | 111 | $ | 123 | $ | 70 | $ | 104 | ||||||
| NASDAQ Transp. |
$ | 100 | $ | 109 | $ | 116 | $ | 121 | $ | 80 | $ | 88 | ||||||
*The performance graph is not “soliciting material,” is not deemed “filed” with the SEC, and is not to be incorporated by reference into any filing of our company under the Securities Act of 1933, as amended, or the Securities Exchange Act of 1934, as amended, whether made before or after the date hereof and irrespective of any general incorporation language contained in such filing.
41
Table of Contents
ITEM 6. SELECTED FINANCIAL DATA
The following table presents, as of the dates and for the periods indicated, selected historical financial information for our company. The selected historical information at December 31, 2009 and December 26, 2008 and for the fiscal years ended December 31, 2009, December 26, 2008 and December 28, 2007 have been derived from, and should be read in conjunction with, our audited consolidated financial statements and related notes appearing elsewhere in this Annual Report on Form 10-K. The selected historical information at December 28, 2007, December 29, 2006 and December, 30, 2005 and for the fiscal years ended December 29, 2006 and December 30, 2005 have been derived from our financial statements which are not included in this Annual Report on Form 10-K.
The following table should also be read in conjunction with “Item 7. Management’s Discussion and Analysis of Financial Condition and Results of Operations” included elsewhere in this Annual Report on Form 10-K.
| Fiscal Year Ended | ||||||||||||||||||||
| Dec. 31, 2009 |
Dec. 26, 2008 (as adjusted) 6/ |
Dec. 28, 2007 (as adjusted) 6/ |
Dec. 29, 2006 (as adjusted) 6/ |
Dec. 30, 2005 (as adjusted) 6/ |
||||||||||||||||
| (in millions, except share and per share amounts) | ||||||||||||||||||||
| Statements of Operations Data: |
||||||||||||||||||||
| Revenues |
$ | 1,574.2 | $ | 2,087.5 | $ | 1,969.8 | $ | 1,888.9 | $ | 1,861.3 | ||||||||||
| Cost of purchased transportation and services |
1,291.3 | 1,659.3 | 1,538.0 | 1,447.1 | 1,429.4 | |||||||||||||||
| Direct operating expenses (excluding depreciation) |
124.5 | 132.2 | 130.5 | 123.1 | 115.4 | |||||||||||||||
| Selling, general and administrative expenses 1/ |
186.0 | 199.9 | 200.5 | 193.0 | 204.8 | |||||||||||||||
| Goodwill impairment charge 2/ |
200.4 | 87.9 | - | - | - | |||||||||||||||
| Other income 3/ |
(18.9 | ) | - | - | - | - | ||||||||||||||
| Write-off of computer software 4/ |
- | - | - | - | 11.3 | |||||||||||||||
| Depreciation and amortization |
6.8 | 6.2 | 6.2 | 7.0 | 6.9 | |||||||||||||||
| Income (loss) from operations |
(215.9 | ) | 2.0 | 94.6 | 118.7 | 93.5 | ||||||||||||||
| Net income (loss) 2/ |
(174.1 | ) | (16.4 | ) | 54.4 | 68.5 | 51.2 | |||||||||||||
| Net income (loss) per share 2/: |
||||||||||||||||||||
| Basic |
$ | (5.01 | ) | $ | (0.47 | ) | $ | 1.52 | $ | 1.83 | $ | 1.37 | ||||||||
| Diluted |
$ | (5.01 | ) | $ | (0.47 | ) | $ | 1.51 | $ | 1.80 | $ | 1.35 | ||||||||
| Weighted average common shares outstanding: |
||||||||||||||||||||
| Basic |
34,767,275 | 34,616,598 | 35,587,755 | 37,354,785 | 37,381,647 | |||||||||||||||
| Diluted |
34,767,275 | 34,616,598 | 35,911,246 | 38,020,862 | 38,042,454 | |||||||||||||||
| Cash dividends declared per common share |
$ | - | $ | 0.60 | $ | 0.60 | $ | 0.60 | $ | 0.30 | ||||||||||
| Balance Sheet Data (at period end): |
||||||||||||||||||||
| Total assets |
$ | 275.9 | $ | 494.6 | $ | 574.1 | $ | 565.3 | $ | 590.2 | ||||||||||
| Total debt including capital leases (excluding book overdraft) |
23.3 | 44.6 | 64.0 | 59.0 | 90.0 | |||||||||||||||
| Total stockholders’ equity |
97.5 | 270.4 | 302.2 | 336.5 | 305.9 | |||||||||||||||
| Working capital |
10.8 | 46.1 | 34.0 | 63.7 | 54.2 | |||||||||||||||
| Cash Flow Data: |
||||||||||||||||||||
| Net cash provided by operating activities |
$ | 12.5 | $ | 59.6 | $ | 108.0 | $ | 66.7 | $ | 82.3 | ||||||||||
| Net cash provided by (used in) investing activities |
15.7 | (23.0 | ) | (13.1 | ) | (3.5 | ) | (5.0 | ) | |||||||||||
| Net cash used in financing activities |
(30.4 | ) | (38.1 | ) | (87.9 | ) | (72.1 | ) | (67.9 | ) | ||||||||||
| Other Financial Data: |
||||||||||||||||||||
| Capital expenditures 5/ |
$ | 9.2 | $ | 24.8 | $ | 14.0 | $ | 3.7 | $ | 5.3 | ||||||||||
1/ 2009 includes costs of $7.2 million associated with our organizational simplification and workforce reduction initiatives, and 2007 included $6.0 million for facility closings and other severance costs. See note 4 to the notes to our consolidated financial statements.
42
Table of Contents
2/ In 2009, in accordance with ASC 350, we recorded a $200.4 million pre-tax write-off of goodwill ($161.0 after-tax or $4.63 per share) related to our intermodal and logistics segments of $169.0 million and $31.4 million, respectively. In 2008, we recorded an $87.9 million pre-tax write-off of goodwill ($73.3 million after-tax or $2.11 per diluted share) related to the logistics segment.
3/ Other income includes the $17.5 million gain related to the $30 million payment we received in 2009 from Union Pacific in connection with the new arrangements with Union Pacific, net of $1.2 million of accelerated chassis delivery costs. The remaining $11.3 million will be amortized to income over the remaining term of our legacy agreement with Union Pacific. In addition, other income also includes a $1.4 million gain on the 2009 sale of certain assets of our truck services unit.
4/ Based upon the completed evaluation of software development work in our Stacktrain unit that had been performed by a developer, in 2005 we abandoned the software and wrote-off all $11.3 million of capitalized costs.
5/ 2009 included $4.6 million, 2008 included $16.6 million, and 2007 included $10.6 million for acquisition and implementation of a software licensed agreement from SAP America, Inc. See Note 11 to the notes to our consolidated financial statements.
6/ Prior period amounts have been adjusted due to a change in revenue and cost recognition policies and the adoption of FASB Accounting Standards Codification Topic 260-10-45 “Earnings Per Share.” See the notes to consolidated financial statements for further information.
43
Table of Contents
ITEM 7. MANAGEMENT’S DISCUSSION AND ANALYSIS OF FINANCIAL CONDITION AND RESULTS OF OPERATIONS
Overview
We are a leading asset-light North American third-party logistics provider offering a broad array of services to facilitate the movement of freight from origin to destination. We operate in two segments, the intermodal segment and the logistics segment. See Note 10 to the notes to our consolidated financial statements included in this report for segment information. Our intermodal segment provides intermodal rail transportation, local cartage and intermodal marketing services. Our logistics segment provides highway brokerage, warehousing and distribution, international freight forwarding, ocean shipping, and supply chain management services.
Executive Summary
General. Pacer has made significant progress in 2009 in laying the foundation for our future. As discussed below, we entered into new multi-year agreements with Union Pacific for servicing our domestic big box (48- and 53-ft. container) shipments, entered into an amended and restated credit facility, closed the sale of certain assets of our truck services unit, and accelerated our cost cutting efforts through organizational consolidation. The economic recession continues to negatively impact our financial results. While we have seen some improvement in traffic volumes during the last half of 2009 compared to the first half of 2009, volumes continue to be below those in 2008. During 2009, our wholesale and retail intermodal volumes were down 22.2% and 2.2%, respectively, compared to 2008, and our total revenues were 24.6% below 2008 with both segments reporting declines. The primary drivers of the overall reduced financial results are the depressed traffic volumes, aggressive price competition, continuing excess capacity and reduced fuel surcharges. These economic factors, combined with our financial results during the first quarter of 2009, and the sustained decline in our stock price and market capitalization during that quarter resulted in the write-off of all of the remaining $200.4 million of recorded goodwill in the first quarter of 2009.
New Arrangements with Union Pacific. On November 3, 2009, we entered into new multi-year agreements with Union Pacific covering domestic big box (48- and 53-ft. container) shipments tendered by Pacer for transportation by Union Pacific. The new arrangements, among other things:
| · | settled all outstanding claims and counterclaims between Union Pacific and the company relating to domestic big box shipments under our legacy agreement with Union Pacific; |
| · | provide for a gradual adjustment over a two-year period to “market” rates of rates payable by us for Union Pacific’s transportation of domestic big box shipments and for continuation of the rates on competitive terms after October 11, 2011, the termination date of our legacy contract with Union Pacific; and |
| · | establish a fleet sharing arrangement that (i) allows Union Pacific customer access to our equipment fleet and grants us expanded access to Union Pacific’s EMP equipment fleet, and (ii) contains a mechanism that allows us to adjust the size of our fleet up or down in the future to address estimated changes in our equipment needs. |
In connection with the new arrangements we received a $30 million payment from Union Pacific on November 3, 2009.
As we anticipated, under the new arrangements with Union Pacific, the wholesale east-west domestic big box business that we have historically handled on behalf of intermodal marketing company customers on the Union Pacific network have begun transitioning away from us. We believe that any such transition will be completed and reflected in our revenues by the end of the first quarter of 2010. For the year ended December 26, 2008 and December 31, 2009, we recognized revenues of approximately $391.3 million and $248.8 million, respectively, from IMC customers in the domestic east-west big box business that are transitioning away from us as a result of the new arrangements with Union Pacific. We
44
Table of Contents
will continue to offer to IMCs our domestic small box (20-, 40- and 45-ft. containers) transportation services, stand alone local drayage services through Pacer Cartage, Mexico big box transportation services and Eastern core transportation services (i.e., transportation within the Pacer’s eastern network only).
We will also continue to service our north/south Mexico automotive business and international ocean carrier business, including avoided repositioning cost (or “ARC”) services, under the terms of our legacy agreement with Union Pacific through its October 11, 2011 expiration date. The new arrangements with Union Pacific, however, also establish terms and conditions that apply after that date to provide us with a continued exclusive position on the Union Pacific network with regard to our offering of products and services to meet international steamship line customers’ needs in conjunction with and in addition to the Union Pacific rail transportation product; and we are continuing to work with Union Pacific on our north/south Mexico automotive arrangements beyond the term of the legacy agreement. See Note 5 of the consolidated financial statements for additional information with respect to these new arrangements with Union Pacific.
We used the $30 million payment we received from Union Pacific on November 3, 2009 to pay down outstanding borrowings under our credit facility. During the fourth quarter of 2009, $17.5 million was recognized as other income (net of $1.2 million of chassis delivery costs written-off) in our consolidated financial statements and $11.3 million will be amortized to other income over the remaining term of our legacy agreement.
Amended Credit Facility. On August 28, 2009, we entered into the A&R Credit Agreement which maintains the original maturity of April 5, 2012 and provides for a revolving credit facility of up to $125 million. For further information, see “Liquidity and Capital Resources” and Note 3 of the consolidated financial statements.
Sale of Certain Assets of Pacer Transport. On August 17, 2009, we sold certain assets of Pacer Transport, Inc., S&H Transport, Inc. and S&H Leasing, Inc. to subsidiaries of Universal Truckload Services, Inc. (“UTSI”) under the Limited Asset Purchase Agreement dated July 24, 2009. In connection with the sale, subsidiaries of UTSI assumed the real property leases and equipment leases for tractors and trailers used by the truck services unit, as well as certain customer, agent and other agreements, for a purchase price of approximately $2.0 million. We retained all receivables generated by the truck services unit through the closing date. A gain on the sale of $1.4 million is included in other income in the consolidated statements of operations for the year ended December 31, 2009.
Cost Reductions. In view of the significant effect that the current economic recession has had on the transportation needs of customers and on our industry in general, we continued to take further steps during 2009 to reduce costs and conserve cash while also seeking to simplify and streamline our organization without sacrificing the quality of service delivery. Since the end of 2008 and through 2009, we have reduced employment through attrition or severance, including through the sale of truck services assets, by 559 people and recorded $7.0 million in severance expense, and, effective in April 2009, reduced wage levels of all employees including executive officers by up to 10% and discontinued the 401(k) company matching contributions. We also vacated two office locations during 2009 related to our consolidation efforts and recorded $0.2 million in lease termination costs. In addition, we discontinued our $0.15 per share quarterly cash dividend in order to conserve cash. These measures will remain in effect until our financial performance improves. With the implementation of the SAP finance and accounting modules throughout our business units, we have completed the consolidation of our cartage accounting functions in Dublin, Ohio, and we are in the process of consolidating additional decentralized accounting functions. As described in Note 4 to our consolidated financial statements, we plan to further reduce our workforce, further consolidate operations and offices, and will record additional charges in 2010 for costs associated with these activities. These charges, which when combined with charges incurred in 2009, are expected to aggregate from $8.0 million to $9.5 million and consist of severance and lease termination costs.
SAP License Amendment. On June 25, 2009, we entered into an amendment to the software license agreement with SAP America, Inc. (“SAP”) dated September 30, 2007, under which the software licensed was reduced from the full enterprise suite of applications to the financial and accounting applications that
45
Table of Contents
have been successfully implemented. In connection with this amendment, we received a cash payment of $22.5 million and wrote-off $22.4 million of previously capitalized software and associated costs related to the development of the SAP transportation operations modules. The write-off, net of the cash received, is included in selling, general and administrative expenses.
New California Environmental Regulations Affecting Drayage Operations. The California Air Resources Board has issued regulations that impact drayage trucks that operate within 80 miles of California’s ports and rail yards. As of January 1, 2010, trucks with model year 1994-2003 engines must be equipped with certified devices (e.g. particulate filters) to meet California and Federal emission standards. Trucks with model year 1993 and older were banned from entering California ports and intermodal rail yards commencing January 1, 2010. On October 9, 2009, the Port of Oakland adopted a strict dirty truck ban also effective January 1, 2010. Drayage trucks with engine year models between 1994 and 2003 must be retrofitted with particulate filters to enter the port. This truck ban goes beyond the requirements of the CARB regulations by establishing a turn-away requirement for non-compliant trucks at the port, whereas the CARB intends to assess fines against the motor carrier and owner-operator for entering a port or ramp with a non-compliant truck. The Ports of Los Angeles and Long Beach also instituted a clean truck program which bans pre-1989 trucks from the ports, imposes fees on shipments handled with trucks that do not meet 2007 emission standards, and requires trucking companies to comply with a variety of requirements to remain eligible for port access. We have implemented programs so that all tractors operating in our fleet in California comply with CARB and Port of Los Angeles and Long Beach requirements. We anticipate continuing to incur increased operating costs in order to effect compliance with these new requirements.
Change in Accounting Policy and Fiscal Year-End. Beginning in the first quarter of 2009, the company’s Stacktrain business unit changed its revenue and cost recognition method to a completed service basis from the percent of completed service basis used in prior periods. All other business units already applied the completed service revenue and cost recognition method. All prior period amounts have been adjusted for this change in the Stacktrain revenue and cost recognition method. In addition, before 2009 the company’s fiscal year was the 52- or 53-week annual accounting period ending on the last Friday in December. Following the implementation of the SAP finance and accounting modules during the 2009 first quarter at our Stacktrain business unit, our fiscal year was changed to December 31 of each year. Operating results for the transition period between December 27, 2008 and December 31, 2008 are included in the 2009 first quarter. Accordingly, Stacktrain data included in the intermodal segment financial comparisons in this report reflect 370 days for the year ended December 31, 2009 compared to 363 days for the year ended December 26, 2008.
Critical Accounting Policies
The preparation of financial statements in conformity with United States generally accepted accounting principles (“GAAP”) requires management to make estimates and assumptions about future events that affect the amounts reported in the financial statements and accompanying notes. Future events and their effects cannot be predicted with absolute certainty. Therefore, the determination of estimates requires the exercise of judgment. Actual results inevitably will differ from those estimates, and such differences may be material to the financial statements. Management believes the following critical accounting policies affect its more significant judgments and estimates used in the preparation of its consolidated financial statements.
| · | Recognition of Revenue |
We recognize revenue when all of the following conditions are met: persuasive evidence of an arrangement exists, delivery has occurred or services have been rendered, the price is determinable and collectability is reasonably assured. We maintain signed contracts with many of our customers and have bills of lading specifying shipment details including the rates charged for our services.
46
Table of Contents
| · | Recognition of Cost of Purchased Transportation and Services |
Both our intermodal and logistics segments estimate the cost of purchased transportation and services and accrue an amount on a load by load basis in a manner that is consistent with revenue recognition.
| · | Allowance for Doubtful Accounts |
We maintain allowances for doubtful accounts for estimated losses resulting from the inability of our customers to make required payments. Estimates are used in determining this allowance based on our historical collection experience, current trends, credit policy and a percentage of our accounts receivable by aging category. If the financial condition of our customers were to deteriorate, resulting in an impairment of their ability to make payments, additional allowances could be required. The following table illustrates the allowance for doubtful accounts as a percentage of accounts receivable for 2009, 2008 and 2007 (in millions, except percentages):
| 2009 | 2008 | 2007 | ||||||||||
| Accounts receivable |
$ | 156.1 | $ | 188.5 | $ | 209.9 | ||||||
| Allowance for doubtful accounts |
3.8 | 4.9 | 4.6 | |||||||||
| Allowance for doubtful accounts as a |
2.43 | % | 2.60 | % | 2.21 | % | ||||||
Historically, our actual losses have been within the estimated allowances. However, unexpected or significant future events or changes in trends could result in a material impact to future consolidated results of operations. For example, in 2008 our allowance for doubtful accounts increased from 2007 to reflect an increase in reserves established because of the then current economic environment. In 2009, uncollectible receivables were written-off against the established reserves. Based on our results for the fiscal year ended December 31, 2009, a 25 percent deviation from our estimates would have resulted in an increase or decrease in expense of approximately $1.0 million. The following analysis demonstrates the potential effect that a 25 percent deviation from our estimates would have had on our consolidated results of operations and is not intended to provide an estimated range of exposure or expected deviation (in millions, except per share data):
| -25 Percent |
Management’s 2009 Estimate |
+25 Percent |
||||||||||
| Allowance for doubtful accounts |
$ | 2.8 | $ | 3.8 | $ | 4.8 | ||||||
| Income (loss) from operations |
(214.9 | ) | (215.9 | ) | (216.9 | ) | ||||||
| Net income (loss) |
(173.3 | ) | (174.1 | ) | (174.9 | ) | ||||||
| Diluted earnings (loss) per share |
$ | (4.98 | ) | $ | (5.01 | ) | $ | (5.03 | ) | |||
| · | Deferred Tax Assets |
At December 31, 2009, we have recorded net deferred tax assets of $36.1 million and have not recorded a valuation reserve as we believe that future earnings will more likely than not be sufficient to fully utilize the assets. The minimum amount of future taxable income required to realize this asset is $92.6 million. Should we not be able to generate this future income, we would be required to record valuation allowances against the deferred tax assets resulting in additional income tax expense in our consolidated statement of operations.
| · | Goodwill |
Goodwill represents the excess of cost over the estimated fair value of the net tangible and intangible assets acquired. As discussed below, we had no goodwill recorded in our financial statements at December 31, 2009. The Company historically evaluated the carrying value of goodwill and recoverability at least annually and otherwise should events occur or circumstances change that would more likely than not reduce the fair value of a reporting unit below its carrying amount. Determination of impairment requires comparison of the reporting unit’s fair value with the unit’s carrying amount, including goodwill. If this comparison indicates that the fair value is less than the carrying value, then the implied fair value of the reporting unit’s goodwill is
47
Table of Contents
compared with the carrying amount of the reporting unit’s goodwill to determine the impairment loss to be charged to operations. The fair value of each of our reporting units is determined based upon the average value using an income approach based on the present value of estimated future cash flows of the reporting unit, and a market approach based on market price data of stocks of corporations engaged in similar businesses.
The Company complies with FASB ASC Topic 350 “Intangibles – Goodwill and Other” and Topic 820 “Fair Value Measurements and Disclosures” to evaluate goodwill. As a result of our year-end 2008 goodwill impairment testing, in 2008 we recorded a non-cash goodwill impairment charge of $87.9 million in our logistics segment ($73.3 million net of tax, or $2.11 per share) and concluded that no impairment of the goodwill assigned to our intermodal reporting unit had occurred. The goodwill impairment charge in our logistics reporting unit reflected a combination of factors, including the economic downturn that the U.S. and global economy was then experiencing, the steep, sustained decline in our stock price and resulting market capitalization that began in the second half of 2008 and the operating results of our logistics reporting unit during 2008. The carrying amount of goodwill at December 26, 2008, after the impairment charge, assigned to our intermodal and logistics reporting units was $169.0 million and $31.4 million, respectively.
Based on a combination of factors, including the continued, sustained decline in our stock price and market capitalization during the first quarter of 2009, the operating results of our intermodal and logistics reporting units during the first quarter of 2009, and the effect that the economic recession has had on the operating results of both of our reporting units during 2009, management concluded that a goodwill impairment triggering event had occurred in the first quarter of 2009 for purposes of ASC Topic 350, and, accordingly, performed a testing of the carrying values of goodwill for both the intermodal and logistics reporting units as of March 31, 2009. After this testing, management concluded that the carrying value of each of the intermodal and logistics reporting units (including goodwill) exceeded the fair value of each respective reporting unit. Accordingly, we undertook the second step of the goodwill impairment analysis and determined that the implied fair value of each reporting unit’s goodwill was $0. As a result, management recorded a non-cash goodwill impairment charge of $200.4 million in the 2009 first quarter ($169.0 million of the pre-tax charge was recorded in the intermodal reporting unit and $31.4 million in the logistics reporting unit). The charge was finalized in the second quarter of 2009 with no change to the reported amounts.
For additional information regarding these goodwill impairment charges, see Note 1 of our consolidated financial statements. There were no additions or deletions to goodwill between March 31, 2009 and December 31, 2009.
Use of Non-GAAP Financial Measures
From time to time in press releases regarding quarterly earnings, presentations and other communications, we may provide financial information determined by methods other than in accordance with GAAP. Recent non-GAAP financial measures have presented financial information excluding our non-cash goodwill impairment write-offs in the fourth quarter of 2008 and the first quarter of 2009. Management uses this non-GAAP measure in its analysis of the company’s performance and regularly reports such information to our Board of Directors. Management believes that presentations of financial measures excluding the impact of these non-cash charges provides useful supplemental information that is essential to a proper understanding of the operating results of our core businesses and allows investors, management and our Board to more easily compare operating results from period to period. However, the use of any such non-GAAP financial information should not be considered in isolation or as a substitute for net income or loss, operating income or loss, cash flows from operations or other income or cash flow data prepared in accordance with GAAP or as a measure of our profitability or liquidity. These non-GAAP measures may not be comparable to those used by other companies.
48
Table of Contents
Background
Before 2009, our Stacktrain business unit fiscal year was the 52- or 53-week annual accounting period ending on the last Friday in December of each year, while our other business units’ fiscal year ended on December 31 of each year. Following completion of the implementation of the accounting modules of SAP software during the first quarter 2009, the Stacktrain business unit’s fiscal year was changed to a calendar year basis ending on December 31 of each year. Amounts for the transition period from December 27, 2008 to December 31, 2008 are included in the first quarter 2009 results. Accordingly, Stacktrain data included in the intermodal segment financial comparisons in this MD&A reflect 370 days for 2009 compared to 363 days for 2008.
The following section describes some of our revenue and expense categories and is provided to facilitate investors’ understanding of the discussion of our historical financial results, including these revenue and expense items, discussed under the caption “Results of Operations.”
Revenues
The intermodal segment’s revenues from Stacktrain operations are generated through rates, fuel surcharges and other fees charged to customers for the transportation of freight utilizing the rail transportation services that we purchase from rail carriers under our transportation agreements with North American railroads. The growth of these revenues is primarily driven by increases in volume of freight shipped and rate changes on a route-by-route basis. The average rate is impacted by product mix, rail routes utilized, fuel surcharge and market conditions. Also included in revenues are railcar rental income, container per diem charges and incentives paid by APL Limited and others for the repositioning of empty containers with domestic westbound (backhaul) loads. Revenues are reported net of volume discounts provided to customers. Our intermodal segment Stacktrain operation generates revenues from three lines of business: international (shipments tendered by ocean shipping companies), automotive (shipments tendered by intermediaries arranging transportation for automotive manufacturers and parts suppliers) and domestic (shipments tendered by intermodal marketing companies for shippers within North America). As we expected, revenues from intermodal marketing companies in the domestic east-west big box business are transitioning away from us as a result of the new arrangements with Union Pacific. Growth in the intermodal segment’s revenues from local cartage operations, which primarily support our Stacktrain operations and intermodal marketing companies (including our rail brokerage unit) through the use of independent owner-operators, is driven primarily by increased volume as well as length of haul and the rates charged to the customer. Our rail brokerage unit generates revenues through intermodal marketing operations which involves arranging the movement of freight in containers and trailers utilizing truck and rail transportation. Increases in revenues from intermodal marketing operations are generated from increased volumes, rate increases, product mix and route changes.
The logistics segment’s revenues are generated through rates and other fees charged for our portfolio of freight transportation services, including highway brokerage, warehousing and distribution, international NVOCC, freight forwarding and supply chain management services. Overall growth in revenues for the logistics segment is driven by expanding our service offerings and marketing our broad array of transportation services to our existing customer base and to new customers. Growth in revenues from highway brokerage is driven primarily through increased volume and outsourcing by companies of their transportation and logistics needs. Increases in revenues for warehousing and distribution, which includes the handling, consolidation/deconsolidation and storage of freight on behalf of the shipper, are driven by increased outsourcing and import volumes and by shipping lines’ increased use of third-party containers, rather than their own containers, on the West Coast to move freight inland. Through our supply chain management services, we manage all aspects of the supply chain from inbound sourcing and delivery logistics through outbound shipment, handling, consolidation, deconsolidation, distribution, and just-in-time delivery of end products to our customers’ customers. Revenues for supply chain management services are recognized on a net basis and increases are driven by increased outsourcing. We also provide international ocean shipping and freight forwarding services, which involves arranging transportation and other services necessary to move our customers’ freight to and from a foreign country. Increases in revenues for international ocean shipping and freight forwarding are driven by increases in international trade volumes, rate increases, product mix and route changes.
49
Table of Contents
Cost of Purchased Transportation and Services
The intermodal segment’s cost of purchased transportation and related services consists primarily of the amounts charged to us by railroads and local trucking companies under our agreements with these carriers. Third-party rail costs are charged through agreements with the railroads and are dependent upon the competitive environment, capacity constraints, fuel surcharges, product mix and traffic lanes. In addition, terminal and cargo handling services represent the variable expenses directly associated with handling freight at a terminal location. The cost of these services is variable in nature and is based on the volume of freight shipped and rates charged.
The logistics segment’s cost of purchased transportation and related services consists of amounts paid to third parties under our agreements with them to provide such services, such as independent contractor truck drivers, ocean carriers, and freight terminal operators and dock workers. Sub-contracted or independent operators are paid on a percentage of revenues, mileage or a fixed fee from point-to-point or between zones.
Direct Operating Expenses
Direct operating expenses are both fixed and variable expenses directly relating to our Stacktrain operations and consist of equipment lease expense, equipment maintenance and repair costs, fixed terminal and cargo handling expenses and other direct variable expenses. Our fleet of leased equipment is financed through a variety of short- and long-term leases. Increases to our equipment fleet will primarily be through additional leases as the growth of our business dictates. Equipment maintenance and repair costs consist of the costs related to the upkeep of the equipment fleet, which can be considered semi-variable in nature, as a certain amount relates to the annual preventative maintenance costs in addition to amounts driven by fleet usage. Fixed terminal and cargo handling costs primarily relate to the fixed rent and storage expense charged to us by terminal operators and is expected to remain relatively fixed. Under the November 3, 2009 equipment arrangement, Union Pacific has agreed to pay the costs and assume maintenance and repair responsibilities for the portion of our 53-foot leased containers and chassis estimated to be necessary to support the domestic east-west big-box traffic from third party intermodal marketing companies that are transitioning to Union Pacific. Union Pacific assumes these responsibilities for greater numbers of container and chassis in steps with full responsibility for its allocated portion of the fleet beginning on February 1, 2010. We remain responsible for the costs and management of the portion of our leased container and chassis fleet necessary to support our business. Accordingly, the equipment payments received from or assumed by Union Pacific under the November 3, 2009 equipment arrangement are expected to reduce our direct operating expenses.
Selling, General and Administrative Expenses
The intermodal segment’s selling, general and administrative expenses consist of costs relating to customer acquisition, billing, customer service, salaries and related expenses of the executive and administrative staff, office expenses and professional fees, and includes the $10.7 million annual fee currently paid to APL Limited for information technology services under a long-term agreement (of which $3.4 million has been subject to a 3% compounded annual increase since May 2003).
The logistics segment’s selling, general and administrative expenses relate to the costs of customer acquisition, billing, customer service and salaries and related expenses of marketing, as well as the executive and administrative staff’s compensation, office expenses and professional fees.
Corporate selling, general and administrative expenses relate to the costs of executive and administrative compensation, and internal audit, marketing, finance, legal, and human resources functions.
50
Table of Contents
Results of Operations
Fiscal Year Ended December 31, 2009 Compared to Fiscal Year Ended December26, 2008
The following table sets forth our historical financial data for the fiscal years ended December 31, 2009 and December 26, 2008.
Financial Data Comparison by Reportable Segment
Fiscal Years Ended December 31, 2009 and December 26, 2008
(in millions)
| 2009 | 2008 | Change | % Change | ||||||||||||
| (as adjusted) 1/ | |||||||||||||||
| Revenues |
|||||||||||||||
| Intermodal |
$ | 1,190.7 | $ | 1,633.2 | $ | (442.5 | ) | (27.1 | )% | ||||||
| Logistics |
385.6 | 455.9 | (70.3 | ) | (15.4 | ) | |||||||||
| Inter-segment elimination |
(2.1 | ) | (1.6 | ) | (0.5 | ) | 31.3 | ||||||||
| Total |
1,574.2 | 2,087.5 | (513.3 | ) | (24.6 | ) | |||||||||
| Cost of purchased transportation and services |
|||||||||||||||
| Intermodal |
964.9 | 1,271.7 | (306.8 | ) | (24.1 | ) | |||||||||
| Logistics |
328.5 | 389.2 | (60.7 | ) | (15.6 | ) | |||||||||
| Inter-segment elimination |
(2.1 | ) | (1.6 | ) | (0.5 | ) | 31.3 | ||||||||
| Total |
1,291.3 | 1,659.3 | (368.0 | ) | (22.2 | ) | |||||||||
| Direct operating expenses |
|||||||||||||||
| Intermodal |
124.5 | 132.2 | (7.7 | ) | (5.8 | ) | |||||||||
| Logistics |
- | - | - | - | |||||||||||
| Total |
124.5 | 132.2 | (7.7 | ) | (5.8 | ) | |||||||||
| Selling, general & administrative expenses |
|||||||||||||||
| Intermodal |
105.5 | 111.3 | (5.8 | ) | (5.2 | ) | |||||||||
| Logistics |
62.2 | 65.4 | (3.2 | ) | (4.9 | ) | |||||||||
| Corporate |
18.3 | 23.2 | (4.9 | ) | (21.1 | ) | |||||||||
| Total |
186.0 | 199.9 | (13.9 | ) | (7.0 | ) | |||||||||
| Goodwill Impairment Write-Off |
|||||||||||||||
| Intermodal |
169.0 | - | 169.0 | n.m. | |||||||||||
| Logistics |
31.4 | 87.9 | (56.5 | ) | (64.3 | ) | |||||||||
| Total |
200.4 | 87.9 | 112.5 | 128.0 | |||||||||||
| Other income |
|||||||||||||||
| Intermodal |
(17.5 | ) | - | (17.5 | ) | n.m. | |||||||||
| Logistics |
(1.4 | ) | - | (1.4 | ) | n.m. | |||||||||
| Corporate |
- | - | - | - | |||||||||||
| Total |
(18.9 | ) | - | (18.9 | ) | n.m. | |||||||||
| Depreciation and amortization |
|||||||||||||||
| Intermodal |
5.3 | 4.5 | 0.8 | 17.8 | |||||||||||
| Logistics |
1.3 | 1.5 | (0.2 | ) | (13.3 | ) | |||||||||
| Corporate |
0.2 | 0.2 | - | - | |||||||||||
| Total |
6.8 | 6.2 | 0.6 | 9.7 | |||||||||||
| Income (loss) from operations |
|||||||||||||||
| Intermodal |
(161.0 | ) | 113.5 | (274.5 | ) | (241.9 | ) | ||||||||
| Logistics |
(36.4 | ) | (88.1 | ) | 51.7 | (58.7 | ) | ||||||||
| Corporate |
(18.5 | ) | (23.4 | ) | 4.9 | 20.9 | |||||||||
| Total |
(215.9 | ) | 2.0 | (217.9 | ) | (10,895.0 | ) | ||||||||
| Interest expense (income) |
4.5 | 2.4 | 2.1 | 87.5 | |||||||||||
| Income tax (benefit) |
(46.3 | ) | 16.0 | (62.3 | ) | (389.4 | ) | ||||||||
| Net income (loss) |
$ | (174.1 | ) | $ | (16.4 | ) | $ | (157.7 | ) | 961.6 | % | ||||
51
Table of Contents
1/ Prior period amounts have been adjusted due to a change in revenue recognition policies. See the notes to consolidated financial statements for further information.
Revenues. Revenues decreased $513.3 million, or 24.6%, for the fiscal year ended December 31, 2009 compared to the fiscal year ended December 26, 2008. Intermodal segment revenues decreased $442.5 million, reflecting decreases in both intermodal segment wholesale and retail products.
Revenues for our wholesale intermodal product of $835.8 million during 2009 declined 29.8% compared to 2008, on overall volume declines of 22.2%. Domestic volume declined 21.2%, auto volumes declined 16.6% and international volumes declined 30.8%. The average freight revenue per container declined 9.8% in 2009 compared to 2008. The revenue decline was due primarily to the lower fuel surcharge, reduced volumes as noted above, and aggressive price competition. The average fuel surcharge in effect during 2009 was 15.9% compared to 34.3% during 2008. Included in the wholesale intermodal product revenues for 2009 and 2008 were approximately $248.8 million and $391.3 million, respectively, of revenues from intermodal marketing company customers in the domestic east-west big box business that are transitioning away from us as expected under the new arrangements with Union Pacific.
Revenues for our retail intermodal product of $354.9 million during 2009 declined 19.8% compared to 2008, on an overall volume decrease of 2.2%. The average freight revenue per container declined 18.0% during 2009 due to the lower fuel surcharge, softness in the market and aggressive price competition.
Revenues in our logistics segment decreased $70.3 million, or 15.4%, in 2009 compared to 2008 reflecting decreased revenues in our truck services, supply chain services and highway brokerage business units, offset in part by increased revenues in our warehousing and distribution and international units. Our truck services unit revenues decreased 58.4% due primarily to the economic downturn and the August 17, 2009 sale of certain of this unit’s assets, see Note 1 to the consolidated financial statements. Our highway brokerage unit recorded a revenue decrease of 2.0% due primarily to rate erosion as volumes increased 11.8% during 2009 compared to 2008. Our supply chain services unit recorded a revenue decrease of 20.7% due primarily to the loss of a customer in June 2009 combined with downward price pressures and lower fuel surcharges. The 6.0% revenue increase in our international unit was due primarily to increased military shipments. Our warehousing and distribution unit’s revenues increased 6.4% due primarily to more year-round warehousing business and the addition of a new customer compared to the 2008 period.
Cost of Purchased Transportation and Services. Cost of purchased transportation and services decreased $368.0 million, or 22.2%, in 2009 compared to 2008. The intermodal segment’s cost of purchased transportation and services decreased $306.8 million, or 24.1%, in 2009 compared to 2008 reflecting decreases in both the wholesale and retail intermodal product, due primarily to the volume declines in 2009 compared to 2008. The linehaul cost per container decreased approximately 17% for both intermodal segment products due primarily to decreased fuel costs. The intermodal segment cost of purchased transportation and services associated with revenues recognized during the period from IMC customers in the domestic east-west big box business that are transitioning away from us as a result of the new arrangements with Union Pacific were approximately $219.9 million and $307.8 million in 2009 and 2008, respectively. Our costs of purchased transportation and services in the intermodal segment in future periods will be negatively affected as the rail rates we pay Union Pacific for big box domestic shipments gradually increase to “market” rates over the next two years.
The overall transportation margin percentage, revenues less the cost of purchased transportation divided by revenues, for the intermodal segment declined from 22.1% in 2008 (($1,633.2 million less $1,271.7 million) divided by $1,633.2 million) to 19.0% in 2009 (($1,190.7 million less $964.9 million) divided by $1,190.7 million). The decrease was due to lower pricing to compete with aggressive rates in the marketplace, maintain equipment flow and minimize repositioning.
Cost of purchased transportation and services in our logistics segment decreased $60.7 million, or 15.6%, in 2009 compared to 2008 due to the economic downturn, the August 17, 2009 sale of certain of our truck services unit’s assets, the loss of a customer in June 2009 in our supply chain services unit, and a small decrease in our highway brokerage unit. These decreases were partially offset by increased costs in
52
Table of Contents
our warehousing and distribution and international units reflecting increased business in 2009 compared to 2008, and the higher cost military shipments in our international unit. The overall transportation margin percentage for our logistics businesses increased slightly from 14.6% in 2008 (($455.9 million less $389.2 million) divided by $455.9 million) to 14.8% in 2009 (($385.6 million less $328.5 million) divided by $385.6 million).
Direct Operating Expenses. Direct operating expenses, which are only incurred by our Stacktrain operations, decreased $7.7 million, or 5.8%, in 2009 compared to 2008 due primarily to lower equipment maintenance and repair and lease costs related to a smaller fleet. At December 31, 2009, we had 2,840, or 9.9%, fewer containers and 2,287, or 7.6%, fewer chassis than at December 26, 2008.
Direct operating expenses associated with the revenues recognized during the period from IMC customers in the domestic east-west big box business that are transitioning away from us as a result of the new arrangements with Union Pacific were approximately $32.0 million and $39.6 million in 2009 and 2008, respectively.
Selling, General and Administrative Expenses. Selling, general and administrative expenses decreased $13.9 million, or 7.0%, in 2009 compared to 2008. The decrease was due primarily to the impact of cost reduction efforts during 2009. From the end of 2008 through the December 31, 2009, our employment level has declined by 559 people through attrition, severance and the sale of certain assets of our truck services unit. This employment reduction combined with across the board temporary salary reductions and discontinuation of 401(k) plan matching expenses, contributed to the expense decrease. In addition, the decrease in 2009 reflected reduced performance incentives in 2009 compared to 2008. These decreases were partially offset by higher stock compensation expenses and $7.2 million in severance and lease termination costs in 2009 ($4.6 million in the intermodal segment and $1.3 million in the logistics segment, and $1.3 million in corporate).
Goodwill Impairment Write-Off. Due to the continuing sustained decline in our stock price and market capitalization during the first quarter of 2009, the operating results of our intermodal and logistics reporting units during the first quarter of 2009, and the effect that the economic recession was having on the operating results of both business segments, we concluded that a goodwill impairment triggering event had occurred for purposes of ASC Topic 350 “Intangibles – Goodwill and Other,” in the first quarter of 2009 and, accordingly, performed a testing of the carrying values of goodwill for both the intermodal and logistics reporting units as of March 31, 2009. After this testing, we concluded that the carrying value of our intermodal and logistics reporting units (including goodwill) exceeded the fair value of each respective reporting unit. As a result, we recorded a non-cash impairment charge of $200.4 million during the first quarter of 2009. We recorded $169.0 million of the pre-tax charge in the intermodal reporting unit and $31.4 million in the logistics reporting unit.
In accordance with ASC Topic 350, we conducted our annual goodwill impairment test at the end of 2008. Based on a combination of factors including the deterioration of the economy and the steep, sustained decline in our stock price and resulting market capitalization in the second half of 2008, and the operating results of our logistics reporting unit, we concluded that the carrying value of our logistics reporting unit (including goodwill) exceeded the fair value of our logistics reporting unit. As a result, we recorded a non-cash goodwill impairment charge of $87.9 million in 2008.
Other Income. On November 3, 2009, we entered into new multi-year agreements with Union Pacific covering domestic big box (48- and 53-ft. container) shipments tendered by Pacer for transportation by Union Pacific and received a cash payment of $30 million from Union Pacific. $17.5 million of this amount, net of $1.2 million of accelerated chassis delivery costs for equipment under the control of Union Pacific, was recorded as a gain on the transaction, with $11.3 million to be amortized to income through October 11, 2011, the termination date of our legacy contract with Union Pacific. Chassis delivery costs, for chassis under our control, are deferred and amortized over the life of the lease.
On August 17, 2009, we closed the sale of certain assets of our truck services unit and recorded a gain on the transaction of $1.4 million.
53
Table of Contents
Depreciation and Amortization. Depreciation and amortization expenses increased $0.6 million, or 9.7%, in 2009 compared to 2008 due primarily to depreciation of our investment in the SAP software accounting modules, which began with the implementation in late 2008.
Income (Loss) From Operations. Income (loss) from operations decreased $217.9 million from operating income of $2.0 million, including $87.9 million in goodwill impairment charges in 2008, to an operating loss of $215.9 million, including goodwill impairment charges of $200.4 million in 2009. Income (loss) from operations excluding the goodwill impairment charges in both periods decreased $105.4 million from income of $89.9 million in 2008 to a loss of $15.5 million in 2009. Included in income (loss) from operations in 2009 is the $17.5 million gain related to the new Union Pacific arrangements, a $1.4 million gain related to the sale of certain truck services assets and $7.2 million for severance and lease termination expense. See the table below reconciling the GAAP financial results to adjusted financial results excluding the goodwill impairment charges.
Intermodal segment income from operations decreased $274.5 million in 2009 compared to 2008, including the $169.0 million goodwill impairment charge in 2009. Excluding the goodwill impairment charge, intermodal segment income from operations decreased $105.5 million to an income of $8.0 million in 2009 compared to an income of $113.5 million in 2008, reflecting decreases in both intermodal products due primarily to the volume declines, excess capacity and competitive pricing pressures associated with the continuing economic recession. The 2009 amount includes the $17.5 million gain on the new Union Pacific arrangements and $4.6 million of severance and lease termination expense.
Logistics segment loss from operations decreased $51.7 million in 2009 compared to 2008, including goodwill impairment charges of $31.4 million and $87.9 million in 2009 and 2008, respectively. Excluding the goodwill impairment charges in both periods, logistics segment loss from operations increased $4.8 million to a loss of $5.0 million in 2009 compared to a loss of $0.2 million in 2008. The primary drivers of this increased loss were declining prices and lower volumes during 2009.
Corporate expenses in 2009 were $4.9 million below 2008 due primarily to the salary and 401k matching reductions during 2009, as well as reduced performance incentive expenses in 2009 compared to 2008, partially offset by increased severance and lease termination expenses, stock compensation costs, and professional fees.
Interest (Expense)Income. Interest (expense) income increased by $2.1 million during 2009 compared to 2008. This increase reflects the higher interest rates in the second half of 2009 resulting from the amendment of our credit facility, and higher average borrowings during 2009 compared to 2008. The average interest rate during 2009 was approximately 3.6% compared to 2.9% during 2008. The interest rate under our credit facility increased to 5.1% on June 29, 2009 as a result of the initial amendment of that facility and was 5.5% at December 31, 2009. In addition, $0.3 million of deferred loan fees were written-off due to the reduction in the size of our credit facility in the 2009 period. During 2009, we capitalized $3.8 million of costs in connection with amending our credit facility which will be amortized over the remaining term of that facility.
Income Tax (Benefit). We recorded an income tax benefit of $46.3 million in 2009 compared to an income tax expense of $16.0 million in 2008. The decrease was due to the decrease in our operating results in 2009, including the goodwill impairment charge.
Net Income (Loss). Net loss increased by $157.7 million from $16.4 million in 2008 to $174.1 million in 2009. Excluding the goodwill impairment charges of $161.0 million, net of tax in 2009 and $73.3 million, net of tax in 2008, net income decreased by $70.0 million, from $56.9 million in 2008 to a net loss of $13.1 million in 2009 reflecting the lower income from operations (down $105.4 million excluding the goodwill impairment charges) as discussed above, coupled with increased interest expense (up $2.1 million) and lower income tax expense (down $37.5 million excluding the impact of the goodwill impairment charges).
54
Table of Contents
Reconciliation of GAAP Financial Results to Adjusted Financial Results Excluding the
Goodwill Impairment Charge
For the Fiscal Years Ended December 31, 2009 and December 26, 2008
(in millions, except share and per share amounts)
| 2009 | 2008 | 2009 vs 2008 As Adjusted Variance |
||||||||||||||||||||||||||
| GAAP Results |
Adjustments | Adjusted Results |
GAAP Results (as adjusted) 4/ |
Adjustments | Adjusted Results |
|||||||||||||||||||||||
| Income (loss) from operations-Intmdl |
$ | (161.0 | ) | $ | 169.0 | 1/ | $ | 8.0 | $ | 113.5 | $ | - | $ | 113.5 | $ | (105.5 | ) | |||||||||||
| Loss from operations - Logistics |
(36.4 | ) | 31.4 | 2/ | (5.0 | ) | (88.1 | ) | 87.9 | 5/ | (0.2 | ) | (4.8 | ) | ||||||||||||||
| Loss from operations - Corporate |
(18.5 | ) | - | (18.5 | ) | (23.4 | ) | - | (23.4 | ) | 4.9 | |||||||||||||||||
| Income (loss) from operations -Total |
(215.9 | ) | 200.4 | (15.5 | ) | 2.0 | 87.9 | 89.9 | (105.4 | ) | ||||||||||||||||||
| Interest expense, net |
4.5 | - | 4.5 | 2.4 | - | 2.4 | 2.1 | |||||||||||||||||||||
| Income (loss) before income taxes |
(220.4 | ) | 200.4 | (20.0 | ) | (0.4 | ) | 87.9 | 87.5 | (107.5 | ) | |||||||||||||||||
| Income tax (benefit) |
(46.3 | ) | 39.4 | 3/ | (6.9 | ) | 16.0 | 14.6 | 6/ | 30.6 | (37.5 | ) | ||||||||||||||||
| Net income (loss) |
$ | (174.1 | ) | $ | 161.0 | $ | (13.1 | ) | $ | (16.4 | ) | $ | 73.3 | $ | 56.9 | $ | (70.0 | ) | ||||||||||
| Diluted earnings (loss) per share |
$ | (5.01 | ) | $ | 4.63 | $ | (0.38 | ) | $ | (0.47 | ) | $ | 2.11 | $ | 1.64 | $ | (2.02 | ) | ||||||||||
| Weighted average shares outstanding |
34,767,275 | 34,767,275 | 34,767,275 | 34,616,598 | 34,739,597 | 34,739,597 | (27,678 | ) | ||||||||||||||||||||
1/ Intermodal segment goodwill impairment charge.
2/ Logistics segment goodwill impairment charge.
3/ Actual tax impact of the goodwill impairment charge.
4/ Amounts have been adjusted to conform to the current completed service method of revenue and cost recognition for our Stacktrain business unit and the application of ASC Topic 260-10-45, “Earnings Per Share” (see Notes 1 and 2 of the notes to consolidated financial statements).
5/ Logistics segment goodwill impairment charge.
6/ Actual tax impact of the goodwill impairment charge.
55
Table of Contents
Fiscal Year Ended December 26, 2008 Compared to Fiscal Year Ended December28, 2007
The following table sets forth our historical financial data for the fiscal years ended December 26, 2008 and December 28, 2007.
Financial Data Comparison by Reportable Segment
Fiscal Years Ended December 26, 2008 and December 28, 2007
(in millions)
| 2008 | 2007 | Change | % Change | ||||||||||||
| Revenues |
(as adjusted | ) 1/ | (as adjusted | ) 1/ | |||||||||||
| Intermodal |
$ | 1,633.2 | $ | 1,568.3 | $ | 64.9 | 4.1 | % | |||||||
| Logistics |
455.9 | 402.1 | 53.8 | 13.4 | |||||||||||
| Inter-segment elimination |
(1.6 | ) | (0.6 | ) | (1.0 | ) | 166.7 | ||||||||
| Total |
2,087.5 | 1,969.8 | 117.7 | 6.0 | |||||||||||
| Cost of purchased transportation and services |
|||||||||||||||
| Intermodal |
1,271.7 | 1,208.2 | 63.5 | 5.3 | |||||||||||
| Logistics |
389.2 | 330.4 | 58.8 | 17.8 | |||||||||||
| Inter-segment elimination |
(1.6 | ) | (0.6 | ) | (1.0 | ) | 166.7 | ||||||||
| Total |
1,659.3 | 1,538.0 | 121.3 | 7.9 | |||||||||||
| Direct operating expenses |
|||||||||||||||
| Intermodal |
132.2 | 130.5 | 1.7 | 1.3 | |||||||||||
| Logistics |
- | - | - | - | |||||||||||
| Total |
132.2 | 130.5 | 1.7 | 1.3 | |||||||||||
| Selling, general & administrative expenses |
|||||||||||||||
| Intermodal |
111.3 | 112.2 | (0.9 | ) | (0.8 | ) | |||||||||
| Logistics |
65.4 | 66.8 | (1.4 | ) | (2.1 | ) | |||||||||
| Corporate |
23.2 | 21.5 | 1.7 | 7.9 | |||||||||||
| Total |
199.9 | 200.5 | (0.6 | ) | (0.3 | ) | |||||||||
| Goodwill Impairment Write-Off |
|||||||||||||||
| Intermodal |
- | - | - | - | |||||||||||
| Logistics |
87.9 | - | 87.9 | n.m. | |||||||||||
| Total |
87.9 | - | 87.9 | n.m. | |||||||||||
| Depreciation and amortization |
|||||||||||||||
| Intermodal |
4.5 | 5.3 | (0.8 | ) | (15.1 | ) | |||||||||
| Logistics |
1.5 | 0.8 | 0.7 | 87.5 | |||||||||||
| Corporate |
0.2 | 0.1 | 0.1 | 100.0 | |||||||||||
| Total |
6.2 | 6.2 | - | - | |||||||||||
| Income (loss) from operations |
|||||||||||||||
| Intermodal |
113.5 | 112.1 | 1.4 | 1.2 | |||||||||||
| Logistics |
(88.1 | ) | 4.1 | (92.2 | ) | (2,248.8 | ) | ||||||||
| Corporate |
(23.4 | ) | (21.6 | ) | (1.8 | ) | 8.3 | ||||||||
| Total |
2.0 | 94.6 | (92.6 | ) | (97.9 | ) | |||||||||
| Interest expense (income) |
2.4 | 3.7 | (1.3 | ) | (35.1 | ) | |||||||||
| Loss on extinguishment of debt |
- | 1.8 | (1.8 | ) | (100.0 | ) | |||||||||
| Income tax expense |
16.0 | 34.7 | (18.7 | ) | (53.9 | ) | |||||||||
| Net income (loss) |
$ | (16.4 | ) | $ | 54.4 | $ | (70.8 | ) | (130.1 | )% | |||||
1/ Prior period amounts have been adjusted due to a change in revenue recognition policies. See the notes to consolidated financial statements for further information.
56
Table of Contents
Revenues. Revenues increased $117.7 million, or 6.0%, for the fiscal year ended December 26, 2008 compared to the fiscal year ended December 28, 2007. Intermodal segment revenues increased $64.9 million, reflecting an increase in our wholesale intermodal product partially offset by a decrease in our retail intermodal product.
Revenues of our wholesale intermodal product of $1.2 billion during 2008 increased 6.3% compared to 2007 despite overall volume decreases of 7.0%. Domestic volume decreased 6.4%, auto volumes declined 11.2% and international volumes declined 2.6%. The average freight revenue per container increased 14.2% in 2008 compared to 2007. The revenue increase was primarily due to the higher fuel surcharge. The average fuel surcharge in effect during the 2008 period was 34.3% compared to 21.0% during the 2007 period.
Revenues for our retail intermodal product of $442.4 million for the 2008 period declined 1.2% compared to the 2007 period, on an overall volume decrease of 8.8%. The average freight revenue per container increased 8.4% for the 2008 period due to the higher fuel surcharge.
Revenues in our logistics segment increased $53.8 million, or 13.4%, in 2008 compared to 2007, reflecting increased revenues in all logistic segment business units with the exception of the warehousing and distribution and supply chain services units. The 29.0% revenue increase in our international unit was due to strong export business coupled with increased agricultural shipments. Our former truck services unit revenues increased 10.6% and included increases from owner-operator, brokerage and company truck operations as well as increased fuel surcharges (which partially offset increased fuel costs that could not be fully passed through to our customers). Our highway brokerage unit recorded a revenue increase of 2.7% due to the combination of traffic generated from a program implemented in October 2007 for additional personnel to expand service offerings and to fuel surcharges, partially offset by the loss of a customer in late 2007. Our warehousing and distribution unit’s revenues decreased 0.2% due primarily to reductions resulting from a customer moving into their own distribution center and the closure of a container transload facility. The transload facility did not achieve anticipated volumes as a result of increased inland transportation costs. Our transload business is handled at other existing facilities. This decrease was substantially offset by more year-round warehousing business compared to 2007. Our supply chain services unit revenues decreased 6.4% due to reduced management fees associated with the loss of a customer.
Cost of Purchased Transportation and Services. Cost of purchased transportation and services increased $121.3 million, or 7.9%, in 2008 compared to 2007. Despite declining volumes, the intermodal segment’s cost of purchased transportation and services increased $63.5 million, or 5.3%, in 2008 compared to 2007 reflecting an increase in the linehaul cost per container of approximately 11.0% for both intermodal segment products, partially offset by the declining volumes in 2008 compared to 2007. The higher linehaul cost per container was due primarily to higher fuel costs from our underlying rail and other service providers, rate increases from our underlying rail carriers, increased traffic on the higher cost BNSF Railway and costs associated with some rerouting required due to the Midwest floods. Local dray costs from the ramp to customer location increased $10.8 million in 2008 compared to 2007 due to the increase in door-to-door PacerDirect product volumes. In addition, repositioning costs increased $6.4 million for required container and chassis repositioning reflecting the imbalances in the network, as well as additional costs associated with the increased traffic on the BNSF Railway.
The overall transportation margin percentage, revenues less the cost of purchased transportation divided by revenues, for the intermodal segment declined from 23.0% in 2007 (($1,568.3 million less $1,208.2 million) divided by $1,568.3 million) to 22.1% in 2008 (($1,633.2 million less $1,271.7 million) divided by $1,633.2 million). The decrease was due to the added local dray costs associated with the increase in door-to-door PacerDirect product volumes, increased traffic on the higher cost BNSF Railway, lower pricing to maintain equipment flow, minimize repositioning costs and maintain volume due to competitive pressures, and increases in underlying rail costs both in contract lanes pursuant to contract rate adjustment provisions and rail rate actions in non-contract lanes.
Cost of purchased transportation and services in our logistics segment increased $58.8 million, or 17.8%, in 2008 compared to 2007, reflecting increases in all business units with the exception of the warehousing and distribution and supply chain services units where costs were comparable between
57
Table of Contents
periods. The overall transportation margin percentage for our logistics businesses decreased from 17.8% in 2007 (($402.1 million less $330.4 million) divided by $402.1 million) to 14.6% in 2008 (($455.9 million less $389.2 million) divided by $455.9 million) due primarily to excess capacity affecting our truck services and highway brokerage units and higher purchased transportation and fuel costs affecting our truck services, highway brokerage and international units.
Direct Operating Expenses. Direct operating expenses, which are only incurred by our Stacktrain operations, increased $1.7 million, or 1.3%, in 2008 compared to 2007 due primarily to higher container lease costs partially offset by slightly lower equipment maintenance and repair costs related to a smaller fleet of chassis and newer containers requiring less maintenance. At December 26, 2008, we had 656, or 2.3%, more containers and 519, or 1.7%, fewer chassis than at December 28, 2007.
Selling, General and Administrative Expenses. Selling, general and administrative expenses decreased $0.6 million, or 0.3%, in 2008 compared to 2007. The decrease was due to $6.0 million incurred in 2007 for the severance of 134 personnel that did not recur in 2008, $1.1 million less stock based compensation costs as well as reduced professional fees during 2008. Substantially offsetting these decreases were increases of $5.5 million incurred related to our SAP software project, an increased performance incentive accrual and increased personal injury and cargo claims costs during 2008 at our truck services unit. In addition, in 2007 there was an arbitration settlement that reduced costs in our supply chain services and corporate units. The average employment level was 39 higher in 2008 compared to 2007 and reflected increases primarily in our highway brokerage unit associated with efforts to expand service offerings, and increases associated with our SAP software project.
Goodwill Impairment Write-Off. In accordance with ASC 350, we conducted our annual goodwill impairment test at the end of 2008. Based on a combination of factors including the deterioration of the economy and the steep, sustained decline in our stock price and resulting market capitalization, and the operating results of our logistics reporting unit, we concluded that the carrying value of our logistics reporting unit (including goodwill) exceeded the fair value of our logistics reporting unit. As a result, we recorded a non-cash goodwill impairment charge of $87.9 million, $73.3 million net of tax, or $2.11 per diluted share during 2008. Further information regarding the impairment is detailed in Note 1 of the notes to our consolidated financial statements.
Depreciation and Amortization. Depreciation and amortization expense was comparable between periods.
Income (loss) From Operations. Income from operations decreased $92.6 million, or 97.9% from $94.6 million in 2007 to $2.0 million in 2008.
Income from operations excluding goodwill impairment decreased $4.7 million, or 5.0%, from $94.6 million in 2007 to $89.9 million in 2008. See the table below reconciling the GAAP financial results to adjusted financial results excluding the goodwill impairment charge.
Intermodal segment income from operations increased $1.4 million in 2008 compared to 2007. This small increase was due to downward margin pressures which were seen throughout the year resulting from increased pricing pressure, increasing operations on the higher cost BNSF network and volume declines which were substantial for all businesses in the fourth quarter, but were seen in the automotive line of business throughout the year. Offsetting these negatives were a positive margin impact of rising fuel prices where our rail contracts lag our market fuel surcharges and lower selling, general and administrative costs. The lower selling, general and administrative costs were due, in large part, to the absence in 2008 of $1.8 million in severance costs for the intermodal segment expensed during 2007 relating to our facility rationalization and severance program.
Logistics segment income from operations excluding goodwill impairment decreased $4.3 million to a loss of $0.2 million in 2008 compared to income of $4.1 million in 2007. The primary drivers of this decrease were excess capacity, declining prices and higher transportation and fuel costs affecting our truck services and highway brokerage units. Our investment in personnel to grow the highway brokerage operation also reduced income from operations during 2008. The decline in income from operations from
58
Table of Contents
our supply chain services unit was due to the loss of a customer. In addition, there was a $0.8 million increase in logistics segment costs related primarily to the SAP software project. Partially offsetting these declines in income from operations was increased income from operations from our warehousing and distribution unit due to higher year-round warehousing business and our international unit with increased export traffic. Segment operating income also reflected the absence of $2.1 million of severance costs incurred during 2007 from our facility rationalization and severance program.
Corporate expenses were $1.8 million higher than 2007 due to higher performance incentive accruals in 2008 compared to 2007, partially offset by lower stock based compensation costs and lower professional fees. Corporate expenses in 2008 also reflected the absence of $2.1 million of severance costs incurred in 2007 from our facility rationalization and severance program.
Interest (Expense) Income. Interest (expense) income decreased by $1.3 million for 2008 compared to 2007. This decrease reflects the lower average debt balance outstanding during 2008 and reduced interest rates. The outstanding debt balance at December 26, 2008 was $44.6 million compared to $64.0 million at December 28, 2007. The average interest rate during 2008 was 2.9% compared to 5.7% during 2007. In addition, during 2008, we capitalized $0.7 million of interest related to the SAP software project.
Loss on Extinguishment of Debt. On April 5, 2007, we completed the refinancing of our former term loan and revolving credit facility with a new, five-year revolving credit facility. Charges totaling $1.8 million were incurred due to the write-off of existing deferred loan fees related to the prior credit facility. The new facility was amended and restated in 2009 as discussed above and under “Liquidity and Capital Resources” below.
Income Tax Expense. Income tax expense decreased $18.7 million in 2008 compared to 2007 due primarily to the tax impacts of the $87.9 million pre-tax goodwill impairment charge. Excluding the goodwill impairment charge, income tax expense decreased by $4.1 million from 2007, and included a tax benefit from the release of $3.5 million in tax reserves resulting from the resolution of open tax positions. The effective tax rate, excluding the goodwill impairment charge and reserve adjustment, was comparable between periods.
Net Income (loss). Net income decreased $70.8 million, or 130.1% from $54.4 million in 2007 to a loss of $16.4 million in 2008. Net income excluding goodwill impairment increased by $2.5 million, or 4.6%, from $54.4 million in 2007 to $56.9 million in 2008, reflecting reduced income from operations (down $4.7 million), reduced interest expense and loss on extinguishment of debt (down $3.1 million) and reduced income tax expense (down $4.1 million) as discussed above. Net income in 2008 also reflected an increase over 2007 due to a $1.8 million loss in extinguishment of debt incurred in 2007.
59
Table of Contents
Reconciliation of GAAP Financial Results to Adjusted Financial Results Excluding the Goodwill
Impairment Charge
For the Fiscal Year Ended December 26, 2008 (in millions, except share and per share amounts)
| Item |
2008 | 2007 GAAP Results (as adjusted) 3/ |
2008 (as adjusted) vs 2007 (as adjusted) Variance |
|||||||||||||||||
| GAAP Results (as adjusted) 3/ |
Adjustments | Adjusted Results |
||||||||||||||||||
| Income (loss) from operations – intermodal |
$ | 113.5 | $ | - | $ | 113.5 | $ | 112.1 | $ | 1.4 | ||||||||||
| Loss from operations – Logistics |
(88.1 | ) | 87.9 | 1/ | (0.2 | ) | 4.1 | (4.3 | ) | |||||||||||
| Loss from operations – Corporate |
(23.4 | ) | - | (23.4 | ) | (21.6 | ) | (1.8 | ) | |||||||||||
| Income (loss) from operations – Total |
2.0 | $ | 87.9 | $ | 89.9 | $ | 94.6 | $ | (4.7 | ) | ||||||||||
| Interest expense, net |
2.4 | - | 2.4 | 5.5 | (3.1 | ) | ||||||||||||||
| Income (loss) before income taxes |
(0.4 | ) | 87.9 | 87.5 | 89.1 | (1.6 | ) | |||||||||||||
| Income taxes |
16.0 | 14.6 | 2/ | 30.6 | 34.7 | (4.1 | ) | |||||||||||||
| Net income (loss) |
$ | (16.4 | ) | $ | 73.3 | $ | 56.9 | $ | 54.4 | $ | 2.5 | |||||||||
| Diluted earnings (loss) per share |
$ | (0.47 | ) | $ | 2.11 | $ | 1.64 | $ | 1.51 | $ | 0.13 | |||||||||
| Weighted average shares outstanding |
34,616,598 | 34,739,597 | 34,739,597 | 35,911,246 | (1,171,649 | ) | ||||||||||||||
1/ Logistics segment goodwill impairment charge.
2/ Actual tax impact of the goodwill impairment charge.
3/ Amounts have been adjusted to conform to the current completed service method of revenue and cost recognition for our Stacktrain business unit and the application of ASC Topic 260-10-45, “Earnings Per Share” (see Notes 1 and 2 of the notes to consolidated financial statements).
Liquidity and Capital Resources
Cash provided by operating activities was $12.5 million, $59.6 million and $108.0 million for the fiscal years ended December 31, 2009, December 26, 2008 and December 28, 2007, respectively. The decrease in cash provided by operating activities in 2009 was due primarily to lower income from operations in the 2009 period related to the economic downturn. The lower balances of trade accounts receivable and trade accounts payable in 2009 compared to 2008 also reflected the economic downturn. Partially offsetting the decreased cash flow from operating activities was the $30 million payment we received related to the new Union Pacific arrangements which was used to pay down debt and a tax refund of $8.5 million in the 2009 period compared to tax payments of $32.6 million during the 2008 period.
The decrease in cash provided by operating activities in 2008 was due to the combination of the 2007 settlement of the Del Monte arbitration case increasing cash from operations in 2007 and the impact of lower traffic volumes in 2008 compared to 2007. While our balances of accounts receivable and accounts payable both declined in 2008 compared to 2007, our overall days’ sales outstanding on trade receivables and our days’ payable outstanding on trade payables remained consistent between years. In addition, in 2008 there were amounts paid related to our 2007 restructuring program and higher tax payments. Tax payments were $32.6 million in 2008 compared to $24.1 million in 2007. The lower payment in the 2007 period was due to a lower federal extension payment which is based on the timing of earnings during the year.
60
Table of Contents
Cash generated from operating activities is principally used for working capital purposes, to fund capital expenditures and fund any dividends that we may declare in the future, to repay debt under our revolving credit facility, and in the future would be available to fund any acquisitions we decide to make or repurchase common stock, if re-authorized by our Board. As required under our A&R Credit Agreement, qualified daily cash receipts are applied on the next business day to repay outstanding borrowings, and cash requirements on a daily basis are borrowed under the A&R Credit Agreement. We had working capital of $10.8 million and $46.1 million at December 31, 2009 and December 26, 2008, respectively. The reduction in 2009 is due primarily to the classification of $23.0 million of outstanding debt under the A&R Credit Agreement as a current liability. Interest paid was $3.0 million, $3.2 million and $4.7 million in 2009, 2008 and 2007, respectively.
Our operating cash flows are also the primary source for funding our contractual obligations. The table below summarizes as of December 31, 2009, our major commitments (in millions).
Contractual Obligations
| Total | Less than 1 year |
1-3 years |
3-5 years |
More than 5 years | |||||||||||
| Debt |
$ | 23.0 | $ | 23.0 | $ | - | $ | - | $ | - | |||||
| Capital lease obligations |
0.3 | 0.3 | - | - | - | ||||||||||
| Interest on debt |
7.8 | 3.5 | 4.3 | - | - | ||||||||||
| Operating leases |
346.0 | 78.4 | 135.0 | 86.7 | 45.9 | ||||||||||
| Volume incentives |
2.4 | 2.4 | - | - | - | ||||||||||
| APL IT agreement |
5.0 | 5.0 | - | - | - | ||||||||||
| SAP IT agreement |
13.1 | 6.5 | 6.3 | 0.3 | - | ||||||||||
| Other IT agreements |
6.7 | 2.3 | 2.4 | 1.5 | 0.5 | ||||||||||
| HR agreements |
1.6 | 0.7 | 0.9 | - | - | ||||||||||
| Severance liability |
1.8 | 1.3 | 0.5 | - | - | ||||||||||
| Purchased transportation |
24.5 | 24.5 | - | - | - | ||||||||||
| Total |
$ | 432.2 | $ | 147.9 | $ | 149.4 | $ | 88.5 | $ | 46.4 | |||||
Debt is the amount outstanding under our A&R Credit Agreement which we entered into in August 2009. As a result of the lock-box arrangements under the A&R Credit Facility, amounts outstanding thereunder at December 31, 2009 are classified as a current liability on our consolidated balance sheet under ASC 470-10-45. The capital lease obligations were incurred in 2008 and are related to our SAP software project. Cash interest expense on debt was estimated using current rates as of December 31, 2009 for all periods based upon the current outstanding balance through April 5, 2012, the maturity date of the A&R Credit Agreement.
The majority of the operating lease obligations relates to our intermodal segment’s lease of railcars, containers and chassis, but also includes operating leases for tractors used in our local trucking operations. Each year a portion of the operating leases must be renewed or can be terminated based upon equipment requirements. Partially offsetting these lease payment requirements are railcar and container per diem revenues (not reflected in the table above) which were $49.0 million in 2009, $60.9 million in 2008, and $66.2 million in 2007. Also partially offsetting the lease payment requirements are amounts payable by Union Pacific (not reflected in the table above) for the portion of our 53-foot container and chassis fleet estimated to be necessary to support the domestic east-west big-box traffic from third party intermodal marketing companies that are transitioning to Union Pacific. Union Pacific assumes these responsibilities for greater numbers of container and chassis in stages with full responsibility for its allocated portion of the fleet beginning on February 1, 2010. Operating leases for railcars contain provisions for automatic renewal for an additional five year period, resulting in a total lease term from lease inception of fifteen years. The above table assumes the automatic renewal and the minimum lease payments reflect the term for the fifteen years from lease inception. If we were to provide notice of non-renewal, the minimum lease payments (including the potential guaranteed portion of the residual value which may be payable) would be $78.9 million in 2010, $92.9 million in 2011, $55.3 million in 2012, $40.5 million in 2013, $30.9 million in 2014 and $32.4 million thereafter for a total of $330.9 million.
61
Table of Contents
Volume incentives (which are recorded as a reduction of revenues in our consolidated financial statements) relate to amounts payable to companies that ship on our Stacktrain unit that met certain volume shipping commitments for the year 2009.
Our APL IT agreement is a long-term contract expiring in May 2019 and is cancelable by us on 120 days notice without penalty. We are currently working to develop internally new transportation management and operations solutions to replace and enhance the systems currently provided by APL. The new solutions are expected to include equipment management, pricing, billing and tracking and tracing applications. We expect to complete the development and implementation efforts in 2010. As permitted under the APL IT agreement we have notified APL that we intend to cease using its information technology services during the second quarter of 2010. Accordingly, the table shows our obligation through that date.
The SAP IT agreement reflects commitments for ongoing maintenance and support, to SAP and other parties. See the discussion below for further information on the SAP software project. The Other IT agreements reflect a telecommunications commitment for voice, data and frame relay services and IT licensing, hosting and maintenance commitments. The human resources agreements reflect our human resources benefit system and payroll processing contract. The severance liability relates to amounts to be paid related to our current cost reduction and lease termination activities. The purchased transportation amount reflects our estimate of the cost of transportation purchased by our segments that is in process at period-end but not yet completed and minimum container commitments to ocean carriers made by our non-vessel operating common carrier operation.
Based upon the current level of operations (excluding the east-west big box business that is transitioning away from us as a result of the new Union Pacific arrangements) and the anticipated future growth in both of our operating segments, management believes that estimated operating cash flow and availability under the A&R Credit Agreement will be adequate to meet our working capital, capital expenditure and other cash needs during 2010, although no assurance can be given in this regard. Should the economic downturn continue for an extended period of time or worsen, our operating cash flows may be adversely impacted. Similarly, the availability under the borrowing base limitations of the A&R Credit Agreement would be reduced if our accounts receivables should decline as a result of continuing or worsening economic conditions. Continued or further disruption of the credit markets, the failure of banks in our lending group or their inability or refusal to provide funds under our credit facility and instability in capital markets could also reduce the availability of funding under our A&R Credit Agreement or for operating lease transactions.
Cash flows provided by (used in) investing activities were $15.7 million, $(23.0) million and $(13.1) million for 2009, 2008 and 2007, respectively. 2009 cash capital expenditures included $4.6 million for the SAP software project and $4.6 million for normal computer replacement items and leasehold improvements. During the 2009 period, we retired and sold primarily 48-ft. chassis in our Stacktrain unit for proceeds of $0.6 million, received $1.8 million associated with the sale of certain assets of our Pacer Transport business unit, and received $22.5 million from SAP as discussed below. The use of cash in 2008 included $16.6 million of cash capital expenditures related to the SAP project discussed below. An additional $4.6 million of capital expenditure was incurred for the purchase of 450 new 53-foot chassis. The remaining 2008 capital expenditures of $3.6 million were primarily for normal computer replacement items, partially offset by net proceeds of $1.8 million from the sale of primarily 48-foot chassis and containers. The use of cash in 2007 included $10.6 million related to the SAP project as discussed below. The remaining 2007 capital expenditures of $3.4 million were primarily for normal computer replacement items, partially offset by net proceeds of $0.9 million from the sale of property.
On September 30, 2007, we entered into a software license agreement with SAP under which an enterprise suite of applications was licensed, including the latest release of SAP’s transportation management solution. During 2008 and 2009, the finance and accounting modules of the new system were implemented at all business units. On June 25, 2009, we entered into an amendment to the software license agreement with SAP, under which the software licensed was limited to the financial and accounting applications. In connection with the amendment, we received a cash payment of $22.5 million and wrote-off $22.4 million of previously capitalized software and other associated costs related to the
62
Table of Contents
development of the SAP transportation operations modules. The net amount of the cash received and amounts written-off of $0.1 million is recorded in the selling, general and administrative expenses line item in the consolidated statements of operations. The cash payment from SAP was used to pay down debt and for general corporate purposes.
Cash flows used in financing activities were $30.4 million, $38.1 million and $87.9 million for the 2009, 2008 and 2007 periods, respectively. During the 2009 period, we repaid $23.4 million, including $2.4 million of debt issuance costs paid to lenders and $1.4 million of debt issuance costs paid to other third parties, under our revolving credit facility, paid the $5.2 million fourth quarter 2008 cash dividend, and repaid $0.3 million of capital lease obligations related to the SAP software project. As of December 31, 2009, borrowings under the new A&R Credit Agreement (as discussed below) bore a weighted average interest rate of 5.5% per annum. The net book value of equipment under capital lease was $0.3 million at December 31, 2009. During 2009, 21,569 shares of our common stock were surrendered for payment of employee taxes due upon the annual June 1, 2009 vesting of restricted stock. These shares were retired, thereby reducing stockholders’ equity by $0.1 million. During 2008, we repaid $20.0 million on our revolving credit facility and $0.2 million of capital lease obligations related to the SAP software project, and paid $20.8 million for cash dividends. Options to purchase 274,865 shares of our common stock were exercised in 2008 for total proceeds of $3.0 million. The excess tax benefit associated with the exercise of the options and the vesting of restricted stock under ASC 718 was $0.2 million. Also during 2008, 19,039 shares of our common stock were surrendered for payment of employee taxes due upon the annual June 1, 2008 vesting of restricted stock. These shares were retired, thereby reducing stockholders’ equity by $0.3 million. During 2007, we refinanced our prior bank revolving credit and term loan facility and the $59.0 million outstanding thereunder with a new revolving credit facility. During 2007, we borrowed an additional net $5.0 million under the new facility to repurchase common stock and for general corporate purposes. During 2007, options to purchase 169,132 shares of our common stock were exercised for total proceeds of $1.8 million. The excess tax benefit associated with the exercise of the options and vesting of restricted stock was $0.2 million. Also during the 2007 period, 2,938,635 shares of our common stock were repurchased and retired for $72.5 million and we paid $21.6 million in common stock cash dividends.
The A&R Credit Agreement, which was entered into on August 28, 2009 and maintains the original maturity of April 5, 2012, provides for a revolving credit facility of up to $125 million (including a $35 million letter of credit facility and a $10 million swing line loan facility), and an accordion feature providing for an increase in the facility of up to $50 million subject to certain conditions (for a total facility of $175 million if such conditions are met). Borrowing under the facility is determined on a daily basis as calculated under a borrowing base formula determined on a monthly basis equal to the lesser of (a) $125 million less the sum of substantially all obligations under outstanding letters of credit (the “L/C Reserve”) and an amount equal to the availability block (described below), or (b) an amount equal to (i) the sum of (x) 85% of the eligible accounts receivables, (y) 85% of eligible earned but unbilled accounts receivable up to $17.5 million and (z) the lesser of (I) 80% of the net liquidation value of eligible owned railcars and chasses and (II) $25.0 million, which lesser amount is reduced monthly by $250,000 beginning September 30, 2009), minus (ii) the availability reserve (described below).
The availability block is $500,000 per month on a cumulative basis beginning September 30, 2009, except that commencing March 30, 2010 (at which time the availability block will have reached $3 million) the availability block will cease to escalate and instead will be released in four successive equal monthly installments if, and only for so long as, we have achieved a fixed charge coverage ratio of greater than 1.25:1.00 for the preceding 12 month period (or for periods ending on or prior to July 30, 2010, for the period beginning August 1, 2009). If the availability block fixed charge coverage ratio is 1.25:1.00 of lower for any such period, the release of any block will be suspended, and the availability block will recommence at the rate of $500,000 per month which will be added to any then existing availability block. As of December 31, 2009, the availability block was $2.0 million.
The availability reserve is the sum of (i) the L/C Reserve, (ii) reserves established by the Administrative Agent in its reasonable discretion for bank products extended to us by any lender party to the A&R Credit Agreement (such as foreign exchange and cash management services), (iii) obligations of the Company and its subsidiaries secured by liens that are senior to the liens under the A&R Credit Agreement, (iv) the availability block then in effect, and (v) such additional reserves established by the
63
Table of Contents
Administrative Agent in its reasonable discretion from time to time. As of December 31, 2009, the availability reserve was $24.7 million, comprised of $22.7 million in L/C Reserve and $2.0 million in availability block.
Until the delivery of financial statements and a compliance certificate with respect to the period ending March 31, 2010, borrowings under the A&R Credit Agreement will bear interest, at our option, at a base rate plus a margin of 3.75% per annum, or at a Eurodollar rate plus a margin of 4.75% per annum. Following delivery of such financial statements and compliance certificate, the margin may decline to 3.50% on base rate loans or 4.50% on Eurodollar rate loans if the our fixed charge coverage ratio for the applicable period described below is greater than 1.50:1.00. The base rate is the highest of the prime lending rates of the Administrative Agent, the Eurodollar rate for a 30-day interest period plus 1.0%, or the federal funds rate plus 1/2 of 1%.
The A&R Credit Agreement also provides for letter of credit fees equal to the applicable Eurodollar rate margin referred to above, and a commitment fee payable on the unused portion of the facility, which shall accrue at a rate per annum ranging from 0.50% to 0.75%, depending on the average loans and letter of credit outstanding as a percentage of the aggregate commitments under the facility.
Under the borrowing base formula determined as of December 31, 2009 as described above, $45.2 million was available under the A&R Credit Agreement, net of $23.0 million in outstanding loans and $22.7 million of outstanding letters of credit and $2.0 million availability block. The outstanding loan amount has been reduced $3.3 million for cash deposited into the lenders lock-box on December 31, 2009 and applied to the repayment of debt on January 1, 2010. Bank and consulting fees of $3.8 million associated with completing the amendment have been capitalized and are being amortized over the remaining life of the A&R Credit Agreement. In addition, due to the reduction in borrowing capacity affected by the A&R Credit Agreement, a total of $0.3 million of previously deferred loan fees were written-off to interest expense in 2009. We used the $30 million received from the Union Pacific on November 3, 2009 in connection with the new arrangements to pay down outstanding borrowings under the A&R Credit Agreement.
The A&R Credit Agreement contains affirmative, negative and financial covenants customary for such financings, including, among other things, limits on the incurrence of debt, the incurrence of liens, restricted payments, transactions with affiliates, capital expenditures and mergers and consolidations and a fixed charge coverage ratio. It also contains customary representations and warranties. Breaches of the covenants, representations or warranties may give rise to an event of default. Other events of default include our failure to pay certain debt, the occurrence of a default with respect to any of our indebtedness resulting in, or which permits, the acceleration, repurchase, repayment or redemption of such indebtedness, certain insolvency and bankruptcy proceedings, certain ERISA events, unpaid judgments over a specified amount, and a change in control as defined in the A&R Credit Agreement. If an event of default occurs, our indebtedness may become due and payable.
The fixed charge coverage ratio requires us to maintain as of the end of each month a minimum ratio for the preceding 12-month period (or for periods ending on or prior to July 30, 2010, for the period beginning August 1, 2009 through the end of the applicable month) of 1.25:1.00. At December 31, 2009, we were in compliance with the covenants of the A&R Credit Agreement, with a fixed charge coverage ratio of 4.3x. The fixed charge coverage ratio is the ratio of (a) EBITDA (defined as net income plus interest, income taxes, depreciation and amortization expense, non-recurring expenses reducing such net income which do not represent a cash item in the relevant or any future period, non-cash charges or expenses related to equity plans or stock option awards, payroll taxes on exercise of stock options, operating losses associated with Pacer Transport, Inc. (capped at $500,000), and non-recurring operational restructuring charges incurred before August 28, 2010 (capped at $2 million in any three-month period and $5 million in total) minus income tax credits and non-cash items increasing net income) to (b) fixed charges (cash interest expense, regularly scheduled principal payments on or redemptions or similar acquisitions for value of borrowed money, income taxes paid in cash, and capital expenditures (other than those financed with borrowed money other than under the A&R Credit Agreement)).
64
Table of Contents
As required by the A&R Credit Agreement, we have established a lock-box arrangement under which all qualified daily cash receipts are applied on the next business day to repay outstanding borrowings under the A&R Credit Agreement. ASC 470-10-45-5A, “Debt,” indicates that when such arrangements exist, all outstanding borrowings under a revolving credit agreement, such as the A&R Credit Agreement, are to be classified as a current liability.
The A&R Credit Agreement limits our annual capital expenditures to $13.5 million for 2009 and $6.5 million for 2010 and thereafter plus 50% of any prior years’ under-run. Accordingly, maximum annual permitted capital expenditures for 2010 are $8.1 million. Capital expenditures are budgeted at $6.8 million in 2010.
The A&R Credit Agreement is guaranteed by all of our direct and indirect (domestic) subsidiaries and is secured by a first priority, perfected security interest in substantially all of the present and future tangible and intangible assets, intercompany debts, stock or other equity interests owned by us, our domestic subsidiaries, and a portion of the stock or other equity interests of certain of our foreign subsidiaries.
During 2009, we returned 2,250 primarily 53-ft. leased containers and sold 597 primarily 53-ft. owned containers, returned 2,396 leased chassis, and sold 709 primarily 48-ft. owned chassis and received 818 primarily 53-ft. leased chassis. During 2009, six leased railcars were destroyed.
During 2008, we received 3,079 primarily 53-ft. leased containers and 3,038 primarily 53-ft leased chassis, and returned 2,423 primarily 48-ft. leased containers, 2,275 primarily 48-ft. and 40-ft. leased chassis, and sold 1,282 48-ft. owned chassis. During 2008, one leased railcar was destroyed.
During 2007, we received 1,658 primarily 53-ft. leased containers and 1,072 53-ft., 48-ft. and 40-ft. leased chassis, and we returned 2,191 primarily 48-ft. leased containers, 1,596 primarily 48-ft. and 40-ft. leased chassis, and sold 618 48-ft. owned. During 2007, four railcars were destroyed.
Common Stock Repurchase Program
On June 12, 2006, we announced that our Board of Directors had authorized the purchase of up to $60 million of our common stock, and, on April 3, 2007, the company announced that our Board of Directors had authorized the purchase of an additional $100 million of our common stock. Both authorizations expired on June 15, 2009. We repurchased a total of 19,039 shares at an average price of $21.54 per share through December 26, 2008, and 21,569 shares at an average price of $3.08 per share during 2009. See Item 5 for a discussion of the limitations imposed by the A&R Credit Agreement on common stock repurchases.
Off-Balance Sheet Arrangements
We have not entered into any transactions with unconsolidated entities whereby the company has financial guarantees, subordinated retained interests, derivative instruments, or other contingent arrangements that expose us to material continuing risks, contingent liabilities, or any other obligation under a variable interest in an unconsolidated entity that provides financing, liquidity, market risk, or credit risk support to us.
Recently Issued Accounting Pronouncements
In June 2009, the FASB issued Statement of Financial Accounting Standards (“SFAS”) No. 168, “FASB Accounting Standards Codification and the Hierarchy of Generally Accepted Accounting Principles, a replacement of FASB Statement No. 162.” SFAS No. 168, now referred to as ASC 105, does not change current U.S. generally accepted accounting principles (“GAAP”). The FASB Accounting Standards Codification was developed to organize GAAP pronouncements by topic so that users can more easily access authoritative accounting guidance. It is organized by topic, subtopic, section, and paragraph, each of which is identified by a numerical designation. This statement was effective for interim and annual periods ended after September 15, 2009. All accounting references in this report have been updated, and therefore all SFAS and other accounting references have been replaced with ASC references.
65
Table of Contents
In May 2009, ASC Topic 855-10-50, “Subsequent Events,” established general standards of accounting for and disclosure of events that occur after the balance sheet date but before the financial statements are issued or are available to be issued. It requires the disclosure of the date through which an entity has evaluated subsequent events and the basis for that date, and was effective for interim and annual reporting periods ended after June 15, 2009. The adoption of ASC 855-10-50 did not have a material impact on our results of operations or financial condition.
Inflation
We contract with railroads and independent truck operators for our transportation requirements. These third parties are responsible for providing their own diesel fuel. To the extent that changes in fuel prices are passed along to us, we have historically passed these changes along to our customers. There is no guarantee, however, that this will be possible in the future.
ITEM 7A. QUANTITATIVE AND QUALITATIVE DISCLOSURES ABOUT MARKET RISK
Our market risk is affected primarily by changes in interest rates. Under our policies, we may use hedging techniques and derivative financial instruments to reduce the impact of adverse changes in market prices. The quantitative information presented below and the additional qualitative information presented above in “Item 7. Management’s Discussion and Analysis of Financial Condition and Results of Operations” and Notes 1 and 3 to the notes to our consolidated financial statements included in this Annual Report on Form 10-K describe significant aspects of our financial instrument programs which have market risk.
We have market risk in interest rate exposure, primarily in the United States. We manage interest exposure through floating rate debt. Interest rate swaps may be used to adjust interest rate exposure when appropriate based on market conditions. No interest rate swaps were outstanding at December 31, 2009 or December 26, 2008.
Based upon the average variable interest rate debt outstanding during 2009, a 100 basis point change in our variable interest rates would have affected our 2009 pre-tax earnings by approximately $0.2 million. For 2008, a 100 basis point change in our variable interest rates would have affected our 2008 pre-tax earnings by approximately $0.5 million. For 2007, a 100 basis point change in our variable interest rates would have affected our 2007 pre-tax earnings by approximately $0.6 million.
As our foreign business expands, we will be subjected to greater foreign currency risk.
ITEM 8. FINANCIAL STATEMENTS AND SUPPLEMENTARY DATA
The consolidated financial statements, including supplementary data and the accompanying report of independent registered public accounting firm, are listed in the index to consolidated financial statements and financial statement schedules on page F-1 filed as part of this Annual Report on Form 10-K.
ITEM 9. CHANGES IN AND DISAGREEMENTS WITH ACCOUNTANTS ON ACCOUNTING AND FINANCIAL DISCLOSURE
None.
ITEM 9A. CONTROLS AND PROCEDURES
Disclosure Controls and Procedures
Evaluation of Disclosure Controls and Procedures. We evaluated the effectiveness of the design and operation of our “disclosure controls and procedures” as defined in Rule 13a-15(e) under the Securities Exchange Act of 1934, as amended (the “Exchange Act”) as of the end of the period covered by this report. This evaluation (the “disclosure controls evaluation”) was done under the supervision and with the participation of management, including our chief executive officer (“CEO”) and chief financial officer
66
Table of Contents
(“CFO”). Rules adopted by the SEC require that in this section of our Annual Report on Form 10-K we present the conclusions of the CEO and the CFO about the effectiveness of our disclosure controls and procedures as of the end of the period covered by this report based on the disclosure controls evaluation.
Objective of Controls. Our disclosure controls and procedures are designed so that information required to be disclosed in our reports filed or submitted under the Exchange Act, such as this Annual Report on Form 10-K, is recorded, processed, summarized and reported within the time periods specified in the SEC’s rules and forms. Our disclosure controls and procedures are also intended to ensure that such information is accumulated and communicated to our management, including the CEO and CFO, as appropriate to allow timely decisions regarding required disclosure. There are inherent limitations to the effectiveness of any system of disclosure controls and procedures, including the possibility of human error and the circumvention or overriding of the controls and procedures. Accordingly, even effective disclosure controls and procedures can only provide reasonable assurance of achieving their control objectives, and management necessarily is required to use its judgment in evaluating the cost-benefit relationship of possible disclosure controls and procedures.
Conclusion. Based upon the disclosure controls evaluation, our CEO and CFO have concluded that as of December 31, 2009, our disclosure controls and procedures (as defined in Rules 13a-15(e) and 15d-15(e) under the Exchange Act) were effective to provide reasonable assurance that the foregoing objectives are achieved.
Management’s Report on Internal Control over Financial Reporting
The management of Pacer is responsible for establishing and maintaining adequate internal control over financial reporting as such term is defined in Rules 13a-15(f) and 15d-15(f) under the Exchange Act. Our internal control over financial reporting is a process designed by, or under the supervision of, our CEO and CFO, to provide reasonable assurance regarding the reliability of financial reporting and the preparation of financial statements for external purposes in accordance with accounting principles generally accepted in the United States of America. Because of its inherent limitations, internal control over financial reporting may not prevent or detect misstatements. Also, projections of any evaluation of effectiveness to future periods are subject to the risk that controls may become inadequate because of changes in conditions, or that the degree of compliance with the policies or procedures may deteriorate.
Pacer’s management, under the supervision and with participation of the CEO and CFO, has assessed the effectiveness of the company’s internal control over financial reporting as of December 31, 2009. In making its assessment of internal control over financial reporting, management used the criteria described in Internal Control—Integrated Framework issued by the Committee of Sponsoring Organizations of the Treadway Commission (COSO).
Based on this evaluation, management concluded that as of December 31, 2009 our internal control over financial reporting was effective based on criteria in Internal Control—Integrated Framework issued by the COSO.
The effectiveness of our internal control over financial reporting as of December 31, 2009 has been audited by PricewaterhouseCoopers LLP, an independent registered public accounting firm, as stated in their report beginning on page F-2.
Remediation of Material Weaknesses
As discussed in our 2008 Annual Report on Form 10-K, we concluded that we had a material weakness in our internal controls over the preparation and review of certain balance sheet reconciliations, particularly in reconciling items in certain cash accounts pertaining to Pacer Cartage and in various intercompany accounts among our intermodal segment operations. Accordingly, our management concluded that our internal controls over financial reporting were not effective as of December 26, 2008. During the period covered by the March 31, 2009 quarterly report, we identified a separate control
67
Table of Contents
deficiency that rose to the level of a material weakness in internal control over financial reporting related to the operating effectiveness of controls designed to achieve the proper accounting for the income tax effect of non-recurring book adjustments, specifically the tax impact of goodwill impairment charges at March 31, 2009, and resulted in an adjustment to certain tax accounts in the company’s consolidated financial statements for the quarterly period ended March 31, 2009.
We completed implementation of the general ledger accounting modules of SAP in all of our business units as previously discussed in the quarter ended June 30, 2009 Item 4, which has allowed us to initiate new, more timely procedures for the review and reconciliation of balance sheet accounts, including cash and intercompany balances. In particular, we have completed our testing of new procedures which specifically address the material weakness in our internal controls identified in our 2008 Annual Report, including enhanced, more timely analysis of balance sheet accounts to identify and reexamine period to period fluctuations and avoid reclassifications and enhanced senior management review procedures around the bank reconciliation process that include more timely review and resolution of reconciling items. In addition, with the SAP general ledger implementation, the consolidation, centralization and streamlining of accounting activities performed at various operating unit field locations has been initiated and in some cases completed. The consolidation of the accounting activities for our Cartage business unit was completed during the third quarter of 2009. We have also completed our testing of enhanced internal and external review of the tax provision procedures that are designed to specifically address the material weakness identified in the first quarter of 2009. We completed our testing of our remediation efforts at the end of the fourth quarter of 2009 and concluded that the existing material weaknesses had been fully remediated.
Changes in Internal Control Over Financial Reporting
While the planned remediation efforts discussed above were designed and implemented as soon as practicable and were fully in place by the end of the third quarter of 2009, management continued to test and evaluate the operating effectiveness of the new processes and procedures through the end of fiscal year 2009, when it was concluded that our internal controls over financial reporting were effective. There were no changes in our internal control over financial reporting during the quarter ended December 31, 2009 that materially affected, or are reasonably likely to materially affect, our internal control over financial reporting.
On February 22, 2010, the Compensation Committee of our Board of Directors approved the 2010 Bonus Plan, which is filed as Exhibit 10.38 hereto. The 2010 Bonus Plan provides for payment of cash bonuses subject to achievement of specified corporate financial objectives. Our Chief Executive Officer, Chief Financial Officer and General Counsel, as well as our other executive officers named under the caption “EXECUTIVE OFFICERS OF THE REGISTRANT” in Item 4 of this Annual Report on Form 10-K, are eligible to participate in the 2010 Bonus Plan. The other named executive officers listed in our proxy statement for our 2009 annual meeting of shareholders, Messrs. Brashares, Orris, Uremovich and Yarberry, are no longer employed by Pacer and thus will not participate in the 2010 Bonus Plan. Bonuses payable under the 2010 Bonus Plan are contingent on the Company’s actual fiscal year 2010 operating income, as may be adjusted by the Committee in its discretion for certain items as described in the 2010 Bonus Plan, falling within specified minimum and maximum consolidated operating income targets established by the Committee, and are capped at 150% of a participant’s bonus opportunity (stated as a percentage of base salary) as established by the Committee. For our Chief Executive Officer, the target bonus opportunity is set at 100% of annual base salary. For our Chief Financial Officer and General Counsel, the target bonus opportunity is set at 50% of annual base salary. For other executive officers, the target bonus opportunity ranges from 25% to 50% of annual base salary.
Pacer will provide additional information regarding the compensation of its executive officers in its proxy statement for its 2010 annual meeting of shareholders.
The foregoing summary of the 2010 Bonus Plan is qualified in its entirety by reference to the actual terms of the plan filed as Exhibit 10.38 hereto.
68
Table of Contents
ITEM 10. DIRECTORS, EXECUTIVE OFFICERS AND CORPORATE GOVERNANCE
| (a) | Identification of Directors. |
| The information required by this Item, with respect to our directors, is incorporated herein by reference to the discussion under the heading “Proposal 1: Election of Directors” in our Proxy Statement for our 2010 annual meeting of shareholders which is expected to be filed with the SEC no later than 120 days after the end of our 2009 fiscal year. |
| (b) | Identification of Executive Officers. |
| Certain information concerning our executive officers is presented in Part I of this Annual Report on Form 10-K under the heading “Executive Officers of the Registrant” in accordance with General Instruction G(3) of Form 10-K. |
| (c) | Audit Committee Information; Financial Expert. |
| The information required by this Item with respect to the Audit Committee of our Board of Directors and the Audit Committee financial expert is incorporated herein by reference to the discussion under the heading “Audit Committee” in our Proxy Statement for our 2010 annual meeting of shareholders which is expected to be filed with the SEC no later than 120 days after the end of our 2009 fiscal year. |
| (d) | Section 16(a) Compliance. |
| The information concerning compliance with Section 16(a) of the Securities Exchange Act of 1934, as amended, is incorporated herein by reference to the discussion under the heading “Section 16(a) Beneficial Ownership Reporting Compliance” in our Proxy Statement for our 2010 annual meeting of shareholders which is expected to be filed with the SEC no later than 120 days after the end of our 2009 fiscal year. |
| (e) | Code of Ethics. |
| Our code of ethics applicable to all directors and employees, including our CEO, CFO, principal accounting officer or controller, or persons performing similar functions, was adopted by our Board of Directors on January 27, 2004. Our code of ethics is posted on our website at www.pacer.com in the “Investor Relations” sub-pages and is also available free of charge by written request to our Treasurer at Pacer International, Inc., 2300 Clayton Road, Suite 1200, Concord, California 94520. Any amendment to, or waiver from, our code of ethics will be posted on our website within four business days following such amendment or waiver. |
| (f) | Policy for Nominees. |
| The information required under Item 407(c)(3) of Regulation S-K is incorporated herein by reference to the discussion concerning procedures by which shareholders may recommend nominees contained under the heading “Nominating and Corporate Governance Committee” in our Proxy Statement for our 2010 annual meeting of shareholders which is expected to be filed with the SEC no later than 120 days after the end of our 2009 fiscal year. No material changes to the nominating process have occurred. |
ITEM 11. EXECUTIVE COMPENSATION.
The information required by this Item, with respect to compensation of our directors and executive officers, is incorporated herein by reference to the discussions under the headings “2009 Director Compensation,” “Executive Compensation” and “Compensation Committee Interlocks and Insider
69
Table of Contents
Participation” in our Proxy Statement for our 2010 annual meeting of shareholders which is expected to be filed with the SEC no later than 120 days after the end of our 2009 fiscal year. The information required under Item 407(e)(5) of Regulation S-K is set forth under the heading “Compensation Committee Report” in our Proxy Statement for our 2009 annual meeting of shareholders, and is being furnished in this Annual Report on Form 10-K and is not incorporated herein by reference.
ITEM 12. SECURITY OWNERSHIP OF CERTAIN BENEFICIAL OWNERS AND MANAGEMENT AND RELATED STOCKHOLDER MATTERS
EQUITY COMPENSATION PLAN INFORMATION
| Plan Category |
Number of securities to be issued upon exercise of outstanding options, warrants and rights (a) |
Weighted-average exercise price of outstanding options, warrants and rights (b) |
Number of securities remaining available for future issuance under equity compensation plans (excluding securities reflected in column (a)) (c) |
||||||
| Equity compensation plans approved by security holders |
464,900 | (1) | $ | 17.38 | 2,169,750 | (1) | |||
| Equity compensation plans not approved by security holders |
- | - | - | ||||||
| Total |
464,900 | (1) | $ | 17.38 | 2,169,750 | (1) | |||
(1) Under our 1999 Stock Option Plan, options to purchase 158,800 shares of our common stock were outstanding as of December 31, 2009, our fiscal year end, and no further option grants can be made under that plan. Under our 2002 Stock Option Plan, options to purchase 270,100 shares of our common stock were outstanding as of December 31, 2009, and no further option grants can be made under that plan. As of December 31, 2009, options to purchase 36,000 shares of our common stock were outstanding under our 2006 Long-Term Incentive Plan (the “2006 Plan”). In addition, at December 31, 2009, 116,750 restricted shares of common stock had been issued and were outstanding under the 2006 Plan. As of December 31, 2009, we have available 2,169,750 shares of our common stock for future issuance under the 2006 Plan.
The Board has reserved a total of 2.5 million shares of common stock for issuance under the 2006 Plan. The 2.5 million shares authorization is subject to adjustment for a stock split, reverse stock split, stock dividend, combination or reclassification of the shares, or any other similar transaction (but not the issuance or conversion of convertible securities). If an award, other than a Substitute Award (defined below), is forfeited or otherwise terminates without the issuance or delivery of some or all of the shares underlying the award to the grantee, or becomes unexercisable without having been exercised in full, the remaining shares that were subject to the award will become available for future awards under the 2006 Plan (unless the 2006 Plan has terminated). The grant of a stock appreciation right will not reduce the number of shares that may be subject to awards, but the number of shares issued upon the exercise of a stock appreciation right will so reduce the available number of shares.
Substitute Awards will not reduce the number of shares available for issuance under the 2006 Plan. “Substitute Awards” are awards granted in assumption of or in substitution for outstanding awards previously granted by a company acquired by or merged into the Company or any of its subsidiaries or with which the Company or any of its subsidiaries.
The other information required by this Item, with respect to security ownership of certain of our beneficial owners and management, is incorporated herein by reference to the discussion under the heading “Security Ownership of Certain Beneficial Owners and Management” in our Proxy Statement for our 2010 annual meeting of shareholders which is expected to be filed with the SEC no later than 120 days after the end of our 2009 fiscal year.
70
Table of Contents
ITEM 13. CERTAIN RELATIONSHIPS AND RELATED TRANSACTIONS, AND DIRECTOR INDEPENDENCE
The information required by this Item is incorporated herein by reference to the discussion under the headings “Certain Relationships and Related Transactions,” “Review, Approval or Ratification of Transactions with Related Persons” and “Director Independence” in our Proxy Statement for our 2010 annual meeting of shareholders which is expected to be filed with the SEC no later than 120 days after the end of our 2009 fiscal year.
ITEM 14. PRINCIPAL ACCOUNTANT FEES AND SERVICES
The information required by this Item is incorporated herein by reference to the discussion under the headings “Fees Billed by Independent Registered Public Accounting Firm” and “Pre-Approval of Audit and Non-Audit Services” in our Proxy Statement for our 2010 annual meeting of shareholders which is expected to be filed with the SEC no later than 120 days after the end of our 2009 fiscal year.
71
Table of Contents
ITEM 15. EXHIBITS AND FINANCIAL STATEMENT SCHEDULES.
| The following documents are filed as a part of this annual report on Form 10-K: |
| (1) | List of Financial Statements Filed as Part of this Annual Report on Form 10-K: |
| A list of our consolidated financial statements, notes to consolidated financial statements, and accompanying report of independent registered public accounting firm appears in the index to consolidated financial statements and financial statement schedules on page F-1, which is filed as part of this Annual Report on Form 10-K. |
| (2) | Financial Statement Schedules: |
| Schedule II — Valuation and Qualifying Accounts, for each of the fiscal years ended December 31, 2009, December 26, 2008 and December 28, 2007, which appears on page S-1, is filed as part of this Annual Report on Form 10-K. |
| All other schedules are omitted because they are not applicable, the amounts are not significant, or the required information is shown in our consolidated financial statements or the notes thereto. |
| (3) | Exhibits: |
| The following exhibits are filed herewith or are incorporated herein by reference to exhibits previously filed with the SEC: |
| Exhibit |
Exhibit Description | |
| 3.1 | Second Amended and Restated Charter of Pacer International, Inc. (Incorporated by reference to Exhibit 3.1 to the Company’s Quarterly Report on Form 10-Q for the Quarter ended June 28, 2002). (Commission File No. 0-49828). | |
| 3.2 | Second Amended and Restated Bylaws, as amended on March 11, 2009, of Pacer International, Inc. (Incorporated by reference to Exhibit 3.2 to the Company’s Current Report on Form 8-K dated March 11, 2009). (Commission File No. 0-49828). | |
| 10.1 | Amended and Restated Credit Agreement dated August 28, 2009 and made by Pacer International, Inc., each of its domestic subsidiaries, the lenders from time to time party thereto, the issuers of letters of credit from time to time party thereto, Bank of America, N.A., as Swing Line Lender and Administrative Agent, and Banc of America Securities, LLC, as Sole Lead Arranger and Sole Book Manager. (Incorporated by reference to Exhibit 10.1 to the Company’s Current Report on Form 8-K dated August 28, 2009). (Commission File No. 0-49828). | |
| 10.2 | Amended and Restated Security Agreement dated August 28, 2009 and made by Pacer International, Inc. and each of its domestic subsidiaries in favor of the Administrative Agent (for the benefit of the Secured Parties). (Incorporated by reference to Exhibit 10.2 to the Company’s Current Report on Form 8-K dated August 28, 2009). (Commission File No. 0-49828). | |
| 10.3 | Guaranty dated April 5, 2007 of the Guarantors named on the signature pages thereof in favor of the Administrative Agent, the lenders from time to time party thereto, the issuers of letters of credit from time to time party thereto and certain other persons. (Incorporated by reference to Exhibit 10.2 to the Company’s Current Report on Form 8-K dated April 9, 2007). (Commission File No. 0-49828). | |
72
Table of Contents
| Exhibit |
Exhibit Description | |
| 10.4 | Amendment to Guaranty dated August 28, 2009 of the Guarantors named on the signature pages thereof in favor of the Administrative Agent, the lenders from time to time party thereto, the issuers of letters of credit from time to time party thereto and certain other persons. (Incorporated by reference to Exhibit 10.3 to the Company’s Current Report on Form 8-K dated August 28, 2009). (Commission File No. 0-49828). | |
| 10.5 | Pledge Agreement, dated as of April 5, 2007, between each Pledgor named on the signature pages thereof and Bank of America, N.A., as Administrative Agent. (Incorporated by reference to Exhibit 10.3 to the Company’s Current Report on Form 8-K dated April 9, 2007). (Commission File No. 0-49828). | |
| 10.6 | Amendment to Pledge Agreement, dated as of August 28, 2009, between each Pledgor named in the signature pages thereof and Bank of America, N.A., as Administrative Agent. (Incorporated by reference to Exhibit 10.4 to the Company’s Current Report on Form 8-K dated August 28, 2009). (Commission File No. 0-49828). | |
| 10.7 | IT Supplemental Agreement, dated as of May 11, 1999, between APL Limited, APL Land Transport Services, Inc. and Coyote Acquisition LLC. (Incorporated by reference to Exhibit No. 10.10 to the Company’s Registration Statement on Form S-4 dated November 5, 1999). (Registration File No. 333-85041). | |
| 10.8 | Stacktrain Services Agreement, dated as of May 28, 1999, among American President Lines, Ltd., APL Co. Pte Ltd., APL Limited and Pacer International, Inc. (Incorporated by reference to Exhibit No. 4.8 to the Company’s Registration Statement on Form S-4 dated August 12, 1999). (Registration File No. 333-85041). | |
| 10.9 | Equipment Supply Agreement, dated as of May 28, 1999, among American President Lines, Ltd., APL Co. Pte Ltd., APL Limited and Pacer International, Inc. (Incorporated by reference to Exhibit No. 4.10 to the Company’s Registration Statement on Form S-4 dated August 12, 1999). (Registration File No. 333-85041). | |
| 10.10 | Primary Obligation and Guaranty Agreement, dated as of March 15, 1999, by Neptune Orient Lines Limited in favor of Coyote Acquisition LLC and APL Land Transport Services, Inc. (Incorporated by reference to Exhibit No. 4.11 to the Company’s Registration Statement on Form S-4 dated August 12, 1999). (Registration File No. 333-85041). | |
| 10.11 | Amended and Restated Intermodal Transportation Agreement No. 11111, dated as of May 13, 2002, between CSX Intermodal, Inc., Pacer International, Inc. d/b/a Pacer Stacktrain, APL Limited and APL Co. Pte Ltd. (Incorporated by reference to Exhibit No. 10.22 to the Company’s Registration Statement on Form S-1 dated June 11, 2002). (Registration File No. 333-53700). | |
| 10.12 | Domestic Incentive Agreement, dated as of May 4, 1999, between CSX Intermodal, Inc. and Pacer International, Inc. (Incorporated by reference to Exhibit No. 10.20 to the Company’s Registration Statement on Form S-4 dated October 7, 1999). (Registration File No. 333-85041). | |
| 10.13 | Amendment No. 1 to Domestic Incentive Agreement, dated January 1, 2001, between CSX Intermodal, Inc. and Pacer International, Inc. (Incorporated by reference to Exhibit 10.1 to the Company’s Quarterly Report on Form 10-Q for the Quarter ended April 6, 2001). (Registration File No. 333-53700). | |
73
Table of Contents
| Exhibit Number |
Exhibit Description | |
| 10.14 | Amended and Restated Rail Transportation Agreement, dated as of May 15, 2002, between Union Pacific Railroad Company, Pacer International, Inc. d/b/a Pacer Stacktrain, Inc., American President Lines, Ltd., and APL Co. Pte Ltd. (Incorporated by reference to Exhibit No. 10.22 to the Company’s Registration Statement on Form S-1 dated June 11, 2002). (Registration File No. 333-53700). | |
| 10.15 | Second Amendment dated November 3, 2009 to Amended and Restated Rail Transportation Agreement, dated as of May 15, 2002, between Union Pacific Railroad Company, Pacer International, Inc. d/b/a Pacer Stacktrain, Inc., American President Lines, Ltd., and APL Co. Pte Ltd. | |
| 10.16 | Equipment Use Agreement, dated May 28, 1999, between PAMC LLC and Pacer International, Inc. (Incorporated by reference to Exhibit No. 10.35 to the Company’s Registration Statement on Form S-1 dated January 12, 2001). (Registration File No. 333-53700). | |
| 10.17 | Rail Car Lease Agreement, dated September 25, 2001 by and between General Electric Railcar Services Corporation and the Company. (Incorporated by reference to Exhibit 10.39 to the Company’s Annual Report on Form 10-K for the fiscal year ended December 28, 2001). (Commission File No. 333-85041). | |
| 10.18 | Rail Car Lease Agreement, dated January 2001, between LaSalle National Leasing Corporation and the Company. (Incorporated by reference to Exhibit 10.40 to the Company’s Annual Report on Form 10-K for the fiscal year ended December 28, 2001). (Commission File No. 333-85041). | |
| 10.19 | Rail Car Lease Agreement, dated February 14, 2001, between Greenbrier Leasing Corporation and the Company. (Incorporated by reference to Exhibit 10.41 to the Company’s Annual Report on Form 10-K for the fiscal year ended December 28, 2001). (Commission File No. 333-85041). | |
| 10.20 | Rail Car Lease Agreement, dated September 1, 2000, among GATX Third Aircraft Corporation and the Company. (Incorporated by reference to Exhibit 10 to the Company’s Quarterly Report on Form 10-Q for the Quarter ended September 22, 2000). (Commission File No. 333-85041). | |
| 10.21 | Master Lease Agreement, dated April 16, 2003, between LaSalle National Leasing Corporation and Pacer International, Inc. for 53 foot steel containers. (Incorporated by reference to Exhibit 10.2 to the Company’s Quarterly Report on Form 10-Q for the fiscal quarter ended June 27, 2003). (Commission File No. 0-49828). | |
| 10.22 | Amendment dated June 30, 2004 to Master Lease Agreement, dated April 16, 2003, between LaSalle National Leasing Corporation and Pacer International, Inc. for 53 foot steel containers. (Incorporated by reference to Exhibit 10.1 to the Company’s Quarterly Report on Form 10-Q for the fiscal quarter ended September 17, 2004). (Commission File No. 0-49828). | |
| 10.23 | Master Equipment Lease Agreement, dated December 1, 2003, between Fleet Capital Corporation and Pacer International, Inc. for 53 foot steel containers. (Incorporated by reference to Exhibit 10.39 to the Company’s Annual Report on Form 10-K/A for the year ended December 26, 2003). (Commission File No. 0-49828). | |
74
Table of Contents
| Exhibit Number |
Exhibit Description | |
| 10.24 | Pacer International, Inc. 1999 Stock Option Plan, including forms of stock option agreements (Incorporated by reference to Exhibit 10.29 to the Company’s Registration Statement on Form S-1 dated January 12, 2001). Registration File No. 333-53700).+ | |
| 10.25 | Amendment No. 1 to the Pacer International, Inc. 1999 Stock Option Plan (Incorporated by reference to Exhibit 10.38 to the Company’s Registration Statement on Form S-1 dated May 15, 2002). (Registration File No. 333-53700).+ | |
| 10.26 | Amendment No. 2 to the Pacer International, Inc. 1999 Stock Option Plan (Incorporated by reference to Exhibit 10.50 to the Company’s Registration Statement on Form S-1 dated May 15, 2002). (Registration File No. 333-53700).+ | |
| 10.27 | Amendment to the Pacer International, Inc. 1999 Stock Option Plan and the Stock Option Agreements Evidencing Outstanding Options Granted Thereunder (Incorporated by reference to Exhibit 10.1 to the Company’s Current Report on Form 8-K dated August 8, 2006). (Commission File No. 0-49828).+ | |
| 10.28 | Pacer International, Inc. 2002 Stock Option Plan (Incorporated by reference to Exhibit 10.51 to the Company’s Registration Statement on Form S-1 dated May 15, 2002). (Registration File No. 333-53700).+ | |
| 10.29 | Amendment to the Stock Option Agreements Evidencing Outstanding Options Granted Under the Pacer International, Inc. 2002 Stock Option Plan (Incorporated by reference to Exhibit 10.1 to the Company’s Current Report on Form 8-K dated August 8, 2006) . (Commission File No. 0-49828).+ | |
| 10.30 | Pacer International, Inc. 2002 Stock Option Plan Form of Stock Option Agreement – Employee (Incorporated by reference to Exhibit 10.17 to the Company’s Annual Report on Form 10-K for the fiscal year ended December 28, 2007). (Commission File No. 0-49828).+ | |
| 10.31 | Pacer International, Inc. 2002 Stock Option Plan Form of Stock Option Agreement – Non-Employee Director (Incorporated by reference to Exhibit 10.18 to the Company’s Annual Report on Form 10-K for the fiscal year ended December 28, 2007). (Commission File No. 0-49828).+ | |
| 10.32 | Pacer International, Inc. 2006 Long-Term Incentive Plan (Incorporated by reference to Appendix A of the Company’s definitive proxy statement on Schedule 14A filed with the Securities and Exchange Commission on March 9, 2007). (Commission File No. 0-49828).+ | |
| 10.33 | Form of Restricted Stock Award Agreement pursuant to the Pacer International, Inc. 2006 Long-Term Incentive Plan (Incorporated by reference to Exhibit 10.1 to the Company’s Quarterly Report on Form 10-Q for the fiscal quarter ended April 6, 2007). (Commission File No. 0-49828).+ | |
| 10.34 | Form of Stock Option Award Agreement pursuant to the Pacer International, Inc. 2006 Long-Term Incentive Plan (Incorporated by reference to Exhibit 10.39 to the Company’s Annual Report on Form 10-K for the fiscal year ended December 28, 2007). (Commission File No. 0-49828).+ | |
75
Table of Contents
| Exhibit Number |
Exhibit Description | |
| 10.35 | Form of Supplemental Severance Benefit Letter from the Company to Daniel W. Avramovich, Michael F. Killea, Brian C. Kane, Adriene B. Bailey and James Ward (Incorporated by reference to Exhibit 10.41 to the Company’s Annual Report on Form 10-K for the fiscal year ended December 28, 2007). (Commission File No. 0-49828).+ | |
| 10.36 | Form of Amendment to Employment Agreement, dated as of December 31, 2008, signed with executive officers and other key personnel subject to Employment Agreements. (Incorporated by reference to Exhibit 10.39 to the Company’s Annual Report on Form 10-K for the fiscal year ended December 26, 2008). (Commission File No. 0-49828).+ | |
| 10.37 | Form of Letter Amending Employment Agreement dated April 21, 2009 from Pacer International, Inc. to Daniel W. Avramovich, Brian C. Kane, Adriene B. Bailey, Michael F. Killea and James Ward (Incorporated by reference to Exhibit 10.2 to the Company’s Quarterly Report on Form 10-Q for the fiscal period ended March 31, 2009). (Commission File No. 0-49828).+ | |
| 10.38 | Pacer International, Inc. 2010 Performance Bonus Plan.+ | |
| 10.39 | Employment Agreement dated as of September 15, 2003 between RF International, Ltd. and Alan E. Baer.+ | |
| 10.40 | Employment Agreement dated as of March 20, 2009 between Pacer International, Inc. and Adriene B. Bailey (Incorporated by reference to Exhibit 10.1 to the Company’s Quarterly Report on Form 10-Q for the fiscal period ended March 31, 2009). (Commission File No. 0-49828).+ | |
| 10.41 | Employment Agreement, dated August 22, 2001, between Pacer International, Inc. and Michael Killea. (Incorporated by reference to Exhibit 10.36 to the Company’s Annual Report on Form 10-K for the year ended December 28, 2001). (Commission File No. 333-85041).+ | |
| 10.42 | Amendment dated February 19, 2007 to Employment Agreement, dated August 22, 2001 between Pacer International, Inc. and Michael F. Killea (Incorporated by reference to Exhibit 10.36 to the Company’s Annual Report on Form 10-K for the fiscal year ended December 28, 2007). (Commission File No. 0-49828).+ | |
| 10.43 | Amendment dated February 16, 2009 to Employment Agreement dated as of August 22, 2001 as amended by amendments dated February 19, 2007 and December 31, 2008 between Pacer International, Inc. and Michael F. Killea. (Incorporated by reference to Exhibit 10.44 to the Company’s Annual Report on Form 10-K for the fiscal year ended December 26, 2008). (Commission File No. 0-49828).+ | |
| 10.44 | Employment Agreement, dated June 30, 2008, between Pacer International, Inc. and Daniel W. Avramovich. (Incorporated by reference to Exhibit 10.1 to the Company’s Quarterly Report on Form 10-Q for the quarter ended June 27, 2008).+ | |
| 10.45 | Employment Agreement, dated May 1, 2007, between Pacer International, Inc. and James Ward (Incorporated by reference to Exhibit 10.2 to the Company’s Quarterly Report on Form 10-Q dated April 6, 2007). (Commission File No. 0-49828).+ | |
76
Table of Contents
| Exhibit Number |
Exhibit Description | |
| 10.46 | Employment Agreement, dated March 1, 2008, between Pacer International, Inc. and Marc L. Jensen. (Incorporated by reference to Exhibit 10.40 to the Company’s Annual Report on Form 10-K for the fiscal year ended December 26, 2008). (Commission File No. 0-49828).+ | |
| 10.47 | Amended and Restated Employment Agreement dated as of February 16, 2009 between Pacer International, Inc. and Brian C. Kane. (Incorporated by reference to Exhibit 10.42 to the Company’s Annual Report on Form 10-K for the fiscal year ended December 26, 2008). (Commission File No. 0-49828).+ | |
| 10.48 | Employment Agreement dated January 1, 2010 between Pacer International, Inc. and Michael F. Gordon.+ | |
| 10.49 | Employment Agreement dated December 14, 2007 between Pacer Stacktrain, Inc. and Peter K. Baumhefner.+ | |
| 10.50 | Employment Agreement dated January 1, 2003 between Pacer International, Inc. d/b/a Pacer Stacktrain and Peter A. Mettra.+ | |
| 10.51 | Employment Agreement dated August 25, 2008 between Pacer Global Logistics, Inc. (now known as Pacer Transportation Solutions, Inc.) and F. Franklin Sutherland.+ | |
| 10.52 | Settlement Agreement dated September 30, 2009 between Pacer Transportation Solutions, Inc. and Jeffrey R. Brashares.+ | |
| 10.53 | Separation Agreement and Release of Claims dated December 10, 2009 between Pacer International, Inc. and Michael E. Uremovich.+ | |
| 14 | Code of Ethics | |
| 21 | Subsidiaries of the Pacer International, Inc. | |
| 23 | Consent of Independent Registered Public Accounting Firm | |
| 31.1 | Certification of Daniel W. Avramovich pursuant to Rule 13a-14(a), as adopted pursuant to Section 302 of the Sarbanes-Oxley Act of 2002 | |
| 31.2 | Certification of Brian C. Kane pursuant to Rule 13a-14(a), as adopted pursuant to Section 302 of the Sarbanes-Oxley Act of 2002 | |
| 32 | Certification of Daniel W. Avramovich and Brian C. Kane pursuant to 18 U.S.C. Section 1350, as adopted pursuant to Section 906 of the Sarbanes-Oxley Act of 2002* | |
* Furnished herewith, but not deemed “filed” for purposes of Section 18 of the Securities Exchange Act of 1934, as amended, or otherwise subject to liability under that section. Such certification will not be deemed to be incorporated by reference into any filing under the Securities Act or the Exchange Act, except to the extent that the Company explicitly incorporate it by reference.
+ Management contract or compensatory plan or arrangement.
77
Table of Contents
Pursuant to the requirements of Section 13 or 15(d) of the Securities Exchange Act of 1934, the Registrant has duly caused this report to be signed on its behalf by the undersigned, thereunto duly authorized.
| PACER INTERNATIONAL, INC. | ||||||
| Date: February 23, 2010 |
By: | /s/ Brian C. Kane | ||||
| Brian C. Kane Executive Vice President and Chief Financial Officer (Principal Financial Officer) | ||||||
Pursuant to the requirements of the Securities Exchange Act of 1934, this report has been signed below by the following persons on behalf of the Registrant in the capacities and on the dates indicated.
| Date: February 23, 2010 | By: | /s/ Daniel W. Avramovich | ||||||
| Daniel W. Avramovich Chairman, Chief Executive Officer and Director (Principal Executive Officer) | ||||||||
| Date: February 23, 2010 | By: | /s/ Marc L. Jensen | ||||||
| Marc L. Jensen Vice President and Controller (Principal Accounting Officer) | ||||||||
| Date: February 23, 2010 | By: | /s/ Dennis A. Chantland | ||||||
| Dennis A. Chantland Director | ||||||||
| Date: February 23, 2010 | By: | /s/ J. Douglass Coates | ||||||
| J. Douglass Coates Director | ||||||||
| Date: February 23, 2010 | By: | /s/ P. Michael Giftos | ||||||
| P. Michael Giftos Director | ||||||||
| Date: February 23, 2010 | By: | /s/ Robert J. Grassi | ||||||
| Robert J. Grassi Director | ||||||||
| Date: February 23, 2010 | By: | /s/ Robert S. Rennard | ||||||
| Robert S. Rennard Director | ||||||||
| Date: February 23, 2010 | By: | /s/ Robert F. Starzel | ||||||
| Robert F. Starzel Director | ||||||||
78
Table of Contents
PACER INTERNATIONAL, INC. AND SUBSIDIARIES
INDEX TO CONSOLIDATED FINANCIAL STATEMENTS
AND FINANCIAL STATEMENT SCHEDULES
| Page | ||
| F-2 | ||
| Consolidated Balance Sheets as of December 31, 2009 and December 26, 2008 |
F-3 | |
| F-4 | ||
| F-5 | ||
| F-6 | ||
| F-7 | ||
| S-1 | ||
All other schedules are omitted because they are not applicable or because the required information is shown in the consolidated financial statements or the notes thereto. Columns omitted from schedules filed have been omitted because the information is not applicable.
F-1
Table of Contents
Report of Independent Registered Public Accounting Firm
To Board of Directors and Stockholders of Pacer International, Inc.:
In our opinion, the consolidated financial statements listed in the accompanying index present fairly, in all material respects, the financial position of Pacer International, Inc. and its subsidiaries at December 31, 2009 and December 26, 2008, and the results of their operations and their cash flows for each of the three years in the period ended December 31, 2009 in conformity with accounting principles generally accepted in the United States of America. In addition, in our opinion, the financial statement schedule listed in the accompanying index presents fairly, in all material respects, the information set forth therein when read in conjunction with the related consolidated financial statements. Also in our opinion, the Company maintained, in all material respects, effective internal control over financial reporting as of December 31, 2009, based on criteria established in Internal Control—Integrated Framework issued by the Committee of Sponsoring Organizations of the Treadway Commission (COSO). The Company’s management is responsible for these financial statements and financial statement schedule, for maintaining effective internal control over financial reporting and for its assessment of the effectiveness of internal control over financial reporting, included in Management’s Report on Internal Control over Financial Reporting appearing under Item 9A. Our responsibility is to express opinions on these financial statements, on the financial statement schedule, and on the Company’s internal control over financial reporting based on our integrated audits. We conducted our audits in accordance with the standards of the Public Company Accounting Oversight Board (United States). Those standards require that we plan and perform the audits to obtain reasonable assurance about whether the financial statements are free of material misstatement and whether effective internal control over financial reporting was maintained in all material respects. Our audits of the financial statements included examining, on a test basis, evidence supporting the amounts and disclosures in the financial statements, assessing the accounting principles used and significant estimates made by management, and evaluating the overall financial statement presentation. Our audit of internal control over financial reporting included obtaining an understanding of internal control over financial reporting, assessing the risk that a material weakness exists, and testing and evaluating the design and operating effectiveness of internal control based on the assessed risk. Our audits also included performing such other procedures as we considered necessary in the circumstances. We believe that our audits provide a reasonable basis for our opinions.
A company’s internal control over financial reporting is a process designed to provide reasonable assurance regarding the reliability of financial reporting and the preparation of financial statements for external purposes in accordance with generally accepted accounting principles. A company’s internal control over financial reporting includes those policies and procedures that (i) pertain to the maintenance of records that, in reasonable detail, accurately and fairly reflect the transactions and dispositions of the assets of the company; (ii) provide reasonable assurance that transactions are recorded as necessary to permit preparation of financial statements in accordance with generally accepted accounting principles, and that receipts and expenditures of the company are being made only in accordance with authorizations of management and directors of the company; and (iii) provide reasonable assurance regarding prevention or timely detection of unauthorized acquisition, use, or disposition of the company’s assets that could have a material effect on the financial statements.
Because of its inherent limitations, internal control over financial reporting may not prevent or detect misstatements. Also, projections of any evaluation of effectiveness to future periods are subject to the risk that controls may become inadequate because of changes in conditions, or that the degree of compliance with the policies or procedures may deteriorate.
/s/ PricewaterhouseCoopers LLP
San Francisco, CA
February 19, 2010
F-2
Table of Contents
PACER INTERNATIONAL, INC. AND SUBSIDIARIES
CONSOLIDATED BALANCE SHEETS
| December 31, 2009 |
December 26, 2008 |
|||||||
| (in millions) | (as adjusted) 1/ | |||||||
| ASSETS | ||||||||
| Current assets |
||||||||
| Cash and cash equivalents |
$ | 2.8 | $ | 5.0 | ||||
| Accounts receivable, net of allowances of $3.8 million and $4.9 million, respectively |
152.3 | 183.6 | ||||||
| Prepaid expenses and other |
27.2 | 28.0 | ||||||
| Deferred income taxes |
1.0 | 3.1 | ||||||
| Total current assets |
183.3 | 219.7 | ||||||
| Property and equipment |
||||||||
| Property and equipment at cost |
107.7 | 127.2 | ||||||
| Accumulated depreciation |
(64.5 | ) | (65.6 | ) | ||||
| Property and equipment, net |
43.2 | 61.6 | ||||||
| Other assets |
||||||||
| Goodwill |
- | 200.4 | ||||||
| Deferred income taxes |
35.1 | - | ||||||
| Other assets |
14.3 | 12.9 | ||||||
| Total other assets |
49.4 | 213.3 | ||||||
| Total assets |
$ | 275.9 | $ | 494.6 | ||||
| LIABILITIES AND STOCKHOLDERS’ EQUITY | ||||||||
| Current liabilities |
||||||||
| Current maturities of debt and capital leases |
$ | 23.3 | $ | 0.3 | ||||
| Book overdraft |
4.5 | 14.7 | ||||||
| Accounts payable and other accrued liabilities |
144.7 | 158.6 | ||||||
| Total current liabilities |
172.5 | 173.6 | ||||||
| Long-term liabilities |
||||||||
| Long-term debt and capital leases |
- | 44.3 | ||||||
| Deferred income taxes |
- | 5.4 | ||||||
| Other |
5.9 | 0.9 | ||||||
| Total long-term liabilities |
5.9 | 50.6 | ||||||
| Total liabilities |
178.4 | 224.2 | ||||||
| Commitments and contingencies (Notes 9, 11 & 13) |
||||||||
| Stockholders’ equity |
||||||||
| Preferred stock, par value $0.01 per share; 50,000,000 shares authorized; none issued and outstanding |
- | - | ||||||
| Common stock, par value $0.01 per share; 150,000,000 shares authorized; 34,904,051 and 34,940,620 issued and outstanding |
0.4 | 0.4 | ||||||
| Additional paid-in capital |
301.5 | 300.1 | ||||||
| Retained earnings (accumulated deficit) |
(204.3 | ) | (30.2 | ) | ||||
| Accumulated other comprehensive income (loss) |
(0.1 | ) | 0.1 | |||||
| Total stockholders’ equity |
97.5 | 270.4 | ||||||
| Total liabilities and stockholders’ equity |
$ | 275.9 | $ | 494.6 | ||||
1/ Prior period amounts have been adjusted due to a change in revenue recognition policies. See the notes to consolidated financial statements for further information.
The accompanying notes are an integral part of the consolidated financial statements.
F-3
Table of Contents
PACER INTERNATIONAL, INC. AND SUBSIDIARIES
CONSOLIDATED STATEMENTS OF OPERATIONS
| Fiscal Year Ended | ||||||||||||
| Dec. 31, 2009 | Dec. 26, 2008 | Dec. 28, 2007 | ||||||||||
| (in millions, except share and per share data) | (as adjusted) 1/ | (as adjusted) 1/ | ||||||||||
| Revenues |
$ | 1,574.2 | $ | 2,087.5 | $ | 1,969.8 | ||||||
| Operating expenses: |
||||||||||||
| Cost of purchased transportation and services |
1,291.3 | 1,659.3 | 1,538.0 | |||||||||
| Direct operating expenses (excluding depreciation) |
124.5 | 132.2 | 130.5 | |||||||||
| Selling, general and administrative expenses |
186.0 | 199.9 | 200.5 | |||||||||
| Goodwill impairment charge (Note 1) |
200.4 | 87.9 | - | |||||||||
| Other income (Note 5) |
(18.9 | ) | - | - | ||||||||
| Depreciation and amortization |
6.8 | 6.2 | 6.2 | |||||||||
| Total operating expenses |
1,790.1 | 2,085.5 | 1,875.2 | |||||||||
| Income (loss) from operations |
(215.9 | ) | 2.0 | 94.6 | ||||||||
| Interest expense |
(4.6 | ) | (2.5 | ) | (5.5 | ) | ||||||
| Interest income |
0.1 | 0.1 | 1.8 | |||||||||
| Loss on extinguishment of debt |
- | - | (1.8 | ) | ||||||||
| Income (loss) before income taxes |
(220.4 | ) | (0.4 | ) | 89.1 | |||||||
| Income tax (benefit) |
(46.3 | ) | 16.0 | 34.7 | ||||||||
| Net income (loss) |
$ | (174.1 | ) | $ | (16.4 | ) | $ | 54.4 | ||||
| Earnings (loss) per share (Note 15): |
||||||||||||
| Basic: |
||||||||||||
| Earnings (loss) per share |
$ | (5.01 | ) | $ | (0.47 | ) | $ | 1.52 | ||||
| Weighted average shares outstanding |
34,767,275 | 34,616,598 | 35,587,755 | |||||||||
| Diluted: |
||||||||||||
| Earnings (loss) per share |
$ | (5.01 | ) | $ | (0.47 | ) | $ | 1.51 | ||||
| Weighted average shares outstanding |
34,767,275 | 34,616,598 | 35,911,246 | |||||||||
1/ Prior period amounts have been adjusted due to a change in revenue recognition policies and the adoption of FASB Accounting Standards Codification Topic 260-10-45 “Earnings Per Share.” See the notes to consolidated financial statements for further information.
The accompanying notes are an integral part of the consolidated financial statements.
F-4
Table of Contents
PACER INTERNATIONAL, INC. AND SUBSIDIARIES
CONSOLIDATED STATEMENTS OF STOCKHOLDERS’ EQUITY
| Preferred Stock | Common Stock | Additional Paid-in- Capital |
Unearned Comp- ensation |
Retained Earnings (Accumulated Deficit) |
Accumulated Other Compreh- ensive Income (Loss) |
Total Stockholders’ Equity |
||||||||||||||||||||||||
| No. of Shares |
Amount | No. of Shares |
Amount | |||||||||||||||||||||||||||
| (in millions, except share amounts) | (as adjusted) 1/ | |||||||||||||||||||||||||||||
| Balance December 29, 2006 as reported |
- | $ | - | 37,145,047 | $ | 0.4 | $ | 289.1 | $ | - | $ | 47.7 | $ | (0.1 | ) | $ | 337.1 | |||||||||||||
| Cumulative impact of change in revenue recognition 1/ |
- | - | - | - | - | - | (0.6 | ) | - | (0.6 | ) | |||||||||||||||||||
| Balance December 30, 2006 as adjusted 1/ |
- | $ | - | 37,145,047 | $ | 0.4 | $ | 289.1 | $ | - | $ | 47.1 | $ | (0.1 | ) | $ | 336.5 | |||||||||||||
| Net income |
- | - | - | - | - | - | 54.4 | - | 54.4 | |||||||||||||||||||||
| Other comprehensive income |
- | - | - | - | - | - | - | - | - | |||||||||||||||||||||
| Total comprehensive income |
- | - | - | - | - | - | 54.4 | - | 54.4 | |||||||||||||||||||||
| Common stock dividends; $0.60 per share |
- | - | - | - | - | - | (21.2 | ) | - | (21.2 | ) | |||||||||||||||||||
| Stock based compensation |
- | - | - | - | 2.9 | - | - | - | 2.9 | |||||||||||||||||||||
| Tax benefit from exercise of options |
- | - | - | - | 0.7 | - | - | - | 0.7 | |||||||||||||||||||||
| Cumulative effect of adoption of FIN 48 (Note 1) |
- | (0.4 | ) | - | (0.4 | ) | ||||||||||||||||||||||||
| Issuance of restricted stock |
251,250 | - | - | - | - | |||||||||||||||||||||||||
| Repurchase and retirement of Pacer common stock |
- | - | (2,938,635 | ) | - | - | - | (72.5 | ) | - | (72.5 | ) | ||||||||||||||||||
| Issuance of common stock for exercise of options . |
- | - | 169,132 | - | 1.8 | - | - | - | 1.8 | |||||||||||||||||||||
| Balance December 28, 2007 |
- | $ | - | 34,626,794 | $ | 0.4 | $ | 294.5 | $ | - | $ | 7.4 | $ | (0.1 | ) | $ | 302.2 | |||||||||||||
| Net loss |
- | - | - | - | - | - | (16.4 | ) | - | (16.4 | ) | |||||||||||||||||||
| Other comprehensive income |
- | - | - | - | - | - | - | 0.2 | 0.2 | |||||||||||||||||||||
| Total comprehensive income (loss) |
- | - | - | - | - | - | (16.4 | ) | 0.2 | (16.2 | ) | |||||||||||||||||||
| Common stock dividends; $0.60 per share |
- | - | - | - | - | - | (20.9 | ) | - | (20.9 | ) | |||||||||||||||||||
| Stock based compensation |
- | - | - | - | 1.9 | - | - | - | 1.9 | |||||||||||||||||||||
| Tax benefit from stock based compensation . |
- | - | - | - | 0.7 | - | - | - | 0.7 | |||||||||||||||||||||
| Issuance of restricted stock |
- | - | 58,000 | - | - | - | - | - | - | |||||||||||||||||||||
| Repurchase and retirement of Pacer common stock |
- | - | (19,039 | ) | - | - | - | (0.3 | ) | - | (0.3 | ) | ||||||||||||||||||
| Issuance of common stock for exercise of options |
- | - | 274,865 | - | 3.0 | - | - | - | 3.0 | |||||||||||||||||||||
| Balance December 26, 2008 |
- | $ | - | 34,940,620 | $ | 0.4 | $ | 300.1 | $ | - | $ | (30.2 | ) | $ | 0.1 | $ | 270.4 | |||||||||||||
| Net loss |
- | - | - | - | - | - | (174.1 | ) | - | (174.1 | ) | |||||||||||||||||||
| Other comprehensive loss |
- | - | - | - | - | - | - | (0.2 | ) | (0.2 | ) | |||||||||||||||||||
| Total comprehensive loss |
- | - | - | - | - | - | (174.1 | ) | (0.2 | ) | (174.3 | ) | ||||||||||||||||||
| Common stock dividends; $0.60 per share |
- | - | - | - | - | - | - | - | - | |||||||||||||||||||||
| Stock based compensation |
- | - | - | - | 2.1 | - | - | - | 2.1 | |||||||||||||||||||||
| Tax impact of vesting of restricted stock |
- | - | - | - | (0.6 | ) | - | - | - | (0.6 | ) | |||||||||||||||||||
| Issuance (forfeiture) of restricted stock |
- | - | (15,000 | ) | - | - | - | - | - | - | ||||||||||||||||||||
| Repurchase and retirement of Pacer common stock |
- | - | (21,569 | ) | - | (0.1 | ) | - | - | (0.1 | ) | |||||||||||||||||||
| Issuance of common stock for exercise of options |
- | - | - | - | - | - | - | - | - | |||||||||||||||||||||
| Balance December 31, 2009 |
- | $ | - | 34,904,051 | $ | 0.4 | $ | 301.5 | $ | - | $ | (204.3 | ) | $ | (0.1 | ) | $ | 97.5 | ||||||||||||
1/ Prior period amounts have been adjusted due to a change in revenue recognition policies. See the notes to consolidated financial statements for further information.
The accompanying notes are an integral part of the consolidated financial statements.
F-5
Table of Contents
PACER INTERNATIONAL, INC. AND SUBSIDIARIES
CONSOLIDATED STATEMENTS OF CASH FLOWS
| Fiscal Year Ended | ||||||||||||
| Dec. 31, 2009 | Dec. 26, 2008 | Dec. 28, 2007 | ||||||||||
| (in millions) | (as adjusted) 1/ | (as adjusted) 1/ | ||||||||||
| Cash flows from operating activities |
||||||||||||
| Net income (loss) |
$ | (174.1 | ) | $ | (16.4 | ) | $ | 54.4 | ||||
| Adjustments to reconcile net income (loss) to net cash provided by operating activities: |
||||||||||||
| Depreciation and amortization |
6.8 | 6.2 | 6.2 | |||||||||
| Gain on sale of property and equipment |
(1.9 | ) | (1.5 | ) | (0.9 | ) | ||||||
| Deferred taxes |
(38.4 | ) | (1.8 | ) | 8.0 | |||||||
| Loss on extinguishment of debt |
- | - | 1.8 | |||||||||
| Goodwill impairment charge |
200.4 | 87.9 | - | |||||||||
| Stock based compensation expense |
2.1 | 1.9 | 2.9 | |||||||||
| Excess tax benefit from exercise of stock options |
- | (0.2 | ) | (0.2 | ) | |||||||
| Change in operating assets and liabilities |
||||||||||||
| Accounts receivable, net |
31.2 | 21.7 | 5.1 | |||||||||
| Prepaid expenses and other |
- | (12.9 | ) | 0.4 | ||||||||
| Accounts payable and other accrued liabilities |
(20.9 | ) | (24.7 | ) | 32.6 | |||||||
| Other long-term assets |
2.3 | 0.1 | 0.4 | |||||||||
| Other long-term liabilities |
5.0 | (0.7 | ) | (2.7 | ) | |||||||
| Net cash provided by operating activities |
12.5 | 59.6 | 108.0 | |||||||||
| Cash flows used in investing activities |
||||||||||||
| Capital expenditures |
(9.2 | ) | (24.8 | ) | (14.0 | ) | ||||||
| Proceeds from software license amendment |
22.5 | - | - | |||||||||
| Proceeds from sales of property, equipment and other assets |
2.4 | 1.8 | 0.9 | |||||||||
| Net cash provided by (used in) investing activities |
15.7 | (23.0 | ) | (13.1 | ) | |||||||
| Cash flows used in financing activities |
||||||||||||
| Net borrowings (repayments) under revolving line of credit agreement, net of debt issuance costs |
(23.4 | ) | (20.0 | ) | 64.0 | |||||||
| Debt issuance costs paid to third parties |
(1.4 | ) | - | (0.8 | ) | |||||||
| Proceeds from exercise of stock options |
- | 3.0 | 1.8 | |||||||||
| Excess tax benefit from exercise of stock options |
- | 0.2 | 0.2 | |||||||||
| Dividends paid to shareholders |
(5.2 | ) | (20.8 | ) | (21.6 | ) | ||||||
| Repurchase and retirement of Pacer common stock |
(0.1 | ) | (0.3 | ) | (72.5 | ) | ||||||
| Debt and capital lease obligation repayment |
(0.3 | ) | (0.2 | ) | (59.0 | ) | ||||||
| Net cash used in financing activities |
(30.4 | ) | (38.1 | ) | (87.9 | ) | ||||||
| Effect of exchange rate changes on cash |
- | (0.2 | ) | (0.3 | ) | |||||||
| Net (decrease) increase in cash and cash equivalents |
(2.2 | ) | (1.7 | ) | 6.7 | |||||||
| Cash and cash equivalents at beginning of year |
5.0 | 6.7 | - | |||||||||
| Cash and cash equivalents at end of year |
$ | 2.8 | $ | 5.0 | $ | 6.7 | ||||||
1/ Prior period amounts have been adjusted due to a change in revenue recognition policies. See the notes to consolidated financial statements for further information.
The accompanying notes are an integral part of the consolidated financial statements.
F-6
Table of Contents
PACER INTERNATIONAL, INC. AND SUBSIDIARIES
NOTES TO CONSOLIDATED FINANCIAL STATEMENTS
NOTE 1. BASIS OF PRESENTATION AND SIGNIFICANT ACCOUNTING POLICIES
Pacer International, Inc. (referred to in these notes to financial statements as “Pacer,” the “Company,” “we,” “us,” or “our”) is an asset-light North American freight transportation and third party logistics provider that facilitates the movement of freight from origin to destination through its intermodal and logistics segments. The intermodal segment offers intermodal transportation through Pacer Stacktrain (cost-efficient, two-tiered ramp to ramp rail transportation for containerized shipments), Pacer Cartage (local trucking) and Pacer Transportation Solutions (door-to-door service combining rail and truck transportation). The logistics segment provides highway brokerage, truck services (through August 17, 2009, see below), warehousing and distribution, international ocean shipping and freight forwarding, and supply chain management services.
Before 2009, the Company’s fiscal year was the 52- or 53-week annual accounting period ending on the last Friday in December. Following completion of the implementation of the finance and accounting modules of SAP America, Inc. (“SAP”) software at the Company’s Stacktrain unit during the first quarter 2009, the Company’s fiscal year was changed to a calendar year basis ending on December 31 of each year. Amounts for the transition period from December 27, 2008 to December 31, 2008 are included in the Company’s first quarter 2009 results. Accordingly, Stacktrain data included in the intermodal segment financial comparisons in this report reflect 370 days for the year ended December 31, 2009 compared to 363 days for the year ended December 26, 2008.
The Company has operated as an independent, stand-alone company since its recapitalization in May 1999. From 1984 until the recapitalization, the intermodal segment’s Stacktrain business was conducted by various entities owned directly or indirectly by APL Limited.
As of May 28, 1999, APL Land Transport Services, Inc. (“APLLTS”) was recapitalized through the purchase of shares of its common stock from APL Limited by affiliates of Apollo Management, L.P. and two other investors and the redemption of a portion of the remaining shares of common stock held by APL Limited. After the recapitalization, APLLTS formed a transitory subsidiary that was merged with and into Pacer Logistics, Inc., making Pacer Logistics a wholly-owned subsidiary of APLLTS. In connection with these transactions, APLLTS was renamed Pacer International, Inc. Pacer Logistics merged into the Company in May 2003.
As part of the recapitalization, the assets and liabilities of the Company remained at their historical basis for financial reporting purposes; for income tax purposes, the transaction has been treated as a taxable transaction such that the consolidated financial statements reflect a “step-up” in tax basis resulting in the establishment of a deferred tax asset.
Principles of Consolidation
The consolidated financial statements include the accounts of the Company and all entities that the Company controls. All significant intercompany transactions and balances have been eliminated in consolidation.
Change in Accounting Policies
In January 2009, the Stacktrain business unit implemented the general ledger module of the SAP software which had been implemented by all other Pacer business units during 2008. With the SAP implementation and change from a fiscal year to a calendar year basis, the Company changed the Stacktrain method of revenue and cost recognition to the completed service method in order to conform to other Pacer business units. Prior to 2009, Pacer’s Stacktrain business unit recognized revenue on a percentage of completion basis with expenses recognized as incurred. Pacer believes it is preferable to change the method of revenue and cost recognition for the Stacktrain business unit from percentage of completion to completed service as the satisfaction of the performance obligation is more reliably measured at the completion of the shipment. The revenue recognition change was applied retrospectively for all periods presented. Please see Note 2 for detailed information.
F-7
Table of Contents
PACER INTERNATIONAL, INC. AND SUBSIDIARIES
NOTES TO CONSOLIDATED FINANCIAL STATEMENTS – (Continued)
Earnings per share amounts for the period ended December 26, 2008, and all prior periods, have been retrospectively revised in accordance with the Financial Accounting Standards Board (“FASB”) Accounting Standards Codification (“ASC”) Topic 260-10-45, “Earnings Per Share.” Under Topic 260, Pacer must consider restricted stock grants as another class of stock and use the two class method in determining earnings per share. The retrospective application was not material.
Use of Estimates
The preparation of financial statements in conformity with accounting principles generally accepted in the United States of America requires management to make estimates and assumptions that affect the reported amounts of assets and liabilities and disclosure of contingent assets and liabilities at the date of the financial statements and the reported amounts of revenues and expenses during the reporting period.
Significant estimates include recognition of revenue, costs of purchased transportation and services, allowance for doubtful accounts, valuation of deferred income taxes and goodwill. Actual results could differ from those estimates.
Cash and Cash Equivalents
Cash and cash equivalents include highly liquid investments with an original maturity of three months or less.
Accounts Receivable
Accounts receivable are carried at original invoice amount less allowance made for doubtful accounts. Estimates are used when determining this allowance based on the Company’s historical collection experience, current trends, credit policy and a percentage of the accounts receivable by aging category. At December 31, 2009 and December 26, 2008, accounts receivable included unbilled amounts of $16.1 million and $14.7 million, respectively.
Property and Equipment
Property and equipment are recorded at cost. The Company capitalizes certain costs of internally developed software. Capitalized costs include purchased materials and services, and payroll and payroll related costs. For assets financed under capital leases, the present value of the future minimum lease payments is recorded at the date of acquisition as property and equipment, with a corresponding amount recorded as a capital lease obligation. Depreciation and amortization are provided on a straight-line basis over the estimated useful lives of the assets as follows:
| Classification |
Estimated Useful Life | |
| Rail cars |
28 Years | |
| Containers and chassis |
15 Years | |
| Autos/trucks and revenue equipment |
5 to 7 Years | |
| Leasehold improvements |
Shorter of term of lease or life of improvement | |
| Other (including computer hardware and software) |
3 to 7 Years | |
When assets are sold, the applicable costs and accumulated depreciation are removed from the accounts, and any gain or loss is included in income. Expenditures, including those on leased assets, which extend an asset’s useful life or increase its utility, are capitalized and amortized. Expenditures for maintenance and repairs are expensed as incurred.
F-8
Table of Contents
PACER INTERNATIONAL, INC. AND SUBSIDIARIES
NOTES TO CONSOLIDATED FINANCIAL STATEMENTS – (Continued)
Deferred Financing Costs
The deferred financing costs included in other assets relate to the cost incurred in the placement of the Company’s debt. The balances of $4.0 million and $0.6 million at December 31, 2009 and December 26, 2008, respectively, relate to those costs, amortized over the remaining life of the revolving credit facility entered into in August 2009. Due to the reduction in borrowing capacity that occurred in 2009 as discussed in Note 3, a total of $0.3 million of previously deferred loan fees were written-off to interest expense in 2009.
Goodwill
Goodwill represents the excess of cost over the estimated fair value of the net tangible and intangible assets acquired. The Company evaluates the carrying value of goodwill and recoverability at least annually and otherwise should events occur or circumstances change that would more likely than not reduce the fair value of a reporting unit below its carrying amount. Determination of impairment requires comparison of the reporting unit’s fair value with the unit’s carrying amount, including goodwill. If this comparison indicates that the fair value is less than the carrying value, then the implied fair value of the reporting unit’s goodwill is compared with the carrying amount of the reporting unit’s goodwill to determine the impairment loss to be charged to operations. The fair value of each of our reporting units is determined based upon the average value using an income approach based on the present value of estimated future cash flows of the reporting unit, and a market approach based on market price data of stocks of corporations engaged in similar businesses.
The Company complies with FASB ASC Topic 350 “Intangibles – Goodwill and Other” and Topic 820 “Fair Value Measurements and Disclosures” to evaluate goodwill. As a result of the year-end 2008 goodwill impairment testing, in 2008 the Company recorded a non-cash goodwill impairment charge of $87.9 million in our logistics segment ($73.3 million net of tax, or $2.11 per share) and concluded that no impairment of the goodwill assigned to the Company’s intermodal reporting unit had occurred. The goodwill impairment charge in the logistics reporting unit reflected a combination of factors, including the economic downturn that the U.S. and global economy was then experiencing, the steep, sustained decline in the Company’s stock price and resulting market capitalization that began in the second half of 2008 and the operating results of the logistics reporting unit during 2008. The carrying amount of goodwill at December 26, 2008, after the impairment charge, assigned to the intermodal and logistics reporting units was $169.0 million and $31.4 million, respectively.
Based on a combination of factors, including the continued, sustained decline in the Company’s stock price and market capitalization during the first quarter of 2009, the operating results of the Company’s intermodal and logistics reporting units during the first quarter of 2009, and the effect that the economic recession was having on the operating results of both of the Company’s reporting units during the first quarter of 2009, management concluded that a goodwill impairment triggering event had occurred in the first quarter of 2009 for purposes of ASC Topic 350, and, accordingly, performed a testing of the carrying values of goodwill for both the intermodal and logistics reporting units as of March 31, 2009. After this testing, management concluded that the carrying value of each of the intermodal and logistics reporting units (including goodwill) exceeded the fair value of each respective reporting unit. Accordingly, the Company undertook the second step of the goodwill impairment analysis and determined that the implied fair value of each reporting unit’s goodwill was $0. As a result, management recorded a non-cash goodwill impairment charge of $200.4 million in the 2009 first quarter ($169.0 million of the pre-tax charge was recorded in the intermodal reporting unit and $31.4 million in the logistics reporting unit). The charge was finalized in the second quarter of 2009 with no change to the reported amounts.
ASC Topic 820 defines fair value as the exchange price that would be received for an asset or paid to transfer a liability in the principal or most advantageous market for the asset or liability in an orderly transaction between market participants at the measurement date. It established a three-level fair value
F-9
Table of Contents
PACER INTERNATIONAL, INC. AND SUBSIDIARIES
NOTES TO CONSOLIDATED FINANCIAL STATEMENTS – (Continued)
hierarchy that prioritizes the inputs used to measure fair value. This hierarchy requires entities to maximize the use of observable inputs and minimize the use of unobservable inputs. The three levels of inputs used to measure fair value are as follows:
| · | Level 1 – Quoted prices in active markets for identical assets or liabilities. |
| · | Level 2 – Observable inputs other than quoted prices included in Level 1, such as quoted prices for similar assets and liabilities in active markets; quoted prices for identical or similar assets and liabilities in markets that are not active; or other inputs that are observable or can be corroborated by observable market data. |
| · | Level 3 – Unobservable inputs that are supported by little or no market activity and that are significant to the fair value of the assets or liabilities. This includes certain pricing models, discounted cash flow methodologies and similar techniques that use significant unobservable inputs. |
The Company is required to record certain assets and liabilities at fair value on a nonrecurring basis as required by accounting principles generally accepted in the United States. Generally, assets are recorded at fair value on a nonrecurring basis as a result of impairment charges. In connection with the first quarter 2009 triggering event, the Company performed a fair value measurement of its goodwill as summarized below (in millions):
| Three Months Ended March 31, 2009 | |||||||||||||||
| Impairment Charge 1/ |
New Cost Basis |
Level Used to Determine New Cost Basis | |||||||||||||
| Level 1 | Level 2 | Level 3 | |||||||||||||
| Goodwill: |
|||||||||||||||
| Intermodal Segment |
$ | 169.0 | $ | - | $ | - | $ | - | $ | - | |||||
| Logistics Segment |
31.4 | - | - | - | - | ||||||||||
| Total |
$ | 200.4 | $ | - | $ | - | $ | - | $ | - | |||||
1/ In accordance with ASC Topic 350, the Company recognized a charge of $200.4 million related to the impairment of goodwill. The carrying value of goodwill prior to the impairment was $200.4 million. As of March 31, 2009, the estimated fair value of goodwill was $0 million and was estimated based on level 3 inputs.
The valuation methodology used to estimate the fair value of the total company and reporting units requires inputs and assumptions that reflect current market conditions as well as management judgment. For purposes of establishing inputs for the fair value calculations described above related to goodwill impairment testing, the Company made the following assumptions in connection with the first quarter 2009 testing. Management assumed that the economic recession would continue throughout 2009, followed by a slow recovery period beginning in 2010. Management applied transportation margin assumptions reflecting the Company’s then current estimates. Management used the then current estimate of operations for the forecast period and applied a 13.0% discount rate to the forecast. Management applied a 5.0% growth factor to the intermodal reporting unit and a 2.5% growth factor to the logistics reporting unit to calculate the terminal value of the reporting units under the income approach. The 13.0% discount rate was the weighted average cost of capital using comparable publicly traded companies. The sum of the fair values of the reporting units was reconciled to the Company’s then current market capitalization which declined further during the first quarter of 2009 as compared to the Company’s market capitalization at the end of the 2008 fiscal year, plus an estimated control premium. The fair value estimates were based on projected financial information which management believed to be reasonable. However, actual future results may differ from those projections, and those differences may be material.
F-10
Table of Contents
PACER INTERNATIONAL, INC. AND SUBSIDIARIES
NOTES TO CONSOLIDATED FINANCIAL STATEMENTS – (Continued)
The Company has allocated goodwill to the reporting units as shown in the table below as of December 28, 2007, December 26, 2008 and December 31, 2009 (in millions):
| Logistics Segment |
Intermodal Segment |
Total | ||||||||||
| Balance at December 28, 2007 |
$ | 119.3 | $ | 169.0 | $ | 288.3 | ||||||
| Goodwill Impairment 2008 |
(87.9 | ) | - | (87.9 | ) | |||||||
| Goodwill Balance at December 26, 2008 |
119.3 | 169.0 | 288.3 | |||||||||
| Accumulated Impairment Losses |
(87.9 | ) | - | (87.9 | ) | |||||||
| Net Balance at December 26, 2008 |
31.4 | 169.0 | 200.4 | |||||||||
| Goodwill Impairment 2009 |
(31.4 | ) | (169.0 | ) | (200.4 | ) | ||||||
| Goodwill Balance at March 31, 2009 |
119.3 | 169.0 | 288.3 | |||||||||
| Accumulated Impairment Losses |
(119.3 | ) | (169.0 | ) | (288.3 | ) | ||||||
| Net Balance at March 31, 2009 |
$ | - | $ | - | $ | - | ||||||
There were no additions or deletions to goodwill between March 31, 2009 and December 31, 2009.
Revenue Recognition
Intermodal segment local cartage and rail brokerage operations recognize revenues when delivery requirements are met. Revenues from the logistics segment transportation activities, including highway brokerage and international freight forwarding, are recorded when delivery requirements are met. Logistics segment revenues from warehousing activities are recorded as earned. Logistics segment supply chain management/consulting services net revenues are recorded as earned. Revenues from the logistics segment’s former truck services operation were recorded when delivery requirements were met. Revenues from both segments are reported net of volume discounts provided to customers.
As described above under the heading “Change in Accounting Policies,” during 2009, the Company changed the Stacktrain method of revenue and cost recognition to the completed service method in order to conform to other Pacer business units. The revenue recognition change was applied retrospectively for all periods presented. Please see Note 2 for detailed information.
Income Taxes
The Company recognizes income tax expense using the liability method of accounting for deferred income taxes. A deferred tax asset or liability is recorded based upon the tax effect of temporary differences between the tax bases of assets and liabilities and their carrying value for financial reporting purposes. Deferred tax expense or benefit is the result of changes in the deferred tax assets and liabilities during the year.
F-11
Table of Contents
PACER INTERNATIONAL, INC. AND SUBSIDIARIES
NOTES TO CONSOLIDATED FINANCIAL STATEMENTS – (Continued)
Accumulated Other Comprehensive Income (Loss)
Other comprehensive income (loss) includes foreign currency translation adjustments, net of related tax. Other comprehensive income (loss) consists of the following (in millions):
| Foreign Currency Translation Adjustment |
Accumulated Other Comprehensive Income (Loss) |
|||||||
| Balance at December 29, 2006 |
$ | (0.1 | ) | $ | (0.1 | ) | ||
| Activity during 2007 (net of $- million tax) |
- | - | ||||||
| Balance at December 28, 2007 |
$ | (0.1 | ) | $ | (0.1 | ) | ||
| Activity during 2008 (net of $0.1 million tax) |
0.2 | 0.2 | ||||||
| Balance at December 26, 2008 |
$ | 0.1 | $ | 0.1 | ||||
| Activity during 2009 (net of $0.1 million tax) |
(0.2 | ) | (0.2 | ) | ||||
| Balance at December 31, 2009 |
$ | (0.1 | ) | $ | (0.1 | ) | ||
The assets and liabilities of the Company’s foreign operations have been translated at rates of exchange at the balance sheet date, and related revenues and expenses have been translated at average rates of exchange in effect during the year.
Common Stock Repurchases
Pursuant to authorizations which expired on June 15, 2009, the Company’s Board of Directors authorized the purchase of up to $160 million of its common stock. The Company repurchased a total of 19,039 shares at an average price of $21.54 per share in the 2008 fiscal year and repurchased a total of 21,569 shares at an average price of $3.08 per share in the 2009 fiscal year.
Stock-Based Compensation
The Company has adopted ASC Topic 718 (“ASC 718”), “Compensation – Stock Compensation,” which establishes the accounting for employee stock-based awards. Under the provisions of ASC 718, stock-based compensation is measured at the grant date, based on the calculated fair value of the award, and is recognized as an expense over the requisite employee service period (generally the vesting period of the grant). The Company recognized stock-based compensation for awards issued under the Company’s long-term incentive plans in the selling, general and administrative line item of the consolidated statement of operations. Additionally, no modifications were made to outstanding stock options prior to the adoption of ASC 718 and no cumulative adjustments were recorded in the Company’s financial statements.
F-12
Table of Contents
PACER INTERNATIONAL, INC. AND SUBSIDIARIES
NOTES TO CONSOLIDATED FINANCIAL STATEMENTS – (Continued)
The fair value of each option grant is estimated using the Black-Scholes valuation model and the assumptions noted in the following table. The Company granted 24,000 stock options in 2009, and no stock option grants were made in 2008. The expected term of stock options is based on an analysis of historical exercise behavior. The expected volatility is based on the change in weekly prices of the Company’s stock over a 104-week period preceding each grant date. The risk free interest rate is based on the implied yield on U.S. Treasury issues with a term equal to the expected term of the option. The dividend yield for 2007 reflects an estimated annual dividend of $0.60 per share divided by the market price at date of grant. The Company discontinued the declaration of dividends in 2009.
| Fiscal Year Ended | ||||||||||
| December 31, 2009 |
December 26, 2008 |
December 28, 2007 |
||||||||
| Black-Scholes option-pricing model assumptions: |
||||||||||
| Weighted average risk-free interest rate |
2.9 | % | N/A | 4.1 | % | |||||
| Weighted average volatility |
59.0 | % | N/A | 33.0 | % | |||||
| Weighted average dividend yield |
0.0 | % | N/A | 3.0 | % | |||||
| Weighted average expected option term |
7.3 years | N/A | 5.0 years | |||||||
| Weighted average fair value of options granted |
$ | 2.50 | N/A | $ | 5.26 | |||||
The Company granted 6,000 shares of restricted stock to certain employees during 2009 with a weighted average market price at date of grant of $2.81, and 65,000 shares of restricted stock to certain employees during 2008 with a weighted average market price at date of grant of $20.98.
Earnings per Share
Earnings per share amounts for the year ended December 26, 2008, and all prior periods, have been retrospectively revised in accordance with the FASB ASC Topic 260-10-45, “Earnings Per Share.” Under Topic 260, Pacer must consider restricted stock grants as another class of stock and use the two class method in determining earnings per share. The retrospective application was not material.
The computation of earnings per share-basic is based on net income available to common shareholders and the weighted-average number of outstanding common shares. The computation of earnings per share-diluted is based on net income available to common shareholders and the weighted-average number of outstanding common shares including the effect of dilutive stock based compensation awards.
Financial Instruments
The carrying amounts for cash, accounts receivables and accounts payable approximate fair value due to the short-term nature of these instruments. The carrying value of debt approximates fair value due to the floating nature of the interest rates.
Concentration of Credit Risk
Financial instruments that potentially subject the Company to concentrations of credit risk consist primarily of accounts receivable. The Company sells primarily on net 30-day terms, performs credit evaluation procedures on its customers and generally does not require collateral on its accounts receivable. The Company maintains an allowance for doubtful accounts.
During 2009, the Company had one customer representing 10.0% of total revenues generated primarily in the intermodal segment. During 2008, the Company had one customer representing 10.5% of total revenues. During 2007, the Company had one customer representing 10.4% of total revenues. Approximately 19% of 2009 total revenues were related to the automotive industry.
F-13
Table of Contents
PACER INTERNATIONAL, INC. AND SUBSIDIARIES
NOTES TO CONSOLIDATED FINANCIAL STATEMENTS – (Continued)
Recently Issued Accounting Pronouncements
In June 2009, the FASB issued Statement of Financial Accounting Standards (“SFAS”) No. 168, “FASB Accounting Standards Codification and the Hierarchy of Generally Accepted Accounting Principles, a replacement of FASB Statement No. 162.” SFAS No. 168 does not change current U.S. generally accepted accounting principles (“GAAP”). The FASB Accounting Standards Codification was developed to organize GAAP pronouncements by topic so that users can more easily access authoritative accounting guidance. It is organized by topic, subtopic, section, and paragraph, each of which is identified by a numerical designation. This statement was effective for interim and annual periods ended after September 15, 2009. All accounting references in this report have been updated, and therefore all SFAS and other accounting references have been replaced with ASC references.
In May 2009, ASC Topic 855-10-50, “Subsequent Events,” established general standards of accounting for and disclosure of events that occur after the balance sheet date but before the financial statements are issued or are available to be issued. It requires the disclosure of the date through which an entity has evaluated subsequent events and the basis for that date, and was effective for interim and annual reporting periods ended after June 15, 2009. The adoption of ASC 855-10-50 did not have a material impact on the Company’s results of operations or financial condition.
NOTE 2. RETROSPECTIVE APPLICATION OF NEW ACCOUNTING POLICIES
Effective January 1, 2009, the Company’s Stacktrain business unit changed its revenue and cost recognition method to the completed service method in order to conform to Pacer’s other business units. Prior to 2009, Pacer’s Stacktrain business unit recognized revenue on a percent of completed service basis with expenses recognized as incurred. The cumulative effect of the change at December 30, 2006 (the first day of the Company’s 2007 fiscal year) was a decrease of $0.4 million to retained earnings and an increase of $0.4 million to accounts payable and other accrued liabilities.
In addition, prior period EPS has been retrospectively revised due to the implementation of ASC Topic 260-10-45, “Earnings Per Share.” See Note 1 for further discussion of these changes in accounting policy.
The impact of the changes in revenue and cost recognition and the application of ASC Topic 260 from those originally reported are summarized as follows (in millions, except share and per share data):
Consolidated Statements of Operations
| 2008 | 2007 | |||||||||||||
| As Reported | As Adjusted | As Reported | As Adjusted | |||||||||||
| Revenues |
$ | 2,087.7 | $ | 2,087.5 | $ | 1,969.4 | $ | 1,969.8 | ||||||
| Cost of purchased transportation and services |
1,659.7 | 1,659.3 | 1,537.7 | 1,538.0 | ||||||||||
| Income continuing from operations |
1.8 | 2.0 | 94.5 | 94.6 | ||||||||||
| Income taxes |
16.0 | 16.0 | 34.7 | 34.7 | ||||||||||
| Net income (Loss) |
$ | (16.6 | ) | $ | (16.4 | ) | $ | 54.3 | $ | 54.4 | ||||
| Earnings (Loss) per share (Note 15): |
||||||||||||||
| Basic: |
||||||||||||||
| Earnings (Loss) per share |
$ | (0.48 | ) | $ | (0.47 | ) | $ | 1.53 | $ | 1.52 | ||||
| Weighted average shares outstanding |
34,616,598 | 34,616,598 | 35,587,755 | 35,587,755 | ||||||||||
| Diluted: |
||||||||||||||
| Earnings (Loss) per share |
$ | (0.48 | ) | $ | (0.47 | ) | $ | 1.51 | $ | 1.51 | ||||
| Weighted average shares outstanding |
34,616,598 | 34,616,598 | 35,911,246 | 35,911,246 | ||||||||||
F-14
Table of Contents
PACER INTERNATIONAL, INC. AND SUBSIDIARIES
NOTES TO CONSOLIDATED FINANCIAL STATEMENTS – (Continued)
Consolidated Balance Sheets
| December 26, 2008 | ||||||||
| As Reported | As Adjusted | |||||||
| Accounts payable and other accrued liabilities |
$ | 158.3 | $ | 158.6 | ||||
| Total liabilities |
223.9 | 224.2 | ||||||
| Accumulated deficit |
(29.9 | ) | (30.2 | ) | ||||
| Total stockholders’ equity |
$ | 270.7 | $ | 270.4 | ||||
Consolidated Statements of Cash Flows
| 2008 | 2007 | |||||||||||||
| As Reported | As Adjusted | As Reported | As Adjusted | |||||||||||
| Net income (Loss) |
$ | (16.6 | ) | $ | (16.4 | ) | $ | 54.3 | $ | 54.4 | ||||
| Accounts payable and other accrued liabilities |
(24.5 | ) | (24.7 | ) | 32.7 | 32.6 | ||||||||
NOTE 3. DEBT AND CAPITAL LEASES
On August 28, 2009, the Company entered into an Amended and Restated Credit Agreement (the “A&R Credit Agreement”) with Bank of America, N.A., as Administrative Agent and Swing Line Lender, the letter of credit issuers parties thereto, the lenders parties thereto, and Banc of America Securities, LLC, as Sole Lead Arranger and Sole Book Manager, which replaced the Credit Agreement dated April 5, 2007 (the “2007 Credit Agreement”).
The A&R Credit Agreement, which maintains the original maturity of April 5, 2012, provides for a revolving credit facility of up to $125 million (including a $35 million letter of credit facility and a $10 million swing line loan facility), and an accordion feature providing for an increase in the facility of up to $50 million subject to certain conditions (for a total facility of $175 million if such conditions are met). Borrowing under the facility is determined on a daily basis as calculated under a borrowing base formula, determined on a monthly basis, equal to the lesser of (a) $125 million less the sum of substantially all obligations under outstanding letters of credit (the “L/C Reserve”) and an amount equal to the availability block (described below), or (b) an amount equal to (i) the sum of (x) 85% of the eligible accounts receivables and (y) 85% of eligible earned but unbilled accounts receivable up to $17.5 million and (z) the lesser of (I) 80% of the net liquidation value of eligible owned railcars and chassis and (II) $25.0 million, which lesser amount is reduced monthly by $250,000 beginning September 30, 2009), minus (ii) the availability reserve (described below).
The availability block is $500,000 per month on a cumulative basis beginning September 30, 2009, except that commencing March 30, 2010 (at which time the availability block will have reached $3 million) the availability block will cease to escalate and instead will be released in four successive equal monthly installments if, and only for so long as, the Company has achieved a fixed charge coverage ratio of greater than 1.25:1.00 for the preceding 12 month period (or for periods ending on or prior to July 30, 2010, for the period beginning August 1, 2009). If the availability block fixed charge coverage ratio is 1.25:1.00 or lower for any such period, the release of any block will be suspended, and the availability block will recommence at the rate of $500,000 per month which will be added to any then existing availability block. As of December 31, 2009, the availability block was $2.0 million.
The availability reserve is the sum of (i) the L/C Reserve, (ii) reserves established by the Administrative Agent in its reasonable discretion for bank products extended to the Company and its subsidiaries by any lender party to the A&R Credit Agreement (such as foreign exchange and cash management services), (iii) obligations of the Company and its subsidiaries secured by liens that are senior to the liens under the A&R Credit Agreement, (iv) the availability block then in effect, and (v) such
F-15
Table of Contents
PACER INTERNATIONAL, INC. AND SUBSIDIARIES
NOTES TO CONSOLIDATED FINANCIAL STATEMENTS – (Continued)
additional reserves established by the Administrative Agent in its reasonable discretion from time to time. As of December 31, 2009, the availability reserve was $24.7 million, comprised of $22.7 million in L/C Reserve and $2.0 million in availability block.
Until the delivery of financial statements and a compliance certificate with respect to the period ending March 31, 2010, borrowings under the A&R Credit Agreement will bear interest, at the Company’s option, at a base rate plus a margin of 3.75% per annum, or at a Eurodollar rate plus a margin of 4.75% per annum. Following delivery of such financial statements and compliance certificate, the margin may decline to 3.50% on base rate loans or 4.50% on Eurodollar rate loans if the Company’s fixed charge coverage ratio for the applicable period described below is greater than 1.50:1.00. The base rate is the highest of the prime lending rates of the Administrative Agent, the Eurodollar rate for a 30-day interest period plus 1.0%, or the federal funds rate plus 1/2 of 1%.
The A&R Credit Agreement also provides for letter of credit fees equal to the applicable Eurodollar rate margin referred to above, and a commitment fee payable on the unused portion of the facility, which shall accrue at a rate per annum ranging from 0.50% to 0.75%, depending on the average loans and letter of credit outstanding as a percentage of the aggregate commitments under the facility.
Under the borrowing base formula determined as of December 31, 2009 as described above, $45.2 million was available under the A&R Credit Agreement, net of $23.0 million in outstanding loans and $22.7 million of outstanding letters of credit and $2.0 million availability block. The outstanding loan amount has been reduced $3.3 million for cash deposited into the lenders lock-box on December 31, 2009 and applied to the repayment of debt on January 1, 2010. Bank and consulting fees of $3.8 million associated with completing the amendment have been capitalized and are being amortized over the remaining life of the A&R Credit Agreement. In addition, due to the reduction in borrowing capacity affected by the A&R Credit Agreement, a total of $0.3 million of previously deferred loan fees were written-off to interest expense in 2009.
The A&R Credit Agreement contains affirmative, negative and financial covenants customary for such asset-based financings, including, among other things, limits on the incurrence of debt, the incurrence of liens, restricted payments, transactions with affiliates, capital expenditures and mergers and consolidations and a fixed charge coverage ratio. It also contains customary representations and warranties. Breaches of the covenants, representations or warranties may give rise to an event of default. Other events of default include the Company’s failure to pay certain debt, the occurrence of a default with respect to any indebtedness of the Company and its subsidiaries resulting in, or which permits, the acceleration, repurchase, repayment or redemption of such indebtedness, certain insolvency and bankruptcy proceedings, certain ERISA events or unpaid judgments over a specified amount, or a change in control as defined in the A&R Credit Agreement.
The fixed charge coverage ratio requires the Company to maintain as of the end of each month a minimum ratio for the preceding 12-month period (or for periods ending on or prior to July 30, 2010, for the period beginning August 1, 2009 through the end of the applicable month) of 1.25:1.00. At December 31, 2009, the Company was in compliance with the covenants of the A&R Credit Agreement, with a fixed charge coverage ratio of 4.3x. The fixed charge coverage ratio is the ratio of (a) EBITDA (defined as net income plus interest, income taxes, depreciation and amortization expense, non-recurring expenses reducing such net income which do not represent a cash item in the relevant or any future period, non-cash charges or expenses related to equity plans or stock option awards, payroll taxes on exercise of stock options, operating losses associated with Pacer Transport, Inc. (capped at $500,000), and non-recurring operational restructuring charges incurred before August 28, 2010 (capped at $2 million in any three-month period and $5 million in total) minus income tax credits and non-cash items increasing net income) to (b) fixed charges (cash interest expense, regularly scheduled principal payments on or redemptions or similar acquisitions for value of borrowed money, income taxes paid in cash, and capital expenditures (other than those financed with borrowed money other than under the A&R Credit Agreement)).
F-16
Table of Contents
PACER INTERNATIONAL, INC. AND SUBSIDIARIES
NOTES TO CONSOLIDATED FINANCIAL STATEMENTS – (Continued)
The A&R Credit Agreement limits the Company’s annual capital expenditures to $13.5 million for 2009 and $6.5 million for 2010 and thereafter plus 50% of any prior years’ under-usage. Accordingly, maximum annual permitted capital expenditures for 2010 are $8.1 million.
The A&R Credit Agreement is guaranteed by all of the Company’s direct and indirect domestic subsidiaries and is secured by a first priority, perfected security interest in substantially all of the present and future tangible and intangible assets, intercompany debts, stock or other equity interest owned by the Company and its domestic subsidiaries and a portion of the stock or other equity interests of certain of its foreign subsidiaries.
As of December 31, 2009, borrowings under the A&R Credit Agreement bore a weighted average interest rate of 5.5% per annum. The Company repaid $21.0 million, net of $2.4 million of debt issuance costs paid to lenders and $1.4 million of debt issuance costs paid to other third parties, under the credit facility and repaid $0.3 million of capital lease obligations during 2009.
As required by the A&R Credit Agreement, the Company has established a lock-box arrangement under which all qualified daily cash receipts are applied on the next business day to repay outstanding borrowings under the A&R Credit Agreement. ASC 470-10-45-5A, “Debt,” indicates that when such arrangements exist, all outstanding borrowings under a revolving credit facility such as the A&R Credit Agreement are to be classified as a current liability.
Debt and capital lease obligations are summarized as follows (in millions):
| December 31, 2009 |
December 26, 2008 | |||||
| A&R Credit Agreement (5.5%; expires April 5, 2012) |
$ | 23.0 | $ | 44.0 | ||
| Capital lease obligations |
0.3 | 0.6 | ||||
| Total |
23.3 | 44.6 | ||||
| Less current portion of the A&R Credit Agreement |
23.0 | - | ||||
| Less current portion of capital lease obligations |
0.3 | 0.3 | ||||
| Long-term portion |
$ | - | $ | 44.3 | ||
The net book value of equipment under capital lease was $0.3 million at December 31, 2009.
Contractual maturities of debt and capital lease obligations during each of the three years subsequent to 2009 are as follows (in millions):
| 2010 |
$ | 23.3 | |
| 2011 |
- | ||
| 2012 |
- | ||
| Total |
$ | 23.3 | |
F-17
Table of Contents
PACER INTERNATIONAL, INC. AND SUBSIDIARIES
NOTES TO CONSOLIDATED FINANCIAL STATEMENTS – (Continued)
NOTE 4. FACILITY CLOSINGS AND OTHER SEVERANCE COSTS
In March 2007, the Company began a facility rationalization and other severance program to close facilities and reduce employment in order to improve efficiency and profitability. The program included exit activities as well as ongoing employment reduction initiatives. Through December 31, 2009, a total of $6.1 million has been expensed for the severance of 134 employees and the closure of four facilities. The table below shows activity for the fiscal years ended December 31, 2009, December 26, 2008, and December 28, 2007(in millions).
| Costs of Facility Closings | Costs of Other Severance | Total | ||||||||||||||||||||||||||||
| Accrued | Paid | Bal. | Accrued | Paid | Bal. | Accrued | Paid | Bal. | ||||||||||||||||||||||
| Bal. at 12/29/06 |
$ | - | $ | - | $ | - | $ | - | $ | - | $ | - | $ | - | $ | - | $ | - | ||||||||||||
| Activity |
0.7 | 0.6 | 0.1 | 5.3 | 3.1 | 2.2 | 6.0 | 3.7 | 2.3 | |||||||||||||||||||||
| Bal. at 12/28/07 |
0.7 | 0.6 | 0.1 | 5.3 | 3.1 | 2.2 | 6.0 | 3.7 | 2.3 | |||||||||||||||||||||
| Activity |
- | 0.1 | (0.1 | ) | 0.1 | 1.9 | (1.8 | ) | 0.1 | 2.0 | (1.9 | ) | ||||||||||||||||||
| Bal. at 12/26/08 |
0.7 | 0.7 | - | 5.4 | 5.0 | 0.4 | 6.1 | 5.7 | 0.4 | |||||||||||||||||||||
| Activity |
- | - | - | - | 0.4 | (0.4 | ) | - | 0.4 | (0.4 | ) | |||||||||||||||||||
| Bal. at 12/31/09 |
$ | 0.7 | $ | 0.7 | $ | - | $ | 5.4 | $ | 5.4 | $ | - | $ | 6.1 | $ | 6.1 | $ | - | ||||||||||||
The Company implemented an organizational simplification and workforce reduction initiative in 2009 to move toward operations organized by function rather than by business unit and to consolidate operations into a centralized operational headquarters based in Dublin, Ohio, with two regional operations centers, located in Los Angeles, California and Jacksonville, Florida. During 2009, the Company reduced its workforce by 559 positions and vacated two office locations and has offered new or relocated positions to additional personnel.
During 2009, the Company recorded costs associated with these activities of $7.2 million ($4.6 million in the intermodal segment, $1.3 million in the logistics segment and $1.3 million in corporate). At December 31, 2009, $1.6 million of severance and $0.2 million of lease termination costs were accrued in accounts payable and other accrued liabilities on the consolidated balance sheet. The Company will record additional charges in 2010 for costs associated with these ongoing activities, consisting of severance costs and lease termination charges. These charges, which when combined with charges already incurred, are expected to be in the range of $8 million to $9.5 million. All severance and lease termination costs associated with these activities will result in future cash expenditures. The table below shows 2009 severance program activity (in millions).
| 2009 Restructuring Program | |||||||||
| Accrued | Paid | Balance | |||||||
| Beginning Balance |
$ | - | $ | - | $ | - | |||
| 2009 Activity |
7.2 | 5.4 | 1.8 | ||||||
| Balance at 12/31/09 |
$ | 7.2 | $ | 5.4 | $ | 1.8 | |||
All of these costs are included in the selling, general and administrative line item of the consolidated statement of operations for 2009, 2008 and 2007.
NOTE 5. NEW UNION PACIFIC ARRANGEMENTS AND SALE OF CERTAIN ASSETS
Other income of $18.9 million on the consolidated statement of operations includes a $17.5 million gain related to the new Union Pacific contract arrangements and a $1.4 million gain on the sale of certain truck services assets as discussed below.
F-18
Table of Contents
PACER INTERNATIONAL, INC. AND SUBSIDIARIES
NOTES TO CONSOLIDATED FINANCIAL STATEMENTS – (Continued)
On November 3, 2009, the Company entered into (i) an amendment (the “Amendment”) to the Amended and Restated Rail Transportation Agreement dated as of May 15, 2002, among Union Pacific, the Company, and American President Lines, Ltd., and APL Co. PTE Ltd. (collectively, “APL”) (the “Existing Agreement”) and (ii) a new commercial rail transportation agreement (the “New Commercial Agreement”) and other agreements with Union Pacific (collectively, the “New Arrangements”). The Amendment provides that the rates and other terms and conditions of the Existing Agreement will no longer apply to domestic shipments in 48- and 53-foot containers (also referred to as “domestic big box shipments”) tendered by Pacer for transportation by Union Pacific, which shipments will be subject to the terms and conditions of the New Commercial Agreement.
In connection with the New Arrangements, Union Pacific and Pacer agreed to settle all outstanding claims and counterclaims between them relating to Pacer’s domestic big box shipments under the Existing Agreement, including, as described in Note 9 “Commitments and Contingencies,” Union Pacific’s claim for retroactive rate adjustments of approximately $140 million for the period from January 1, 2005, through June 30, 2009 (the latest available date) and Pacer’s claims alleging Union Pacific’s breach of the Existing Agreement.
Under the New Commercial Agreement, Pacer agreed that rates for domestic big box shipments payable by it to Union Pacific for transportation on the Union Pacific network would adjust gradually over a two-year period to “market” rates and would continue on competitive terms after October 11, 2011, the expiration date of the Existing Agreement. The Company and Union Pacific also entered into a fleet sharing arrangement that allows Union Pacific customer access to the Company’s equipment fleet and grants the Company expanded access to Union Pacific’s equipment fleet. The arrangement also contains mechanisms that allow the Company to adjust the size of its fleet up or down in the future to address estimated changes in its equipment needs.
The Existing Agreement, which expires on October 11, 2011, will remain in effect with respect to shipments (other than the domestic big box shipments) and other matters not expressly governed by the New Arrangements, including the rates, terms and conditions applicable to (1) international shipments generally in 20, 40 and 45-ft. containers owned or leased by APL; (2) domestic shipments in containers owned or leased by APL or other third party ocean carriers (known as domestic and international reload services or avoided repositioning cost (“ARC”) moves); (3) international shipments in containers owned or leased by other third party ocean carriers; and (4) automotive shipments (which primarily move between the United States and Mexico) in containers owned or leased by Pacer. Although the Existing Agreement remains in effect until October 11, 2011 with respect to international shipments and ARC services, the New Commercial Agreement also establishes terms and conditions that will apply after October 11, 2011 to provide the Company with a continued exclusive position on the Union Pacific network with regard to offering services to meet ocean carrier customers’ needs in conjunction with and in addition to the Union Pacific rail transportation service.
The New Commercial Agreement has a multi-year term and thereafter will automatically renew for one-year periods subject to certain conditions, including a minimum volume requirement, and subject to cancellation by either party with specified notice. In connection with the agreements and arrangements described above, including the amendment of the Existing Agreement, Union Pacific paid Pacer $30 million. The payment was used to pay down outstanding borrowings under the credit facility on November 4, 2009. During the fourth quarter of 2009, $17.5 million was recognized as other income, net of $1.2 million of accelerated chassis delivery costs, and $11.3 million will be amortized to other income over the remaining term of the Existing Agreement.
On August 17, 2009, the Company closed the previously announced sale of certain assets of Pacer Transport, Inc., S&H Transport, Inc. and S&H Leasing, Inc. to subsidiaries of Universal Truckload Services, Inc. (“UTSI”) under the Limited Asset Purchase Agreement signed on July 24, 2009. In connection with the sale, subsidiaries of UTSI assumed the real property leases and equipment leases for tractors and trailers used by the truck services unit as well as certain customer, agent and other agreements,
F-19
Table of Contents
PACER INTERNATIONAL, INC. AND SUBSIDIARIES
NOTES TO CONSOLIDATED FINANCIAL STATEMENTS – (Continued)
for a purchase price of approximately $2.0 million. The Company retained all receivables generated by the truck services unit through the closing date. A gain on the sale of $1.4 million is included in other income in the consolidated statements of operations for the year ended December 31, 2009.
NOTE 6. INCOME TAXES
The provision for income taxes is as follows (in millions):
| Fiscal Year Ended | |||||||||||
| Dec. 31, 2009 | Dec. 26, 2008 | Dec. 28, 2007 | |||||||||
| Current: |
|||||||||||
| Federal |
$ | (8.7 | ) | $ | 15.3 | $ | 23.6 | ||||
| State |
0.8 | 2.7 | 3.1 | ||||||||
| Total current |
(7.9 | ) | 18.0 | 26.7 | |||||||
| Deferred: |
|||||||||||
| Federal |
(33.7 | ) | (1.8 | ) | 7.2 | ||||||
| State |
(4.7 | ) | (0.2 | ) | 0.8 | ||||||
| Total deferred |
(38.4 | ) | (2.0 | ) | 8.0 | ||||||
| Total provision |
$ | (46.3 | ) | $ | 16.0 | $ | 34.7 | ||||
The reconciliation of the net effective income tax rate to the U.S. federal statutory income tax rate is as follows:
| Fiscal Year Ended | |||||||||
| Dec. 31, 2009 | Dec. 26, 2008 | Dec. 28, 2007 | |||||||
| U.S. federal statutory rate |
35.0 | % | 35.0 | % | 35.0 | % | |||
| Increases in rate resulting from: |
|||||||||
| State tax, net of federal benefit |
1.1 | % | (232.5 | )% | 3.4 | % | |||
| ASC 740 liability release |
(0.1 | )% | 555.6 | % | - | % | |||
| Goodwill impairment |
(15.4 | )% | (2,744.3 | )% | - | % | |||
| State NOL valuation allowance |
- | % | (29.6 | )% | - | % | |||
| Non-deductible business meals |
- | % | (46.3 | )% | - | % | |||
| Sec. 162 (M) compensation limitations |
- | % | (20.2 | )% | - | % | |||
| Tax penalties |
- | % | (10.3 | )% | - | % | |||
| Club dues |
- | % | (8.1 | )% | - | % | |||
| True-up adjustment |
- | % | (39.9 | )% | - | % | |||
| Other permanent book/tax differences |
0.4 | % | (126.1 | )% | 0.6 | % | |||
| Net effective tax rate |
21.0 | % | (2,666.7 | )% | 39.0 | % | |||
All federal income tax returns for Pacer are closed through 2003 and filed through 2008.
F-20
Table of Contents
PACER INTERNATIONAL, INC. AND SUBSIDIARIES
NOTES TO CONSOLIDATED FINANCIAL STATEMENTS – (Continued)
The following table shows the tax effects of the Company’s cumulative temporary differences included in the consolidated balance sheets at December 31, 2009 and December 26, 2008 (in millions):
| December 31, 2009 |
December 26, 2008 |
|||||||
| Tax loss carry-forwards |
$ | 0.6 | $ | 0.6 | ||||
| Property and equipment |
(9.9 | ) | (13.7 | ) | ||||
| Allowance for doubtful accounts |
1.5 | 1.9 | ||||||
| Accrued liabilities |
1.1 | 1.7 | ||||||
| Tax basis in excess of book – recapitalization |
(13.4 | ) | (5.2 | ) | ||||
| Goodwill impairment |
55.2 | 14.9 | ||||||
| State NOL valuation allowance |
(0.2 | ) | (0.2 | ) | ||||
| Deferred revenue |
4.6 | - | ||||||
| Other |
(3.4 | ) | (2.3 | ) | ||||
| Total net deferred tax asset |
$ | 36.1 | $ | (2.3 | ) | |||
| Current deferred tax asset |
$ | 3.0 | $ | 6.2 | ||||
| Non-current deferred tax asset |
48.4 | 12.1 | ||||||
| Current deferred tax liability |
(2.0 | ) | (3.1 | ) | ||||
| Non-current deferred tax liability |
(13.3 | ) | (17.5 | ) | ||||
| Total net deferred tax asset |
$ | 36.1 | $ | (2.3 | ) | |||
In June 2006, FASB ASC 740 clarified the accounting for uncertainty in income taxes. ASC 740 prescribes a recognition threshold and measurement attribute for the financial statement recognition and measurement of a tax position taken or expected to be taken in a tax return. ASC 740 requires that the Company recognize in the financial statements, the impact of a tax position, if that position is more likely than not of being sustained on audit, based on the technical merits of the position. ASC 740 also provides guidance on derecognition, classification, interest and penalties, accounting in interim periods and disclosure. ASC 740 was effective for the Company as of December 30, 2006. As a result of this implementation, the Company recognized a $0.4 million tax reserve increase for uncertain tax positions. The increase was accounted for as an adjustment to the beginning balance of retained earnings. Including the cumulative effect increase, at the beginning of 2007, the Company had a liability of approximately $3.9 million of total reserves relating to uncertain tax positions and a total of $4.1 million and $0.6 million at December 28, 2007, December 26, 2008, and none at December 31, 2009, respectively, including accrued interest. The Company reduced its unrecognized tax benefits by $0.6 million as a result of certain expirations of federal and state statutes of limitations in the third quarter of 2009. Below is a rollforward of the ASC 740 reserve (in millions).
| ASC 740 | Interest/Penalties | Total | ||||||||||
| Reserve at December 30, 2006 |
$ | (2.5 | ) | $ | (1.4 | ) | $ | (3.9 | ) | |||
| Accrued Interest |
- | (0.2 | ) | (0.2 | ||||||||
| Reserve at December 28, 2007 |
$ | (2.5 | ) | $ | (1.6 | ) | $ | (4.1 | ) | |||
| Liability Release |
2.0 | 1.5 | 3.5 | |||||||||
| Reserve at December 26, 2008 |
$ | (0.5 | ) | $ | (0.1 | ) | $ | (0.6 | ) | |||
| Liability Release |
0.5 | 0.1 | 0.6 | |||||||||
| Reserve at December 31, 2009 |
$ | - | $ | - | $ | - | ||||||
The Company recognized $15 thousand, $19 thousand and $0.2 million of accrued interest and no penalties related to unrecognized tax benefits in its income tax expense for the years ending December 31, 2009, December 26, 2008 and December 28, 2007, respectively.
F-21
Table of Contents
PACER INTERNATIONAL, INC. AND SUBSIDIARIES
NOTES TO CONSOLIDATED FINANCIAL STATEMENTS – (Continued)
NOTE 7. 401(K) PLAN AND LONG-TERM INCENTIVE PLANS
Under the Pacer International, Inc. 401(k) plan, the Company matches 50% of the first 6% of base salary contributed by the employee. Matching contributions by the Company to the plan in 2008 and 2007 were $1.7 million and $1.6 million, respectively. Due to the Company’s 2008 and early 2009 operating performance and the significant effect that the economic recession was having on the transportation needs of customers and on our industry in general, the Company discontinued the 401(k) company matching contributions effective in April 2009. Matching contributions prior to the discontinuance of the program were $0.7 million in 2009.
On May 3, 2007, the shareholders of the Company approved the 2006 Long-Term Incentive Plan (the “2006 Plan”) which had been adopted by the Board of Directors in August 2006 subject to shareholder approval. The 2006 Plan expands the range of equity-based incentive awards that may be issued to attract, retain, incentivize, and reward directors, officers, employees and consultants. The 2006 Plan gives the Company the ability to provide incentives through issuance of stock options, stock appreciation rights, restricted stock or restricted stock units, performance or performance unit awards and other stock-based awards.
Prior to May 3, 2007, the Company had two stock option plans, the 1999 Stock Option Plan (the “1999 Plan”) and the 2002 Stock Option Plan (the “2002 Plan”). Upon adoption of the 2002 Plan, no further awards were able to be made under the 1999 Plan, although outstanding awards under that plan were not affected. As of May 3, 2007, with the adoption of the 2006 Plan, no further awards may be made under the 2002 Plan, although outstanding awards under the 2002 Plan were not affected.
A total of 2.5 million shares of common stock have been reserved for issuance under the 2006 Plan. If an award, other than a Substitute Award (defined below), is forfeited or otherwise terminates without the issuance or delivery of some or all of the shares underlying the award to the grantee, or becomes unexercisable without having been exercised in full, the remaining shares that were subject to the award will become available for future awards under the 2006 Plan (unless the 2006 Plan has terminated). The grant of a stock appreciation right (“SAR”) will not reduce the number of shares that may be subject to awards, but the number of shares issued upon the exercise of a SAR will so reduce the available number of shares.
Substitute Awards will not reduce the number of shares available for issuance under the 2006 Plan. Substitute Awards are awards granted in assumption of or in substitution for outstanding awards previously granted by a company acquired by or merged into the Company or any of its subsidiaries or with which the Company or any of its subsidiaries combines.
Subject to any required action by the Company’s shareholders, the number of shares reserved for issuance under the 2006 Plan, the maximum award limitations set forth in the 2006 Plan, the number of shares underlying an outstanding award, as well as the price per share (or exercise, base or purchase price) of the underlying shares, will be proportionately adjusted for any increase or decrease in the number of issued shares resulting from a stock split, reverse stock split, stock dividend, combination or reclassification of the shares, or any other similar transaction (but not the issuance or conversion of convertible securities). Subject to any required action by the Company’s shareholders, the 2006 Plan administrator (presently the Compensation Committee of the Board of Directors), in its sole discretion, may make similar adjustments to reflect a change in the capitalization of the Company, including a recapitalization, repurchase, rights offering, reorganization, merger, consolidation, combination, exchange of shares, spin-off, spin-out or other distribution of assets to shareholders or other similar corporate transaction or event.
F-22
Table of Contents
PACER INTERNATIONAL, INC. AND SUBSIDIARIES
NOTES TO CONSOLIDATED FINANCIAL STATEMENTS – (Continued)
The following table summarizes the stock option transactions under the 1999 Plan, the 2002 Plan and the 2006 Plan as of December 31, 2009.
| Options | Weighted Avg. Exercise Price |
Aggregate Intrinsic Value | |||||||
| ($ millions) | |||||||||
| Balance at December 29, 2006 |
1,217,247 | $ | 15.16 | ||||||
| Options exercisable, end of year |
413,547 | $ | 11.42 | ||||||
| Granted |
12,000 | $ | 19.99 | ||||||
| Canceled or expired |
(192,200 | ) | $ | 19.25 | |||||
| Exercised |
(169,132 | ) | $ | 10.78 | |||||
| Balance at December 28, 2007 |
867,915 | $ | 15.28 | ||||||
| Granted |
- | $ | - | ||||||
| Canceled or expired |
(33,600 | ) | $ | 17.40 | |||||
| Exercised |
(274,865 | ) | $ | 19.37 | |||||
| Balance at December 26, 2008 |
559,450 | $ | 17.18 | ||||||
| Granted |
24,000 | $ | 2.75 | ||||||
| Canceled or expired |
(118,550 | ) | $ | 13.30 | |||||
| Exercised |
- | $ | - | ||||||
| Balance at December 31, 2009 |
464,900 | $ | 17.38 | $ | - | ||||
| Options exercisable, end of year |
407,300 | $ | 17.46 | $ | - | ||||
| Shares available for future grant |
2,169,750 | ||||||||
The following table summarizes information about stock options outstanding at December 31, 2009:
| Range of Exercise |
Options Outstanding | Options Exercisable | ||||||||||
| Number Outstanding |
Weighted Average Remaining Life (Years) |
Weighted Average Exercise Price |
Number Exercisable |
Weighted Average Exercise Price | ||||||||
| Common Stock | ||||||||||||
| $ 2.41 – 3.08 |
24,000 | 9.4 | $ | 2.75 | - | $ | - | |||||
| $ 12.50 – 13.74 |
170,400 | 1.5 | $ | 12.65 | 170,400 | $ | 12.65 | |||||
| $ 15.00 – 16.18 |
43,300 | 3.6 | $ | 15.79 | 43,300 | $ | 15.79 | |||||
| $ 17.92 – 20.31 |
148,700 | 4.6 | $ | 19.64 | 139,700 | $ | 19.62 | |||||
| $ 25.75 – 28.05 |
44,500 | 5.9 | $ | 26.18 | 33,500 | $ | 26.11 | |||||
| $ 29.40 – 29.44 |
18,000 | 6.7 | $ | 29.41 | 10,800 | $ | 29.41 | |||||
| $ 35.17 |
16,000 | 6.3 | $ | 35.17 | 9,600 | $ | 35.17 | |||||
| Total |
464,900 | 3.8 | $ | 17.38 | 407,300 | $ | 17.46 | |||||
The compensation cost that has been charged against income for the share-based compensation plans was $2.1 million, $1.9 million and $2.9 million for 2009, 2008 and 2007, respectively. The excess tax benefit realized for the tax deductions from the share-based compensation plans totaled $0 million, $1.4 million and $1.2 million for 2009, 2008 and 2007, respectively. The tax benefit for stock compensation expense included in the provision for income taxes totaled $0 million and $1.4 million for 2009 and 2008, respectively. The total intrinsic value of options exercised was $0 million, $2.3 million and $1.9 million for
F-23
Table of Contents
PACER INTERNATIONAL, INC. AND SUBSIDIARIES
NOTES TO CONSOLIDATED FINANCIAL STATEMENTS – (Continued)
2009, 2008 and 2007, respectively. As of December 31, 2009, there was $0.3 million of total unrecognized compensation costs related to stock options assuming no new grants or forfeitures. These costs are expected to be recognized over a weighted-average period of approximately 1.4 years.
The Company has also issued time-based restricted stock under the 2006 Plan to certain employees with an initial grant in 2006 subject to shareholder approval of the 2006 Plan which occurred in May 2007. For reporting purposes, the initial grant is deemed to have occurred in 2007 upon shareholder approval of the 2006 Plan. Restricted stock is subject to restrictions and cannot be sold, transferred or disposed of during the restriction period. The holders of restricted stock generally have the same rights as a stockholder of the Company with respect to such shares, including the right to vote and receive dividends with respect to the shares. Restricted stock awards vest in 25% increments, on June 1 of each year over a four year period. A summary of restricted stock activity for the year ended December 31, 2009 is presented below:
| Shares | Weighted Avg. Grant-Date Fair Value | |||||
| Nonvested at December 30, 2006 |
- | $ | - | |||
| Granted |
282,000 | $ | 25.93 | |||
| Vested |
(48,750 | ) | $ | 27.64 | ||
| Forfeited |
(30,750 | ) | $ | 27.64 | ||
| Nonvested at December 28, 2007 |
202,500 | $ | 25.25 | |||
| Granted |
65,000 | $ | 20.98 | |||
| Vested |
(59,625 | ) | $ | 25.67 | ||
| Forfeited |
(7,000 | ) | $ | 22.41 | ||
| Nonvested at December 26, 2008 |
200,875 | $ | 23.84 | |||
| Granted |
6,000 | $ | 2.81 | |||
| Vested |
(69,125 | ) | $ | 24.60 | ||
| Forfeited |
(21,000 | ) | $ | 24.10 | ||
| Nonvested at December 31, 2009 |
116,750 | $ | 22.27 | |||
The total fair value of restricted shares vested during 2009 and 2008 were $1.7 million and $1.5 million, respectively, based on the market price at the grant date. As of December 31, 2009, there was $1.4 million of total unrecognized compensation cost related to restricted stock, which is expected to be recognized over a weighted-average period of approximately 1.5 years.
NOTE 8. RELATED PARTY TRANSACTIONS
The following table summarizes related party transactions recorded in the consolidated statements of operations (in millions).
| Related Party |
Type | Fiscal Year Ended December 31, 2009 |
Fiscal Year Ended December 26, 2008 |
Fiscal Year Ended December 28, 2007 | |||||||
| Cost of purchased transportation and services: |
|||||||||||
| Panther Expedited |
Truck transportation | $ | 1.9 | $ | 4.6 | $ | 4.5 | ||||
The Company engages, in the ordinary course of its business, Panther Expedited Services, Inc. as a transportation broker to provide transportation services from time to time. Andrew C. Clarke, a member of the Company’s Board of Directors until August 5, 2009, is President of Panther Expedited Services, Inc. Upon the resignation of Andrew C. Clarke from the Company’s Board of Directors, transactions with Panther Expedited Services, Inc. no longer qualify as related party transactions. The Company paid Panther Expedited Services, Inc. $1.9 million until August 5, 2009, $4.6 million in 2008 and $4.5 million in 2007, respectively.
F-24
Table of Contents
PACER INTERNATIONAL, INC. AND SUBSIDIARIES
NOTES TO CONSOLIDATED FINANCIAL STATEMENTS – (Continued)
Management believes that the terms of the related party transactions listed above were at fair market rates.
NOTE 9. COMMITMENTS AND CONTINGENCIES
The Company is subject to routine litigation arising in the ordinary course of business, and, except as discussed below, none of which is expected to have a material adverse effect on the Company’s business, consolidated results of operations, financial condition or cash flows. Most of the lawsuits to which the Company is a party are covered by insurance and are being defended in cooperation with insurance carriers.
Union Pacific has asserted a claim against us for retroactive and prospective rate adjustments which is in the pre-trial stage of arbitration before a neutral third party arbitrator and relates to domestic shipments in 20-, 40- and 45 ft. international containers. The information available to the Company at December 31, 2009 does not indicate that it is probable that a liability had been incurred as of the year ended as of December 31, 2009, and the Company could not make an estimate of the amount, or range of amounts, of any liability that would be incurred if this claim were resolved against it. Accordingly, the Company has not accrued any liability for this claim in its financial statements at and for the year ended December 31, 2009. The Company disputes this claim in its entirety and believes that it has meritorious defenses to it and that Union Pacific is not entitled to the claimed rate adjustments. The Company intends to vigorously defend against this claim by Union Pacific and to pursue its other related rights and remedies.
One of the Company’s other vendors has asserted a claim against the Company seeking to recover payment of alleged volume shortfalls under a contract for the provision of transportation services. This claim was submitted to arbitration on April 17, 2009. The vendor’s calculation of the dollar amount of shortfall payments that it claims from the Company as of December 31, 2009, is approximately $3.4 million. On January 28, 2010, the Company reached a settlement with the vendor in regards to the arbitration matter and several other claims between the parties for a net payment from the Company to the vendor of $1.2 million, which has been accrued at December 31, 2009. As part of the agreement, the parties also renegotiated certain ongoing contractual terms.
NOTE 10. SEGMENT INFORMATION
The intermodal segment provides intermodal rail transportation, intermodal marketing and local trucking services. The logistics segment provides highway brokerage, warehousing and distribution, international ocean shipping and freight forwarding, supply chain management services and, through August 17, 2009, truck services.
F-25
Table of Contents
PACER INTERNATIONAL, INC. AND SUBSIDIARIES
NOTES TO CONSOLIDATED FINANCIAL STATEMENTS – (Continued)
The following table presents revenues generated by country or geographical area for the fiscal years ended December 31, 2009, December 26, 2008 and December 28, 2007 (in millions).
| Fiscal Year Ended | |||||||||
| Dec. 31, 2009 |
Dec. 26, 2008 |
Dec. 28, 2007 | |||||||
| (as adjusted) 1/ | (as adjusted) 1/ | ||||||||
| United States |
$ | 1,340.7 | $ | 1,861.1 | $ | 1,731.1 | |||
| Foreign revenues |
|||||||||
| Mideast |
77.3 | 11.5 | 7.8 | ||||||
| Europe |
33.2 | 54.0 | 44.0 | ||||||
| Russia/China |
32.9 | 43.9 | 31.7 | ||||||
| Far East |
25.9 | 34.5 | 26.8 | ||||||
| Canada |
13.9 | 19.2 | 18.8 | ||||||
| Mexico |
12.4 | 11.6 | 68.2 | ||||||
| Australia/New Zealand |
10.0 | 12.5 | 7.9 | ||||||
| South America |
9.4 | 9.9 | 6.7 | ||||||
| Africa |
3.1 | 2.8 | 2.3 | ||||||
| All other |
15.4 | 26.5 | 24.5 | ||||||
| Total foreign revenues |
$ | 233.5 | $ | 226.4 | $ | 238.7 | |||
| Total |
$ | 1,574.2 | $ | 2,087.5 | $ | 1,969.8 | |||
1/ Amounts have been adjusted to conform to the current completed service method of revenue recognition for the Stacktrain business unit (see Notes 1 and 2).
All of the foreign revenues are generated by the logistics segment with the exception of Mexico, where the majority of such Mexican revenues are generated by the Company’s intermodal segment Stacktrain operation. All material assets are located in the United States of America. For the year ended December 31, 2009, the Company had one customer contributing 10.0% or more of the Company’s total revenues. The next largest contributing customer in 2009 generated 9.9% of total revenues. For year ended December 26, 2008, the Company had one customer of the intermodal segment that generated 10.5% of the Company’s total revenues. The increase in Mideast revenues in 2009 relates to government military shipments generated by our international unit. The 2008 decline in revenues generated in Mexico was due to the cessation of our rail purchasing activities in Mexico (all of which are now conducted by our U.S. company through direct contracts with the Mexican rail carriers), beginning December 29, 2007 (the end of the 2007 fiscal year). Beginning December 30, 2007, our Mexican revenues consist of agency commissions generated by our Mexican subsidiary.
F-26
Table of Contents
PACER INTERNATIONAL, INC. AND SUBSIDIARIES
NOTES TO CONSOLIDATED FINANCIAL STATEMENTS – (Continued)
The following table presents reportable segment information for the fiscal years ended December 31, 2009, December 26, 2008 and December 28, 2007 (in millions):
| Intermodal | Logistics | Corp./Other | Consolidated | |||||||||||||
| Fiscal year ended December 31, 2009 |
||||||||||||||||
| Revenues |
$ | 1,190.7 | $ | 385.6 | $ | - | $ | 1,576.3 | ||||||||
| Intersegment elimination |
(1.8 | ) | (0.3 | ) | - | (2.1 | ) | |||||||||
| Subtotal |
1,188.9 | 385.3 | - | 1,574.2 | ||||||||||||
| Loss from operations 1/ 2/ |
(161.0 | ) | (36.4 | ) | (18.5 | ) | (215.9 | ) | ||||||||
| Depreciation and amortization |
5.3 | 1.3 | 0.2 | 6.8 | ||||||||||||
| Capital expenditures 3/ |
6.5 | 2.4 | 0.3 | 9.2 | ||||||||||||
| Fiscal year ended December 26, 2008 4/ |
||||||||||||||||
| Revenues |
$ | 1,633.2 | $ | 455.9 | $ | - | $ | 2,089.1 | ||||||||
| Intersegment elimination |
(0.6 | ) | (1.0 | ) | - | (1.6 | ) | |||||||||
| Subtotal |
1,632.6 | 454.9 | - | 2,087.5 | ||||||||||||
| Income (loss) from operations 1/ 2/ |
113.5 | (88.1 | ) | (23.4 | ) | 2.0 | ||||||||||
| Depreciation and amortization |
4.5 | 1.5 | 0.2 | 6.2 | ||||||||||||
| Capital expenditures 3/ |
21.7 | 2.7 | 0.4 | 24.8 | ||||||||||||
| Fiscal year ended December 28, 2007 4/ |
||||||||||||||||
| Revenues |
$ | 1,568.3 | $ | 402.1 | $ | - | $ | 1,970.4 | ||||||||
| Intersegment elimination |
(0.1 | ) | (0.5 | ) | - | (0.6 | ) | |||||||||
| Subtotal |
1,568.2 | 401.6 | - | 1,969.8 | ||||||||||||
| Income (loss) from operations |
112.1 | 4.1 | (21.6 | ) | 94.6 | |||||||||||
| Depreciation and amortization |
5.3 | 0.8 | 0.1 | 6.2 | ||||||||||||
| Capital expenditures 3/ |
11.6 | 2.1 | 0.3 | 14.0 | ||||||||||||
Data in the “Corp./Other” column includes corporate amounts (primarily compensation, tax and overhead costs unrelated to a specific segment) and elimination of intercompany balances and subsidiary investment. The Chief Operating Decision Maker does not review assets by segment for purposes of allocating resources and as such they are not disclosed here.
1/ Included in income (loss) from operations for the intermodal segment in 2009 is a goodwill impairment charge of $169.0 million and a gain of $17.5 million related to the new Union Pacific contract arrangements. Included in income (loss) from operations for the logistics segment is a goodwill impairment charge of $31.4 million in 2009 and $87.9 million in 2008 and a gain on the sale of certain truck services assets of $1.4 million in 2009.
2/ Intermodal segment, logistics segment, corporate and consolidated income from operations for the year ended December 31, 2009 included $4.6 million, $1.3 million, $1.3 million and $7.2 million, respectively, of costs associated with severance and lease termination activities. Intermodal segment, logistics segment, corporate and consolidated income from operations for the year ended December 28, 2007 included $1.8 million, $2.1 million, $2.1 million and $6.0 million, respectively, of costs associated with facility closings and other severance activities.
3/ Included in the capital expenditures for 2009, 2008, and 2007, are $4.6 million, $16.6 million, and $10.6 million, respectively, related to the licensing and implementation of the SAP software project ($4.1 million, $14.9 million, and $9.6 million intermodal segment, respectively, and $0.2 million, $1.3 million, and $0.7 million logistics segment, respectively, and $0.3 million, $0.4 million, and $0.3 million corporate, respectively). See Note 11. All other capital expenditure amounts relate to normal computer replacement items.
4/ Intermodal and consolidated amounts have been adjusted to conform to the current completed service method of revenue and cost recognition for our Stacktrain business unit (see Note 2).
F-27
Table of Contents
PACER INTERNATIONAL, INC. AND SUBSIDIARIES
NOTES TO CONSOLIDATED FINANCIAL STATEMENTS – (Continued)
NOTE 11. PROPERTY AND EQUIPMENT
Property and equipment consist of the following at December 31, 2009 and December 26, 2008 (in millions):
| 2009 | 2008 | |||||||
| Railcars |
$ | 26.0 | $ | 26.0 | ||||
| Containers and chassis (in use) |
20.9 | 19.6 | ||||||
| Leasehold improvements and other (including computer hardware and software) |
51.2 | 55.4 | ||||||
| Software under development |
9.6 | 26.2 | ||||||
| Total |
107.7 | 127.2 | ||||||
| Less: accumulated depreciation |
(64.5 | ) | (65.6 | ) | ||||
| Property and equipment, net |
$ | 43.2 | $ | 61.6 | ||||
Depreciation and amortization of property and equipment was $6.8 million, $6.2 million and $6.2 million for the years ended December 31, 2009, December 26, 2008 and December 28, 2007, respectively. The Company retired $3.1 million, $9.7 million and $1.7 million of accumulated depreciation associated with the sale of containers and chassis in 2009, 2008 and 2007, respectively. Equipment under capital lease is included above with a cost of $0.8 million and accumulated amortization of $0.5 million at December 31, 2009.
During 2009, the Company had cash capital expenditures of $9.2 million. Cash capital expenditures in 2009 for the SAP software project totaled $4.6 million. On June 25, 2009, the Company entered into an amendment to its software license agreement with SAP under which the software license was limited to SAP’s financial and accounting applications, which have been successfully implemented by Pacer. In connection with the amendment, Pacer received an aggregate of $22.5 million in reimbursement of capital expenses incurred in connection with the original software license. This amount is included in the proceeds from software license amendment line item in the consolidated statements of cash flows. In connection with this amendment, the Company wrote-off $22.4 million of previously capitalized software and associated costs related to the development of the SAP transportation operations modules. The net amount of the cash received and amounts written-off of $(0.1) million is recorded in the selling, general and administrative expenses line item in the consolidated statements of operations. The cash payment was used to reduce debt and for general corporate purposes. The remaining $4.6 million of cash capital expenditures in 2009 was for normal computer replacement items. The Company received $0.6 million from the sale of containers and chassis and $1.8 million associated with the sale of certain assets of our Pacer Transport business unit, and retired $7.4 million of property during the year, excluding the write-off of the previously capitalized software and associated costs related to the development of the SAP transportation operations modules.
During 2008, the Company had cash capital expenditures of $24.8 million. Cash capital expenditures in 2008 for the SAP software project totaled $16.6 million, with an additional $0.9 million accrued in work-in-progress. The Company capitalized $0.7 million of interest related to the SAP software project during 2008. Of the remaining $8.2 million of cash capital expenditures in 2008, $4.6 million was for the purchase of 450 53-foot chassis and $3.6 million was for normal computer replacement items. The Company received $1.8 million from the sale of containers and chassis and retired $9.9 million of property during the year.
During 2007, the Company had cash capital expenditures of $14.0 million. Cash capital expenditures for the SAP software project totaled $10.6 million for 2007, with an additional $0.8 million accrued in work-in-progress. The remaining $3.4 million of capital expenditures in 2007 was for normal computer replacement items. The Company received $0.9 million from the sale of containers and other equipment and retired $1.7 million of property during the year.
F-28
Table of Contents
PACER INTERNATIONAL, INC. AND SUBSIDIARIES
NOTES TO CONSOLIDATED FINANCIAL STATEMENTS – (Continued)
As part of the recapitalization of the Company and its acquisition of Pacer Logistics in May 1999, the Company received $39.6 million in net proceeds from the sale and leaseback of 199 railcars originally purchased in 1998. A deferred gain of $1.6 million was recorded upon sale and is being amortized over the 13-year life of the lease.
NOTE 12. ACCOUNTS PAYABLE AND OTHER ACCRUED LIABILITIES
Accounts payable and other accrued liabilities at December 31, 2009 and December 26, 2008 were as follows (in millions):
| 2009 | 2008 | |||||
| (as adjusted) 1/ | ||||||
| Accounts payable |
$ | 56.6 | $ | 65.7 | ||
| Accrued rail liability |
39.4 | 44.3 | ||||
| Completed contract revenue accrual |
7.8 | - | ||||
| Current deferred gain – UP arrangements |
5.6 | - | ||||
| Accrued equipment maintenance and lease |
5.5 | 5.6 | ||||
| Clean truck incentive |
4.1 | - | ||||
| Accrued insurance |
1.8 | - | ||||
| Accrued freight payable |
3.4 | 6.4 | ||||
| Accrued compensation and benefits |
2.0 | 12.3 | ||||
| Accrued volume rebates payable |
2.4 | 3.2 | ||||
| Severance and facility exit liability |
1.8 | 0.4 | ||||
| Accrued interest payable |
0.4 | 0.3 | ||||
| Accrued administrative costs |
0.5 | 0.2 | ||||
| Accrued dividends payable |
- | 5.2 | ||||
| Uncertain tax positions |
- | 0.6 | ||||
| Other accrued liabilities |
13.4 | 14.4 | ||||
| Total accounts payable and other accrued liabilities |
$ | 144.7 | $ | 158.6 | ||
1/ Prior period amounts have been adjusted due to a change in revenue recognition policies. See the Notes 1 and 2 for further information.
NOTE 13. LEASES
The Company leases doublestack railcars, containers, chassis, tractors, forklifts, data processing equipment and real and other property. Future minimum lease payments under noncancelable leases at December 31, 2009 for the five years subsequent to 2009 and thereafter are summarized as follows (in millions):
| Capital Leases |
Operating Leases | |||||
| 2010 |
$ | 0.3 | $ | 78.4 | ||
| 2011 |
- | 72.0 | ||||
| 2012 |
- | 63.0 | ||||
| 2013 |
- | 48.1 | ||||
| 2014 |
- | 38.6 | ||||
| Thereafter |
- | 45.9 | ||||
| Total minimum payments |
$ | 0.3 | $ | 346.0 | ||
| Less amount representing interest (at an effective rate of 5.85%) |
- | |||||
| Present value of minimum lease payments |
$ | 0.3 | ||||
F-29
Table of Contents
PACER INTERNATIONAL, INC. AND SUBSIDIARIES
NOTES TO CONSOLIDATED FINANCIAL STATEMENTS – (Continued)
Operating leases for railcars contain provisions for automatic renewal for an additional five year period, resulting in a total lease term from lease inception of fifteen years. The above table assumes the automatic renewal and the minimum lease payments reflect the term for the fifteen years from lease inception. If the Company were to provide notice of non-renewal, the minimum lease payments (including the potential guaranteed portion of the residual value which may be payable) would be $78.9 million in 2010, $92.9 million in 2011, $55.3 million in 2012, $40.5 million in 2013, $30.9 million in 2014 and $32.4 million thereafter for a total of $330.9 million.
Rental expense was $115.6 million, $114.5 million and $109.5 million for the fiscal years ended December 31, 2009, December 26, 2008 and December 28, 2007, respectively.
During 2009, the Company returned 2,250 primarily 53-ft. leased containers and sold 597 primarily 53-ft. owned containers, returned 2,396 leased chassis, and sold 709 primarily 48-ft. owned chassis and received 818 primarily 53-ft. leased chassis. During 2009, six leased railcars were destroyed.
During 2008, the Company received 3,079 primarily 53-ft. leased containers and 3,038 53-ft., 48-ft. and 40-ft. primarily leased chassis, and returned 2,423 primarily 48-ft. leased containers, 2,275 primarily 48-ft. and 40-ft. leased chassis, and sold 1,282 48-ft. owned chassis in an effort to more closely align our container and chassis fleets. During 2008, one railcar was destroyed.
The Company receives income from others for the use of its doublestack railcars and containers. These income amounts are included in revenues. Rental income was $49.0 million, $60.9 million and $66.2 million for the fiscal years ended December 31, 2009, December 26, 2008 and December 28, 2007, respectively.
NOTE 14. SUPPLEMENTAL CASH FLOW INFORMATION
Supplemental cash flow information is as follows (in millions):
| Fiscal Year Ended | ||||||||||
| December 31, 2009 |
December 26, 2008 |
December 28, 2007 | ||||||||
| Cash payments (refunds): |
||||||||||
| Interest |
$ | 3.0 | $ | 3.2 | $ | 4.7 | ||||
| Income taxes |
$ | (8.9 | ) | $ | 32.6 | $ | 24.1 | |||
F-30
Table of Contents
PACER INTERNATIONAL, INC. AND SUBSIDIARIES
NOTES TO CONSOLIDATED FINANCIAL STATEMENTS – (Continued)
NOTE 15. EARNINGS (LOSS) PER SHARE
The following table sets forth the computation of earnings (loss) per share-basic and diluted (in millions, except share and per share amounts):
| Fiscal Year Ended | |||||||||||
| December 31, 2009 |
December 26, 2008 |
December 28, 2007 | |||||||||
| (as adjusted) /1 | (as adjusted) /1 | ||||||||||
| Numerator: |
|||||||||||
| Net income (loss) (basic and diluted) |
$ | (174.1 | ) | $ | (16.4 | ) | $ | 54.4 | |||
| Income allocated to participating securities |
- | - | 0.3 | ||||||||
| Net income (loss) available to common stockholders |
$ | (174.1 | ) | $ | (16.4 | ) | $ | 54.1 | |||
| Denominator: |
|||||||||||
| Denominator for earnings (loss) per share-basic- Weighted average common shares outstanding |
34,767,275 | 34,616,598 | 35,587,755 | ||||||||
| Effect of dilutive securities: |
|||||||||||
| Stock options/restricted stock |
- | - | 323,491 | ||||||||
| Denominator for earnings (loss) per share-diluted |
34,767,275 | 34,616,598 | 35,911,246 | ||||||||
| Earnings (loss) per share-basic |
$ | (5.01 | ) | $ | (0.47 | ) | $ | 1.52 | |||
| Earnings (loss) per share-diluted |
$ | (5.01 | ) | $ | (0.47 | ) | $ | 1.51 | |||
1/ Amounts have been adjusted to conform to the current completed service method of revenue and cost recognition for our Stacktrain business unit and ASC Topic 260-10-45 “Earnings Per Share” (see Notes 1 and 2).
Anti-dilutive shares attributable to outstanding stock options and restricted stock were excluded from the calculation of diluted net income per share. For the years ended December 31, 2009, December 26, 2008 and December 28, 2007, the weighted average shares outstanding that were anti-dilutive were 641,021 shares, 577,576 shares and 353,618 shares, respectively.
F-31
Table of Contents
PACER INTERNATIONAL, INC. AND SUBSIDIARIES
NOTES TO CONSOLIDATED FINANCIAL STATEMENTS – (Continued)
NOTE 16. SELECTED QUARTERLY FINANCIAL DATA (UNAUDITED)
The following table sets forth selected quarterly financial data for each of the quarters in 2009 and 2008 (in millions, except per share amounts):
| Quarters | |||||||||||||||
| First | Second | Third | Fourth | ||||||||||||
| Fiscal year ended December 31, 2009 |
|||||||||||||||
| Revenues |
$ | 358.6 | $ | 376.7 | $ | 418.7 | $ | 420.2 | |||||||
| Gross profit 1/ |
27.7 | 36.0 | 45.2 | 46.2 | |||||||||||
| Income (loss) from operations 2/ 3/ |
(223.1 | ) | (11.8 | ) | 0.7 | 18.3 | |||||||||
| Net income (loss) 2/ 3/ |
(177.4 | ) | (7.3 | ) | 0.6 | 10.0 | |||||||||
| Basic earnings (loss) per share |
$ | (5.11 | ) | $ | (0.21 | ) | $ | 0.02 | $ | 0.29 | |||||
| Diluted earnings (loss) per share |
$ | (5.11 | ) | $ | (0.21 | ) | $ | 0.02 | $ | 0.29 | |||||
| Fiscal year ended December 26, 2008 4/ |
|||||||||||||||
| Revenues |
$ | 502.8 | $ | 516.6 | $ | 557.8 | $ | 510.3 | |||||||
| Gross profit 1/ |
73.7 | 74.5 | 82.6 | 63.1 | |||||||||||
| Income (loss) from operations 2/ |
23.1 | 22.9 | 29.3 | (73.3 | ) | ||||||||||
| Net income (loss) 2/ |
13.4 | 13.4 | 20.8 | (64.0 | ) | ||||||||||
| Basic earnings (loss) per share |
$ | 0.39 | $ | 0.39 | $ | 0.60 | $ | (1.84 | ) | ||||||
| Diluted earnings (loss) per share |
$ | 0.38 | $ | 0.39 | $ | 0.59 | $ | (1.84 | ) | ||||||
1/ Gross profit is calculated as revenues less cost of purchased transportation and services and less direct operating expenses including depreciation.
2/ The first quarter of 2009 includes a pre-tax goodwill impairment charge of $200.4 million ($161.0 million after-tax or $4.63 per diluted share) related to both the Company’s intermodal and logistics segments in the amount of $169.0 million and $31.4 million, respectively. The fourth quarter of 2008 includes a pre-tax goodwill impairment charge of $87.9 million ($73.3 million after-tax or $2.11 per diluted share) related to the Company’s logistics segment.
3/ The third quarter of 2009 includes a pre-tax gain of $1.4 million ($0.9 million after-tax or $0.02 per diluted share) from the sale of certain truck services assets and the fourth quarter of 2009 includes a pre-tax gain of $17.5 million ($10.7 million after-tax or $0.31 per diluted share) from the $30 million cash received related to the new Union Pacific contract arrangements. See Note 5.
4/ Prior period amounts have been adjusted due to a change in revenue recognition policies and the adoption of FASB Accounting Standards Codification Topic 260-10-45 “Earnings Per Share.” See the Notes 1 and 2 for further information.
NOTE 17. SUBSEQUENT EVENTS
The Company has evaluated for subsequent events between the balance sheet date of December 31, 2009 and February 23, 2010, the date the financial statements were issued.
F-32
Table of Contents
Pacer International, Inc. and Subsidiaries
Valuation and Qualifying Accounts
(in millions)
| Column A |
Column B | Column C | Column D | Column E | |||||||||||||||
| Description |
Balances at Beginning of Fiscal Period |
Additions (Charged)/ Credited to Income |
Deductions (1) | Other (2) | Balances at End of Fiscal Period |
||||||||||||||
| December 31, 2009 |
|||||||||||||||||||
| Allowance for doubtful |
$ | (4.9 | ) | $ | (2.2 | ) | $ | 3.4 | $ | (0.1 | ) | $ | (3.8 | ) | |||||
| December 26, 2008 |
|||||||||||||||||||
| Allowance for doubtful |
$ | (4.6 | ) | $ | (3.3 | ) | $ | 3.0 | $ | - | $ | (4.9 | ) | ||||||
| December 28, 2007 |
|||||||||||||||||||
| Allowance for doubtful |
$ | (5.3 | ) | $ | (1.9 | ) | $ | 2.6 | $ | - | $ | (4.6 | ) | ||||||
| (1) | Represents write-off of amounts. |
| (2) | Represents recovery of amounts. |
S-1
Table of Contents
EXHIBIT INDEX
| Exhibit |
Document Description | |
| 10.15 | Second Amendment dated November 3, 2009 to Amended and Restated Rail Transportation Agreement, dated as of May 15, 2002, between Union Pacific Railroad Company, Pacer International, Inc. d/b/a Pacer Stacktrain, Inc., American President Lines, Ltd., and APL Co. Pte Ltd. | |
| 10.38 | Pacer International, Inc. 2010 Performance Bonus Plan. | |
| 10.39 | Employment Agreement dated as of September 15, 2003 between RF International, Ltd. and Alan E. Baer. | |
| 10.48 | Employment Agreement dated January 1, 2010 between Pacer International, Inc. and Michael F. Gordon | |
| 10.49 | Employment Agreement dated December 14, 2007 between Pacer Stacktrain, Inc. and Peter K. Baumhefner. | |
| 10.50 | Employment Agreement dated January 1, 2003 between Pacer International, Inc. d/b/a Pacer Stacktrain and Peter A. Mettra. | |
| 10.51 | Employment Agreement dated August 25, 2008 between Pacer Global Logistics, Inc. (now known as Pacer Transportation Solutions, Inc.) and F. Franklin Sutherland. | |
| 10.52 | Settlement Agreement dated September 30, 2009 between Pacer Transportation Solutions, Inc. and Jeffrey R. Brashares. | |
| 10.53 | Separation Agreement and Release of Claims dated December 10, 2009 between Pacer International, Inc. and Michael E. Uremovich. | |
| 14 | Code of Ethics | |
| 21 | Subsidiaries of Pacer International, Inc. | |
| 23 | Consent of Independent Registered Public Accounting Firm | |
| 31.1 | Certification of Daniel W. Avramovich pursuant to Section 302 of the Sarbanes-Oxley Act of 2002 | |
| 31.2 | Certification of Brian C. Kane pursuant to Section 302 of the Sarbanes-Oxley Act of 2002 | |
| 32 | Certification of Daniel W. Avramovich and Brian C. Kane pursuant to 18 U.S.C. Section 1350, as adopted pursuant to Section 906 of the Sarbanes-Oxley Act of 2002 | |