Attached files
| file | filename |
|---|---|
| 8-K - NATIONAL PENN BANCSHARES, INC FORM 8-K - NATIONAL PENN BANCSHARES INC | npb8k.htm |
EXHIBIT 99.1
SLIDE PRESENTATION

2nd Quarter 2012
Earnings Webcast
National Penn Bancshares, Inc.
5

Safe Harbor Regarding Forward Looking Statements
This presentation contains forward-looking information about National Penn Bancshares, Inc. that is intended to be covered by the safe harbor for forward-looking statements
provided by the Private Securities Litigation Reform Act of 1995. Forward-looking statements are statements that are not historical facts. These statements can be identified by
the use of forward-looking terminology such as “believe,” “expect,” “may,” “will,” “should,’’ “project,” ”could,” “plan,’’ “goal,” “potential,” “pro forma,” “seek,” “intend,’’ or “anticipate’’
or the negative thereof or comparable terminology, and include discussions of strategy, financial projections, guidance and estimates (including their underlying assumptions),
statements regarding plans, objectives, expectations or consequences of announced transactions, and statements about the future performance, operations, products and
services of National Penn and its subsidiaries. National Penn cautions readers not to place undue reliance on these statements.
National Penn’s business and operations are subject to a variety of risks, uncertainties and other factors. Consequently, actual results and experience may materially differ
from those contained in any forward-looking statements. Such risks, uncertainties and other factors that could cause actual results and experience to differ from those projected
include, but are not limited to, the following: regulatory requirements or other actions mandated by National Penn’s regulators, recent and ongoing changes to the state and
federal regulatory schemes under which National Penn and other financial services companies operate (including the Dodd-Frank Act and regulations adopted or to be adopted
to implement that Act), deterioration in the credit quality of loans, the effect of credit risk exposure, the geographic concentration of National Penn’s operations, declines in the
value of National Penn’s assets and the effect of any resulting impairment charges, National Penn’s ability to raise capital and maintain capital levels; increases in operating
costs (including those mandated by National Penn’s regulators), competition for personnel and from other financial institutions, variations in interest rates, interruptions or
breaches of National Penn’s security systems, the development and maintenance of National Penn’s information technology, the ability of National Penn and its subsidiaries to
pay dividends, and the nature and frequency of litigation and other similar proceedings to which National Penn may be a party . These risks and others are described in greater
detail in National Penn’s Annual Report on Form 10-K for the fiscal year ended December 31, 2011, as well as in National Penn’s Quarterly Reports on Form 10-Q and other
documents filed by National Penn with the SEC after the date thereof. National Penn makes no commitment to revise or update any forward-looking statements in order to reflect
events or circumstances occurring or existing after the date any forward-looking statement is made.
Non-GAAP Financial Measures
This presentation contains supplemental financial information determined by methods other than in accordance with Accounting Principles Generally Accepted in the United
States of America (“GAAP”). National Penn’s management uses these non-GAAP measures in its analysis of National Penn’s performance. These measures should not be
considered a substitute for GAAP basis measures nor should they be viewed as a substitute for operating results determined in accordance with GAAP. Management believes
the presentation of the following non-GAAP financial measures, which exclude the impact of the specified items, provides useful supplemental information that is essential to a
proper understanding of the financial results of National Penn.
• Tangible common equity excludes goodwill and intangible assets and preferred equity. Banking and financial institution regulators also exclude goodwill and
intangible assets from shareholders’ equity when assessing the capital adequacy of a financial institution. Tangible common equity provides a method to assess
the company’s tangible capital trends.
intangible assets from shareholders’ equity when assessing the capital adequacy of a financial institution. Tangible common equity provides a method to assess
the company’s tangible capital trends.
• Tangible book value expresses tangible common equity on a per-share basis. Tangible book value provides a method to assess the level of tangible net assets on
a per-share basis.
a per-share basis.
• Adjusted net income and return on assets exclude the effects of certain gains and losses, adjusted for taxes when applicable. Adjusted net income and returns
provide methods to assess earnings performance by excluding items that management believes are not comparable among the periods presented.
provide methods to assess earnings performance by excluding items that management believes are not comparable among the periods presented.
• Efficiency ratio expresses operating expenses as a percentage of fully-taxable equivalent net interest income plus non-interest income. Operating expenses
exclude items from non-interest expense that management believes are not comparable among the periods presented. Non-interest income is adjusted to also
exclude items that management believes are not comparable among the periods presented. Efficiency ratio is used as a method for management to assess its
operating expense level and to compare to financial institutions of varying sizes.
Management believes the use of non-GAAP measures will help readers compare National Penn’s current results to those of prior periods as presented in the accompanying
Financial Highlights and financial data tables.
Financial Highlights and financial data tables.
2
6

Q2 2012 Highlights
• Continued strong earnings performance
• Maintained superior asset quality
• Continued to provide increased returns of capital to
our shareholders
our shareholders
• Increased quarterly common stock cash dividend from
$0.07 to $0.09 per share - 5th consecutive increase
$0.07 to $0.09 per share - 5th consecutive increase
• Repurchased 2.2 million common shares
• Enhanced strong capital position providing for future
capital management opportunities.
capital management opportunities.
3
7

Consistent Quarterly Earnings
4
*A Non-GAAP measure.
8

5
*A Non-GAAP measure.
9
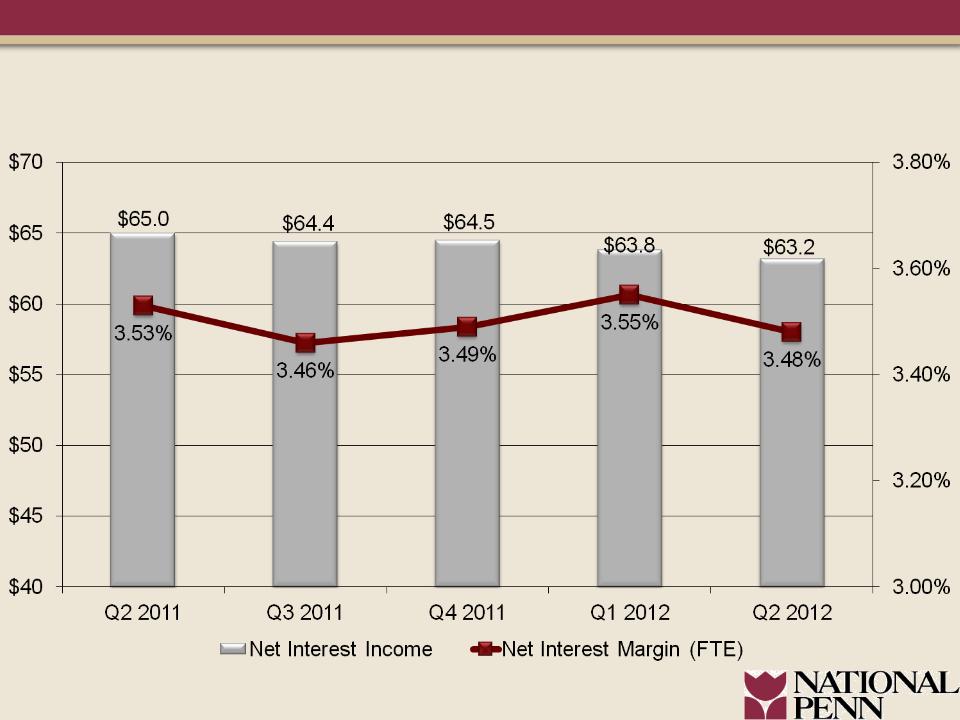
Net Interest Income and Margin
6
($millions)
10
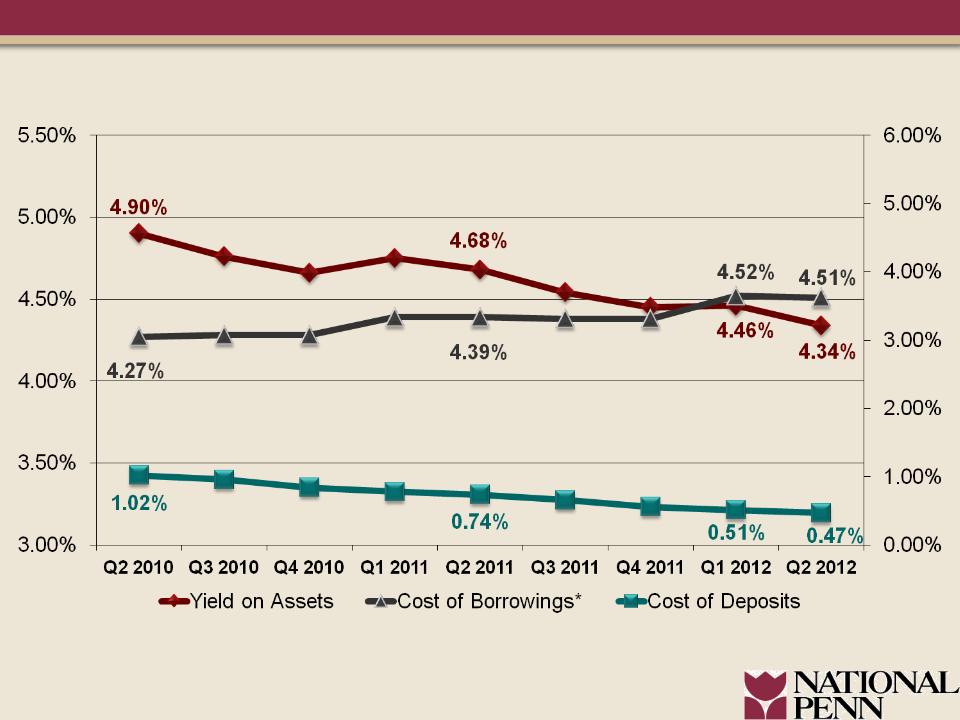
Net Interest Margin Component Trends
7
*Cost of borrowings excludes customer cash management repurchase agreements and subordinated debentures.
11

Loan Trends
8
($millions)
$5,179
$5,161
$5,188
$5,202
$5,211
12
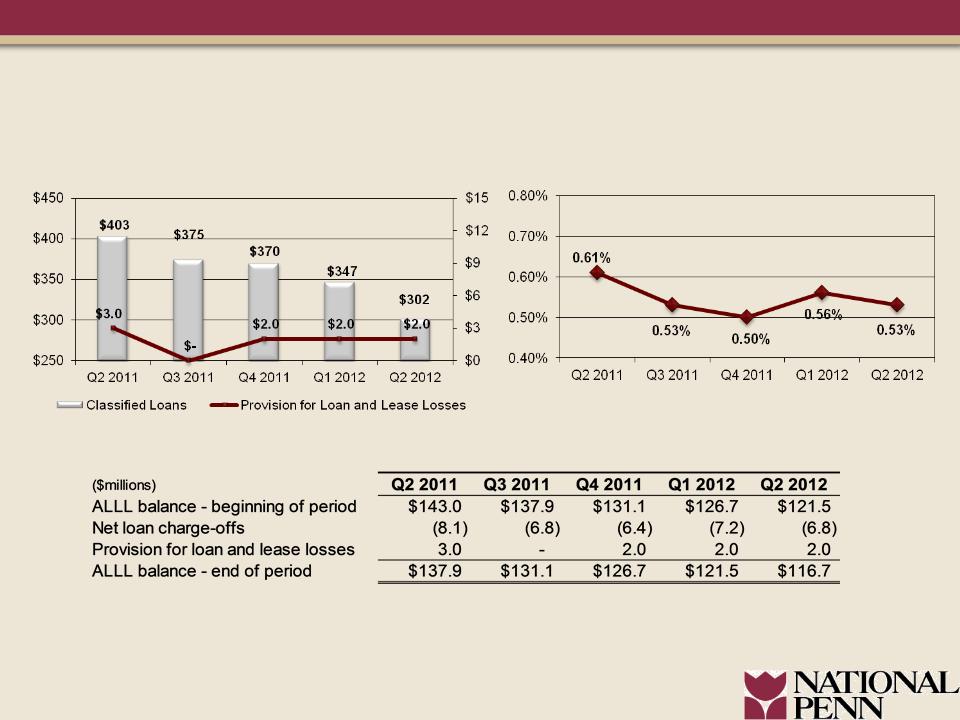
Positive Asset Quality Trends
9
*Annualized
Net Charge-Offs / Average Loans*
($millions)
($millions)
Classified Loans and Provision
13

Strong Asset Quality vs Peers
10
Non-performing loans include non-accrual loans and renegotiated loans
Peer data per SNL as of 3/31/12
Refer to the Appendix for peer listing
Non-Performing Loans as a % of Total Loans
Q1 2012 Peer Average = 2.26%
14

Strong Reserve Coverage vs Peers
11
Non-performing loans include non-accrual loans and renegotiated loans
Peer data per SNL as of 3/31/12
Refer to the Appendix for peer listing
15

Non-Interest Income
12
16

Disciplined Expense Management
13
17

Strong Capital Position
14
18

NPBC Common Share Repurchases
|
Total NPBC common shares repurchased 2Q12
|
2,157,502
|
|
Weighted average repurchase price
|
$8.62
|
|
Total cost of shares repurchased
|
$18.6 million
|
|
|
|
|
Tangible book value per share @ 3.31.12
|
$6.09
|
|
Tangible book value per share @ 6.30.12
|
$6.18
|
15
19

Capital Management Opportunities
($millions)
16
20
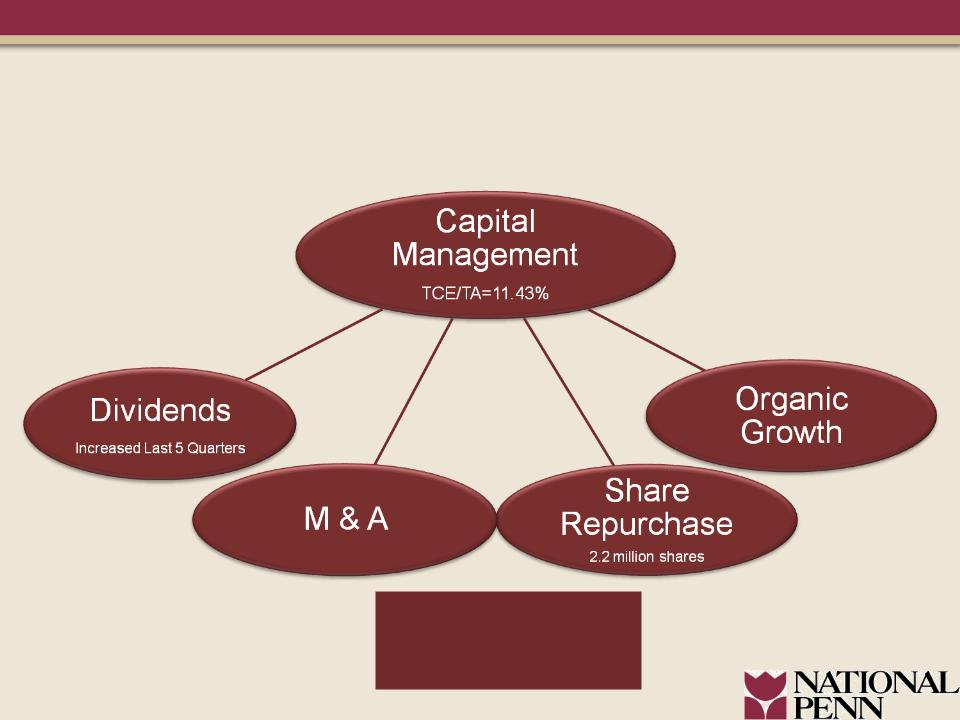
17
Enhancing Shareholder Value Through
Capital Management Opportunities
Capital Management Opportunities
Evaluate Initiatives
Considering Proposed
Capital Regulations
Considering Proposed
Capital Regulations
21

• Utilize strength of balance sheet as competitive
advantage
advantage
• Win market share
• Maintain strong asset quality
• Re-risk appropriately
• Patient and disciplined approach
• Enhance shareholder value
18
Executing on our Strategic Plan
#4 - J.D. Power and
Associates® U.S. Retail
Banking Satisfaction
StudySM for the
Associates® U.S. Retail
Banking Satisfaction
StudySM for the
Mid-Atlantic Region
Forbes - America’s Best and Worst Banks, December 13, 2011.
J.D. Power and Associates® 2012 Retail Banking Satisfaction StudySM, April, 2012.
22

APPENDIX
19
23

NPBC Peer Group- 2009 Proxy Statement*
20
*Note: Wilmington Trust (WL) excluded from peer data beginning with data for 1Q 2011 due to acquisition by M&T.
Whitney Holding Company (WTNY) excluded from peer data beginning with 2Q 2011 due to acquisition
by Hancock Holding Co. (HBHC).
|
Peer
|
Ticker
|
Assets as of 3/31/12
($billions)
|
|
Bancorp South, Inc.
|
BXS
|
$13.3
|
|
F.N.B Corporation
|
FNB
|
11.7
|
|
First Midwest Bancorp, Inc
|
FMBI
|
8.0
|
|
First Niagara Financial Group, Inc.
|
FNFG
|
35.5
|
|
FirstMerit Corporation
|
FMER
|
14.7
|
|
Fulton Financial Corporation
|
FULT
|
16.5
|
|
MB Financial, Inc.
|
MBFI
|
9.7
|
|
Old National Bancorp
|
ONB
|
8.6
|
|
Susquehanna Bancshares, Inc.
|
SUSQ
|
17.8
|
|
Trustmark Corporation
|
TRMK
|
9.9
|
|
Valley National Bancorp
|
VLY
|
16.0
|
|
Wintrust Financial Corp
|
WTFC
|
16.2
|
24

Improved Deposit Mix
21
($millions)
25

NPBC Trust Preferred Securities
(Ticker: NPBCO)
(Ticker: NPBCO)
22
26