Attached files
| file | filename |
|---|---|
| 8-K - USG CORPORATION 8-K - USG CORP | a50353029.htm |
| EX-99.1 - EXHIBIT 99.1 - USG CORP | a50353029_ex991.htm |
Exhibit 99.2
USG Corporation Second Quarter 2012 Earnings Conference Call and Webcast July 25, 2012
Second Quarter 2012 Earnings Call and Webcast 2 Forward-Looking Statements This presentation contains forward-looking statements within the meaning of the Private Securities Litigation Reform Act of 1995 related to management’s expectations about future conditions. Actual business, market or other conditions may differ from management’s expectations and, accordingly, may affect our sales and profitability or other results and liquidity. Actual results may differ due to various other factors, including: economic conditions, such as the levels of new home and other construction activity, employment levels, the availability of mortgage, construction and other financing, mortgage and other interest rates, housing affordability and supply, the levels of foreclosures and home resales, currency exchange rates and consumer confidence; capital markets conditions and the availability of borrowings under our credit agreement or other financings; competitive conditions, such as price, service and product competition; shortages in raw materials; changes in raw material, energy, transportation and employee benefit costs; the loss of one or more major customers and our customers’ ability to meet their financial obligations to us; capacity utilization rates for us and the industry; changes in laws or regulations, including environmental and safety regulations; the outcome in contested litigation matters; our ability to complete surplus asset sales and other divestitures; the effects of acts of terrorism or war upon domestic and international economies and financial markets; and acts of God. We assume no obligation to update any forward-looking information contained in this presentation.
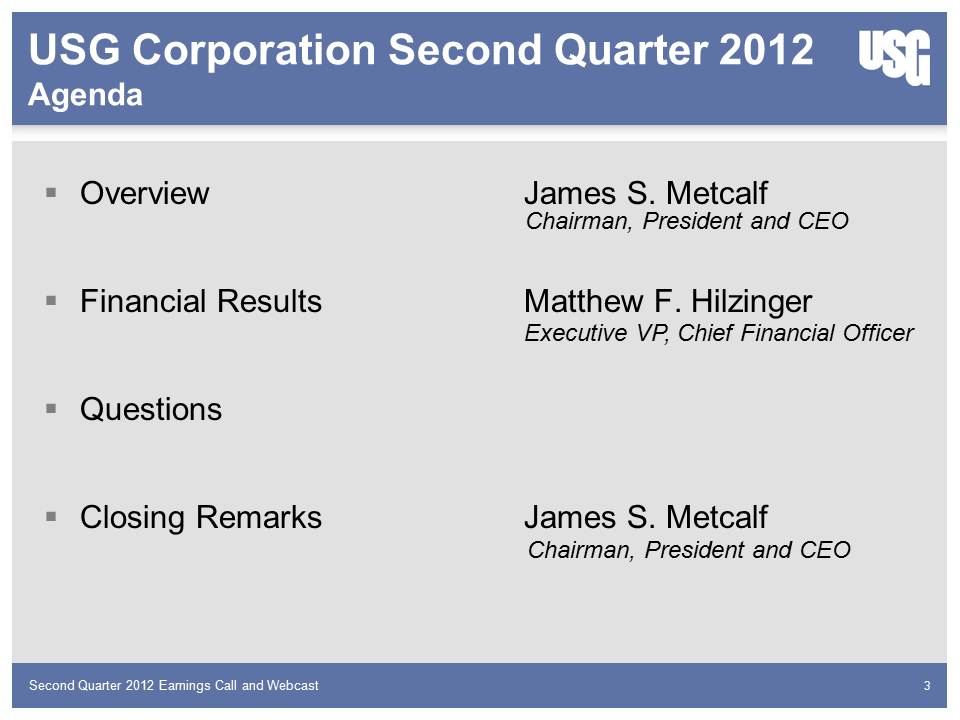
Second Quarter 2012 Earnings Call and Webcast 3 USG Corporation Second Quarter 2012 Agenda Overview James S. Metcalf Financial Results Matthew F. Hilzinger Questions Closing Remarks James S. Metcalf Chairman, President and CEO Executive VP, Chief Financial Officer Chairman, President and CEO
James S. Metcalf Chairman, President and CEO
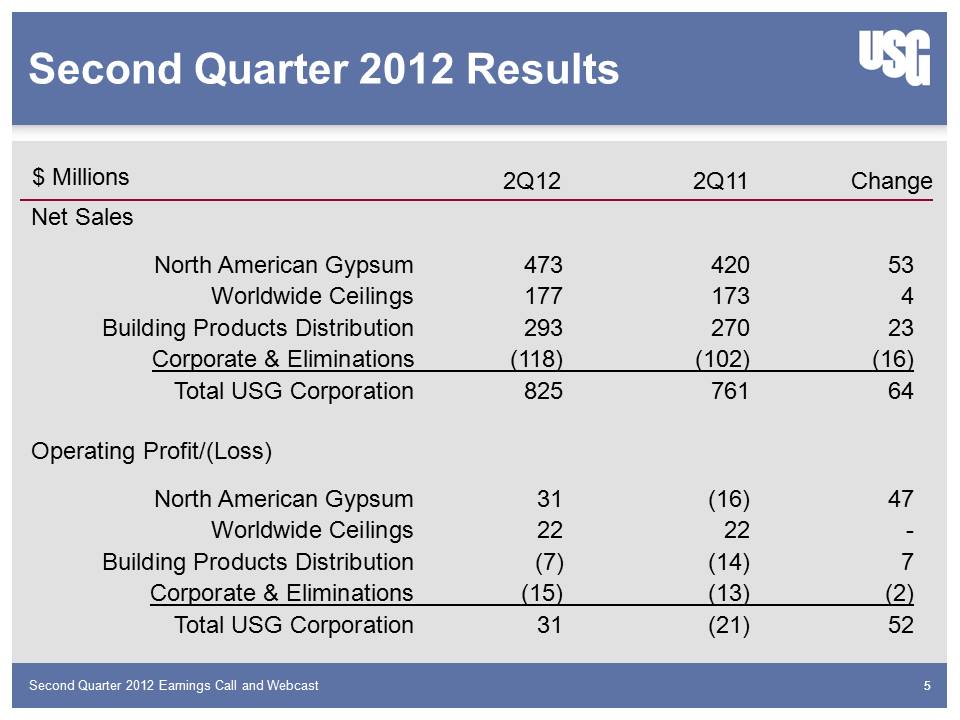
Second Quarter 2012 Earnings Call and Webcast 5 Second Quarter 2012 Results Net Sales North American Gypsum 473 420 53 Worldwide Ceilings 177 173 4 Building Products Distribution 293 270 23 Corporate & Eliminations (118) (102) (16) Total USG Corporation 825 761 64 Operating Profit/(Loss) North American Gypsum 31 (16) 47 Worldwide Ceilings 22 22 - Building Products Distribution (7) (14) 7 Corporate & Eliminations (15) (13) (2) Total USG Corporation 31 (21) 52 $ Millions 2Q11 2Q12 Change
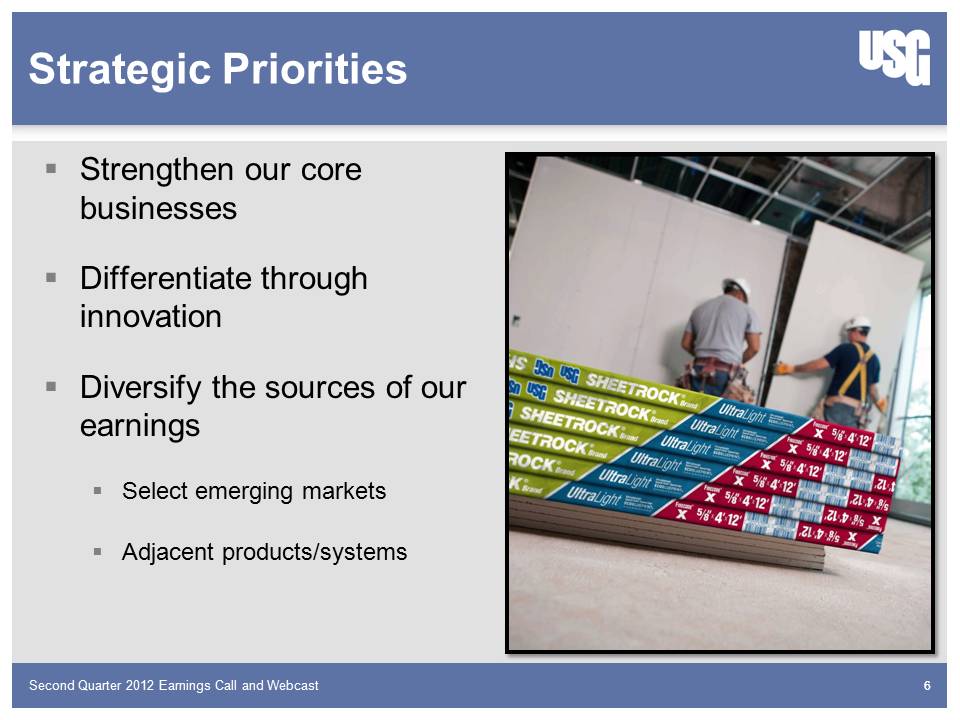
Second Quarter 2012 Earnings Call and Webcast 6 Strategic Priorities Strengthen our core businesses Differentiate through innovation Diversify the sources of our earnings Select emerging markets Adjacent products/systems
Second Quarter 2012 Earnings Call and Webcast Diversify Our Earnings Oman Joint Ventures Secures strategic rock asset in emerging market Fastest entry to Indian wallboard market - ~2 BSF in 2020 Sell rock to established cement industry in India Sell wallboard to current successful Middle East Joint Venture Approximately $60 million in total investment over two years Quarry targeted to be operational in Q3 2013 USG emerging market plant targeted to be operational in Q4 2013 Exploring strategic alternatives for our European operations 7
Second Quarter 2012 Earnings Call and Webcast Creating Our Own Recovery Indicators show modest market improvement Pricing strategy continues to contribute to the bottom line Volume remains steady Sustained penetration by Lightweight products Focus on cost reduction initiatives International expansion – Oman/India Maintain modest upward momentum 8
Matthew F. Hilzinger Executive VP, Chief Financial Officer Financial Results
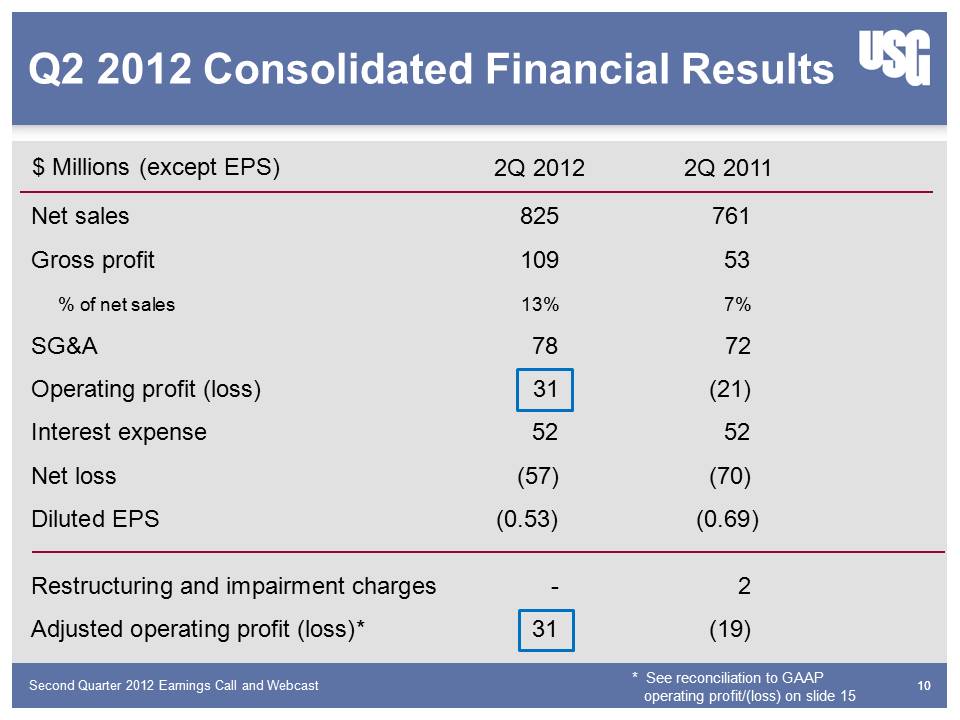
Second Quarter 2012 Earnings Call and Webcast 10 Q2 2012 Consolidated Financial Results Net sales 825 761 Gross profit 109 53% of net sales 13% 7% SG&A 78 72 Operating profit (loss) 31 (21) Interest expense 52 52 Net loss (57) (70) Diluted EPS (0.53) (0.69) Restructuring and impairment charges - 2 Adjusted operating profit (loss)* 31 (19) $ Millions (except EPS) 2Q 2011 2Q 2012 * See reconciliation to GAAP operating profit/(loss) on slide 15
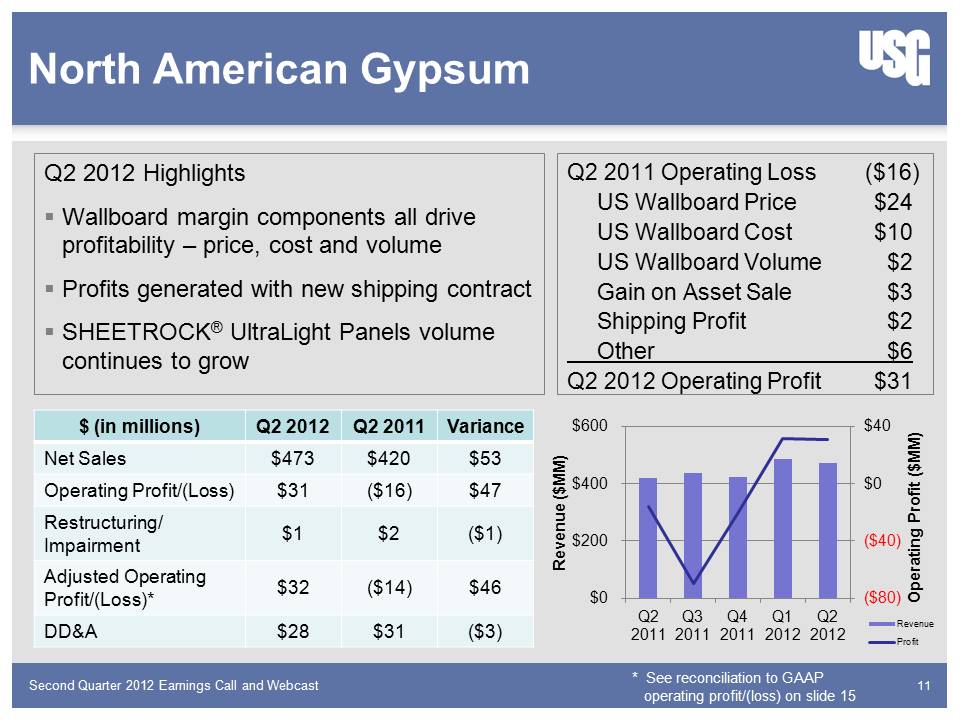
Second Quarter 2012 Earnings Call and Webcast North American Gypsum Q2 2012 Highlights Wallboard margin components all drive profitability – price, cost and volume Profits generated with new shipping contract SHEETROCK® UltraLight Panels volume continues to grow 11 $ (in millions) Q2 2012 Q2 2011 Variance Net Sales $473 $420 $53 Operating Profit/(Loss) $31 ($16) $47 Restructuring/ Impairment $1 $2 ($1) Adjusted Operating Profit/(Loss)* $32 ($14) $46 DD&A $28 $31 ($3) $80) ($40) $0 $40 $0 $200 $400 $600 Q2 2011 Q3 2011 Q4 2011 Q1 2012 Q2 2012Operating Profit ($MM) Revenue ($MM) Revenue Profit Q2 2011 Operating Loss ($16) US Wallboard Price $24 US Wallboard Cost $10 US Wallboard Volume $2 Gain on Asset Sale $3 Shipping Profit $2 Other $6 Q2 2012 Operating Profit $31 * See reconciliation to GAAP operating profit/(loss) on slide 15
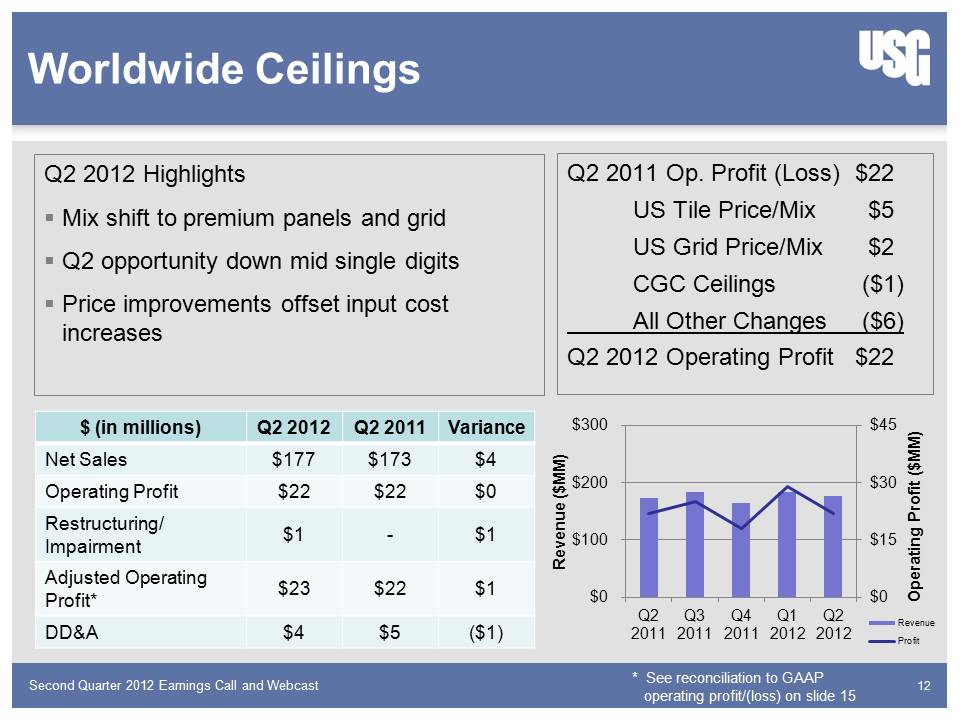
Second Quarter 2012 Earnings Call and Webcast Worldwide Ceilings 12 $0 $15 $30 $45 $0 $100 $200 $300 Q2 2011Q3 2011Q4 2011 Q1 2012 Q2 2012 Operating Profit ($MM) Revenue ($MM) RevenueProfit$ (in millions) Q2 2012 Q2 2011 Variance Net Sales $177 $173 $4 Operating Profit $22 $22 $0 Restructuring/ Impairment $1 - $1 Adjusted Operating Profit* $23 $22 $1 DD&A $4 $5 ($1) Q2 2012 Highlights Mix shift to premium panels and grid Q2 opportunity down mid single digits Price improvements offset input cost increases Q2 2011 Op. Profit (Loss) $22 US Tile Price/Mix $5 US Grid Price/Mix $2 CGC Ceilings ($1) All Other Changes ($6) Q2 2012 Operating Profit $22 * See reconciliation to GAAP operating profit/(loss) on slide 15
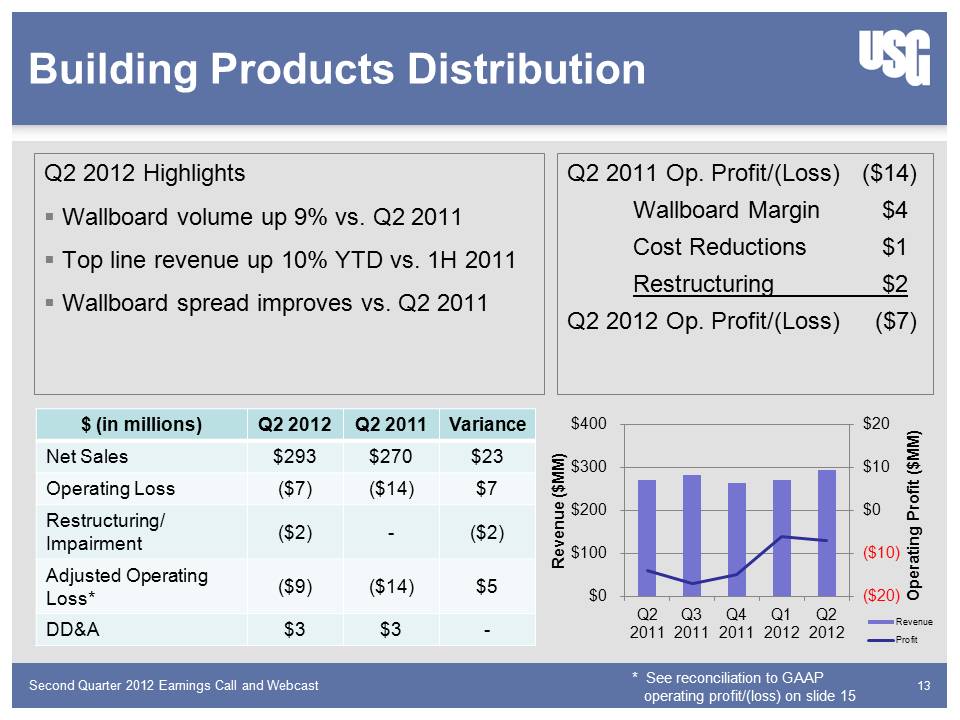
Second Quarter 2012 Earnings Call and Webcast Building Products Distribution 13 ($20) ($10) $0 $10 $20 $0 $100 $200 $300 $400 Q2 2011Q32011Q4 2011 Q1 2012 Q2 2012 Operating Profit ($MM) Revenue ($MM) RevenueProfit$ (in millions) Q2 2012 Q2 2011 Variance Net Sales $293 $270 $23 Operating Loss ($7) ($14) $7 Restructuring/ Impairment ($2) - ($2) Adjusted Operating Loss* ($9) ($14) $5 DD&A $3 $3 - Q2 2012 Highlights Wallboard volume up 9% vs. Q2 2011 Top line revenue up 10% YTD vs. 1H 2011 Wallboard spread improves vs. Q2 2011 Q2 2011 Op. Profit/(Loss) ($14) Wallboard Margin $4 Cost Reductions $1 Restructuring $2 Q2 2012 Op. Profit/(Loss) ($7) * See reconciliation to GAAP operating profit/(loss) on slide 15
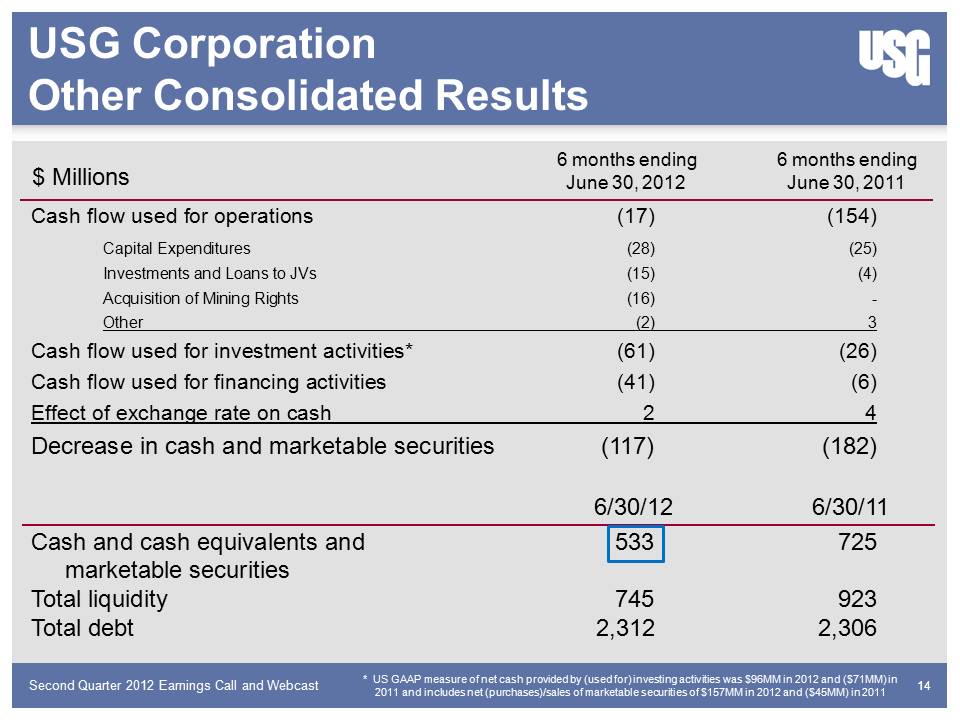
Second Quarter 2012 Earnings Call and Webcast 14 Cash flow used for operations (17) (154) Capital Expenditures (28) (25) Investments and Loans to JVs (15) (4) Acquisition of Mining Rights (16) - Other (2) 3 Cash flow used for investment activities* (61) (26) Cash flow used for financing activities (41) (6) Effect of exchange rate on cash 2 4 Decrease in cash and marketable securities (117) (182) 6/30/12 6/30/11 Cash and cash equivalents and 533 725 marketable securities Total liquidity 745 923 Total debt 2,312 2,306 USG Corporation Other Consolidated Results $ Millions 6 months ending June 30, 2011 6 months ending June 30, 2012 * US GAAP measure of net cash provided by (used for) investing activities was $96MM in 2012 and ($71MM) in 2011 and includes net (purchases)/sales of marketable securities of $157MM in 2012 and ($45MM) in 2011
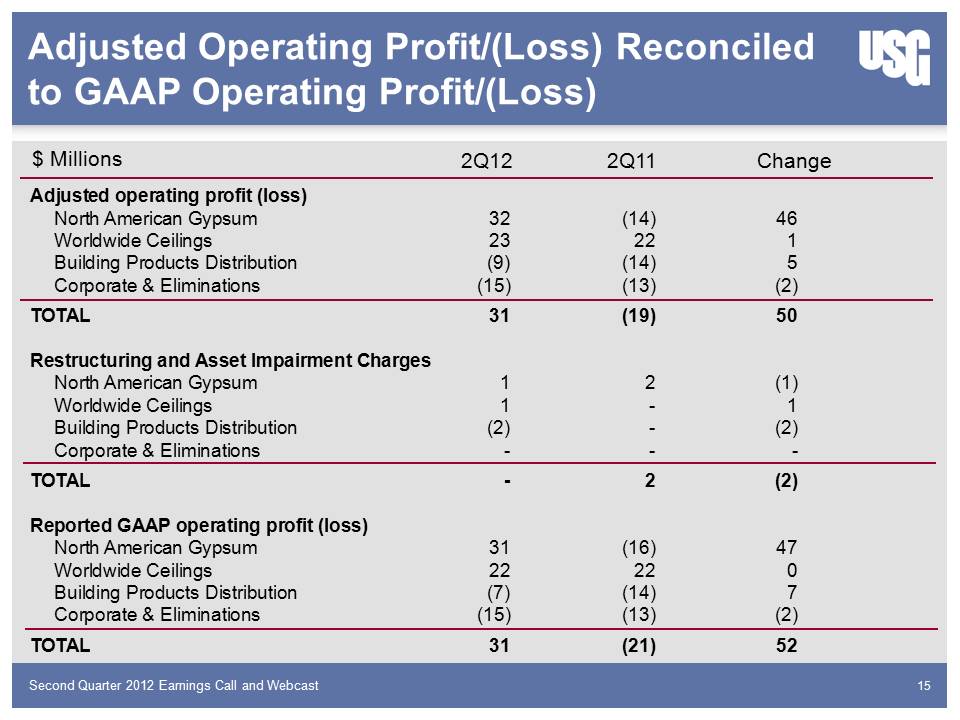
Second Quarter 2012 Earnings Call and Webcast Adjusted Operating Profit/(Loss) Reconciled to GAAP Operating Profit/(Loss) 15 2Q11 2Q12 Adjusted operating profit (loss) North American Gypsum 32 (14) 46 Worldwide Ceilings 23 22 1 Building Products Distribution (9) (14) 5 Corporate & Eliminations (15) (13) (2) TOTAL 31 (19) 50 Restructuring and Asset Impairment Charges North American Gypsum 1 2 (1) Worldwide Ceilings 1 - 1 Building Products Distribution (2) - (2) Corporate & Eliminations - - - TOTAL - 2 (2) Reported GAAP operating profit (loss) North American Gypsum 31 (16) 47 Worldwide Ceilings 22 22 0 Building Products Distribution (7) (14) 7 Corporate & Eliminations (15) (13) (2) TOTAL 31 (21) 52 Change $ Millions
Questions?
James S. Metcalf Chairman, President and CEO Closing Remarks