Attached files
| file | filename |
|---|---|
| 8-K - FORM 8-K - C. H. ROBINSON WORLDWIDE, INC. | d383785d8k.htm |
| EX-99.1 - PRESS RELEASE - C. H. ROBINSON WORLDWIDE, INC. | d383785dex991.htm |
 Earnings Conference Call –
Second Quarter 2012
July 24, 2012
John Wiehoff, Chairman & CEO
Chad Lindbloom, CFO
Angie Freeman, VP Investor Relations
Exhibit 99.2 |
 2
Safe Harbor Statement
Except for the historical information contained herein, the matters set forth in
this presentation and the accompanying earnings release are
forward-looking statements that represent our expectations, beliefs,
intentions or strategies concerning future events. These forward-looking statements are
subject to certain risks and uncertainties that could cause actual results to
differ materially from our historical experience or our present
expectations, including, but not limited to such factors as changes in
economic conditions, including uncertain consumer demand; changes in market demand and
pressures on the pricing for our services; competition and growth rates within the
third party logistics industry; freight levels and increasing costs and
availability of truck capacity or alternative means of transporting
freight,
and
changes
in
relationships
with
existing
truck,
rail,
ocean
and
air
carriers;
changes in
our
customer
base
due
to
possible
consolidation
among
our
customers;
our
ability
to
integrate
the
operations
of
acquired
companies
with
our
historic
operations
successfully;
risks
associated with litigation and insurance coverage; risks associated with operations
outside of the U.S.; risks associated with the potential impacts of changes
in government regulations; risks associated with the produce industry,
including food safety and contamination issues; fuel prices and
availability; the impact of war on the economy; and other risks and uncertainties
detailed in our Annual and Quarterly Reports.
Any forward-looking statement speaks only as of the date on which such
statement is made, and we undertake no obligation to update such statement
to reflect events or circumstances arising after such date. All remarks made
during our financial results conference call will be current at the time of the
call and we undertake no obligation to update the replay.
|
 3
Q2 2012 Results
2012
2011
% Change
2012
2011
% Change
Total revenues
$2,955,714
$2,707,662
9.2%
$5,507,828
$5,073,134
8.6%
Total net revenues
$425,523
$417,866
1.8%
$840,269
$808,207
4.0%
Income from operations
$184,914
$180,095
2.7%
$354,459
$336,810
5.2%
Net income
$114,582
$111,023
3.2%
$221,082
$208,051
6.3%
Earnings per share
(diluted)
$0.71
$0.67
6.0%
$1.36
$1.26
7.9%
Three months ended June 30
Six months ended June 30
In thousands, except per share amounts |
 4
Transportation Results Q2 2012
•
Volume growth and pricing increases in most services.
•
Consolidated transportation net revenue margin declined in the quarter to
10-year low. 2012
2011
% Change
2012
2011
% Change
Total revenues
$2,476,805
$2,269,036
9.2%
$4,653,602
$4,260,058
9.2%
Total net revenues
$369,006
$367,847
0.3%
$736,222
$710,767
3.6%
Net revenue margin
14.9%
16.2%
-8.1%
15.8%
16.7%
-5.2%
Three months ended June 30
Six months ended June 30
TRANSPORTATION in thousands
TRANSPORTATION NET REVENUE MARGIN PERCENTAGE
2002
2003
2004
2005
2006
2007
2008
2009
2010
2011
2012
Q1
17.7%
17.8%
16.8%
17.4%
18.3%
20.2%
18.2%
22.6%
17.4%
17.2%
16.9%
Q2
16.1%
15.9%
15.4%
16.3%
17.1%
17.9%
15.4%
20.6%
15.8%
16.2%
14.9%
Q3
15.6%
16.0%
15.9%
16.3%
17.5%
18.0%
15.9%
19.8%
16.6%
16.4%
Q4
16.2%
15.8%
16.0%
15.7%
18.3%
17.7%
19.0%
18.3%
17.6%
16.3% |
 5
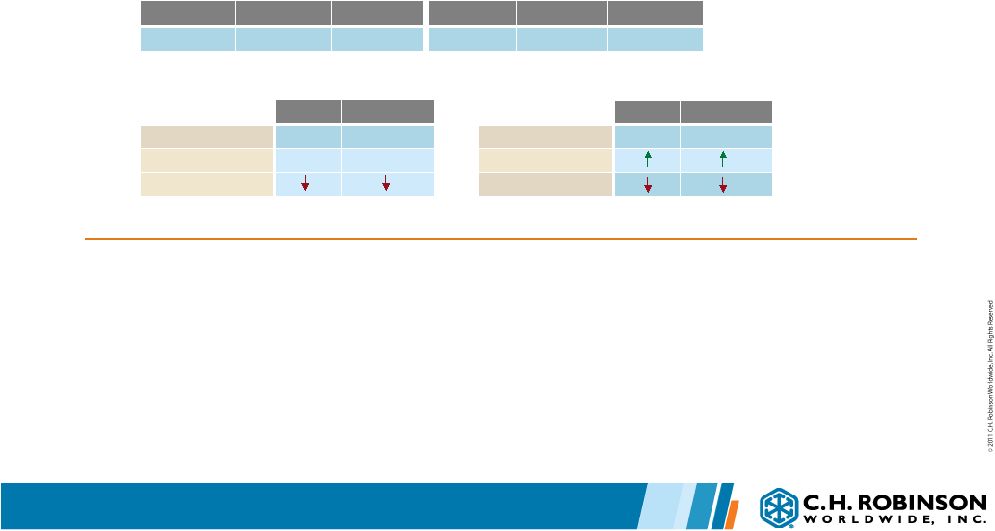
Truck Results Q2 2012
2012
2011
% Change
2012
2011
% Change
$312,638
$314,302
-0.5%
$628,047
$608,802
3.2%
Three months ended June 30
Six months ended June 30
TRUCK NET REVENUES in thousands
Quarter
Year to Date
Volume
10%
9%
Pricing *
1%
1%
Net revenue margin
TRUCKLOAD
Quarter
Year to Date
Volume
17%
15%
Pricing
Net revenue margin
LTL
Year over year change
Year over year change
*Excluding estimated impact of fuel
•
Strong Truckload volume growth offset by net revenue margin decline.
•
Truckload cost per mile increased faster than price per mile. Fuel not a factor in
net revenue margin •
Less-than-Truckload net revenue growth of approximately 12 percent driven
primarily by volume growth, partially offset by decreased net revenue
margin. compression in the second quarter of 2012 compared to the second quarter of 2011. |
 6
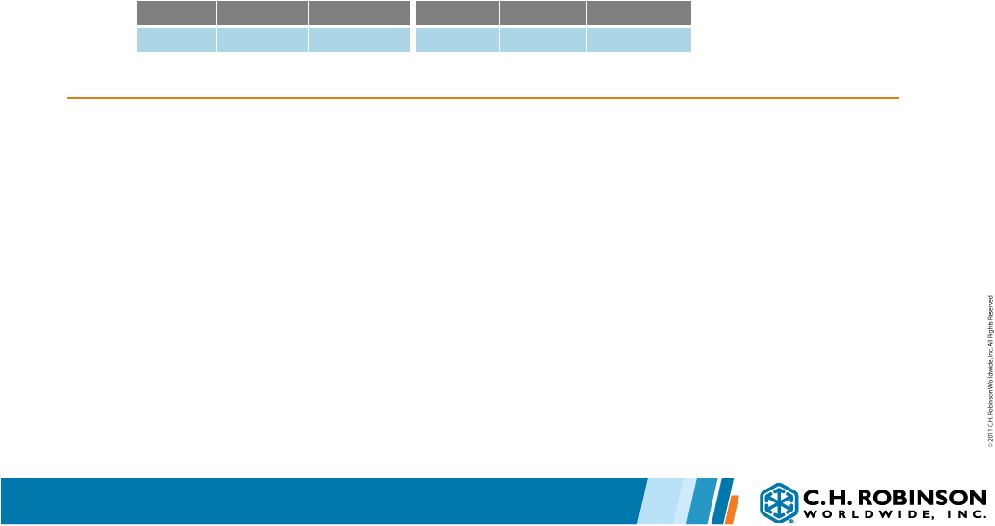
Intermodal Results Q2 2012
•
Net revenue decline due to net revenue margin compression, partially offset by
volume growth. •
Net revenue margin decline due to changing mix of business and increased cost of
capacity. •
Investment in additional 500 containers primarily to replace older leased
equipment. New containers will be put into service by the end of third
quarter 2012. Owned containers continue to support new opportunities and
stronger carrier relationships. 2012
2011
% Change
2012
2011
% Change
$10,019
$10,862
-7.8%
$19,730
$20,462
-3.6%
Three months ended June 30
Six months ended June 30
INTERMODAL NET REVENUES in thousands
Quarter
Year to Date
Volume
Pricing
Net revenue margin
Year over year change |
 7
Ocean & Air Results Q2 2012
2012
2011
% Change
2012
2011
% Change
Ocean
$16,958
$16,400
3.4%
$32,719
$31,970
2.3%
Air
$10,577
$11,435
-7.5%
$19,450
$20,620
-5.7%
Three months ended June 30
Six months ended June 30
NET REVENUES in thousands
Quarter
Year to Date
Volume
Pricing
Net revenue margin
OCEAN
Quarter
Year to Date
Volume
Pricing
Net revenue margin
AIR
Year over year change
Year over year change
•
Ocean net revenue growth due to increased pricing, partially offset by volume
declines. •
Air net revenue decline due to decreased pricing. Air volumes increased and
net revenue margin expanded.
•
Continued volatility in global forwarding marketplace.
|
 8
Other Logistics Services Results Q2 2012
•
Other Logistics Services includes Transportation Management Services, Customs,
Warehousing, and Small Parcel.
•
Transportation Management and Customs primarily drove net revenue growth in the
quarter. •
Continued success with integrated, outsourced logistics arrangements is driving
growth. 2012
2011
% Change
2012
2011
% Change
$18,814
$14,848
26.7%
$36,276
$28,913
25.5%
Three months ended June 30
Six months ended June 30
NET REVENUES in thousands
|
 9
Sourcing Results Q2 2012
•
Sourcing net revenue growth driven by increased volumes and expanded net revenue
margin. •
Excluding Timco, which was acquired on September 26, 2011, we estimate Sourcing
net revenues grew approximately 8% in the quarter.
•
Growth with large customers drove volume increases.
2012
2011
% Change
2012
2011
% Change
Total revenues
$462,597
$423,536
9.2%
$822,327
$783,564
4.9%
Total net revenues
$40,205
$34,929
15.1%
$72,148
$67,928
6.2%
Net revenue margin
8.7%
8.2%
5.4%
8.8%
8.7%
1.2%
Three months ended June 30
Six months ended June 30
SOURCING in thousands |
 10
Payment Services Results Q2 2012
2012
2011
% Change
2012
2011
% Change
$16,312
$15,090
8.1%
$31,899
$29,512
8.1%
Three months ended June 30
Six months ended June 30
PAYMENT SERVICES Net Revenues in thousands
Quarter
Year to Date
Volume
Pricing
Year over year change
•
Net revenue growth due primarily to transaction volume increases.
•
Fuel services, MasterCard
®
, and permit services drove net revenue growth. |
 11
Summarized Income Statement
2012
2011
% Change
2012
2011
% Change
Total net revenues
$425,523
$417,866
1.8%
$840,269
$808,207
4.0%
Operating expenses:
Personnel expenses
$177,184
$178,945
-1.0%
$360,622
$354,054
1.9%
Percent of net revenues
41.6%
42.8%
42.9%
43.8%
Other operating expenses
$63,425
$58,826
7.8%
$125,188
$117,343
6.7%
Percent of net revenues
14.9%
14.1%
14.9%
14.5%
Total Operating expenses
$240,609
$237,771
1.2%
$485,810
$471,397
3.1%
Income from Operations
$184,914
$180,095
2.7%
$354,459
$336,810
5.2%
Percent of net revenues
43.5%
43.1%
42.2%
41.7%
Three months ended June 30
Six months ended June 30
•
For the quarter, operating expenses grew slower than net revenues.
•
Average
headcount
grew
approximately
9%.
•
For the quarter, personnel expense decrease due to declines in incentive
compensation plans that are based on growth in earnings.
•
Other operating expense growth driven primarily by increased travel and claims,
partially offset by a decrease in provision for doubtful accounts.
In thousands
11 |
 12
2012
2011
% Change
2012
2011
% Change
Net cash provided by
operating activities
$32,944
$26,241
25.5%
$110,028
$78,854
39.5%
Capital expenditures, net
$11,150
$10,155
9.8%
$24,970
$19,785
26.2%
Three months ended June 30
Six months ended June 30
Quarter
Year to Date
Shares repurchased
637,261
1,704,978
Average price per
share
$59.23
$63.19
Total cost of shares
repurchased
$37,743
$107,733
June 30, 2012
Cash & investments
$240,627
Current assets
$1,707,601
Total assets
$2,239,999
Current liabilities
$949,341
Stockholders’
investment
$1,278,190
Long term debt
$0
CASH FLOW DATA
2012
BALANCE SHEET DATA
REPURCHASES OF COMMON STOCK
Other Financial Information
In thousands, except share and per share amounts |
 13
Current Period Comments & Summary
•
July 1-
23, 2012:
•
North American Truckload volume growth per business day was approximately
11% •
Total net revenue per business day declined approximately 1.5%
-
Net revenue per business day July 1-23, 2012:
approximately $6.7 million
-
Net revenue per business day July 1-25, 2011:
approximately $6.8 million
-
Net revenue per business day Q3 2011:
$6.6 million
•
The economic and freight environments continue to pose challenges.
•
We are adapting, taking market share and aggressively selling.
•
We continue to invest in our growth and competitive position.
•
Our scale and financial stability continue to be important advantages.
|
 |