Attached files
| file | filename |
|---|---|
| 8-K - FORM 8-K - WESTWOOD HOLDINGS GROUP INC | d382852d8k.htm |
 10 Year
Anniversary July 2012
Exhibit 99.1 |
 Key
Objectives: 2002 -
2012
•
Build a firm that transcends a talented founder by creating a world-class research
department supporting multiple products that produce superior returns for our
clients. •
Manage
our
company
the
same
way
as
companies
that
we
would
own
in
our
clients’
portfolios:
•
Generate strong free cash flow
•
High incidence of insider ownership across all levels of the business
•
Shareholder friendly philosophy of sharing excess cash in the form of dividend or
stock buybacks
•
Stable to improving Return on Equity
•
Meaningful dividend payout
•
Strong and improving balance sheet
•
Strong record of value creation
•
Acquire mutual fund assets opportunistically and private wealth businesses selectively
•
Build high quality businesses where demand supports potential for growth
•
Support our community with both time and resources
•
Create shareholder value and perform well vs. our peers and the broad market indices
2 |
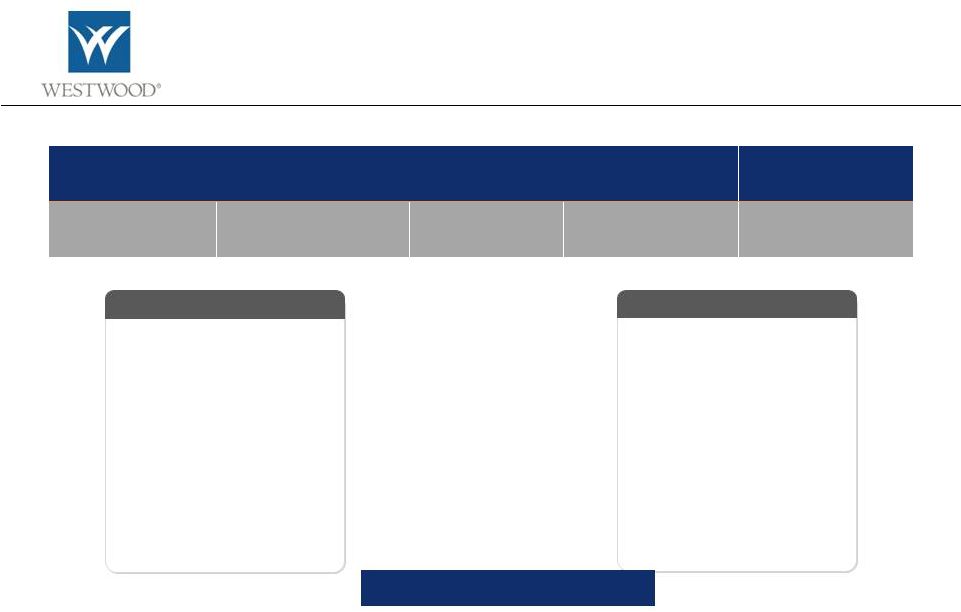 Domestic
Research Groups Westwood
International
Consumer/Health Care
(CASH)
Energy/Materials/Utilities
(EMU)
Financials/REITs
(MONEY)
Industrials/Technology
(CHIPS)
Global
Research
•
43 People
•
Attended schools in 10
states
•
2 countries (US, China)
•
7 CFA Charterholders
•
8 advanced degrees
•
14 Investment Professionals
•
93 People
•
Attended schools in
23 states
•
8 countries
•
28 CFA Charterholders
•
32 Advanced degrees
•
38 Investment Professionals
Long-Term Employee Retention
24 of 43 (55%) people employed in 2002 are still at Westwood*
33 of 52 (63%) people including Omaha are still at Westwood
*Departures: 11 family/retirement; 4 new positions; 4 involuntary
3
Our Employees -
2012
Our Employees -
2002
Create
a
world
class,
independent
Research
Department
staffed
with
talented
professionals |
 Develop and
Support Multiple Product Investment Strategies LargeCap Value
Balanced
Enhanced Balanced
Fixed Income
LargeCap Value –
SRI
REIT
SMidCap Value
AllCap Value
4
Income
Opportunity
MLP
SmallCap
Value
130/30
MidCap
Value
Global
Strategic
Diversification
SMidCap
Value
Plus+
Dividend
Growth
Emerging
Markets
Emerging
Markets
Plus+
Global
Equity
Global
Dividend
New
products
introduced
LargeCap Value
Balanced
Enhanced Balanced
Fixed Income
LargeCap Value –
SRI
REIT
SMidCap Value
AllCap Value
7
16
4
2002
2012
International
Domestic
Investment Strategies Offered |
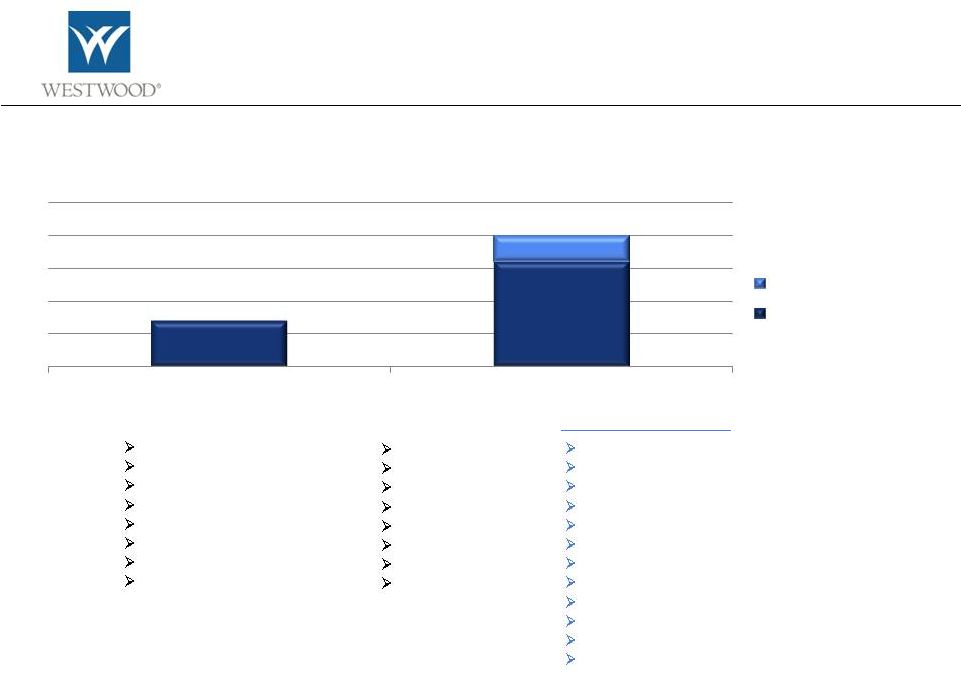
 Generate
Superior Performance for our Clients 5
0%
1%
2%
3%
4%
5%
6%
7%
LargeCap Value
Dividend Growth
AllCap Value
SMidCap Value
Annualized Alpha Generation
July
1,
2002
–
June
30,
2012 |
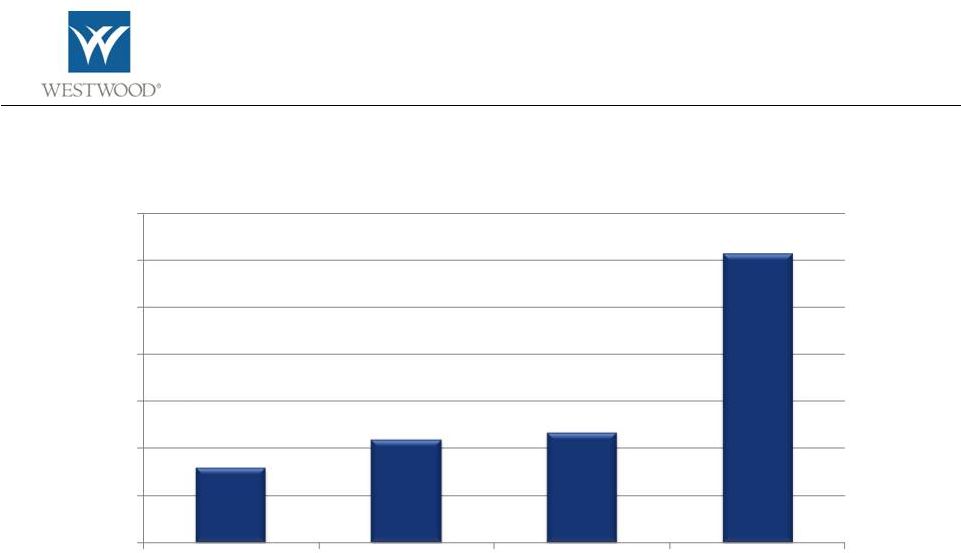
 Generate
Superior Performance for our Clients 6
0%
1%
2%
3%
4%
5%
Income Opportunity
MLP
SmallCap Value
Annualized Alpha Generation of Newer Products
Jan ‘03 –
June ‘12
Jan ‘03 –
June ‘12
Jan ‘04 –
June ‘12
Inception
–
June
30,
2012 |
 Manage
our
company
in
the
same
manner
as
portfolio
companies
Peer
Comparison
Generate strong free cash flow
High incidence of insider ownership across all levels of the business
Shareholder friendly philosophy of sharing excess cash in the form of
dividend or stock buybacks
Stable to improving Return on Equity
Meaningful dividend payout
Strong and improving balance sheet
Strong record of value creation
Westwood
Peer Median
Return on Equity
22.5%
22.1%
Current Yield
4.0%
2.6%
Dividend Payout
68%
42%
Debt/Capital
0%
17%
Insider Ownership
32%
9%
7
Peer group: AB, AMG, ART, BEN, BLK, CLMS, CNS, DHIL, EPHC, EV, FII, GBL, IVZ, JNS, PZN,
TROW, VRTS, WDR |
 Manage
our
company
in
the
same
manner
as
portfolio
companies
8
GAMCO Investors
Third Avenue Management LLC
BlackRock
The Vanguard Group Inc.
Dimensional Fund Advisors, Inc.
Northern Trust Investments
Royce & Associates LLC
State Street Global Advisors
Directors and employees own 32% of Westwood
Shareholders maintaining ownership for the past decade (since inception):
2002
Shareholders maintaining ownership for the past five years:
2007
Insider
Ownership |
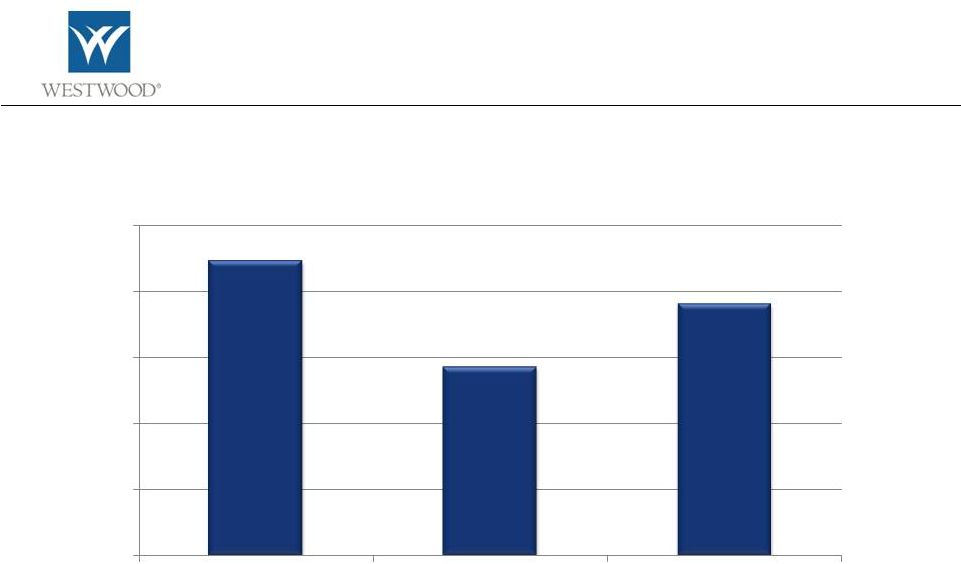
 Quarterly
Dividend History (per share) Excludes special dividends
Manage
our
company
in
the
same
manner
as
portfolio
companies
Support
a
growing
dividend
9
$0.00
$0.20
$0.40
$0.60
$0.80
$1.00
$1.20
$1.40
$1.60
2002
2003
2004
2005
2006
2007
2008
2009
2010
2011
Q4
Q3
Q2
Q1 |
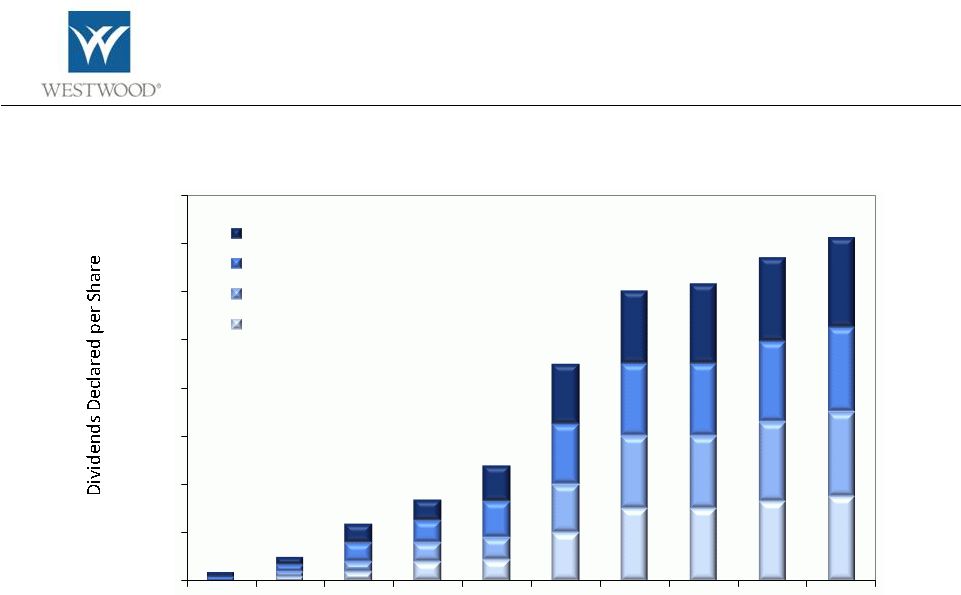
 Manage
our
company
in
the
same
manner
as
portfolio
companies
Dividend
History
($
per
year)
*data as of 6/30/12
•
We have paid total dividends of $82 million since we have been public ($12.02/share)
•
WHG Dividend Yield 4.0% vs. asset management peer group median at 2.6%*
10
$0
$2,000,000
$4,000,000
$6,000,000
$8,000,000
$10,000,000
$12,000,000
$14,000,000
2002
2003
2004
2005
2006
2007
2008
2009
2010
2011
YTD 2012
Special Dividends
Quarterly Dividends |
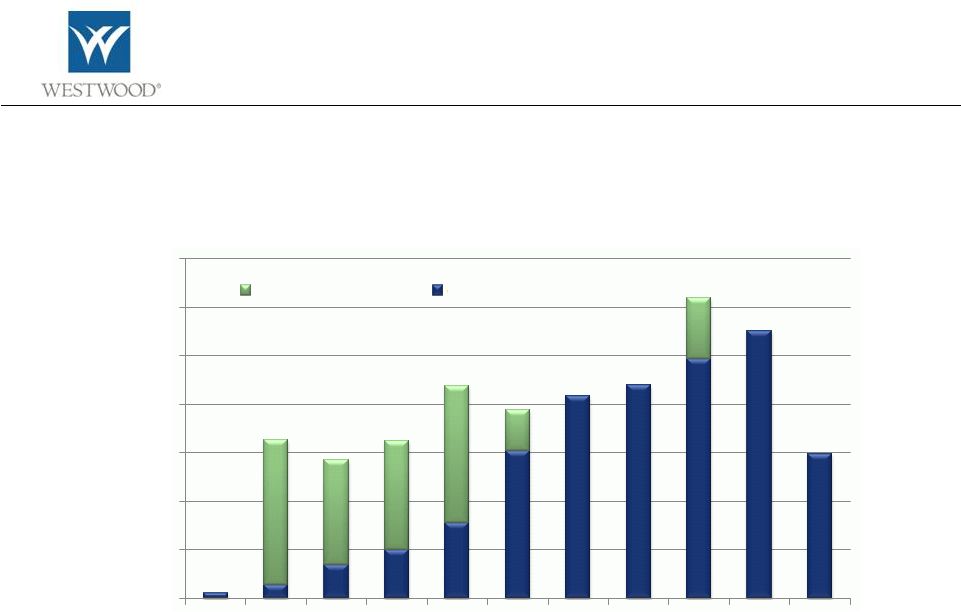
 Manage
our
company
in
the
same
manner
as
portfolio
companies
11
$15
$52
13.0% CAGR
Debt, $0
Debt, $0
$17
$71
15.7% CAGR
$0
$10
$20
$30
$40
$50
$60
$70
$80
6/30/2002
6/30/2012
Cash & Investments
Debt
Shareholders' Equity
Maintain
conservative
and
growing
balance
sheet |
 Philadelphia
Fund McCarthy Group Advisors
12
•
Timely opportunity to purchase assets to enhance asset growth of
Westwood
Funds
•
Attractive, growing market with limited competition
•
Strong cultural alignment of values
•
High average account balances
•
Strong financial operating history
•
Will benefit from our operational efficiencies and product depth
Acquire
mutual
fund
assets
opportunistically
and
private
wealth
businesses
selectively |
 Build
high
quality
businesses
where
demand
supports
potential
for
growth
2002
$0
2012
$1.5 billion
13
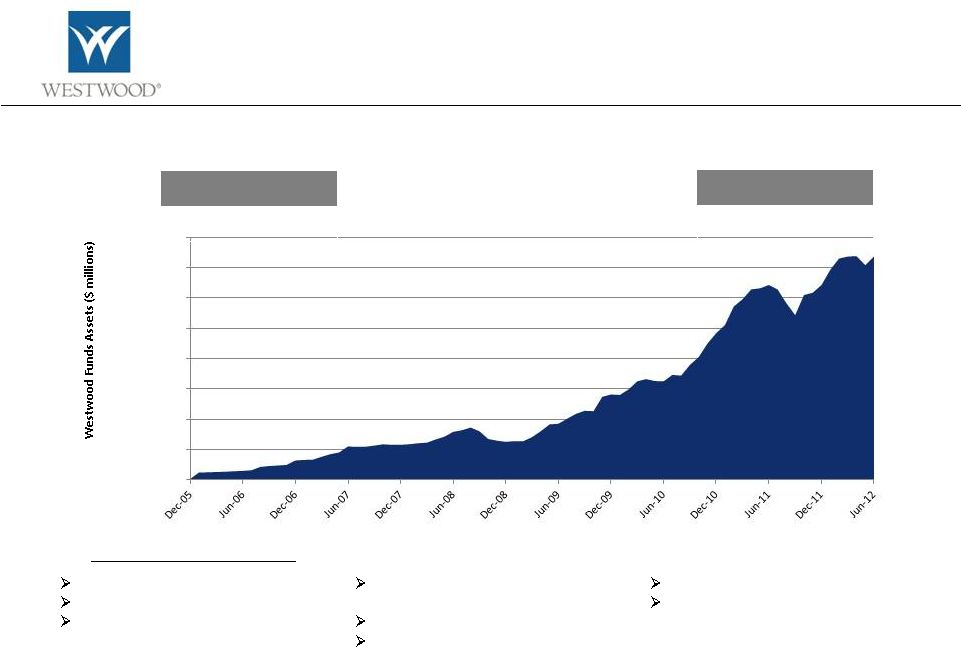
Westwood Funds™
Lineup:
Mutual fund assets have grown to 11% of total AUM
$0
$200
$400
$600
$800
$1,000
$1,200
$1,400
$1,600
Data as of 6/30/2012
Balanced Fund (WHGBX)
Dividend Growth Fund (WHGDX)
Short Duration High Yield Fund
(WHGHX)
Income Opportunity Fund (WHGIX,
WWIAX)
LargeCap
Value Fund (WHGLX, WWLAX)
SMidCap
Fund (WHGMX)
SMidCap
Plus Fund (WHGPX)
SmallCap
Value Fund (WHGSX) |
 Build
high
quality
businesses
where
demand
supports
potential
for
growth
Westwood International Advisors
14
•
Consensus view of Global and Emerging markets as more of an
attractive growth opportunity for investors vs. developed markets
•
Plan sponsors continue to re-balance asset allocation models with
increased allocations to global and emerging market equities
•
Westwood International Advisors team has demonstrated success in
the
past and has been well received by prospective institutional clients
|
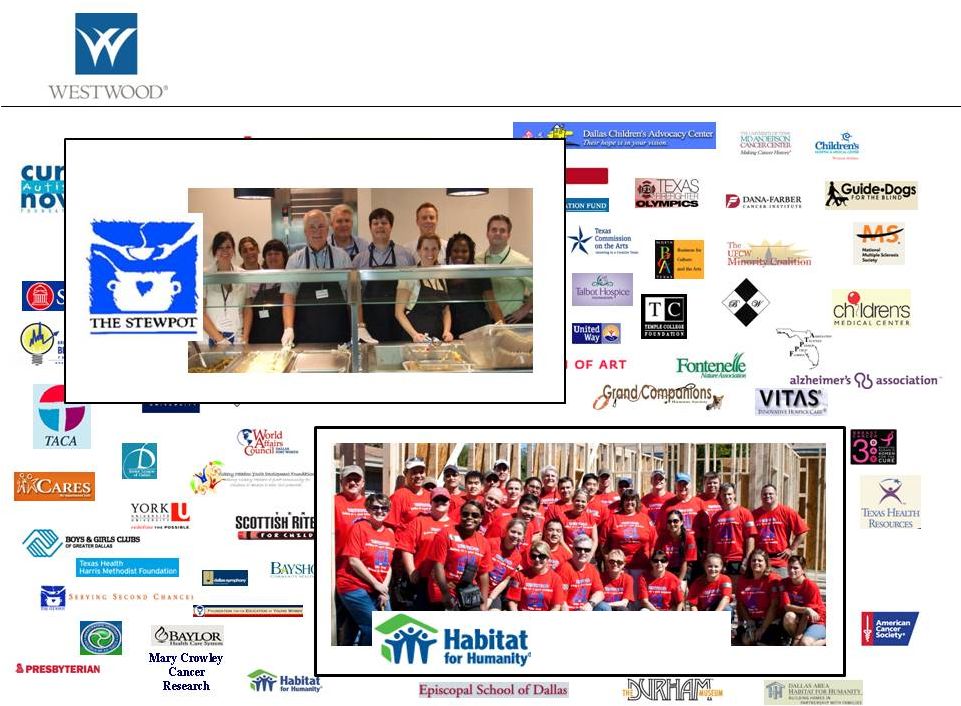 Committed
to
supporting
our
community
with
both
time
and
resources
Served 27,300 meals
15
Sponsored and helped
build 7 houses |
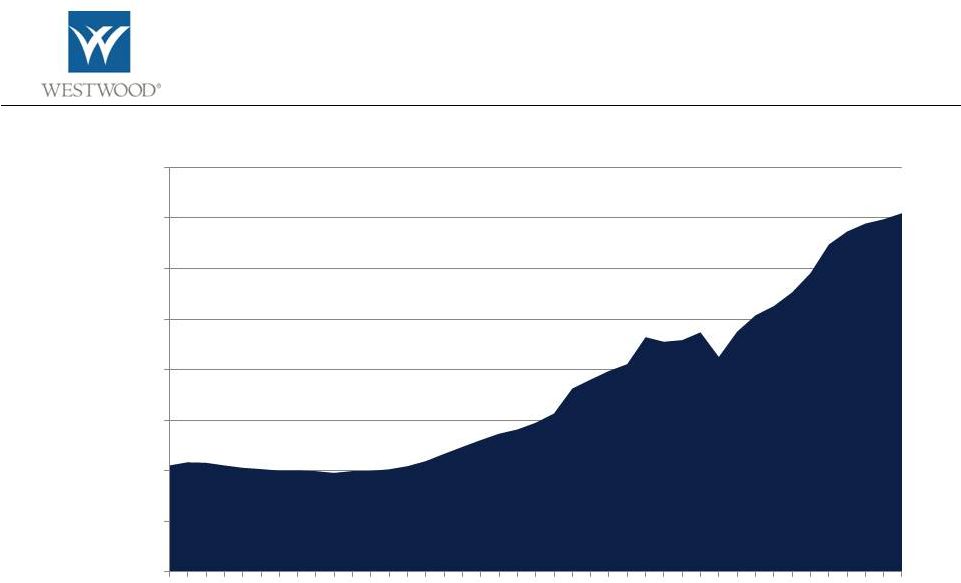 Trailing
twelve months 16
$0
$10,000,000
$20,000,000
$30,000,000
$40,000,000
$50,000,000
$60,000,000
$70,000,000
$80,000,000
Q2
2002
Q4
2002
Q2
2003
Q4
2003
Q2
2004
Q4
2004
Q2
2005
Q4
2005
Q2
2006
Q4
2006
Q2
2007
Q4
2007
Q2
2008
Q4
2008
Q2
2009
Q4
2009
Q2
2010
Q4
2010
Q2
2011
Q4
2011
Q2
2012
Create
shareholder
value
and
perform
well
vs.
peers
and
market
Revenue
History |
 Create
shareholder
value
and
perform
well
vs.
peers
and
market
Market
Cap
History
17
$65
$115
$165
$215
$265
$315
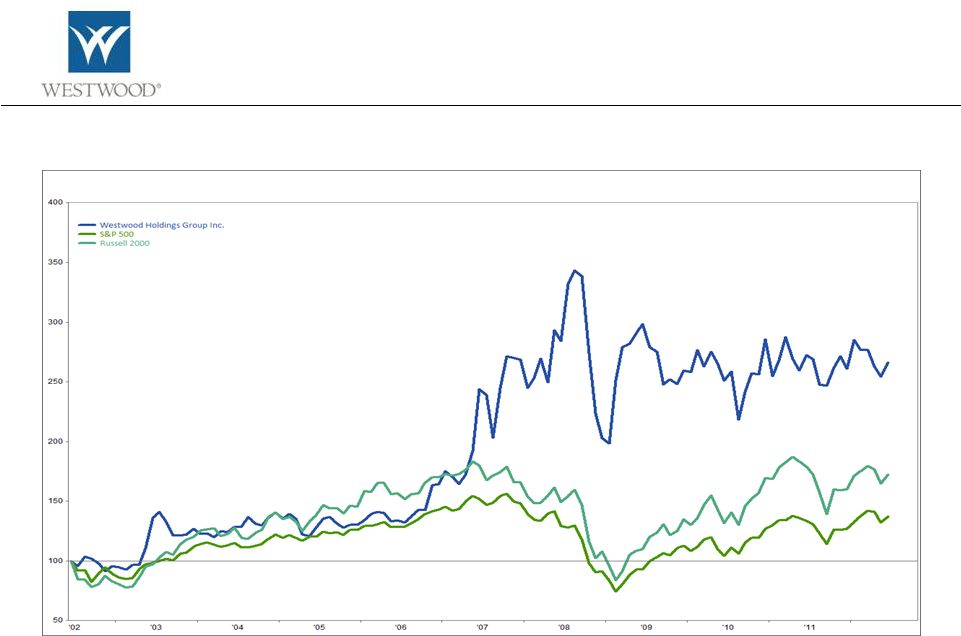
$365 |
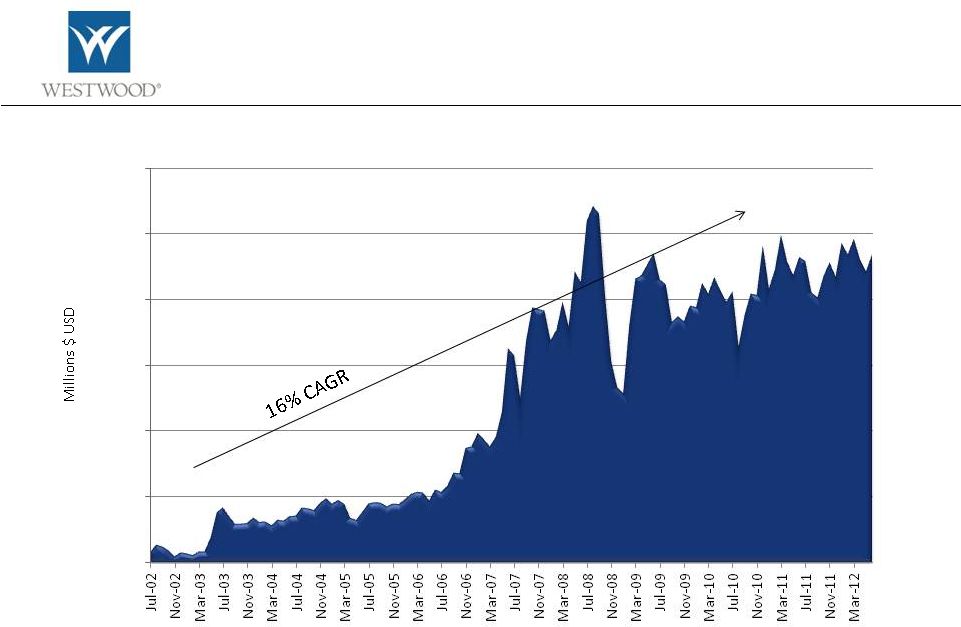
 Market Cap
History WHG vs. S&P 500
Indexed to 100 at 7/31/02
Create
shareholder
value
and
perform
well
vs.
peers
and
market
Market
Cap
History
vs.
broad
market
18
0
50
100
150
200
250
300
350
400
450
500
Jul-02
Jul-03
Jul-04
Jul-05
Jul-06
Jul-07
Jul-08
Jul-09
Jul-10
Jul-11
WHG Market Value (15.7% annual growth)
S&P 500 Market Value (3.9% annual growth) |
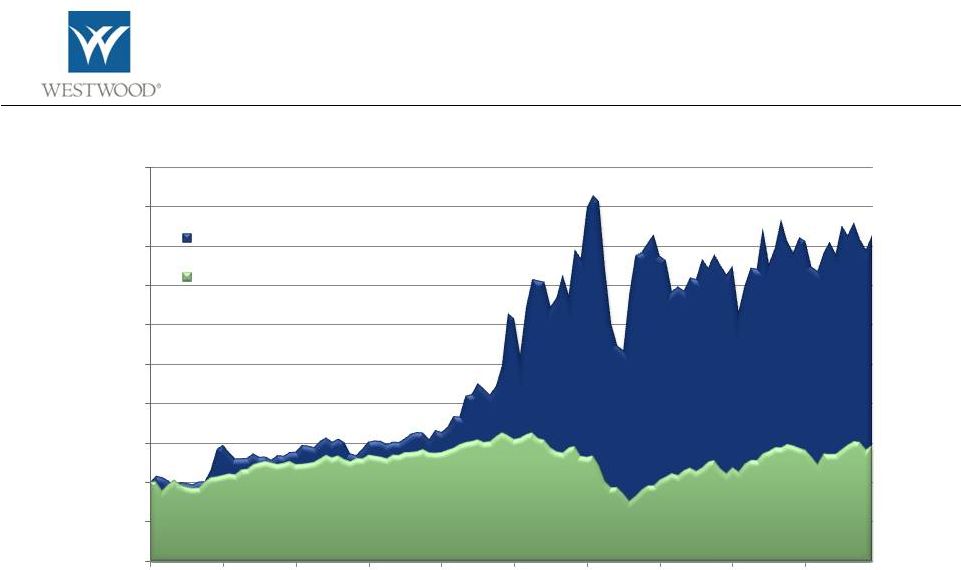
 19
Create
shareholder
value
and
perform
well
vs.
peers
and
market
Performance
Comparison
WHG
vs.
S&P
500
and
Russell
2000
Since listing on the NYSE in June 2002, WHG has outperformed both the S&P 500 and the
Russell 2000 indices Time Period: 6/02 –
6/12
All values indexed to 100
Source: FactSet |
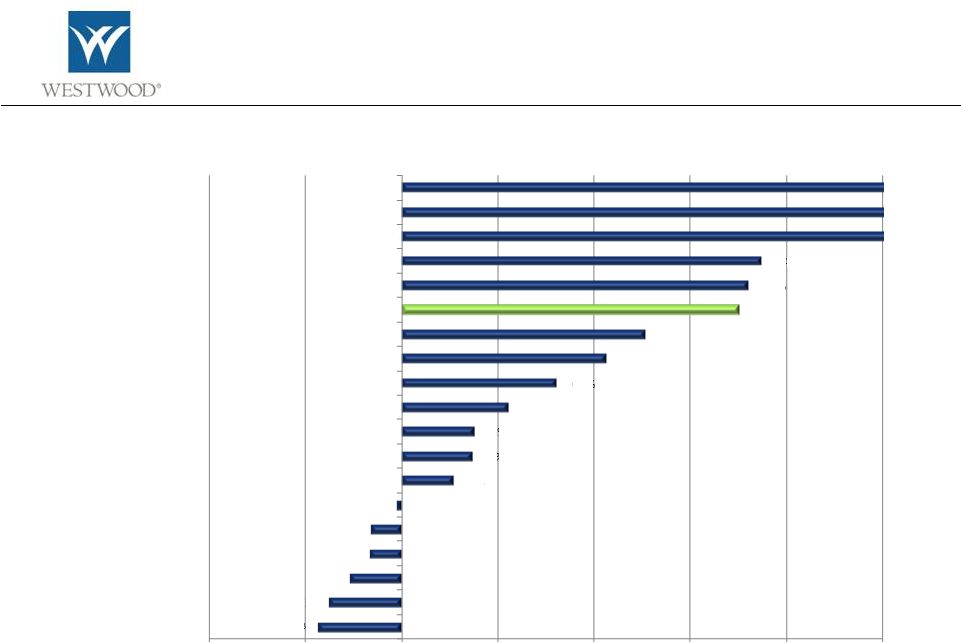 Total Return
Since 2002 WHG Spin-off *data as of 6/30/12
Create
shareholder
value
and
perform
well
vs.
peers
and
market
Create
shareholder
value
together
+
20
Artio Global Investors
Pzena Investment Mgmt
Janus Capital Group Inc.
Calamos Asset Management
AllianceBernstein Holding LP
Federated Investors, Inc.
Gamco Investors
Invesco Ltd.
Waddell & Reed Financial
Eaton Vance Corp.
Affiliated Managers Group
Franklin Resources
Cohen & Steers
WHG
BlackRock, Inc.
T. Rowe Price Group
Virtus Investment Partners
Epoch Holding Corp
Diamond Hill Investment Group
-
200%
-
100%
0%
100%
200%
300%
400%
500%
-86%
-75%
54%
-33%
-32%
-5%
54%
74%
76%
112%
162%
213%
254%
350%
361%
374%
2032%
1739%
671%
- |
 Employees
– 10 years +
21
Susan Byrne
Richard Jarvis
Patricia Fraze
Kellie Stark
Brian Casey
Randy Root
C. J. MacDonald
Michelle Neber
Jackie Finley
Stefanie kennedy
Marcie Russmann
Kim Calhoun
Denise Vermett
Sylvia Fry
Crystal Leiva
Andrea McMahon
Rolanda Williams
Jean Kenkel
Kari Saenz
Mark Freeman
Melissa McMillian
Art Burtscher
Susan Ware
Nora Donnelly
Lisa Dong
Monica Cornwall
Jay Singhania
Susan Burkhard
Bill Hardcastle
Kim Gor
Craig Whitten |
 Employees
– 5 years +
22
Graham
Wong
Todd Williams
Porter Montgomery
David Spika
Scott
Lawson
Laura Willmann
Julie Gerron
Michael Wall
Ragen Stienke
Kara Axley
Nicholas Wilwerding
Nick English
Martha Gummer
Clodette Turner
Mark Dunbar
Joan Bonn
Natalie Harrison |
 Domestic
Equity Strategies SmallCap
Value
1/1/04
SMidCap
Value *
1/1/02
closed
SMidCap
Value Plus+
7/1/10
MidCap
Value
10/1/07
LargeCap
Value
1/1/87
AllCap
Value
7/1/02
Dividend
Growth
11/1/93
Specialized Solutions
Income Opportunity
1/1/03
LargeCap
Value
–
Socially
Responsible Investing
1/1/98
Infrastructure
Renewal
1/1/03
Enhanced Balanced™
1/1/93
*The institutional track record started January 1, 2002.
Westwood
Products
Global/Emerging Markets Strategies
Global Equity
7/1/12
Global Dividend
7/1/12
Emerging Markets
7/1/12
Emerging Markets Plus+
7/1/12
23
Master Limited Partnership |
 Improving
Business Mix 24 |