Attached files
| file | filename |
|---|---|
| EX-32.1 - EXHIBIT 32.1 - WESTWOOD HOLDINGS GROUP INC | exhibit321.htm |
| EX-31.1 - EXHIBIT 31.1 - WESTWOOD HOLDINGS GROUP INC | exhibit311.htm |
| EX-10.3.5 - EXHIBIT 10.3.5 - WESTWOOD HOLDINGS GROUP INC | exhibit1035.htm |
| EX-31.2 - EXHIBIT 31.2 - WESTWOOD HOLDINGS GROUP INC | exhibit312.htm |
| EX-23.1 - EXHIBIT 23.1 - WESTWOOD HOLDINGS GROUP INC | exhibit231.htm |
| EX-23.2 - EXHIBIT 23.2 - WESTWOOD HOLDINGS GROUP INC | exhibit232.htm |
| EX-10.3.7 - EXHIBIT 10.3.7 - WESTWOOD HOLDINGS GROUP INC | exhibit1037.htm |
| EX-32.2 - EXHIBIT 32.2 - WESTWOOD HOLDINGS GROUP INC | exhibit322.htm |
| EX-10.3.6 - EXHIBIT 10.3.6 - WESTWOOD HOLDINGS GROUP INC | exhibit1036.htm |
UNITED STATES
SECURITIES AND EXCHANGE COMMISSION
Washington, D.C. 20549
____________________________________________________________________________
Form 10-K
____________________________________________________________________________
(Mark One)
ý | ANNUAL REPORT PURSUANT TO SECTION 13 OR 15(d) OF THE SECURITIES EXCHANGE ACT OF 1934 |
For the fiscal year ended December 31, 2015
OR
¨ | TRANSITION REPORT PURSUANT TO SECTION 13 OR 15(d) OF THE SECURITIES EXCHANGE ACT OF 1934 |
For the transition period from to
Commission file number 1-31234
____________________________________________________________________________
WESTWOOD HOLDINGS GROUP, INC.
(Exact name of registrant as specified in its charter)
____________________________________________________________________________
Delaware | 75-2969997 | |
(State or other jurisdiction of incorporation or organization) | (I.R.S. Employer Identification No.) | |
200 Crescent Court, Suite 1200 Dallas, Texas 75201 | 75201 | |
(Address of principal executive offices) | (Zip Code) | |
Registrant’s telephone number, including area code: (214) 756-6900
SECURITIES REGISTERED PURSUANT TO SECTION 12(b) OF THE ACT:
Title of each class: | Name of each exchange on which registered: | |
Common Stock, par value $0.01 per share | New York Stock Exchange | |
SECURITIES REGISTERED PURSUANT TO SECTION 12(g) OF THE ACT:
None
____________________________________________________________________________
Indicate by check mark if registrant is a well-known seasoned issuer, as defined in Rule 405 of the Securities Act. Yes ¨ No ý
Indicate by check mark if the registrant is not required to file reports pursuant to Section 13 or Section 15(d) of the Exchange Act. Yes ¨ No ý
Indicate by check mark whether the registrant (1) has filed all reports required to be filed by Section 13 or 15(d) of the Securities Exchange Act of 1934 during the preceding 12 months (or for such shorter period that the registrant was required to file such reports), and (2) has been subject to such filing requirements for the past 90 days. Yes ý No ¨
Indicate by check mark whether the registrant has submitted electronically and posted on its corporate Web site, if any, every Interactive Data File required to be submitted and posted pursuant to Rule 405 of Regulation S-T during the preceding 12 months (or for such shorter period that the registrant was required to submit and post such files). Yes ý No ¨
Indicate by check mark if disclosure of delinquent filers pursuant to Item 405 of Regulation S-K is not contained herein, and will not be contained, to the best of registrant’s knowledge, in definitive proxy or information statements incorporated by reference in Part III of this Form 10-K or any amendment to this Form 10-K. ¨
Indicate by check mark whether the registrant is a large accelerated filer, an accelerated filer, a non-accelerated filer, or a smaller reporting company. See the definitions of “large accelerated filer”, “accelerated filer” and “smaller reporting company” in Rule 12b-2 of the Exchange Act. (Check one):
Large accelerated filer | ¨ | Accelerated filer | ý | |||
Non-accelerated filer | ¨ | Smaller reporting company | ¨ | |||
Indicate by check mark whether the registrant is a shell company (as defined in Rule 12b-2 of the Exchange Act). Yes ¨ No ý
The aggregate market value on June 30, 2015 of the voting and non-voting common equity held by non-affiliates of the registrant was $380,863,476. For purposes of this calculation, the registrant has assumed that stockholders that are not officers or directors of the registrant are not affiliates of the registrant.
The number of shares of registrant’s Common Stock, par value $0.01 per share, outstanding as of February 18, 2016: 8,628,067.
DOCUMENTS INCORPORATED BY REFERENCE
Selected portions of the registrant’s definitive Proxy Statement for the 2016 Annual Meeting of Stockholders, which will be filed with the U.S. Securities and Exchange Commission within 120 days after the end of the fiscal year to which this report relates, are incorporated by reference into Part III hereof.
WESTWOOD HOLDINGS GROUP, INC.
Index
PAGE | ||
i
PART I
Item 1. | Business. |
Unless the context otherwise requires, the term “we,” “us,” “our,” “Westwood,” or “Westwood Holdings Group” when used in this Form 10-K (“Report”) and in the Annual Report to the Stockholders refers to Westwood Holdings Group, Inc., a Delaware corporation, and its consolidated subsidiaries taken as a whole. This Report contains some forward-looking statements within the meaning of the federal securities laws. Actual results and the timing of some events could differ materially from those projected in or contemplated by the forward-looking statements due to a number of factors, including without limitation those set forth under “Item 7. Management’s Discussion and Analysis of Financial Condition and Results of Operations” and “Item 1A. Risk Factors”.
General
We manage investment assets and provide services for our clients through our subsidiaries, Westwood Management Corp. and Westwood Advisors, LLC (together, “Westwood Management”), Westwood International Advisors Inc. (“Westwood International”) and Westwood Trust. Westwood Management, founded in 1983, provides investment advisory services to institutional investors, a family of mutual funds called the Westwood Funds®, other mutual funds, an Ireland-domiciled fund organized pursuant to the European Union’s Undertakings for Collective Investment in Transferable Securities (“UCITS”), individual investors and clients of Westwood Trust. Westwood International was established in 2012 and provides investment advisory services to institutional clients, the Westwood Funds®, other mutual funds, UCITS funds and clients of Westwood Trust. Westwood Trust, founded as a state-chartered trust company in 1974, provides trust and custodial services and participation in self-sponsored common trust funds to institutions and high net worth individuals. Our revenues are generally derived from fees based on a percentage of assets under management. Westwood Management, Westwood International and Westwood Trust collectively managed assets valued at approximately $20.8 billion at December 31, 2015. We were incorporated under the laws of the State of Delaware on December 12, 2001. Our common stock is listed on the New York Stock Exchange under the ticker symbol “WHG.” We are a holding company whose principal assets consist of the capital stock of Westwood Management, Westwood Trust and Westwood International.
The success of our business is very dependent on client relationships. We believe that, in addition to investment performance, client service is paramount in the asset management business. Accordingly, a major business focus is to build strong relationships with clients to enhance our ability to anticipate their needs and satisfy their investment objectives. Our team approach is designed to deliver efficient, responsive service to our clients.
We have focused on building our foundation in terms of personnel and infrastructure to support a larger business. We have developed investment strategies that we expect to be desirable within our target institutional, private wealth and mutual fund markets. Developing new investment strategies and building the organization can result in incurring expenses before significant offsetting revenues are realized. We continue to evaluate new strategies and resources in terms of meeting actual and potential investor needs.
Acquisition of Woodway Financial Advisors
On January 15, 2015, we entered into an agreement (the "Merger Agreement") to acquire Woodway Financial Advisors (“Woodway”), a Houston-based private wealth and trust company that managed assets of approximately $1.6 billion at December 31, 2014. We completed the acquisition on April 1, 2015. Pursuant to the Merger Agreement, on April 1, 2015 Woodway merged with Westwood Trust, a wholly-owned subsidiary of Westwood, with Westwood Trust being the surviving entity (the “Merger”). The total Merger consideration consisted of (i) $30.6 million in cash and stock, as described below, and (ii) contingent consideration equal to the annualized revenue from the post-closing business of Woodway for the twelve-month period ending March 31, 2016 (the “Earn-Out Period”), adjusted for certain clients or accounts that have terminated, and capped at $15 million (the “Earn-Out Amount”).
The Merger consideration of $39.7 million consisted of (i) closing date consideration of $25.3 million paid in cash and the issuance of 109,712 shares of Westwood common stock, valued at $5.3 million (discounted from $6.7 million due to certain required holding periods), and (ii) contingent consideration of $9.1 million, based on estimates and assumptions as of the closing date of the acquisition, to be paid no later than 75 calendar days after the last day of the Earn-Out Period. The acquired assets were deemed to constitute a business in a transaction using the purchase method of accounting for business combinations. Accordingly, the purchase price was allocated to the tangible and intangible assets acquired and the liabilities assumed based on their estimated fair values as of the acquisition date.
1
Available Information
We maintain a website at www.westwoodgroup.com. Information contained on, or connected to, our website is not incorporated by reference into this Report and should not be considered part of this Report or any other filing that we make with the Securities and Exchange Commission (“SEC”). All of our filings with the SEC, including our annual report on Form 10-K, quarterly reports on Form 10-Q, current reports on Form 8-K and any amendments to those reports filed or furnished pursuant to Sections 13(a) or 15(d) of the Securities Exchange Act of 1934, as amended (the "Exchange Act"), are available free of charge on our website. Our Code of Business Conduct, Corporate Governance Guidelines and Audit Committee, Compensation Committee and Governance/Nominating Committee Charters are available without charge on our website. Stockholders also may obtain print copies of these documents free of charge by submitting a written request to Tiffany B. Kice, our Chief Financial Officer, at the address set forth in the front of this Report. The public can also obtain any document we file with the SEC at www.sec.gov.
Advisory
General
Our advisory business is comprised of Westwood Management and Westwood International and encompasses three distinct investment teams – the U.S. Value Team, the Global Convertible Securities Team, and the Global and Emerging Markets Equity Team.
Westwood Management provides investment advisory services to large institutions, including corporate retirement plans, public retirement plans, endowments and foundations. Institutional separate account minimums vary by investment strategy and generally range from $5 million to $25 million. Westwood Management also provides advisory services to individuals, the Westwood Funds® and UCITS funds, as well as subadvisory services to other mutual funds and pooled investment vehicles. Westwood Management’s investment strategies are managed by the U.S. Value Team, based in Dallas, Texas, and by the Global Convertible Securities Team, based in Boston, Massachusetts. Our investment professionals average fifteen years of investment experience. We believe team continuity and years of experience are among the critical elements required for successfully managing investments.
Westwood International, based in Toronto, Canada, provides investment advisory services to large institutions, pooled investment vehicles and UCITS funds, as well as subadvisory services to the National Bank Westwood Funds, which are mutual funds offered by National Bank of Canada. Institutional separate account minimums vary by investment strategy and generally range from $10 million to $25 million. Westwood International's investment strategies are managed by the Global and Emerging Markets Equity Team. Westwood International has entered into a Memorandum of Understanding (“MOU”) with Westwood Management pursuant to which Westwood International is considered a “participating affiliate” of Westwood Management as that term is used in relief granted by the staff of the SEC allowing U.S. registered investment advisers to use portfolio management or research resources of advisory affiliates subject to the supervision of a registered adviser. Pursuant to the MOU, Westwood International professionals provide advisory and subadvisory services to certain Westwood Funds®, pooled investment vehicles and large U.S. institutions under the supervision of Westwood Management.
Investment Strategies
We offer a broad range of investment strategies, which allows us to serve a variety of client types with different investment objectives. We currently manage five investment strategies each with over $1 billion in assets under management, including our Income Opportunity, LargeCap Value, SMidCap Value, Emerging Markets and Emerging Markets Plus strategies.
U.S. Value Team
The U.S. Value team employs a value-oriented approach. The common thread that permeates the team's strategies is a disciplined approach to controlling risk and preserving client assets whenever possible. The team seeks to invest in companies with high levels of free cash flow, improving returns on equity and strengthening balance sheets that are well positioned for growth but whose value is not fully recognized in the marketplace. Through investments in companies that exhibit these characteristics, we seek to generate consistently superior performance relative to our industry peers and relevant benchmark indices. This investment approach is intended to preserve capital during unfavorable periods and provide superior real returns over the long term. We believe that we have established a track record of delivering competitive risk-adjusted returns for our clients. The principal investment strategies currently managed by the U.S. Value Team are as follows:
2
LargeCap Value: Investments in equity securities of approximately 40-60 seasoned companies with market capitalizations at purchase generally over $7.5 billion. This portfolio is invested in companies where we expect that future profitability, driven by operational improvements, will exceed expectations reflected in current share prices.
Concentrated LargeCap Value: Investment in equity securities of approximately 15-30 companies with market capitalizations at purchase generally over $5 billion. This portfolio is invested in companies where we expect that future profitability, driven by operational improvements, will exceed expectations reflected in current share prices.
SMidCap Plus+: Investments in equity securities of approximately 45-65 companies with market capitalizations at purchase between $2 billion and $15 billion. Similar to our other value-oriented investment strategies, we seek to discover operational improvements driving earnings growth within small to mid-sized companies that can be purchased at reasonable prices.
SMidCap Value: Investments in equity securities of approximately 50-70 companies with market capitalizations at purchase between $500 million and $8 billion. Similar to our other value-oriented investment strategies, we seek to discover operational improvements driving earnings growth within small to mid-size companies that can be purchased at reasonable prices. This strategy reached its asset capacity in 2010 and is now closed to new investors.
SmallCap Value: Investments in equity securities of approximately 50-70 companies with market capitalizations at purchase between $100 million and $2 billion. Similar to our other value-oriented investment strategies, we seek to invest in high quality companies whose earnings growth is driven by operational improvements not yet fully recognized by the market.
AllCap Value: Investments in equity securities of approximately 50-80 seasoned companies. The portfolio generally comprises our investment professionals’ best ideas for companies with market capitalizations at purchase above $100 million. Similar to our other value-oriented investment strategies, we seek to invest in companies across a broad range of market capitalizations where we expect that future profitability, driven by operational improvements, will be higher than expectations currently reflected in share prices.
Concentrated AllCap Value: Investments in equity securities of approximately 15-30 companies with market capitalization at purchase generally over $100 million. We seek to invest in companies where we expect that future profitability, driven by operational improvements, will be higher than expectations currently reflected in share prices.
Income Opportunity: Investments in dividend-paying common stocks, preferred stocks, convertible securities, master limited partnerships, royalty trusts, REITs and selected debt instruments. This portfolio’s strategy focuses on companies with strong and improving cash flows able to support sustainable or rising income streams. This strategy is targeted towards investors seeking current income, a competitive total return and low volatility via dividend-paying or interest-bearing securities.
Worldwide Income Opportunity: Investments in a diversified group of global income-producing companies that may include market capitalizations of any size, global preferred equity, global convertible preferred, global fixed income, global REITs, Royalty Trusts, MLPs and cash. This portfolio's strategy focuses on companies with strong and improving cash flow sufficient to support sustainable or rising income streams.
Master Limited Partnership Infrastructure Renewal (“MLPs”): Investments include MLPs (including limited partnerships and general partnerships) and other securities, focusing on partnerships that exhibit higher distribution yields, stable and predictable cash flows, low correlations to other asset classes, and growth potential.
3
Global Convertible Securities Team
The Global Convertible Securities Team manages both long-only and liquid alternative global convertible securities strategies employing a disciplined investment process and rigorous risk management. The team's investment philosophy is based on the following beliefs:
• | the asymmetric return profile of balanced convertible bonds can provide superior risk-adjusted returns over medium- to long-term time horizons; |
• | convertible securities markets are inefficient and opportunities exist to benefit from pricing anomalies; |
• | a global focus provides more robust opportunities and a clearer picture of the broad convertibles universe; and |
• | proprietary fundamental research is the best way to identify solid companies with attractive risk-adjusted return profiles. |
The team draws on the proprietary fundamental research of all three of Westwood's investment teams in order to identify securities with an attractive risk-adjusted return profile. The principal investment strategies currently managed by the Global Convertible Securities Team are as follows:
Strategic Global Convertibles: This strategy seeks to provide equity-like returns with lower volatility by investing in a balanced portfolio of 60-90 worldwide convertible securities.
Market Neutral Income: This liquid alternative strategy seeks to produce positive absolute returns over a full market cycle with low volatility by combining a yield-focused portfolio that invests in high quality, short duration convertible securities with a hedged portfolio utilizing convertible arbitrage and other hedging strategies.
Global and Emerging Markets Equity Team
The Global and Emerging Markets Equity Team emphasizes Economic Value Added (EVA) in its investment process and seeks to identify mispriced businesses that can generate sustainable earnings growth. The team offers global and emerging markets equity investment strategies. The principal investment strategies currently managed by the Global and Emerging Markets Equity Team are as follows:
Emerging Markets: This strategy invests in the common stocks of 70-90 companies that are located or have primary operations in emerging markets with market capitalizations above $500 million. The portfolio is invested in companies that we believe represents sound businesses that are mispriced and can generate sustainable earnings growth.
Emerging Markets Plus: This strategy invests in the common stocks of 50-70 companies that are located or have primary operations in emerging markets and have market capitalizations above $1.5 billion. The portfolio is invested in companies that we believe represent sound businesses that are mispriced and can generate sustainable earnings growth.
Emerging Markets SMid: This strategy invests in the common stocks of 70-90 small- and mid-cap companies that are located or have primary operations in emerging markets and have market capitalizations between $150 million and $9 billion. The portfolio is invested in companies that we believe are sound businesses that are mispriced and can generate sustainable earnings growth.
Global Equity: This strategy invests in the common stocks of 65-85 companies located throughout the world, with market capitalizations above $1 billion. Similar to our Emerging Markets strategy, the portfolio invests in companies that we believe are sound businesses that are mispriced and can generate sustainable earnings growth.
Global Dividend: This strategy invests in the common stocks of 65-90 well-established companies around the world, with an emphasis on sustainability and growth of dividends. It seeks to invest in strong franchises that we believe are mispriced, with good liquidity, the ability to generate sustainable economic profits and potentially pay dividends.
4
Our ability to grow assets under management is primarily dependent on our ability to generate competitive investment performance, our success in building strong relationships with investment consulting firms and other financial intermediaries, as well as our ability to develop new client relationships while nurturing existing relationships. We continually seek to expand assets under management by growing our existing investment strategies, as well as identifying and developing new ones. We intend to grow our investment strategies internally but may also consider acquiring new investment strategies from third parties, as discussed under “Growth Strategy” below. Our growth strategy provides clients with more investment opportunities and diversifies our assets under management, thereby reducing risk in any one area of investment and increasing our competitive ability to attract new clients. Our ten largest clients accounted for over 20% of our fee revenues for the year ended December 31, 2015. The loss of some or all of these large clients could have a material adverse effect on our business and our results of operations.
Advisory and Subadvisory Agreements
Westwood Management and Westwood International manage client accounts under investment advisory and subadvisory agreements. Typical for the asset management industry, these agreements are usually terminable upon short notice and provide for compensation based on the market value of client assets under management. Westwood’s advisory fees are paid quarterly in advance based on assets under management on the last day of the preceding quarter, quarterly in arrears based on assets under management on the last day of the previous quarter, or are based on a daily or monthly analysis of assets under management for the stated period. A few clients have contractual performance-based fee arrangements, which generate additional revenues if we outperform a specified index over a specific period of time. Revenue for performance-based fees is recorded at the end of the measurement period. Revenue from advance payments is deferred and recognized over the period that services are performed. Pursuant to these agreements, Westwood provides overall investment management services, including directing investments in conformity with client-established investment objectives and restrictions. Unless otherwise directed in writing by clients, Westwood has the authority to vote all proxies with respect to securities in client portfolios.
Westwood Management and Westwood International are parties to subadvisory agreements with other investment advisors under which they perform similar services under advisory agreements. Our subadvisory fees are generally computed based upon the average daily assets under management and are payable on a monthly basis.
Westwood Management provides investment advisory services to the Westwood Funds® family of mutual funds:
Ÿ Westwood Income Opportunity | Ÿ Westwood MLP & Strategic Energy | ||
Ÿ Westwood SMidCap | Ÿ Westwood Worldwide Income Opportunity | ||
Ÿ Westwood LargeCap Value | Ÿ Westwood Emerging Markets | ||
Ÿ Westwood SmallCap Value | Ÿ Westwood Global Equity | ||
Ÿ Westwood Dividend Growth | Ÿ Westwood Global Dividend | ||
Ÿ Westwood SMidCap Plus+ | Ÿ Westwood Short Duration High Yield* | ||
Ÿ Westwood Strategic Global Convertibles | Ÿ Westwood Opportunistic High Yield* | ||
Ÿ Westwood Market Neutral Income | |||
*Subadvised by SKY Harbor Capital Management, LLC, a registered investment adviser based in Greenwich, Connecticut | |||
As of December 31, 2015, the Westwood Funds® had assets under management of $3.6 billion.
5
Trust
General
Through the combined efforts of the Dallas, Omaha and Houston offices of Westwood Trust, we provide fiduciary and investment services to high net worth individuals and families, non-profit endowments and foundations, public and private retirement plans and individual retirement accounts ("IRAs"). Westwood Trust is chartered and regulated by the Texas Department of Banking. Fees charged by Westwood Trust are separately negotiated with each client and are typically based on assets under management. Clients generally have at least $1 million in investable assets.
Fiduciary Services
Westwood Trust’s fiduciary services include but are not limited to: financial planning, wealth transfer planning, customizable trust services, trust administration and estate settlement. Westwood Trust also provides custodial services, tax reporting, accounting of trust income and principal, beneficiary and retiree distributions and safekeeping of assets.
Investment Services
Westwood Trust utilizes a consultative approach in developing a client’s portfolio asset allocation. Our approach involves examining the client’s financial situation, including their current portfolio of investments, and advising the client on ways to reduce risk, enhance investment returns and strengthen their financial position based on each client’s unique objectives and constraints. Westwood Trust seeks to define and improve risk/return profiles of client investment portfolios by offering a comprehensive investment solution or enhancing clients’ existing investment strategies. Westwood Trust manages separate portfolios of equity and fixed income securities for certain agency and trust clients. Equity portfolios are generally patterned after the institutional strategies offered by Westwood Management or developed by the internal investment team in our Houston Woodway office. Fixed income portfolios consist of targeted laddered portfolios of primarily high quality municipal securities.
Westwood Trust also sponsors several common trust funds in which client assets are commingled to achieve economies of scale. Westwood Trust’s common trust funds fall within two basic categories: personal trusts and employee benefit trusts. Westwood Trust sponsors common trust funds for most of the investment strategies managed by Westwood Management and Westwood International. Westwood Trust has also engaged SKY Harbor Capital Management, LLC, William Blair & Company, LLC and Brandywine Global Investment Management, LLC, all registered investment advisors, to subadvise our High Yield Bond, Domestic Growth Equity and International Fixed Income common trust funds, respectively.
Westwood Trust also develops asset allocation models for certain clients utilizing mutual funds managed by Westwood Management and Westwood International, as well as from certain other mutual fund families.
Enhanced Balanced® Portfolios
Westwood Trust is a strong proponent of asset class diversification and offers its clients the ability to diversify among many different asset classes. Westwood Trust Enhanced Balanced® portfolios combine these asset classes into a customizable portfolio for clients seeking to maximize return for a given level of risk. Periodic adjustments are made to asset class weightings in Enhanced Balanced® portfolios based on historical returns, risk and correlation data and our current capital markets outlook.
Distribution Channels
We market our services through several distribution channels to optimize the reach of our investment advisory and trust services. These channels enable us to leverage distribution infrastructures and capabilities of other financial services firms and intermediaries while focusing on our core competency of developing and managing investment strategies.
6
Institutional
In our institutional channel, we market our investment strategies through institutional investment consultants, financial intermediaries, managed accounts programs and directly to institutional investors. Institutional investment consultants serve as gatekeepers to the majority of corporate retirement plans, public retirement plans, endowments and foundations, which represent Westwood’s primary institutional target markets. Consultants provide guidance to their clients in setting asset allocation strategies, as well as creating investment policies. Consultants also make recommendations for investment firms they believe can best meet their client’s investment objectives. We have established strong relationships with many global, national and regional investment consulting firms, which collectively have contributed to our being considered and hired by their clients. Continuing to enhance existing consulting firm relationships, as well as forging new relationships, increases the awareness of our services in both the consultant community and within their institutional client base.
Marketing our investment strategies to financial intermediaries, via subadvisory relationships, allows us to extend the reach of our investment advisory services to clients of other investment companies with broad, established distribution capabilities. In subadvisory arrangements, our client is generally the investment company through which our services are offered to investors, typically via mutual fund offerings. The investment company that sponsors the mutual fund is responsible for appropriate marketing, distribution and operational and accounting activities.
Managed accounts are similar in some respects to subadvisory relationships in that a third-party financial institution, such as a brokerage firm or turnkey asset management program provider, handles distribution to the end client. The end client in a managed account is typically a high net worth individual or small institution. In these arrangements, the third-party financial institution is responsible to the end client for client service, operations and accounting.
We also market our investment strategies directly to pension funds, endowments, foundations and other institutional investors.
Mutual Funds
In our mutual funds channel, we market our registered mutual funds, the Westwood Funds®, to institutional investment consultants, financial intermediaries, registered investment advisors, select broker-dealers and fund supermarkets. By leveraging our existing relationships with institutional investment consulting firms we are able to participate when their defined contribution and other retirement plan clients require a mutual fund vehicle. We also seek relationships with financial intermediaries that manage discretionary fund models in order to have our funds placed in such models. Our wholesaling group markets our funds directly to registered investment advisors, select broker-dealers and mutual fund supermarkets.
Private Wealth
In our private wealth channel, we generate awareness of our trust fiduciary and investment services through investment consultants, centers of influence, community involvement and targeted direct marketing to high net worth individuals, families and small to medium-sized institutions. A significant portion of our new asset growth has been generated by referrals from existing clients.
7
Growth Strategy
We believe that we have established a strong platform to support future growth, deriving our strength in large part from the experience and capabilities of our management team and skilled investment professionals. We believe that this focused, stable team has contributed significantly to our solid investment performance, superior client service and a growing array of investment strategies. We believe that opportunities for future growth may come from our ability to:
• | generate growth from new and existing clients and consultant relationships; |
• | attract and retain key employees; |
• | grow assets in our existing investment strategies; |
• | foster continued growth of the Westwood Trust platform; |
• | expand distribution via mutual funds; |
• | seek strategic corporate development opportunities; |
• | pursue opportunities internationally through targeted sales and relationships with international distributors and institutional investors; |
• | continue to strengthen our brand name; and |
• | develop or acquire new investment strategies. |
Generate growth from new and existing clients and consultant relationships. As our primary business objective, we intend to maintain and enhance existing relationships with clients and investment consultants by providing solid investment performance and attentive client service. We also intend to pursue growth via targeted sales and marketing efforts that emphasize our investment philosophy, performance and superior client service. New institutional client accounts are sourced from either investment consultants or from our direct sales efforts with institutional investors. We believe that the in-depth knowledge of our firm, our people and our processes embedded in our consultant relationships, as well as in existing and prospective client relationships, is a key factor when being considered for new client investment mandates.
Attract and retain key employees. To achieve our investment performance and client relationship objectives, we must be able to attract and retain talented professionals. We believe that we have created a workplace environment in which motivated, performance-driven, and client-oriented individuals can thrive. As a public company, we offer our employees a compensation program that includes strong equity incentives to closely align their success with that of our clients and stockholders. We believe that these factors are critical to maintaining a stable, client-focused environment that can support significant future growth.
Grow assets in our existing investment strategies. We have significant capacity for additional assets across our existing range of investment strategies, which we have continued to expand. We have developed a range of approximately 20 institutional investment strategies by building on the core competencies of our U.S. Value team, which has now been in place for over 30 years, as well as via the addition of new investment teams. In 2012, we initiated our Global and Emerging Markets Equity Team, thereby adding five new equity strategies that focus on emerging and global markets: Emerging Markets, Emerging Markets Plus, Emerging Markets SMid, Global Equity and Global Dividend. Our emerging markets strategies have experienced strong investor demand, and we believe they provide additional growth opportunities. In 2014, we established the Westwood Global Convertible Securities Team, which manages two strategies - a long-only strategy, Global Convertibles Securities, and a market neutral strategy, Market Neutral Income. Our U.S. Value Team has launched four new strategies since 2014 - Concentrated LargeCap Value, Concentrated AllCap Value, MLP Opportunities and MLP & Strategic Energy - and in 2015 we launched our second Multi-Asset strategy, Worldwide Income Opportunity, a global version of our very successful Income Opportunity strategy. These recently launched offerings, in combination with our range of seasoned investment strategies, provide significant capacity to grow assets under management. We have the team in place to support these investment strategies and, with continuing strong investment performance, we believe that demand for these strategies can provide meaningful growth for our assets under management.
Foster continued growth of the Westwood Trust platform. Westwood Trust has experienced solid growth in serving small to medium-sized institutions as well as high net worth individuals and families. We anticipate continued interest from clients and prospects in our diversified, highly attentive service model. A significant percentage of new asset growth at Westwood Trust stems from referrals, as well as gathering additional assets from existing clients. We believe that our Enhanced Balanced® strategy, which offers diversified exposure to multiple asset classes in a tax-efficient, comprehensive manner, along with our separately managed portfolios, provide good opportunities for growth.
8
Foster expanded distribution via mutual funds. We have fifteen funds in the Westwood Funds® family: Westwood SMidCap (WHGMX), Westwood Income Opportunity (WHGIX), Westwood LargeCap Value (WHGLX), Westwood SmallCap Value (WHGSX), Westwood Dividend Growth (WHGDX), Westwood SMidCap Plus+ (WHGPX),Westwood Strategic Global Convertibles (WSGCX), Westwood Market Neutral Income (WMNIX), Westwood Worldwide Income Opportunity (WWIOX), Westwood MLP & Strategic Energy (WMLPX), Westwood Emerging Markets (WWEMX), Westwood Global Equity (WWGEX), Westwood Global Dividend (WWGDX), Westwood Short Duration High Yield (WHGHX) and Westwood Opportunistic High Yield (WWHYX). We believe that providing investors access to our mutual funds is a key component to achieving asset growth in the defined contribution and retirement marketplaces as well as with registered investment advisors. With the exception of Westwood Short Duration High Yield and Westwood Opportunistic High Yield, both of which are subadvised by SKY Harbor Capital Management, LLC, the Westwood Funds® generally mirror our institutional strategies. All funds offer capped expense ratios and are available in an institutional share class. We also offer Class A shares for Westwood LargeCap Value (WWLAX), Westwood Income Opportunity (WWIAX), Westwood Emerging Markets (WWEAX) and Westwood Short Duration High Yield (WSDAX) in order to target No Transaction Fee (NTF) mutual fund supermarket platforms and the broker/dealer marketplace. Westwood Market Neutral Income (WMNUX) and Westwood Opportunistic High Yield (WHYUX) offer an Ultra share class generally only available to institutional investors who purchase the fund directly and for which no shareholder servicing fees are paid.
Pursue strategic corporate development opportunities. We evaluate strategic corporate development opportunities to augment organic growth. We may pursue various transactions, including acquisitions of asset management firms, mutual funds or private wealth firms, as well as hiring investment professionals or teams. We consider opportunities to enhance our existing operations, expand our range of investment strategies and services or further develop our distribution capabilities. By acquiring investment firms or by hiring investment professionals or teams that successfully manage investment strategies beyond our current expertise, we can both attract new clients and provide existing clients with an even more diversified range of investment strategies. We may also consider forging alliances with other financial services firms to leverage our core competency of developing superior investment strategies with alliance partners that can provide enhanced distribution capabilities or additional service offerings. In October 2014, we hired our Global Convertible Securities Team to manage a new, convertible securities strategy, and in April 2015, we acquired Woodway to grow our private-wealth business.
Pursue opportunities internationally through targeted sales and relationships with international distributors and institutional investors. In recent years we have increased our sales efforts outside of the U.S. As of December 31, 2015, non-U.S. clients represented 18% of our assets under management compared with 5% as of December 31, 2011. The growth in our non-U.S. client base has primarily been a function of the broadening of our range of investment strategies to include Emerging Markets equity and Global Convertible Securities. In addition, we established a UCITS platform in 2012 and now offer three sub-funds under the UCITS umbrella for non-U.S. investors. We intend to continue our sales efforts outside of the U.S. We may consider forging alliances with international financial services firms or partners to obtain enhanced distribution capabilities and greater access to global customers. We may also target institutional investors in specific non-U.S. markets including Canada, the United Kingdom, Australia, Switzerland, Scandinavia and the Netherlands.
Continue to strengthen our brand name. We believe that the strength of our brand name has been a key component to our long-term success in the investment industry and will be instrumental to our future success. We have developed our strong brand name largely through excellent performance coupled with high profile coverage in investment publications and electronic media. Several of our investment professionals have been visible in print and electronic media, and we will continue to look for creative ways to strengthen our brand name and reputation in our target markets.
Develop or acquire new investment strategies. We continue to look for opportunities to expand the range of investment strategies that we offer to existing and prospective clients. We may consider internally-developed strategies that extend our existing investment process to new markets and may also consider externally acquired investment strategies. An expanded range of investment strategies offers additional ways to serve our client base, generating more diversified revenue streams, as well as asset and revenue growth opportunities.
9
Competition
We are subject to substantial and growing competition in all aspects of our business. Barriers to entry in the asset management business are relatively low, and we expect to face a growing number of competitors. Although no one company dominates the asset management industry, many companies are larger, better known and have greater resources than us.
Further, we compete with other asset management firms on the basis of investment strategies offered, their investment performance both in absolute terms and relative to peer groups, quality of service, fees charged, the level and type of compensation offered to key employees, and the manner in which investment strategies are marketed. Many of our competitors offer more investment strategies and services and have substantially greater assets under management.
We compete against numerous investment dealers, banks, insurance companies, mutual fund companies, exchange-traded funds, brokerage and investment firms, and others that sell equity funds, taxable income funds, tax-free investments and other investment products. In addition, the allocation of assets by many investors from active equity investment to index funds, fixed income or similar asset classes has enhanced the ability of firms offering non-equity asset classes and passive equity management to compete effectively with us. In summary, our competitive landscape is intense and dynamic, and we may not be able to compete successfully in the future as an independent company.
Additionally, most prospective clients perform a thorough review of an investment manager’s background, investment policies and performance before committing assets to that manager. In many cases, prospective clients invite a number of competing firms to make presentations. The process of obtaining a new client typically takes twelve to eighteen months from the time of the initial contact. While we have achieved success in competing for new clients, it is a process to which we dedicate significant resources over an extended period, with no certainty of winning.
Regulation
Westwood Management
Virtually all aspects of our business are subject to federal and state laws and regulations. These laws and regulations are primarily intended to protect investment advisory clients. Under such laws and regulations, agencies that regulate investment advisers have broad administrative powers, including the power to limit, restrict or prohibit advisers from carrying on their business if they fail to comply with such laws and regulations. Possible sanctions include suspension of individual employees, limitations on engaging in certain lines of business for specified periods of time, revocation of investment adviser and other registrations, censures and fines. We believe that we are in substantial compliance with all material laws and regulations.
Our business is subject to regulation at federal and state levels by the SEC and other regulatory bodies. Westwood Management Corp. and Westwood Advisors, LLC are registered with the SEC under the Investment Advisers Act of 1940 (the “Investment Advisers Act”) and under the laws of various states. As registered investment advisers, Westwood Management Corp. and Westwood Advisors, LLC are regulated and subject to examination by the SEC. The Investment Advisers Act imposes numerous obligations on registered investment advisers, including fiduciary duties, record keeping operational and marketing requirements and disclosure obligations. Westwood Management Corp. also acts as adviser to the Westwood Funds®, a family of mutual funds registered with the SEC under the Investment Company Act of 1940 (the "Investment Company Act"). As an adviser to a registered investment company, Westwood Management Corp. must comply with the Investment Company Act and related regulations. The Investment Company Act imposes numerous obligations on registered investment companies, including requirements relating to operations, fees charged, sales, accounting, record keeping, disclosure, governance and restrictions on transactions with affiliates. Under SEC rules and regulations promulgated pursuant to the federal securities laws, we are subject to periodic SEC examinations. The SEC can institute proceedings and impose sanctions for violations of the Investment Advisers Act and the Investment Company Act, ranging from censure to termination of an investment adviser’s registration. The failure of Westwood Management Corp. and Westwood Advisors, LLC to comply with SEC requirements could have a material adverse effect on Westwood. We must also comply with anti-money laundering laws and regulations, including the USA PATRIOT Act of 2001, as subsequently amended and reauthorized. We believe that we are in substantial compliance with the regulations under the Investment Advisers Act, the Investment Company Act and the USA PATRIOT Act of 2001.
10
As an investment adviser, we have a fiduciary duty to our clients. The SEC has interpreted that duty to impose standards, requirements and limitations on, among other things: trading of client accounts, allocations of investment opportunities among clients, use of soft dollars, execution of transactions and recommendations to clients. We manage accounts for our clients with the authority to buy and sell securities, select broker-dealers to execute trades and negotiate brokerage commission rates. We receive soft dollar credits from certain broker-dealers that reduce certain operating expenses and cash payments to these broker-dealers. Our soft dollar arrangements are intended to be within the safe harbor provided by Section 28(e) of the Exchange Act. If our ability to use soft dollars were reduced or eliminated as a result of the implementation of statutory amendments or new regulations, our operating expenses would increase.
Westwood Trust
Westwood Trust operates in a highly regulated environment and is subject to extensive supervision and examination. As a Texas chartered trust company, Westwood Trust is subject to the Texas Finance Code (the “Finance Code”), the rules and regulations promulgated under the Finance Code and supervision by the Texas Department of Banking. These laws are intended primarily for the protection of Westwood Trust’s clients and creditors rather than for the benefit of investors. The Finance Code provides for and regulates a variety of matters, such as:
• | minimum capital maintenance requirements; |
• | restrictions on dividends; |
• | restrictions on investments of restricted capital; |
• | lending and borrowing limitations; |
• | prohibitions against engaging in certain activities; |
• | periodic fiduciary and information technology examinations by the Texas Department of Banking Commissioner; |
• | furnishing periodic financial statements to the Texas Department of Banking Commissioner; |
• | fiduciary record keeping requirements; and |
• | prior regulatory approval for certain corporate events (such as mergers, the sale or purchase of all or substantially all trust company assets and transactions transferring control of a trust company). |
The Finance Code also gives the Banking Commissioner broad regulatory powers (including penalties and civil and administrative actions) if the trust company violates certain provisions of the Finance Code, including implementing conservatorship or closure if Westwood Trust is determined to be in a “hazardous condition” (as defined by applicable law). Westwood Trust’s failure to comply with the Finance Code could have a material adverse effect on Westwood.
Westwood Trust is limited by the Finance Code in the payment of dividends to undivided profits, which is described as that part of equity capital equal to the balance of net profits, income, gains, and losses since formation minus subsequent distributions to stockholders and transfers to surplus or capital under share dividends or appropriate board resolutions. At the discretion of its Board of Directors, Westwood Trust has made quarterly and special dividend payments to Westwood Holdings Group, Inc. out of undivided profits.
Westwood International
Westwood International is registered with both the Ontario Securities Commission (“OSC”) and the Autorité des marchés financiers (“AMF”) in Québec.
The OSC is an independent Crown corporation responsible for regulating the capital markets in Ontario. Its statutory mandate is to provide protection to investors from unfair, improper or fraudulent practices and to foster fair and efficient capital markets and confidence in capital markets. The OSC has rule making and enforcement powers to help safeguard investors, deter misconduct and regulate participants involved in capital markets in Ontario. It regulates firms and individuals that sell securities and provide advice in Ontario, and also regulates public companies, investment funds and marketplaces, such as the Toronto Stock Exchange. The OSC’s powers are granted under the Securities Act (Ontario) the Commodity Futures Act (Ontario) and certain provisions of the Business Corporations Act. It operates independently from the government and is funded by fees charged to market participants. The OSC is accountable to the Ontario Legislature through the Minister of Finance.
11
The AMF is the entity mandated by the government of Québec to regulate the province’s financial markets and provide assistance to consumers of financial products and services. Established on February 1, 2004 under an Act regarding the Autorité des marchés financiers , the AMF integrates the regulation of the Québec financial sector, notably in the areas of insurance, securities, deposit institutions (other than banks) and the distribution of financial products and services. Specifically, the AMF’s mission is to:
• | provide assistance to consumers of financial products and services; |
• | ensure that financial institutions and other regulated financial sector entities comply with applicable solvency and obligations imposed by law; |
• | supervise activities connected with distribution of financial products and services; |
• | supervise stock market and clearing house activities and monitor the securities market; |
• | supervise derivatives markets, including derivatives exchanges and clearing houses and ensure that regulated entities and other derivatives market practitioners comply with obligations imposed by law; and |
• | implement protection and compensation programs for consumers of financial products and services, and administer compensation funds set up by law. |
Westwood International has entered into a MOU with Westwood Management pursuant to which Westwood International is considered a “participating affiliate” of Westwood Management. Subject to certain conditions, the SEC staff allows U.S. registered investment advisers to use portfolio management or research resources of advisory participating affiliates subject to the supervision of a registered adviser. Pursuant to the MOU, Westwood International professionals can provide advisory and subadvisory services to U.S clients subject to SEC rules and regulations and under the supervision of Westwood Management.
Employee Retirement Income Security Act of 1974
We are subject to the Employee Retirement Income Security Act of 1974, as amended (“ERISA”), and to its related regulations insofar as we are a “fiduciary” under ERISA with respect to some clients. ERISA and applicable provisions of the Internal Revenue Code impose certain duties on fiduciaries under ERISA or on entities that provide services to ERISA plan clients and prohibit certain transactions involving ERISA plan clients. Our failure to comply with these requirements could have a material adverse effect.
Employees
At December 31, 2015, we had 168 full-time employees (153 based in the United States and 15 based in Canada). No employees are represented by a labor union, and we believe our employee relations to be good.
Segment Information
For information about our operating segments, Advisory and Trust, please see Note 14 to the consolidated financial statements accompanying this Report.
12
Item 1A. | Risk Factors. |
We believe these represent the material risks currently facing our business. Our business, financial condition or results of operations could be materially adversely affected by these risks. The trading price of our common stock could decline due to any of these risks, and you may lose all or part of your investment. You should carefully consider the risks described below before making an investment decision. You should also refer to the other information included or incorporated by reference in this Report, including our financial statements and related notes.
Risks Related to the Investment Industry
Our results of operations depend upon the market value and composition of assets under management, which can fluctuate significantly based on various factors, some of which are beyond our control.
Our revenues are primarily generated from fees derived as a percentage of assets under management (“AUM”). The value of our AUM can be negatively impacted by several factors, including:
• | Market performance: Performance of the securities markets could be impacted by a number of factors beyond our control, including, among others, general economic downturns, political uncertainty or acts of terrorism. Negative performance within the securities markets or short-term volatility within the securities markets could result in investors withdrawing assets, decreasing their rates of investment or shifting assets to cash or other asset classes or strategies that we do not manage, all of which could reduce our revenues. In addition, during periods of slowing growth or declining revenues, profits and profit margins are adversely affected because certain expenses remain relatively fixed. |
• | Investment performance: Because we compete with many asset management firms on the basis of our investment strategies, the maintenance and growth of assets under management is dependent, to a significant extent, on the investment performance of the assets that we manage. Poor performance tends to result in the loss or reduction of client accounts, which decreases revenues. Underperformance relative to peer groups for our various investment strategies could adversely affect our results of operations, especially if such underperformance continues for an extended period of time. The historical returns of our strategies and the ratings and rankings we, or the mutual funds that we advise, have received in the past should not be considered indicative of the future results of these strategies or of any other strategies that we may develop in the future. The investment performance we achieve for our customers varies over time and variances can be wide. In addition, certain of our investment strategies have capacity constraints, as there is a limit to the number of securities available for certain strategies to operate effectively. In those instances, we may choose to limit access to new or existing investors. |
Our business is subject to extensive regulation with attendant compliance costs and serious consequences for violations; expansion into international markets and introduction of new products and services increases our regulatory and operational risks.
Virtually all aspects of our business are subject to laws and regulations, including the Investment Advisers Act, the Investment Company Act, the USA Patriot Act of 2001, the Finance Code and anti-money laundering laws. These laws and regulations generally grant regulatory agencies broad administrative powers, including the power to limit or restrict us from operating our business, as well as powers to place us under conservatorship or closure if we fail to comply with such laws and regulations. Violations of such laws or regulations could subject us or our employees to disciplinary proceedings and civil or criminal liability, including revocation of licenses, censures, fines or temporary suspensions, permanent barring from the conduct of business, conservatorship, or closure. Any such proceeding or liability could have a material adverse effect upon our business, financial condition, results of operations and business prospects.
In addition, the regulatory environment in which we operate is subject to change. We may be adversely affected as a result of new or revised legislation or regulations or by changes in the interpretation or enforcement of existing laws and regulations. In recent years, regulators have increased their oversight of the financial services industry. Some regulations are focused directly on the investment management industry, while others are more broadly focused but affect our industry as well. The Dodd-Frank Act of 2010 significantly increased and revised the federal rules and regulations governing the financial services industry and, in addition to other regulations, has generally resulted in increased compliance and administrative requirements. For example, the SEC’s adoption of Form PF and revisions to Form ADV impose additional reporting requirements for SEC-registered investment advisors. Additionally, ERISA Section 408(b)(2) and related regulations require additional information to be provided to ERISA-governed retirement plans. While we believe that changes in laws, rules and regulations, including those discussed above, have increased our administrative and compliance costs, we are unable to quantify the increased costs attributable to such changes. See “Item 1. Business — Regulation.”
13
Recently, we have expanded our product offerings, vehicles offered and international business activities with strategies in global and emerging markets, global multi-asset and global convertible securities. Additionally, our client base continues to expand internationally. As of December 31, 2015, approximately 18% of our AUM is managed for clients who are domiciled outside the United States. As a result, we face increased operational, regulatory, compliance, reputation and foreign exchange rate risks. In particular, rapid regulatory change is occurring internationally with respect to financial institutions, including, but not limited to, anticipated revisions to the European Communities (Undertakings for Collective Investment in Transferable Securities) Regulations 2011. The failure of our compliance and internal control systems to properly identify and mitigate such additional risks, or of our operating infrastructure to support international activities, could result in operational failures and actions by regulatory agencies, which could have a material adverse effect on our business.
We devote considerable time and resources to both domestic and international compliance; however, we may fail to timely and properly identify regulatory requirements or modify our compliance procedures for changes in our regulatory environment, which may subject us to legal proceedings, domestic and foreign government investigations, penalties and fines.
The investment management and private wealth industry is highly competitive and innovative.
The investment management and private wealth industry is highly competitive, with competition based on a variety of factors, including investment performance, fee rates, continuity of investment professionals and client relationships, the quality of services provided to clients, corporate positioning and business reputation and differentiated products. A number of factors increase our competitive risks, including the following:
• | Potential competitors have a relatively low cost of entering the investment management industry. |
• | Many competitors have greater financial, technical, marketing and other resources, more comprehensive name recognition and more personnel than we do. |
• | The recent trend toward consolidation in the investment management industry, and the securities business in general, has served to increase the size and strength of some of our competitors. |
• | The enhanced ability for firms offering passive management to effectively compete with us. |
• | Some competitors may invest in different investment styles or alternative asset classes that may be perceived as more attractive than our investment strategies. |
• | Other industry participants, hedge funds and alternative asset managers may seek to recruit our investment professionals. |
• | Some competitors charge lower fees for their investment management services than we do. |
• | Some competitors may provide additional client services, including banking, financial planning and tax planning. |
If we are unable to compete effectively, our earnings could be reduced and our business could be adversely affected.
Westwood invests in the securities of non-U.S. companies, which involve foreign currency exchange, tax, political, social and economic uncertainties and risks.
As of December 31, 2015, approximately 16% of our assets under management were invested in strategies offering access to global and emerging markets with significant exposure to non-U.S. companies. Fluctuations in foreign currency exchange rates could negatively affect the returns of clients invested in these strategies. Investments in non-U.S. issuers may also be affected by tax positions taken in countries or regions in which we are invested as well as political, social and economic uncertainty, including, for example, the broad decline in global economic conditions that began in 2015. Many financial markets are less developed or efficient than U.S. financial markets and therefore may have limited liquidity and higher price volatility, and may lack an established regulatory framework. Liquidity may be adversely affected by political or economic events, government policies, and social or civil unrest within a particular country. These risks, among others, could adversely affect the performance of our strategies invested in securities of non-U.S. issuers and may be particularly acute in the emerging or less developed markets in which we invest. As a result, we may be unable to attract or retain client investments in these strategies or assets invested in these strategies may experience significant declines in value, and our results of operations may be negatively affected.
14
Due to the substantial cost and time required to introduce new investment strategies, we may not be able to successfully introduce new investment strategies in a timely manner, or at all.
We have incurred significant costs to develop new investment strategies, launch new mutual funds under the Westwood Funds® name, launch UCITS funds and upgrade our business infrastructure. We expect to continue to incur significant costs related to such improvements.
The development of new investment strategies, whether through acquisition or internal development, requires a substantial amount of time and significant financial resources, including expenses related to compensation, sales and marketing, information technology, legal counsel and other professional services. Our ability to market and sell a new investment strategy depends on our financial resources, the investment performance of the specific strategy, the timing of the offering and our marketing strategies. Once an investment strategy is developed, we must effectively introduce the strategy to existing and prospective clients. Our ability to sell new investment strategies to existing and prospective clients depends on our ability to meet or exceed the performance of our competitors offering the same or a similar strategy. We may not be able to manage the assets within a given investment strategy profitably, and it may take years before we produce the level of results that will attract clients. If we are unable to realize the benefits of the costs and expenses incurred in developing new investment strategies, we may experience losses as a result of our management of these investment strategies, and our ability to introduce further new investment strategies and compete in our industry may be hampered.
To introduce new investment strategies, we may also seek to add new investment teams. To the extent we are unable to recruit and retain investment teams that will complement our existing business model, we may not be successful in further diversifying and increasing our investment strategies and client assets, which could have a material adverse effect on our business and future prospects. The addition of a new team using an investment strategy with which we may have limited or no experience could strain our operational resources and increase the possibility of operational error. If any such new teams or strategies perform poorly and fail to attract sufficient assets, our results of operations and reputation will be adversely affected.
Risks Related to our Business
Acquisitions involve inherent risks that could compromise the success of the combined business and dilute the holdings of current stockholders.
As part of our long-term business strategy, we may pursue corporate development transactions including the acquisition of asset management firms, mutual funds, private wealth firms, investment professionals or teams. See “Item 1. Business — Growth Strategy.” If we are incorrect when assessing the value, strengths, weaknesses, liabilities and potential profitability of such transactions, or if we fail to adequately integrate the acquired businesses or individuals, the success of the combined business could be compromised. Business acquisitions are subject to the risks commonly associated with such transactions including, among others, potential exposure to unknown liabilities of acquired companies and to acquisition costs and expenses, the difficulty and expense of integrating the operations and personnel of the acquired companies, potential disruptions to the business of the combined company and potential diversion of management’s time and attention, the impairment of relationships with and the possible loss of key employees and clients as a result of changes in management, potential litigation or other legal risks, potential write-downs related to goodwill impairments in connection with acquisitions, and dilution to the stockholders of the combined company if the acquisition is made for stock of the combined company. In addition, investment strategies, technologies or businesses of acquired companies may not be effectively assimilated into our business or may have a negative effect on the combined company’s revenues or earnings. The combined company may also incur significant expenses to complete acquisitions and support acquired investment strategies and businesses. Further, any such acquisitions may be funded with cash, debt or equity, which could dilute the holdings or limit the rights of stockholders. Finally, we may not be successful in identifying attractive acquisition candidates or completing acquisitions on favorable terms.
15
The Woodway acquisition is subject to risks and uncertainties, including the successful integration of Woodway's business and personnel. We may not realize the anticipated benefits of the Woodway acquisition.
On April 1, 2015, we completed the acquisition of Woodway via the merger of Woodway into our wholly-owned subsidiary, Westwood Trust. The acquisition may not yield the forecasted benefits due to a variety of factors. Woodway may have unanticipated liabilities, for which we cannot be fully indemnified under the Merger Agreement. We may not be able to maintain or increase the levels of revenue, earnings and operating efficiency, or the client relationships, that Woodway achieved prior to the acquisition. The success of the Woodway acquisition will depend, in part, on our ability to realize the anticipated synergies and other benefits from continuing to integrate Woodway’s business with our existing businesses. The integration process may be complex, costly and time-consuming. If we experience difficulties, delays or unexpected costs with the integration process or if the Woodway business deteriorates, the anticipated cost savings, growth opportunities and other synergies of the Woodway acquisition may not be realized fully, or realized at all, or may take longer to realize than expected. Additionally, because we are issuing shares of Westwood common stock as consideration in the acquisition, the transaction will have the effect of diluting the holdings of our existing stockholders.
If any of the above risks occur, our business, financial condition, results of operations and cash flows may be materially and adversely impacted, and our stock price may decline as a result. For further information on our acquisition of Woodway, see Note 5 “Acquisitions, Goodwill and Intangible Assets” to our consolidated financial statements.
Our business involves risks of being engaged in litigation and liability that could increase our expenses and reduce our results of operations.
Many aspects of our business involve substantial risks of liability. We could be named as defendants or co-defendants in lawsuits or could be involved in disputes that involve the threat of lawsuits seeking substantial damages. As an SEC-registered adviser, mutual fund adviser and publicly traded entity, we are subject to governmental and self-regulatory organization examinations, investigations and proceedings. Similarly, the investment strategies that we manage could be subject to actual or threatened lawsuits and governmental and self-regulatory organization investigations and proceedings, any of which could harm the investment returns or reputation of the applicable fund or result in our being liable for any resulting damages. There has been an increased incidence of litigation and regulatory investigations in the asset management industry in recent years, including customer claims, as well as class action suits seeking substantial damages. While customers do not have legal recourse against us solely on the basis of poor investment results, if our investment strategies perform poorly, we are more likely to become subject to litigation brought by dissatisfied clients. In addition, to the extent customers are successful in claiming that their losses resulted from fraud, negligence, willful misconduct, breach of contract or other similar misconduct, these clients may have remedies against us, the mutual funds and other funds we advise or our investment professionals under the federal securities laws or state law. See the discussion of our current legal proceedings in Item 3. “Legal Proceedings”.
Misuse of assets and information in the possession of our employees could damage our reputation and result in costly litigation and liability for our clients and us.
Our employees handle significant amounts of assets along with financial and personal information for our clients. Our employees could misuse or improperly disclose such information, which could harm our reputation. We have implemented a system of controls to minimize the risk of fraudulent use of assets and information; however, our controls may be insufficient to prevent fraudulent actions by employees. If our controls are ineffective, we could be subject to costly litigation, which could consume financial resources, distract management, damage our reputation and result in regulatory sanctions. Such fraudulent actions could also adversely affect clients, causing them to seek redress.
Our success depends on certain key employees and our ability to attract and develop new, talented professionals. Our inability to attract and retain key employees could compromise our future success.
Our future success depends upon our ability to attract and retain professional and executive employees, including investment, marketing, client service and management personnel. There is substantial competition for skilled personnel within the asset management business, and the failure to attract, develop, retain and motivate qualified personnel could negatively impact our business, financial condition, results of operations and future prospects. Only a limited number of our employees, including our Chief Executive Officer, Chief Investment Officer and certain investment employees, have employment contracts. Certain key employees do not have employment contracts and generally can terminate their employment at any time. In order to retain or replace our key personnel, we may be required to increase compensation, which would decrease net income. Additionally, investment and sales professionals often maintain strong relationships with their clients, and their departure may cause us to lose client accounts, which could have a material impact on our revenues and results of operations.
16
Damage to our reputation could harm our business and have a material adverse effect on our results of operations.
Our brand is a valuable intangible asset that could be vulnerable to threats that can be difficult or impossible to anticipate or control. Regulatory inquiries and rumors could damage our reputation, even if they are unfounded or satisfactorily addressed. Damage to our brand could impede our ability to attract and retain customers and key employees, and could reduce our assets under management, which would have a material adverse effect on our results of operations.
Failure to properly address conflicts of interest could harm our reputation or cause clients to withdraw funds, each of which could adversely affect our business and results of operations.
The SEC and other regulators have increased their scrutiny of potential conflicts of interest, and we have implemented procedures and controls that we believe are reasonably designed to address these issues. However, appropriately dealing with conflicts of interest is complex and if we fail, or appear to fail, to deal appropriately with conflicts of interest, we could face reputational damage, litigation or regulatory proceedings, any of which may adversely affect our results of operations.
In addition, as we expand the scope of our business and our client base, we must continue to monitor and address any potential new conflicts between the interests of our stockholders and those of our clients. Our clients may withdraw funds if they perceive conflicts of interest between the investment decisions we make for strategies in which they have invested and our obligations to our stockholders. For example, we may limit the growth of assets in or close strategies or otherwise take action to slow the flow of assets when we believe it is in the best interest of our clients, even though our assets under management and investment management fees may be negatively impacted. Similarly, we may establish or add new investment teams or expand operations into other geographic areas or jurisdictions if we believe such actions are in the best interest of our clients, even though our results of operations may be adversely affected in the short term. Although we believe such actions enable us to retain client assets and maintain our profit margins, if clients perceive a change in our investment or operational decisions favors a strategy to maximize short term results, they may withdraw funds, which could adversely affect our revenues and results of operations.
Our business is vulnerable to systems failures that could have a material adverse effect on our business, financial condition and results of operations.
Any delays or inaccuracies in securities pricing information or information processing could give rise to claims that could have a material adverse effect on our business, financial condition and results of operations. We are highly dependent on communications and information systems and on third-party vendors for securities pricing information and updates from certain software. We may suffer a systems failure or interruption, whether caused by an earthquake, fire, other natural disaster, power or telecommunications failure, unauthorized access, act of God, act of war, or otherwise, and our back-up procedures and capabilities may be inadequate to eliminate the risk of extended interruptions in operations.
Failure to implement and maintain effective cyber security controls could disrupt our operations and have a material adverse effect on our results of operations and stock price.
Our business is dependent on information technology systems and the cyber security controls we have in place to protect those systems and the information contained therein. A failure of our controls to protect our information technology from an external or internal attack or to prevent a breach of confidential client or competitive information could materially interrupt our operations and expose us to regulatory and legal actions, which could have a material adverse effect on our operating results, reputation and stock price.
Insurance coverage may be inadequate or not cover legal and regulatory proceedings.
We maintain insurance coverage in amounts and on terms we believe appropriate to cover legal and regulatory matters; however, we can make no assurance that there will be adequate coverage or that a claim will be covered by our insurance policies at all. Additionally, insurance premiums may rise for substantially the same coverage amounts and terms, which will increase our expenses and reduce our net income.
17
Various factors may hinder the declaration and payment of dividends.
We have historically paid a quarterly dividend. However, payment of future dividends is subject to the discretion of our Board of Directors, and various factors may prevent us from paying dividends. Such factors include our financial position, capital requirements and liquidity, stock repurchase plans, state corporate and banking law restrictions, results of operations and such other factors as our Board of Directors may consider relevant. In addition, as a holding company, our ability to pay dividends is dependent on the dividends and income we receive from our subsidiaries. Currently, our primary source of cash consists of dividends from Westwood Management or Westwood Trust. The payment of dividends by Westwood Trust is subject to the discretion of its Board of Directors and compliance with applicable laws, including, in particular, the provisions of the Finance Code applicable to Westwood Trust. See “Item 7. Management’s Discussion and Analysis of Financial Condition and Results of Operations.”
We may not be able to fund future capital requirements on favorable terms, if at all.
We cannot be certain that financing to fund our working capital or other cash requirements, if needed, will be available on favorable terms, if at all. Our capital requirements may vary greatly from quarter to quarter depending on, among other things, capital expenditures, fluctuations in our operating results and financing activities. If future financing becomes necessary, we may or may not be able to obtain financing on favorable terms, if at all. Further, any future equity financings could dilute the relative percentage ownership of then existing common stockholders and any future debt financings could involve restrictive covenants that limit our ability to take certain actions.
Failure to maintain effective internal controls could have a material adverse effect on our business and stock price.
Effective internal controls are necessary to provide reliable financial reports. If we cannot provide reliable financial reports, our brand and operating results could be harmed. All internal control systems, no matter how well designed, have inherent limitations and even systems determined to be effective can provide only reasonable assurance with respect to financial statement preparation and presentation.
We cannot be certain that the measures we take to evaluate and improve our internal controls will ensure that we implement and maintain adequate controls over our financial processes and reporting. Any failure to implement required new or improved controls, or difficulties encountered in their implementation, could harm our operating results or cause us to fail to meet our reporting obligations. If we fail to maintain the adequacy of our internal controls, as such standards are modified, supplemented or amended, we may not be able to ensure that we can conclude that we have effective internal control over financial reporting in accordance with Section 404 of the Sarbanes-Oxley Act of 2002. Failure to achieve and maintain an effective internal control environment could cause investors to lose confidence in our reported financial information, which could have a material adverse effect on our stock price.
Our stock is thinly traded and may be subject to volatility.
Although our common stock is traded on the New York Stock Exchange, it may remain relatively illiquid, or “thinly traded,” which can increase share price volatility and make it difficult for larger investors to buy or sell shares in the public market without affecting the quoted share price. Investors may be unable to buy or sell a certain quantity of our shares in the public market within one or more trading days. If limited trading in our stock continues, it may be difficult for holders to sell their shares in the public market at any given time at prevailing prices.
The prevailing market price of our common stock may fluctuate significantly in response to a number of factors, some of which are beyond our control, including (among other factors): actual or anticipated fluctuations in operating results; changes in market valuations of other similarly situated companies; additions or departures of key personnel; future sales of common stock; deviations in net revenues or in losses from levels expected by the investment community; and trading volume fluctuations.
18
Our organizational documents contain provisions that may prevent or deter another group from paying a premium over the market price to our stockholders to acquire our stock.
Our organizational documents contain provisions that require a vote of two-thirds of the shares of stock entitled to vote to remove directors for cause, establish that stockholders cannot act by written consent, and that authorize our Board of Directors to issue, without shareholder approval, blank check preferred stock. In addition, as a Delaware corporation, we are subject to Section 203 of the Delaware General Corporation Law relating to business combinations. These provisions could delay, deter or prevent a merger, consolidation, tender offer or other business combination or change of control involving us that could include a premium over the market price of our common stock that some or a majority of our stockholders might consider to be in their best interests.
We are a holding company dependent on the operations and funds of our subsidiaries.
We are a holding company, with no revenue-generating operations and no assets other than our ownership interests in Westwood Management, Westwood Trust and Westwood International. Accordingly, we are dependent on the cash flow generated by these operating subsidiaries and rely on dividends or other intercompany transfers from our operating subsidiaries to generate the funds necessary to meet our obligations.
Risks Related to our Clients
Competitive fee pressures could reduce revenues and profit margins.
To the extent we have to compete on the basis of price, we may not be able to maintain our current fee structure. Although our investment management fees vary from product to product, we have competed primarily on the performance of our products and client service rather than on the level of our investment management fees relative to our competitors. In recent years there has been a trend toward lower fees in the investment management industry. In order to maintain our fee structure in a competitive environment, we must be able to continue to provide clients with investment returns and service levels that make investors willing to pay our fees. We cannot be assured that we will succeed in providing investment returns and service levels that will allow us to maintain our current fee structure. Fee reductions on existing or future new business could have an adverse effect on our profit margins and results of operations.
In addition, we have performance fee agreements with a few clients, which pay us a fee if we outperform a specified index over predetermined periods of time. We may not be able to outperform such indexes, and failure to do so would cause us to earn none or only part of those potential revenues, which would have a material adverse effect on our revenues and results of operations. Our revenues from performance-based fees could fluctuate significantly from one measurement period to the next, depending on how we perform relative to the indexes specified in these agreements. For example, we earned performance fees of $2.7 million in 2015, $3.8 million in 2014 and $2.6 million in 2013.
Our business is dependent on investment advisory, subadvisory and trust agreements that are subject to termination or non-renewal. As a result, we could lose any of our clients on very short notice.
Substantially all of our revenues are derived pursuant to investment advisory, subadvisory and trust agreements with our clients. Investors in funds that we advise or subadvise may redeem their investments at any time without prior notice, thereby reducing our assets under management. These investors may redeem for any reason, including general financial market conditions, our absolute or relative investment performance, or their own financial condition and requirements. In a declining stock market, the pace of redemptions could accelerate. Redemption of a substantial amount of investments or a termination or failure to renew a material number of these agreements would adversely affect our revenues and have a material adverse effect on our earnings and financial condition.
A small number of clients account for a substantial portion of our business, and a reduction or loss of business with any of these clients could have a material adverse effect on our business, financial condition and results of operations.
Our ten largest clients accounted for over 20% of fee revenues for each of the years ended December 31, 2015, 2014 and 2013. We are dependent to a significant degree on our ability to maintain our relationships with these clients. There can be no assurance that we will be successful in maintaining existing client relationships, securing additional clients or achieving the superior investment performance necessary to earn performance-based advisory fees. Our failure to retain one or more of these large clients or to establish profitable relationships with additional clients could have a material adverse effect on our business, financial condition and results of operations.
19
Item 1B. | Unresolved Staff Comments. |
None.
Item 2. | Properties. |
Westwood, Westwood Management and Westwood Trust conduct their principal operations using approximately 40,000 square feet of leased office space in Dallas, Texas pursuant to a lease with an initial term that expires in 2026. In addition, we lease approximately 8,000 square feet of office space in Houston, Texas pursuant to a lease with an initial term that expires in December 2016, approximately 5,000 square feet of office space in Omaha, Nebraska pursuant to a lease with an initial term that expires in July 2019 and approximately 2,000 square fee of office space in Framingham, Massachusetts pursuant to a lease with an initial term that expires in April 2018. Westwood International conducts its principal operations using approximately 6,000 square feet of office space in Toronto, Ontario pursuant to a lease with an initial term that expires in May 2017. We continue to assess these facilities to ensure their adequacy to serve our anticipated business needs.
Item 3. | Legal Proceedings. |
We are subject from time to time to certain claims and legal proceedings arising in the ordinary course of our business.
On August 3, 2012, AGF Management Limited and AGF Investments Inc. (together “AGF”) filed a lawsuit in the Ontario Superior Court of Justice against Westwood, certain Westwood employees and Warren International, LLC, an executive recruiting firm. The action relates to the hiring of certain members of Westwood’s global and emerging markets investment team previously employed by AGF. AGF is alleging that the former employees breached certain obligations when they resigned from AGF, and that Westwood and Warren induced such breaches. AGF is seeking an unspecified amount of damages and punitive damages of $10 million (CAD) in the lawsuit. On November 5, 2012, Westwood issued a response to AGF’s lawsuit with a counterclaim against AGF for defamation. Westwood is seeking $1 million (CAD) in general damages, $10 million (CAD) in special damages, $1 million (CAD) in punitive damages, and costs. On November 6, 2012, AGF filed a second lawsuit against Westwood, Westwood Management and an employee of a Westwood subsidiary, alleging that the employee made defamatory statements about AGF. In this second lawsuit, AGF is seeking $5 million (CAD) in general damages, $1 million (CAD) per defendant in punitive damages, unspecified special damages, interest and costs. The pleadings phase was completed in 2013, and we are currently in the discovery phase.
While we intend to vigorously defend both actions and pursue the counterclaims, we are currently unable to estimate the ultimate aggregate amount of monetary gain, loss or financial impact of these actions and counterclaims. We have agreed with our Directors & Officers insurance provider that 50% of the defense costs related to both AGF claims, but not including Westwood’s counterclaim against AGF, will be covered by insurance. Defending these actions and pursuing these counterclaims may be expensive for us and time consuming for our personnel. While we do not currently believe these proceedings will have a material impact, adverse resolution of these actions and counterclaims could have a material adverse effect on our business, financial condition or results of operations.
Item 4. | Mine Safety Disclosures. |
Not applicable.
20
PART II
Item 5. | Market for Registrant’s Common Equity, Related Stockholder Matters and Issuer Purchases of Equity Securities. |
Market Information
Our common stock trades on the New York Stock Exchange (the “NYSE”) under the symbol “WHG”. At December 31, 2015, there were approximately 228 record holders of our common stock, although we believe that the number of beneficial owners of our common stock is substantially greater. The table below presents the high and low closing prices for our common stock, as reported by the NYSE for the periods indicated.
2015 | 2014 | |||||||||||||||
High | Low | High | Low | |||||||||||||
For the Quarter Ended: | ||||||||||||||||
March 31 | $ | 63.59 | $ | 58.67 | $ | 62.91 | $ | 53.62 | ||||||||
June 30 | 64.07 | 55.90 | 63.40 | 54.41 | ||||||||||||
September 30 | 62.30 | 50.37 | 62.40 | 51.72 | ||||||||||||
December 31 | 61.10 | 51.76 | 67.84 | 55.74 | ||||||||||||
Dividends
We have declared a cash dividend on our common stock for each quarter since our common stock was first publicly traded. The table below sets forth the dividends declared for the periods indicated.
2015 | 2014 | |||||||
First Quarter | $ | 0.50 | $ | 0.44 | ||||
Second Quarter | 0.50 | 0.44 | ||||||
Third Quarter | 0.50 | 0.44 | ||||||
Fourth Quarter | 0.57 | 0.50 | ||||||
In addition, on February 3, 2016 we declared a quarterly cash dividend of $0.57 per share on our common stock payable on April 1, 2016 to stockholders of record on March 11, 2016. We intend to continue paying cash dividends in such amounts as our Board of Directors may determine to be appropriate. Any future payments of cash dividends will be at the discretion of the Board of Directors and subject to limitations under the Delaware General Corporation Law.
Westwood Holdings Group is the sole stockholder of Westwood Management, Westwood Trust and Westwood International. Westwood Trust is limited under applicable Texas law in the payment of dividends to the amount of undivided profits, which is defined as that part of equity capital equal to the balance of net profits, income, gains, and losses since its formation minus subsequent distributions to stockholders and transfers to surplus or capital under share dividends or appropriate Board of Directors’ resolutions.
Issuer Purchases of Equity Securities
On July 20, 2012, our Board of Directors authorized management to repurchase up to $10 million of our outstanding common stock on the open market or in privately negotiated transactions. The share repurchase program has no expiration date and may be discontinued at any time by the Board of Directors. As of December 31, 2015, there had been no repurchases of our common stock under this plan, and $10 million remained available for repurchase.
Between January 1, 2016 and February 25, 2016, the Company repurchased 74,121 shares of our common stock at an average price of $46.93, including commissions, under our share repurchase program.
21
EQUITY COMPENSATION PLAN INFORMATION
The following table gives information as of December 31, 2015 about shares of our common stock that may be issued upon the exercise of options, warrants and rights under our Third Amended and Restated Westwood Holdings Group, Inc. Stock Incentive Plan and the Share Award Plan of Westwood Holdings Group, Inc. for Service Provided in Canada to its Subsidiaries, our only equity compensation plans in effect at that time. The material terms of this plan were approved by our stockholders at our 2011 Annual Meeting and are discussed in Note 9 "Employee Benefits" of the financial statements included in this Report.
Plan Category | Number of securities to be issued upon exercise of outstanding options, warrants and rights (a) | Weighted- average exercise price of outstanding options, warrants and rights (b) | Number of securities remaining available for future issuance under equity compensation plans (excluding securities reflected in column (a)) (c) | ||||||||
Equity compensation plans approved by security holders | — | $ | — | 773,000 | (1) | ||||||
Equity compensation plans not approved by security holders | — | — | — | ||||||||
Total | — | $ | — | 773,000 | |||||||
(1) Includes 679,000 shares available under our Third Amended and Restated Westwood Holdings Group, Inc. Stock Incentive Plan and 94,000 shares available under the Share Award Plan of Westwood Holdings Group, Inc. for Service Provided in Canada to its Subsidiaries.
22
PERFORMANCE GRAPH
The following graph compares total stockholder returns of Westwood since December 31, 2010 with the total return of the Russell 2000 Index and the SNL Asset Manager Index, a composite of 44 publicly traded asset management companies.
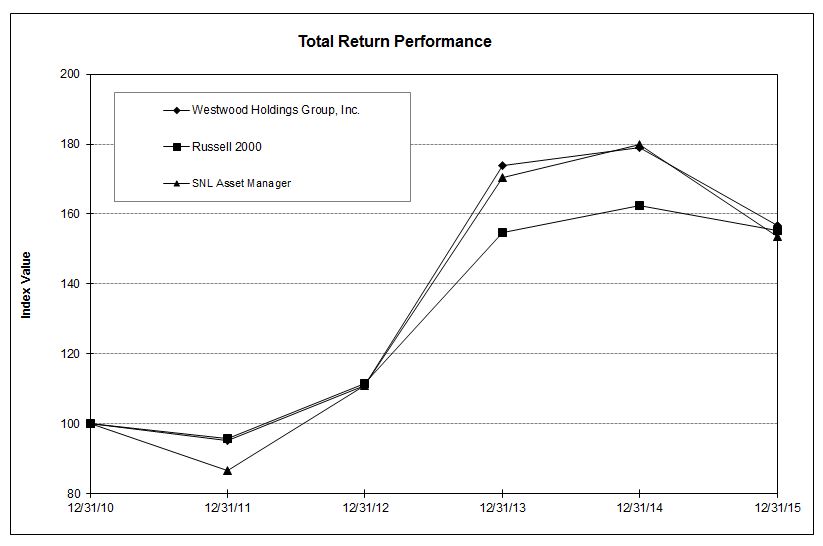
Index | Period ended December 31, | Cumulative Five-Year Total Return | |||||||||||||||||||||||||
2010 | 2011 | 2012 | 2013 | 2014 | 2015 | ||||||||||||||||||||||
Westwood Holdings Group, Inc. | $ | 100.00 | $ | 95.24 | $ | 110.93 | $ | 173.79 | $ | 179.01 | $ | 156.63 | 56.63 | % | |||||||||||||
Russell 2000 Index | 100.00 | 95.82 | 111.49 | 154.78 | 162.35 | 155.18 | 55.18 | % | |||||||||||||||||||
SNL Asset Manager Index | 100.00 | 86.50 | 110.97 | 170.54 | 179.91 | 153.43 | 53.43 | % | |||||||||||||||||||
The total return for our stock and for each index assumes $100 invested on December 31, 2010 in our common stock, the Russell 2000 Index, and the SNL Asset Manager Index, including reinvestment of dividends. Our common stock is traded on the NYSE under the ticker symbol “WHG.”
The closing price of our common stock on the last trading day of the year ended December 31, 2015 was $52.09 per share. Historical stock price performance is not necessarily indicative of future price performance.
23
Item 6. | Selected Financial Data. |
SELECTED CONSOLIDATED FINANCIAL DATA
The selected consolidated financial data, together with assets under management data presented below, should be read in conjunction with “Item 1. Business” and “Item 7. Management’s Discussion and Analysis of Financial Condition and Results of Operations” included elsewhere in this Report. Historical results are not necessarily indicative of future results.
Year ended December 31, (in thousands, except per share amounts) | |||||||||||||||||||
2015(1) | 2014(2) | 2013 | 2012(3) | 2011 | |||||||||||||||
Consolidated Statements of Income Data: | |||||||||||||||||||
Total revenues | $ | 130,936 | $ | 113,241 | $ | 91,825 | $ | 77,495 | $ | 68,909 | |||||||||
Employee compensation and benefits | $ | 63,562 | $ | 52,847 | $ | 47,864 | $ | 43,698 | $ | 35,917 | |||||||||
Employee compensation and benefits as a % of Total revenues | 48.5 | % | 46.7 | % | 52.1 | % | 56.4 | % | 52.1 | % | |||||||||
Income before income taxes | $ | 42,220 | $ | 42,036 | $ | 28,185 | $ | 20,020 | $ | 22,273 | |||||||||
Income before income taxes as a % of Total revenues | 32.2 | % | 37.1 | % | 30.7 | % | 25.8 | % | 32.3 | % | |||||||||
Net income | $ | 27,105 | $ | 27,249 | $ | 17,837 | $ | 12,086 | $ | 14,155 | |||||||||
Earnings per share – basic | $ | 3.49 | $ | 3.63 | $ | 2.43 | $ | 1.69 | $ | 2.03 | |||||||||
Earnings per share – diluted | $ | 3.33 | $ | 3.45 | $ | 2.32 | $ | 1.65 | $ | 1.96 | |||||||||
Cash dividends declared per common share | $ | 2.07 | $ | 1.82 | $ | 1.64 | $ | 1.51 | $ | 1.42 | |||||||||
Economic Earnings(4) | $ | 46,496 | $ | 41,445 | $ | 30,027 | $ | 23,233 | $ | 25,647 | |||||||||
Economic Earnings per common share | $ | 5.71 | $ | 5.24 | $ | 3.90 | $ | 3.18 | $ | 3.54 | |||||||||
________________
(1) | The financial results of Woodway are included in our 2015 results from the acquisition date of April 1, 2015. Our 2015 results also include a pre-tax $1.0 million non-cash charge related to acceleration of stock based compensation expense for a particular grant and $807,000 tax expense for uncertain tax positions related to prior years. These items negatively impacted diluted earnings per share by $0.08 and $0.10, respectively. |
(2) | Our 2014 Income before income taxes as a percentage of Total revenues improved as increases in Total revenues outpaced increases in expenses. |
(3) | Our 2012 financial results were negatively impacted by start-up costs related to Westwood International, which was established in the second quarter of 2012. |
(4) | See the definition of Economic Earnings and the reconciliation to Net Income in “Supplemental Financial Information” in Item 7, “Management’s Discussion and Analysis of Financial Condition and Results of Operations – Supplemental Financial Information.” |
As of December 31, | ||||||||||||||||||||
2015 | 2014 | 2013 | 2012 | 2011 | ||||||||||||||||
Consolidated Balance Sheets Data (in thousands): | ||||||||||||||||||||
Cash and investments | $ | 95,060 | $ | 97,751 | $ | 75,418 | $ | 63,723 | $ | 60,132 | ||||||||||
Total assets | 181,336 | 139,874 | 116,050 | 96,617 | 90,902 | |||||||||||||||
Stockholders’ equity | 133,967 | 110,007 | 88,663 | 76,553 | 71,062 | |||||||||||||||
Assets Under Management (in millions)(1) | $ | 20,762 | $ | 20,168 | $ | 18,861 | $ | 14,102 | $ | 13,011 | ||||||||||
________________
(1) | Due to an immaterial error relating to the aggregation of Private Wealth assets under management ("AUM"), AUM was overstated, and assets under advisement ("AUA") was understated, for certain prior periods. Adjustments to correct the immaterial error have been made in this Report. Specifically, previously-reported AUM as of December 31, 2011, 2012, 2013 and 2014 were overstated by $68.0 million, $64.9 million, $70.0 million and $82.6 million, respectively, and have been adjusted in the above table accordingly. The corrections to AUM represent a 2% adjustment to Private Wealth AUM and less than a 1% adjustment to Total AUM as previously reported as of each of such dates. |
24
Item 7. | Management’s Discussion and Analysis of Financial Condition and Results of Operations. |
You should read the following discussion and analysis in conjunction with “Selected Financial Data” included in this Report, as well as our consolidated financial statements and related notes thereto appearing elsewhere in this Report.
Forward-Looking Statements
Statements in this Report and the Annual Report to Stockholders that are not purely historical facts, including, without limitation, statements about our expected future financial position, results of operations or cash flows, as well as other statements including, without limitation, words such as “anticipate,” “forecast”, “believe,” “plan,” “estimate,” “expect,” “intend,” “should,” “could,” “goal,” “may,” “target,” “designed,” “on track,” “comfortable with,” “optimistic” and other similar expressions, constitute forward-looking statements within the meaning of Section 27A of the Securities Act of 1933, as amended, and Section 21E of the Exchange Act. Because forward-looking statements relate to the future, they are subject to inherent uncertainties, risks and changes in circumstances that are difficult to predict and many of which are outside of our control. Actual results, our financial condition, and the timing of some events could differ materially from those projected in or contemplated by the forward-looking statements. Therefore, you should not rely on any of these forward-looking statements. Important factors that could cause our actual results and financial condition to differ materially from those indicated in the forward-looking statements include, among others:
• | the composition and market value of our assets under management; |
• | regulations adversely affecting the financial services industry; |
• | competition in the investment management industry; |
• | our investments in foreign companies; |
• | our ability to develop and market new investment strategies successfully; |
• | our ability to pursue and properly integrate acquired businesses; |
• | litigation risks; |
• | our ability to retain qualified personnel; |
• | our relationships with current and potential customers; |
• | our ability to properly address conflicts of interest; |
• | our ability to maintain effective information systems; |
• | our ability to maintain effective cyber security; |
• | our ability to maintain adequate insurance coverage; |
• | our ability to maintain an effective system of internal controls |
• | our ability to maintain our fee structure in light of competitive fee pressures; |
• | our relationships with investment consulting firms; and |
• | the significant concentration of our revenues in a small number of customers. |
Additional factors that could cause our actual results and financial condition to differ materially from those indicated in the forward-looking statements are discussed under the section entitled “Item 1A. Risk Factors” and elsewhere in this Report. The forward-looking statements are based only on currently available information and speak only as of the date of this Report. We are not obligated and do not undertake an obligation to publicly release any revisions to these forward-looking statements to reflect events or circumstances occurring after the date of this Report or to reflect the occurrence of unanticipated events or otherwise.
25
Overview
We manage investment assets and provide services for our clients through our subsidiaries, Westwood Management, Westwood Trust and Westwood International. Westwood Management and Westwood International provide investment advisory services to institutional clients, the Westwood Funds®, other mutual funds, an Ireland-domiciled fund organized pursuant to the European Union’s Undertakings for Collective Investment in Transferable Securities (“UCITS”), individuals and clients of Westwood Trust. Westwood Trust provides trust and custodial services and participation in common trust funds to institutions and high net worth individuals. Our revenues are generally derived from fees based on a percentage of assets under management, and at December 31, 2015 Westwood Management, Westwood International and Westwood Trust collectively managed assets valued at approximately $20.8 billion. We believe we have established a track record of delivering competitive risk-adjusted returns for our clients.
With respect to the bulk of our client assets under management, we utilize a “value” investment style focused on achieving superior long-term, risk-adjusted returns by investing in companies with high levels of free cash flow, improving returns on equity, strengthening balance sheets and that are well positioned for growth but whose value is not fully recognized in the marketplace. This investment approach is designed to preserve capital during unfavorable periods and provide superior real returns over the long term. Our investment teams have significant industry experience. Our investment team members have average investment experience of fifteen years.
We have focused on building a foundation in terms of personnel and infrastructure to support a potentially much larger business. We have also developed investment strategies that we believe will be desirable within our target institutional, private wealth and mutual fund markets. The cost of developing new products and growing the organization as a whole has resulted in our incurring expenses that, in some cases, do not currently have significant offsetting revenues. While we continue to evolve our products, we believe that the appropriate foundation and products are in place such that investors will recognize the value in these products, thereby generating new revenue streams for Westwood.
2015 Highlights
The following items are highlights for the year ended December 31, 2015:
• | Assets under management as of December 31, 2015 were $20.8 billion, a 3% increase compared to December 31, 2014; average assets under management for 2015 were $21.5 billion, a 9% increase compared to 2014. |
• | We launched three new mutual funds during 2015, bringing the mutual funds now offered to a total of 15. |
• | We completed the acquisition of Woodway on April 1, 2015, bringing Private Wealth assets to 26% of our firm-wide assets under management. |
• | Our U.S. Value Equity, Multi-Asset and Global Convertibles strategies posted strong performance for clients. |
• | Total revenue was a record $130.9 million, a 16% increase over 2014. |
• | In October 2015, the Board approved a 14% increase in our quarterly dividend to $0.57 per share, or an annual rate of $2.28, resulting in a dividend yield of 4.4% using the year-end stock price of $52.09 per share. |
• | Our financial position remains strong with liquid cash and investments of $95.1 million as of December 31, 2015. |
Revenues
We derive our revenues from investment advisory fees, trust fees, and other revenues. Our advisory fees are generated by Westwood Management and Westwood International, which manage client accounts under investment advisory and subadvisory agreements. Advisory fees are calculated based on a percentage of assets under management and are paid in accordance with the terms of the agreements. Advisory fees are paid quarterly in advance based on assets under management on the last day of the preceding quarter, quarterly in arrears based on assets under management on the last day of the quarter just ended, or are based on a daily or monthly analysis of assets under management for the stated period. We recognize advisory fee revenues as services are rendered. A limited number of our clients have a contractual performance-based fee component in their contracts, which generates additional revenues if we outperform a specified index over a specific period of time. We record revenue for performance-based fees at the end of the measurement period. Since our advance paying clients’ billing periods coincide with the calendar quarter to which such payments relate, revenue is recognized within the quarter, and our consolidated financial statements contain no deferred advisory fee revenues.
26
Our trust fees are generated by Westwood Trust pursuant to trust or custodial agreements. Trust fees are separately negotiated with each client and are generally based on a percentage of assets under management. Westwood Trust also provides trust services to a small number of clients on a fixed fee basis. Most trust fees are paid quarterly in advance and are recognized as services are rendered. Since billing periods for the majority of Westwood Trust’s advance paying clients coincide with the calendar quarter, revenue is fully recognized within the quarter and our consolidated financial statements do not contain a significant amount of deferred revenues.
Our other revenues generally consist of interest and investment income. Although we generally invest most of our cash in U.S. Treasury securities, we also invest in equity and fixed income instruments and money market funds, including seed money for new investment strategies.
Employee Compensation and Benefits
Employee compensation and benefits costs generally consist of salaries, incentive compensation, equity-based compensation expense and benefits.
Sales and Marketing
Sales and marketing costs relate to our marketing efforts, including travel and entertainment, direct marketing and advertising costs.
Westwood Mutual Funds
Westwood Mutual Funds expenses relate to our marketing, distribution and administration efforts related to the Westwood Funds®.
Information Technology
Information technology expenses are generally costs associated with proprietary investment research tools, maintenance and support, computing hardware, software licenses, telecommunications and other related costs.
Professional Services
Professional services expenses generally consist of costs associated with subadvisory fees, audit, legal and other professional services.
General and Administrative
General and administrative expenses generally consist of costs associated with the lease of office space, investor relations, licenses and fees, depreciation, insurance, office supplies and other miscellaneous expenses.
27
Assets Under Management
Assets under management increased $600 million, or 3%, to $20.8 billion at December 31, 2015 compared to $20.2 billion at December 31, 2014. Quarterly average assets under management increased $1.7 billion, up 8.6%, to $21.5 billion for 2015 compared with $19.8 billion for 2014.
Assets under management increased $1.3 billion, or 7%, to $20.2 billion at December 31, 2014 compared to $18.9 billion at December 31, 2013. Quarterly average assets under management increased $3.7 billion, up 23.0%, to $19.8 billion for 2014 compared with $16.1 billion for 2013.
The following table sets forth our assets under management as of December 31, 2015, 2014 and 2013:
As of December 31, (in millions) | % Change | |||||||||||||||||
2015 | 2014 | 2013 | 2015 vs. 2014 | 2014 vs. 2013 | ||||||||||||||
Institutional | $ | 11,752 | $ | 12,471 | $ | 12,139 | (6 | )% | 3 | % | ||||||||
Private Wealth(1) | 5,393 | 3,974 | 3,938 | 36 | % | 1 | % | |||||||||||
Mutual Funds | 3,617 | 3,723 | 2,784 | (3 | )% | 34 | % | |||||||||||
Total Assets Under Management(2) | $ | 20,762 | $ | 20,168 | $ | 18,861 | 3 | % | 7 | % | ||||||||
________________
(1) | Due to an immaterial error relating to the aggregation of Private Wealth AUM, AUM was overstated, and AUA was understated, for certain prior periods. Adjustments to correct the immaterial error have been made in this Report. Specifically, previously-reported AUM as of December 31, 2013 and December 31, 2014 were overstated by $70.0 million and $82.6 million, respectively, and have been adjusted in the above table accordingly. The corrections to AUM represent a 2% adjustment to Private Wealth AUM and less than a 1% adjustment to Total AUM as previously reported as of each of such dates. |
(2) | AUM for 2015, 2014, and 2013 excludes approximately $336.8 million, $670.3 million, and $214.7 million of assets under advisement, respectively, related to model portfolios, for which we currently provide consulting advice but for which we do not have direct discretionary investment authority. During the fourth quarter of 2015, approximately $330 million of assets related to our market neutral income strategy transitioned from AUA to AUM. |
Our assets under management disclosure reflects management’s view of our three types of accounts: institutional, private wealth and mutual funds.
• | Institutional includes separate accounts of corporate pension and profit sharing plans, public employee retirement funds, Taft-Hartley plans, endowments, foundations and individuals; subadvisory relationships where Westwood provides investment management services for funds offered by other financial institutions; pooled investment vehicles, including UCITS funds and collective investment trusts; and managed account relationships with brokerage firms and other registered investment advisors that offer Westwood products to their customers. |
• | Private Wealth includes assets for which Westwood Trust provides trust and custodial services and participation in common trust funds that it sponsors to institutions and high net worth individuals pursuant to trust or agency agreements and assets for which Westwood Management provides advisory services in ten limited liability companies to high net worth individuals. Investment subadvisory services are provided for the common trust funds by Westwood Management, Westwood International and external, unaffiliated subadvisors. For certain assets in this category, Westwood Trust currently provides limited custody services for a minimal or no fee, but views these assets as potentially converting to fee-generating managed assets in the future. As an example, some assets in this category consist of low-basis stock currently held in custody for clients where we believe such assets may convert to fee-generating managed assets during an inter-generational transfer of wealth at a future date. |
• | Mutual Funds include the Westwood Funds®, a family of mutual funds for which Westwood Management serves as advisor. These funds are available to individual investors, as well as offered as part of our investment strategies for institutional and private wealth accounts. |
28
Roll-Forward of Assets Under Management
Year Ended December 31, 2015 (1) | ||||||||||||||||
(in millions) | Institutional | Private Wealth (2) | Mutual Funds | Total | ||||||||||||
Beginning of period assets | $ | 12,471 | $ | 3,974 | $ | 3,723 | $ | 20,168 | ||||||||
Client flows: | ||||||||||||||||
Inflows/new accounts(3) | 2,456 | 806 | 1,541 | 4,803 | ||||||||||||
Outflows/closed accounts | (2,305 | ) | (815 | ) | (1,509 | ) | (4,629 | ) | ||||||||
Net inflows (outflows) | 151 | (9 | ) | 32 | 174 | |||||||||||
Acquisition related | — | 1,583 | — | 1,583 | ||||||||||||
Market depreciation | (870 | ) | (155 | ) | (138 | ) | (1,163 | ) | ||||||||
Net change | (719 | ) | 1,419 | (106 | ) | 594 | ||||||||||
End of period assets | $ | 11,752 | $ | 5,393 | $ | 3,617 | $ | 20,762 | ||||||||
________________
(1) | In the table above, we have revised the presentation of gross inflows and outflows for Institutional, Private Wealth and Mutual Fund AUM, as well as reclassified certain transactions for consistency. Prior periods have been revised to reflect the changes in Mutual Fund presentation; however, prior periods have not been revised for Institutional and Private Wealth presentation, as management believes these changes are not significant. |
(2) | Due to an immaterial error relating to the aggregation of Private Wealth AUM, AUM was overstated, and AUA was understated, for certain prior periods. Adjustments to correct the immaterial error have been made in this report. Specifically, previously-reported AUM as of December 31, 2014 were overstated by $82.6 million and has been adjusted in the above table accordingly. The corrections to AUM represent a 2% adjustment to Private Wealth AUM and less than a 1% adjustment to Total AUM as previously reported. |
(3) | Institutional inflows include approximately $330 million of assets related to our global convertibles strategy, which transitioned from AUA to AUM during the fourth quarter of 2015. |
The increase in assets under management for the year ended December 31, 2015 was due to the acquisition of Woodway, which contributed $1.6 billion of assets under management, and net inflows of $174 million, partially offset by market depreciation of $1.2 billion. Inflows were primarily inflows into institutional accounts in our Emerging Markets Plus, Income Opportunity, MLP and SmallCap Value strategies and inflows into our Emerging Markets, MLP and SmallCap Value mutual funds, as well as the movement of an account in our market neutral income strategy from assets under advisement to assets under management during the fourth quarter of 2015. Outflows were primarily related to withdrawals and rebalancing by certain clients in our LargeCap Value, SMidCap and Emerging Markets strategies and our Westwood Income Opportunity, SMidCap and Short Duration High Yield mutual funds.
Year Ended December 31, 2014 (1) (2) | ||||||||||||||||
(in millions) | Institutional | Private Wealth | Mutual Funds | Total | ||||||||||||
Beginning of period assets | $ | 12,139 | $ | 3,938 | $ | 2,784 | $ | 18,861 | ||||||||
Client flows: | ||||||||||||||||
Inflows/new accounts | 2,062 | 355 | 1,392 | 3,809 | ||||||||||||
Outflows/closed accounts | (2,655 | ) | (412 | ) | (721 | ) | (3,788 | ) | ||||||||
Net inflows (outflows) | (593 | ) | (57 | ) | 671 | 21 | ||||||||||
Market appreciation | 925 | 93 | 268 | 1,286 | ||||||||||||
Net change | 332 | 36 | 939 | 1,307 | ||||||||||||
End of period assets | $ | 12,471 | $ | 3,974 | $ | 3,723 | $ | 20,168 | ||||||||
________________
(1) | In the table above, we have revised the presentation of gross inflows and outflows for Institutional, Private Wealth and Mutual Fund AUM, as well as reclassified certain transactions for consistency. Prior periods have been revised to reflect the changes in Mutual Fund presentation; however, prior periods have not been revised for Institutional and Private Wealth presentation, as management believes these changes are not significant. |
(2) | Due to an immaterial error relating to the aggregation of Private Wealth AUM, AUM was overstated, and AUA was understated, for certain prior periods. Adjustments to correct the immaterial error have been made in this report. Specifically, previously-reported AUM as of December 31, 2013 and December 31, 2014 were overstated by $70.0 million and $82.6 million, respectively, and have been adjusted in the above table accordingly. The corrections to AUM represent a 2% adjustment to Private Wealth AUM and less than a 1% adjustment to Total AUM as previously reported as of each of such dates. |
The increase in assets under management for the year ended December 31, 2014 was primarily due to market appreciation of $1.3 billion and neutral net client flows. Inflows were primarily inflows into institutional accounts in our Emerging Markets strategies and the Westwood Income Opportunity mutual fund. Outflows were primarily related to withdrawals and rebalancing by certain clients in our LargeCap Value strategy.
29
Year Ended December 31, 2013 (1) (2) | ||||||||||||||||
(in millions) | Institutional | Private Wealth | Mutual Funds | Total | ||||||||||||
Beginning of period assets | $ | 9,225 | $ | 3,274 | $ | 1,603 | $ | 14,102 | ||||||||
Client flows: | ||||||||||||||||
Inflows/new accounts | 2,713 | 535 | 1,294 | 4,542 | ||||||||||||
Outflows/closed accounts | (2,094 | ) | (482 | ) | (493 | ) | (3,069 | ) | ||||||||
Net inflows | 619 | 53 | 801 | 1,473 | ||||||||||||
Market appreciation | 2,295 | 611 | 380 | 3,286 | ||||||||||||
Net change | 2,914 | 664 | 1,181 | 4,759 | ||||||||||||
End of period assets | $ | 12,139 | $ | 3,938 | $ | 2,784 | $ | 18,861 | ||||||||
________________
(1) | In the table above, we have revised the presentation of gross inflows and outflows for Institutional, Private Wealth and Mutual Fund AUM, as well as reclassified certain transactions for consistency. Prior periods have been revised to reflect the changes in Mutual Fund presentation; however, prior periods have not been revised for Institutional and Private Wealth presentation, as management believes these changes are not significant. |
(2) | Due to an immaterial error relating to the aggregation of Private Wealth AUM, AUM was overstated, and AUA was understated, for certain prior periods. Adjustments to correct the immaterial error have been made in this report. Specifically, previously-reported AUM as of December 31, 2012 and December 31, 2013 were overstated by $64.9 million and $70.0 million, respectively, and have been adjusted in the above table accordingly. The corrections to AUM represent a 2% adjustment to Private Wealth AUM and less than a 1% adjustment to Total AUM as previously reported as of each of such dates. |
The increase in assets under management for the year ended December 31, 2013 was primarily due to inflows of $4.5 billion and market appreciation of $3.3 billion, partially offset by outflows of $3.1 billion. Inflows were primarily driven by inflows into institutional accounts in our Emerging Markets strategies, inflows into the Westwood Income Opportunity mutual fund and inflows from certain clients in our Master Limited Partnership Infrastructure Renewal (“MLP”) strategy. Outflows were primarily related to withdrawals and rebalancing by certain clients in our LargeCap Value strategy.
30
Results of Operations
The following table and discussion of our results of operations is based upon data derived from our consolidated statements of income contained in our consolidated financial statements and should be read in conjunction with these statements, which are included elsewhere in this Report.
Years ended December 31, (in thousands) | % Change | |||||||||||||||||
2015 | 2014 | 2013 | 2015 vs. 2014 | 2014 vs. 2013 | ||||||||||||||
Revenues | ||||||||||||||||||
Advisory fees: | ||||||||||||||||||
Asset-based | $ | 99,275 | $ | 88,473 | $ | 70,027 | 12 | % | 26 | % | ||||||||
Performance-based | 2,698 | 3,806 | 2,561 | (29 | ) | 49 | ||||||||||||
Trust fees | 28,795 | 20,525 | 18,367 | 40 | 12 | |||||||||||||
Other revenues, net | 168 | 437 | 870 | (62 | ) | (50 | ) | |||||||||||
Total revenues | 130,936 | 113,241 | 91,825 | 16 | 23 | |||||||||||||
Expenses | ||||||||||||||||||
Employee compensation and benefits | 63,562 | 52,847 | 47,864 | 20 | 10 | |||||||||||||
Sales and marketing | 1,839 | 1,673 | 1,252 | 10 | 34 | |||||||||||||
Westwood mutual funds | 3,435 | 2,543 | 2,153 | 35 | 18 | |||||||||||||
Information technology | 5,732 | 3,469 | 2,882 | 65 | 20 | |||||||||||||
Professional services | 5,617 | 4,905 | 4,223 | 15 | 16 | |||||||||||||
General and administrative | 8,531 | 5,768 | 5,266 | 48 | 10 | |||||||||||||
Total expenses | 88,716 | 71,205 | 63,640 | 25 | 12 | |||||||||||||
Income before income taxes | 42,220 | 42,036 | 28,185 | — | 49 | |||||||||||||
Provision for income taxes | 15,115 | 14,787 | 10,348 | 2 | 43 | |||||||||||||
Net income | $ | 27,105 | $ | 27,249 | $ | 17,837 | (1 | )% | 53 | % | ||||||||
Year Ended December 31, 2015 Compared to Year Ended December 31, 2014
Total Revenues. Total revenues increased $17.7 million, or 16%, to $130.9 million for fiscal 2015 compared with $113.2 million for fiscal 2014. The increase was attributable to a 12%, or $10.8 million, increase in asset-based advisory fees and a 40%, or $8.3 million, increase in Trust fees. Advisory-based fees increased as a result of higher average assets under management and higher average advisory fee rates in 2015 compared to 2014. The Woodway acquisition contributed $7.7 million of the increase in Trust fees. These increases were partially offset by a decrease in performance-based fees of $1.1 million.
Employee Compensation and Benefits. Employee compensation and benefit costs increased $10.8 million, or 20%, to $63.6 million in fiscal 2015 compared with $52.8 million in fiscal 2014. This increase was primarily due to increases of $3.8 million in salary expense and incentive compensation, primarily relating to additional hires at Westwood Holdings, Westwood Management and Westwood Trust, $3.5 million in restricted stock expense, including a $1.0 million non-cash charge related to acceleration of stock based compensation expense for a particular grant, and $3.1 million in compensation and benefits related to 27 Woodway employees. These increases were partially offset by a decrease in the amortization of long-term incentive awards for Westwood International employees. We had 168 full-time employees as of December 31, 2015 compared to 130 at December 31, 2014.
Sales and Marketing. Sales and marketing expenses increased 10% to $1.8 million for fiscal 2015 compared to $1.7 million for fiscal 2014, primarily due to incremental costs associated with the Woodway acquisition.
Westwood Mutual Funds. Westwood mutual funds expenses increased 35% to $3.4 million for fiscal 2015 compared to $2.5 million for fiscal 2014. The launch of two new mutual funds during the fourth quarter of 2014 and the launch of three new mutual funds during the second quarter of 2015, along with increased overall shareholder servicing costs and higher subadvisor fees based on a percentage of assets under management, drove the increase.
Information Technology. Information technology expenses increased 65%, to $5.7 million for fiscal 2015 compared with $3.5 million for fiscal 2014 due to increased research and support expenses, increased costs associated with implementing a new information technology platform, and incremental support costs related to the Woodway acquisition.
31
Professional Services. Professional services expenses increased 15% to $5.6 million for fiscal 2015 compared to $4.9 million for fiscal 2014, primarily due to $0.7 million in transaction costs related to the Woodway acquisition recognized in 2015.
General and Administrative. General and administrative expenses increased 48%, to $8.5 million for fiscal 2015 compared with $5.8 million for fiscal 2014, primarily due to an incremental $1.2 million in amortization of intangible assets related to the Woodway acquisition, with the remainder of the increase related to other support items.
Provision for Income Taxes. Provision for income taxes increased 2% to $15.1 million for fiscal 2015 compared to $14.8 million for fiscal 2014. The effective tax rate increased to 35.8% in 2015 compared to 35.2% in 2014. The increase is related to a $1.0 million tax charge for uncertain tax positions related to current and prior years (net of federal benefit), partially offset by an increase in operating income generated by Westwood International, which is taxed at a lower Canadian tax rate.
Year Ended December 31, 2014 Compared to Year Ended December 31, 2013
Total Revenues. In 2014 our total revenues increased by 23% to $113.2 million compared with $91.8 million in 2013. Asset-based advisory fees increased by 26% to $88.5 million in 2014 from $70.0 million in 2013 due to higher average assets under management, primarily due to market appreciation. We earned a performance-based advisory fee of $3.8 million in 2014 compared to $2.6 million in 2013. Trust fees increased by 12% to $20.5 million in 2014 from $18.4 million in 2013 as a result of increased assets under management at Westwood Trust, primarily due to market appreciation. Other revenues, which generally consist of interest and investment income, decreased by $0.5 million to $0.4 million in 2014 compared with $0.9 million in 2013 primarily due to a decrease in dividend income.
Employee Compensation and Benefits. Employee compensation and benefits increased by 10% to $52.8 million compared with $47.9 million in 2013. This increase was primarily due to net increases of $2.1 million in salary expense, primarily relating to additional hires at Westwood Management, Westwood Trust and Westwood International, $2.0 million in performance-based restricted stock expense and $1.8 million incentive compensation. These increases were partially offset by a decrease in the amortization of long-term incentive awards for Westwood International employees. We had 130 full-time employees as of December 31, 2014 compared to 106 at December 31, 2013.
Sales and Marketing. Sales and marketing costs increased by 34% to $1.7 million in 2014 compared with $1.3 million in 2013 primarily due to increased referral fees.
Westwood Mutual Funds. Westwood Mutual Funds expenses increased by 18% to $2.5 million in 2014 compared with $2.2 million in 2013, primarily due to increases in shareholder servicing and subadvisor fees based on a percentage of assets under management. The expense has remained consistent as a percentage of total revenues.
Information Technology. Information technology expense increased by 20% to $3.5 million in 2014 compared with $2.9 million in 2013 primarily due to increased research expenses and maintenance and support expenses. The expense has remained consistent as a percentage of total revenues.
Professional Services. Professional services expenses increased by 16% to $4.9 million in 2014 compared with $4.2 million in 2013, primarily due to increases in subadvisory fees and other professional services expense, partially offset by a decrease in legal and tax advisory expenses.
General and Administrative. General and administrative expenses increased by 10% to $5.8 million in 2014 compared with $5.3 million in 2013 due to increases in various support services.
Provision for Income Taxes. Provision for income taxes increased by 43% to $14.8 million in 2014 compared with $10.3 million in 2013. The effective tax rate decreased to 35.2% in 2014 from 36.7% in 2013 primarily due to operating income generated by Westwood International in the 2014 period, which are taxed at a lower Canadian tax rate, compared to operating losses generated by Westwood International in the 2013 period.
32
Supplemental Financial Information
As supplemental information, we provide a non-U.S. generally accepted accounting principles (“non-GAAP”) performance measure that we refer to as Economic Earnings. We provide this measure in addition to, but not as a substitute for, net income reported on a U.S. generally accepted accounting principles (“GAAP”) basis. Our management and the Board of Directors review Economic Earnings to evaluate our ongoing performance, allocate resources and review our dividend policy. We believe that this non-GAAP performance measure, while not a substitute for GAAP net income, is useful for management and investors when evaluating our underlying operating and financial performance and our available resources. We do not advocate that investors consider this non-GAAP measure without considering financial information prepared in accordance with GAAP.
In calculating Economic Earnings, we add to net income the non-cash expense associated with equity-based compensation awards of restricted stock, amortization of intangible assets and deferred taxes related to the tax-basis amortization of goodwill. Although depreciation on property and equipment is a non-cash expense, we do not add it back when calculating Economic Earnings because depreciation charges represent a decline in the value of the related assets that will ultimately require replacement.
For the year ended December 31, 2015, our Economic Earnings increased by 12% to $46.5 million compared with $41.4 million for the year ended December 31, 2014, primarily due to increases in total revenues outpacing increases in expenses.
The following table provides a reconciliation of net income to Economic Earnings for the years presented:
For the years ended December 31, (in thousands, except share data) | % Change | |||||||||||||||||||||||||||||||
2015 | 2014 | 2013 | 2012 | 2011 | 2015 vs. 2014 | 2014 vs. 2013 | 2013 vs. 2012 | 2012 vs. 2011 | ||||||||||||||||||||||||
Net Income | $ | 27,105 | $ | 27,249 | $ | 17,837 | $ | 12,086 | $ | 14,155 | (1 | )% | 53 | % | 48 | % | (15 | )% | ||||||||||||||
Add: Restricted stock expense | 17,574 | 13,685 | 11,679 | 10,521 | 10,805 | 28 | 17 | 11 | (3 | ) | ||||||||||||||||||||||
Add: Intangible amortization | 1,546 | 359 | 359 | 472 | 498 | 331 | — | (24 | ) | (5 | ) | |||||||||||||||||||||
Add: Tax benefit from goodwill amortization | 271 | 152 | 152 | 154 | 189 | 78 | — | (1 | ) | (19 | ) | |||||||||||||||||||||
Economic Earnings | $ | 46,496 | $ | 41,445 | $ | 30,027 | $ | 23,233 | $ | 25,647 | 12 | % | 38 | % | 29 | % | (9 | )% | ||||||||||||||
Economic Earnings per Share | $ | 5.71 | $ | 5.24 | $ | 3.90 | $ | 3.18 | $ | 3.54 | 9 | % | 34 | % | 23 | % | (10 | )% | ||||||||||||||
Liquidity and Capital Resources
As of December 31, (in thousands) | ||||||||
Balance Sheet Data | 2015 | 2014 | ||||||
Assets: | ||||||||
Cash and cash equivalents | $ | 22,740 | $ | 18,131 | ||||
Accounts receivable | 19,618 | 14,540 | ||||||
Total liquid assets | 42,358 | 32,671 | ||||||
Investments | $ | 72,320 | $ | 79,620 | ||||
We had cash and investments of $95.1 million and $97.8 million as of December 31, 2015 and December 31, 2014, respectively. Cash and cash equivalents as of December 31, 2015 and December 31, 2014 includes $15.5 million and $12.9 million, respectively, of undistributed income from Westwood International that we consider to be permanently invested. If these funds were needed for our U.S. operations, we would be required to accrue and pay incremental U.S. taxes to repatriate these funds. However, our intent is to permanently reinvest these funds outside of the U.S. and our current plans do not demonstrate a need to repatriate them to fund our U.S. operations.
At December 31, 2015 and 2014, working capital aggregated $72.8 million and $91.6 million, respectively. As required by the Finance Code, Westwood Trust is subject to a required minimum capital requirement of $4.0 million. At December 31, 2015, Westwood Trust had approximately $8.9 million in excess of its minimum capital requirement. We had no debt at December 31, 2015 or December 31, 2014.
33
For the years ended December 31, (in thousands) | ||||||||||||
Cash Flow Data | 2015 | 2014 | 2013 | |||||||||
Operating cash flows | $ | 55,208 | $ | 26,523 | $ | 21,705 | ||||||
Investing cash flows | (25,084 | ) | (478 | ) | (1,201 | ) | ||||||
Financing cash flows | (22,139 | ) | (17,971 | ) | (13,301 | ) | ||||||
Historically we have funded our operations and cash requirements with cash generated from operating activities. We may also use cash from operations to pay dividends to our stockholders. As of December 31, 2015 and December 31, 2014, we had no debt. The changes in net cash provided by operating activities generally reflect the changes in earnings plus the effects of non-cash items and changes in working capital. Changes in working capital, especially accounts receivable and accounts payable generally result from timing differences between collection of fees billed and payment of operating expenses.
During 2015, cash flow provided by operating activities, principally our investment advisory business, aggregated $55.2 million compared to cash provided by operations of $26.5 million during 2014 and $21.7 million during 2013. The increase of $28.7 million in 2015 was primarily due to cash transferred from our investment accounts and working capital. The increase of $4.8 million from 2013 to 2014 was primarily due to increased net income and working capital, partially offset by an increase in cash transferred to our investment accounts.
Cash flow used in investing activities during 2015 of $25.1 million was primarily related to the acquisition of Woodway. Cash flow used in investing activities during 2014 and 2013 of $0.5 million and $1.2 million, respectively, was due to purchases of property and equipment.
Cash used in financing activities of $22.1 million, $18.0 million and $13.3 million during 2015, 2014 and 2013, respectively, primarily related to payment of cash dividends, restricted stock returned for payment of taxes and purchases of treasury shares for our Canadian share award plan, partially offset by excess tax benefits related to vested restricted shares.
Our future liquidity and capital requirements will depend upon numerous factors, including our results of operations, the timing and magnitude of capital expenditures or strategic initiatives, our dividend policy and other business and risk factors described under “Item 1A. Risk Factors” in this Report. We believe that current cash and short-term investment balances and cash generated from operations will be sufficient to meet both the operating and capital requirements of our ordinary business operations through at least the next twelve months and the payment of the contingent consideration related to the Woodway acquisition. However, there can be no assurance that we will not require additional financing within this time frame. The failure to raise needed capital on attractive terms, if at all, could have a material adverse effect on our business, financial condition and results of operations.
Cash Dividends
The following table summarizes dividends declared during 2015 and 2014:
Declaration Date | Record Date | Paid Date | Dividend per Share Declared | |||
2015: | ||||||
February 4, 2015 | March 13, 2015 | April 1, 2015 | $0.50 | |||
April 29, 2015 | June 12, 2015 | July 1, 2015 | $0.50 | |||
July 29, 2015 | September 11, 2015 | October 1, 2015 | $0.50 | |||
October 28, 2015 | December 15, 2015 | January 4, 2016 | $0.57 | |||
$2.07 | ||||||
Declaration Date | Record Date | Paid Date | Dividend per Share Declared | |||
2014: | ||||||
February 6, 2014 | March 14, 2014 | April 1, 2014 | $0.44 | |||
April 17, 2014 | June 13, 2014 | July 1, 2014 | $0.44 | |||
July 29, 2014 | September 15, 2014 | October 1, 2014 | $0.44 | |||
October 23, 2014 | December 15, 2014 | January 2, 2015 | $0.50 | |||
$1.82 | ||||||
34
Contractual Obligations
The following table summarizes our contractual obligations as of December 31, 2015 (in thousands).
Payments due in: | ||||||||||||||||||||
Total | Less than 1 year | 1-3 years | 4-5 years | After 5 years | ||||||||||||||||
Purchase obligations(1) | $ | 9,298 | $ | 1,636 | $ | 3,831 | $ | 3,831 | $ | — | ||||||||||
Operating lease obligations | $ | 15,560 | $ | 2,275 | $ | 3,802 | $ | 2,683 | $ | 6,800 | ||||||||||
________________
(1) | A “purchase obligation” is defined as an agreement to purchase goods or services that is enforceable and legally binding on us and that specifies all significant terms, including (a) fixed or minimum quantities to be purchased; (b) fixed, minimum or variable price provisions; and (c) the approximate timing of the transaction. Our purchase obligations relate to obligations associated with implementing and operating new information technology platforms and outsourcing services. The above purchase obligations exclude agreements that are cancelable without significant penalty. The contractual obligations in the table above exclude contingent consideration of $9.0 million related to the Woodway acquisition. |
Off-Balance Sheet Arrangements
We do not have any off-balance sheet arrangements.
Critical Accounting Policies and Estimates
The preparation of our consolidated financial statements in conformity with accounting principles generally accepted in the United States requires us to make estimates and assumptions that affect the reported amounts of assets and liabilities, disclosure of contingent losses and liabilities at the date of the consolidated financial statements and the reported amounts of revenues and expenses during the reporting period. In applying accounting principles, we often must make individual estimates and assumptions regarding expected outcomes or uncertainties. Our estimates, judgments and assumptions are continually evaluated based on available information and experience. Because of the use of estimates inherent in the financial reporting process, actual results could differ from those estimates. We believe the following are areas where the degree of judgment and complexity in determining amounts recorded in our consolidated financial statements make accounting policies critical.
Consolidation
The primary beneficiary of variable interest entities ("VIEs") consolidates the VIEs. A VIE is an entity in which (i) the total equity investment at risk is not sufficient to enable the entity to finance its activities without subordinated financial support or (ii) the at-risk equity holders do not have the normal characteristics of a controlling financial interest. That is, the at-risk equity holders do not have the obligation to absorb losses, the right to receive residual returns and/or the right to direct the activities of the entity that most significantly impact the entity’s economic performance. Westwood Trust sponsors common trust funds (“CTFs”) that allow clients to commingle assets to achieve economies of scale. Westwood Management provides investment advisory services to the Westwood Funds®, a family of mutual funds, and to two collective investment trusts (“CITs”). Some clients of Westwood Management hold their investments in ten limited liability companies (“LLCs”). Westwood International and Westwood Management provide investment advisory services to Westwood Investment Funds PLC (the “UCITS Fund”), an Ireland domiciled umbrella-type open ended self-managed investment company authorized by the Central Bank of Ireland on June 18, 2013 pursuant to the European Communities (Undertakings for Collective Investment in Transferrable Securities) Regulations 2011. The CTFs, Westwood Funds®, CITs, LLCs and the UCITS Fund (the “Westwood VIEs”) are considered VIEs because our clients, who hold the equity at risk, do not have a direct or indirect ability through voting or similar rights to make decisions about the funds that have a significant effect on their success. We receive fees for managing assets in these entities commensurate with market rates.
We evaluate all of our advisory relationships and CTFs to determine whether or not we qualify as the primary beneficiary based on whether there is an obligation to absorb the majority of expected losses or a right to receive the majority of residual returns. Since all losses and returns are distributed to the shareholders of the Westwood VIEs, we are not the primary beneficiary and consequently the Westwood VIEs are not included in our consolidated financial statements. We have not provided any financial support that we were not previously contractually obligated to provide and there are no arrangements that would require us to provide additional financial support to any of the Westwood VIEs.
35
Assessing whether or not an entity is a VIE involves judgment and analysis. Factors included in this assessment include the legal organization of the entity, our contractual involvement with the entity and any related party or de facto agent implications of the Company’s involvement with the entity. Determining if the Company is the primary beneficiary of a VIE also requires significant judgment. There is judgment involved to assess if the Company has the power to direct the activities that most significantly impact the entity’s economic results and to assess if the Company has an obligation to absorb the majority of expected losses or a right to receive the majority of residual returns.
Business Combinations
In allocating the purchase price of a business combination, the Company records all assets acquired and liabilities assumed at fair value, with the excess of the purchase price over the aggregate fair values recorded as goodwill. ASC 820, Fair Value Measurements and Disclosures, defines fair value as the price that would be received to sell an asset or paid to transfer a liability in an orderly transaction between market participants at the measurement date. The purchase price of an acquisition is allocated to the underlying assets acquired and liabilities assumed based upon their estimated fair values as of the date of acquisition. To the extent the purchase price exceeds the fair value of the net identifiable tangible and intangible assets acquired and liabilities assumed such excess is allocated to goodwill. The Company determines the estimated fair values after review and consideration of relevant information, including discounted cash flows, quoted market prices and estimates made by management. The fair value assigned to identifiable intangible assets acquired is based on estimates and assumptions made by management at the time of the acquisition. The Company adjusts the preliminary purchase price allocation, as necessary, during the measurement period of up to one year after the acquisition closing date as it obtains more information as to the facts and circumstances existing as of the acquisition date. Acquisition-related costs are recognized separately from the acquisition purchase price and are expensed as incurred.
Goodwill
Goodwill is not amortized but is tested for impairment, at least annually. We assess the recoverability of the carrying amount of goodwill either qualitatively or quantitatively annually as of July 1 of each fiscal year, or whenever events or changes in circumstances indicate that the carrying amount of the assets may not be fully recoverable.
When assessing the recoverability of goodwill, we may first assess qualitative factors. If an initial qualitative assessment indicates that it is more likely than not that the carrying amount exceeds fair value, a quantitative analysis may be required. We may also elect to skip the qualitative assessment and proceed directly to the quantitative analysis.
Recoverability of the carrying value of goodwill is measured at the reporting unit level. We have identified two reporting units, which are consistent with our reporting segments. In performing a quantitative analysis, we measure the recoverability of goodwill for our reporting units using a market multiple approach. The key assumptions used in the market multiple valuation require significant management judgment, including the determination of our peer group and the valuation multiples of such peer group.
If the calculated fair value of a reporting unit is less than the current carrying amount, impairment of the reporting unit may exist. When the recoverability test indicates potential impairment, we will calculate an implied fair value of goodwill for the reporting unit in a manner similar to how goodwill is calculated in a business combination. If the implied fair value of goodwill exceeds the carrying amount of goodwill assigned to the reporting unit, there is no impairment. If the carrying amount of goodwill assigned to a reporting unit exceeds the implied fair value of the goodwill, an impairment loss is recorded to write down the carrying amount.
During 2015, 2014 and 2013, we completed our annual impairment assessments and concluded no impairment losses were required.
36
Intangible Assets
Our definite-lived intangible assets represent the acquisition date fair value of the intangible assets acquired, net of amortization. The values of these assets are comprised mostly of client relationships but also include valuations of trade names and non-compete agreements. In valuing these assets, we made significant estimates regarding the useful life, growth rates and potential attrition of the assets acquired. We periodically review our intangible assets for events or circumstances that would indicate impairment. If we determine the carrying value exceeds fair value, we would record an impairment to remove the amount that exceeded fair value.
During 2015, 2014 and 2013, we completed our annual impairment assessments and concluded no impairment losses were required.
Stock Based Compensation
We have granted restricted stock to employees and non-employee directors. We calculate compensation cost for restricted stock grants by using the fair market value of our common stock at the date of grant, the number of shares issued, an adjustment for restrictions on dividends and an estimate of shares that will not vest due to forfeitures. The estimated number of awards that will ultimately vest requires judgment, and to the extent actual results or updated estimates differ from our current estimates, such amounts will be recorded as a cumulative adjustment in the period estimates are revised. We update our estimated forfeitures quarterly. We amortize compensation cost on a straight-line basis over the applicable service period. Actual forfeitures may vary from our assumptions, which will result in modifications to future compensation costs.
We grant performance-based share awards to certain employees, the vesting of which is subject to the employee’s continuing employment and the Company's achievement of certain performance goals. We assess actual performance versus the predetermined performance goals and record compensation costs once we conclude that it is probable that we will meet the performance goals required to vest the applicable performance based awards.
Accounting for Income Taxes
We operate in several states and countries and are required to allocate our income, expenses and earnings under the various laws and regulations of these tax jurisdictions. Accordingly, our provision for income taxes reflects the statutory tax obligations of the jurisdictions in which we operate. Significant judgment and complex calculations are used when determining our tax liability and in evaluating our tax positions, and we are subject to audits by taxing authorities in each of the jurisdictions in which we operate. We adjust our income tax provision in the period in which we determine that actual outcomes will likely be different from our estimates. Changes in tax laws may result in changes to our tax position and effective tax rates. We include penalties and interest on income-based taxes in the “General and administrative” line on our consolidated statements of comprehensive income.
We have not recognized a deferred tax liability on the undistributed earnings of our foreign subsidiary, Westwood International, because we intend to permanently reinvest such earnings outside the U.S. If these foreign earnings were to be repatriated in the future, the related U.S. tax liability may be reduced by any foreign income taxes previously paid on these earnings.
We are required to assess whether a valuation allowance should be established against our deferred tax assets based on consideration of all available evidence, using a more-likely-than-not standard. As of December 31, 2015 and 2014, we have not recorded a valuation allowance on any deferred tax assets. In the event that sufficient taxable income does not result in future years, a valuation allowance may be required.
We account for uncertain tax positions by recognizing the impact of a tax position in our consolidated financial statements when we believe it is more likely than not that the tax position would not be sustained upon examination by the appropriate tax authority, based on the merits of the position. We periodically review our tax positions and adjust the balances as new information becomes available. In making these assessments, we often must analyze complex tax laws of multiple domestic and international jurisdictions. Upon completion of our analysis in the fourth quarter of 2015, we recorded a liability for specific uncertain tax positions related to current and prior years.
37
Accounting Developments
See Note 2 “Summary of Significant Accounting Policies” to our Consolidated Financial Statements included in Part II, Item 8, “Financial Statements and Supplementary Data” for a description of new accounting standards and their anticipated effects on our Consolidated Financial Statements.
Item 7A. | Quantitative and Qualitative Disclosures about Market Risk. |
Our revenues are primarily generated from fees derived as a percentage of our AUM, which is subject to market risks. Additionally, we invest corporate capital in various financial instruments, including United States treasury bills and equity mutual funds, all of which present inherent market risks. We do not currently participate in any hedging activities, nor do we currently utilize any derivative financial instruments. The following information describes the key aspects of certain financial instruments that involve market risks.
Securities Markets and Interest Rates
The value of assets under management is affected by fluctuations in securities markets and changes in interest rates. Since we derive a substantial portion of our revenues from investment advisory and trust fees based on the value of assets under management, our revenues may be adversely affected by a decline in the prices of securities or changing interest rates. A hypothetical 10% decrease in our average assets under management during the year ended December 31, 2015 would have reduced our reported consolidated total revenue by approximately $13 million.
Our cash equivalents and other investment instruments are exposed to financial market risk due to fluctuations in interest rates, which may affect interest income. We do not expect interest income to be significantly affected by sudden changes in market interest rates.
Foreign Currency Risk
We are exposed to foreign currency fluctuation risk associated with changes in the value of the Canadian dollar relative to the United States dollar, as Westwood International operates in Toronto, Canada. For the year ended December 31, 2015, Westwood International represented 35.3% of our consolidated income before income taxes. Changes in the currency exchange rate result in cumulative translation adjustments included in “Accumulated other comprehensive loss” on our consolidated balance sheets and potentially result in transaction gains or losses, which are included in our earnings. The low and high currency exchange rates for a Canadian dollar into a United States dollar for the year ended December 31, 2015 were 0.7163 and 0.8613, respectively. A hypothetical 10% devaluation in the average quoted United States dollar-equivalent of the Canadian dollar exchange rate during the year ended December 31, 2015 would have reduced our reported consolidated income before income taxes by approximately $1.5 million.
Item 8. | Financial Statements and Supplementary Data |
The reports of independent registered public accounting firms and our consolidated financial statements listed in the accompanying index are included in Item 15 of this Report. See “Index to Financial Statements” on page F-1.
Item 9. | Changes in and Disagreements with Accountants on Accounting and Financial Disclosure. |
During 2015, the Audit Committee of the Board of Directors of the Company completed a competitive process to determine which audit firm would serve as the Company's independent registered public accounting firm. As a result of that process and following careful deliberation, the Company, with the approval of the Audit Committee, dismissed Grant Thornton LLP (“Grant Thornton") as the Company's independent registered public accounting firm on October 3, 2015, effective October 7, 2015.
On and effective as of October 7, 2015, the Company entered into an engagement letter with Deloitte & Touche LLP (“Deloitte") appointing Deloitte as the Company's new independent registered public accounting firm. The Audit Committee of the Company's Board of Directors approved the engagement.
Grant Thornton’s reports on the Company’s consolidated financial statements for the years ended December 31, 2013 and December 31, 2014 contained no adverse opinion or disclaimer of opinion and were not qualified or modified as to uncertainty, audit scope or accounting principles.
The Company had no disagreements with its current or former independent registered public accounting firms.
38
Item 9A. | Controls and Procedures. |
Evaluation of Disclosure Controls and Procedures
We performed an evaluation of the effectiveness of the design and operation of our disclosure controls and procedures under the supervision and with the participation of our management, including our Chief Executive Officer and Chief Financial Officer, as of the end of the period covered by this report. Based on that evaluation, our management, including our Chief Executive Officer and Chief Financial Officer, has concluded that our disclosure controls and procedures were effective at the reasonable assurance level as of December 31, 2015 to ensure that information required to be disclosed by us in the reports we file or submit under the Exchange Act was (a) recorded, processed, summarized and reported within the time periods specified in the SEC’s rules and forms and (b) accumulated and communicated to our management, including our Chief Executive Officer and Chief Financial Officer, to allow timely decisions regarding required disclosure.
In designing and evaluating the disclosure controls and procedures, management recognized that any controls and procedures, no matter how well designed and operated, can provide only reasonable assurance of achieving the desired control objectives.
Management’s Annual Report on Internal Control over Financial Reporting
Our management is responsible for establishing and maintaining adequate internal control over financial reporting. As defined in Exchange Act Rule 13a-15(f), internal control over financial reporting is a process designed by, or under the supervision of, our Chief Executive Officer and Chief Financial Officer and effected by management and other personnel, and overseen by the Board of Directors, to provide reasonable assurance regarding the reliability of financial reporting and the preparation of financial statements for external purposes in accordance with generally accepted accounting principles and includes those policies and procedures that (i) pertain to the maintenance of records that in reasonable detail accurately and fairly reflect the transactions and dispositions of our assets; (ii) provide reasonable assurance that transactions are recorded as necessary to permit preparation of financial statements in accordance with generally accepted accounting principles, and that our receipts and expenditures are being made only in accordance with authorizations of management and our directors; and (iii) provide reasonable assurance regarding prevention or timely detection of unauthorized acquisition, use or disposition of our assets that could have a material effect on the financial statements. Because of its inherent limitations, internal control over financial reporting may not prevent or detect misstatements.
The scope of our assessment of internal control over financial reporting does not include Woodway Financial Advisors (“Woodway”), which we acquired on April 1, 2015. This exclusion is in accordance with the SEC’s general guidance that an assessment of a recently acquired business may be omitted from our assessment in the year of acquisition. Woodway represents approximately $37.6 million of our total assets and $7.7 million of our total revenues for the year ended December 31, 2015.
Our independent registered public accounting firm has issued an audit report on our internal control over financial reporting. This report can be found on page 41.
Changes in Internal Control over Financial Reporting
During the quarterly period ended December 31, 2015, there has been no change in our internal control over financial reporting that has materially affected, or is reasonably likely to materially affect, our internal control over financial reporting.
39
REPORT OF WESTWOOD HOLDINGS GROUP, INC.’S MANAGEMENT ASSESSMENT OF INTERNAL CONTROL OVER FINANCIAL REPORTING
To the Board of Directors and Stockholders of
Westwood Holdings Group, Inc.:
The management of Westwood Holdings Group, Inc. (“Westwood”) is responsible for establishing and maintaining adequate internal control over financial reporting (as defined in Exchange Act Rules 13a-15(f) and 15d-15(f)). Westwood’s internal control system was designed to provide reasonable assurance to the company’s management and Board of Directors regarding the preparation and fair presentation of published financial statements.
All internal control systems, no matter how well designed, contain inherent limitations. Therefore, even those systems determined to be effective can only provide reasonable assurance with respect to financial statement preparation and presentation. Also, projections of any evaluation of the effectiveness of the internal control over financial reporting to future periods are subject to the risk that the controls may become inadequate because of changes in conditions, or that the degree of compliance with the policies or procedures may deteriorate.
The management of Westwood assessed the effectiveness of Westwood’s internal control over financial reporting as of December 31, 2015. In making this assessment, it used the criteria set forth by the Committee of Sponsoring Organizations of the Treadway Commission (COSO) in the 2013 Internal Control — Integrated Framework. Based on our assessment, we believe that, as of December 31, 2015, Westwood’s internal control over financial reporting is effective based on those criteria.
The scope of our assessment of internal control over financial reporting does not include Woodway Financial Advisors (“Woodway”), which we acquired on April 1, 2015. This exclusion is in accordance with the SEC’s general guidance that an assessment of a recently acquired business may be omitted from our assessment in the year of acquisition. Woodway constitutes 5.9% of our Total revenues and 8.0% of Net income of the consolidated financial statement amounts for the year ended December 31, 2015.
Westwood’s independent registered public accounting firm has issued an audit report on our assessment of Westwood’s internal control over financial reporting. This report appears on page 41.
By: | /s/ Brian O. Casey | |
Brian O. Casey, President & Chief Executive Officer | ||
/s/ Tiffany B. Kice | ||
Tiffany B. Kice, Chief Financial Officer | ||
February 25, 2016
Dallas, Texas
40
REPORT OF INDEPENDENT REGISTERED PUBLIC ACCOUNTING FIRM
To the Board of Directors and Stockholders of
Westwood Holdings Group, Inc.
Dallas, Texas
We have audited the internal control over financial reporting of Westwood Holdings Group, Inc. and subsidiaries (the "Company") as of December 31, 2015, based on criteria established in Internal Control - Integrated Framework (2013) issued by the Committee of Sponsoring Organizations of the Treadway Commission. As described in the Report of Westwood Holdings Group, Inc.'s Management’s Assessment of Internal Control over Financial Reporting, management excluded from its assessment the internal control over financial reporting at Woodway Financial Advisors, which was acquired on April 1, 2015 and whose financial results constitute 5.9% of Total revenues and 8.0% of Net income of the consolidated financial statement amounts for the year ended December 31, 2015. Accordingly, our audit did not include the internal control over financial reporting at Woodway Financial Advisors. The Company's management is responsible for maintaining effective internal control over financial reporting and for its assessment of the effectiveness of internal control over financial reporting, included in the accompanying the Report of Westwood Holdings Group, Inc.'s Management’s Assessment of Internal Control over Financial Reporting. Our responsibility is to express an opinion on the Company's internal control over financial reporting based on our audit.
We conducted our audit in accordance with the standards of the Public Company Accounting Oversight Board (United States). Those standards require that we plan and perform the audit to obtain reasonable assurance about whether effective internal control over financial reporting was maintained in all material respects. Our audit included obtaining an understanding of internal control over financial reporting, assessing the risk that a material weakness exists, testing and evaluating the design and operating effectiveness of internal control based on the assessed risk, and performing such other procedures as we considered necessary in the circumstances. We believe that our audit provides a reasonable basis for our opinion.
A company's internal control over financial reporting is a process designed by, or under the supervision of, the company's principal executive and principal financial officers, or persons performing similar functions, and effected by the company's board of directors, management, and other personnel to provide reasonable assurance regarding the reliability of financial reporting and the preparation of financial statements for external purposes in accordance with generally accepted accounting principles. A company's internal control over financial reporting includes those policies and procedures that (1) pertain to the maintenance of records that, in reasonable detail, accurately and fairly reflect the transactions and dispositions of the assets of the company; (2) provide reasonable assurance that transactions are recorded as necessary to permit preparation of financial statements in accordance with generally accepted accounting principles, and that receipts and expenditures of the company are being made only in accordance with authorizations of management and directors of the company; and (3) provide reasonable assurance regarding prevention or timely detection of unauthorized acquisition, use, or disposition of the company's assets that could have a material effect on the financial statements.
Because of the inherent limitations of internal control over financial reporting, including the possibility of collusion or improper management override of controls, material misstatements due to error or fraud may not be prevented or detected on a timely basis. Also, projections of any evaluation of the effectiveness of the internal control over financial reporting to future periods are subject to the risk that the controls may become inadequate because of changes in conditions, or that the degree of compliance with the policies or procedures may deteriorate.
In our opinion, the Company maintained, in all material respects, effective internal control over financial reporting as of December 31, 2015, based on the criteria established in Internal Control - Integrated Framework (2013) issued by the Committee of Sponsoring Organizations of the Treadway Commission.
We have also audited, in accordance with the standards of the Public Company Accounting Oversight Board (United States), the consolidated financial statements as of and for the year ended December 31, 2015 of the Company and our report dated February 25, 2016 expressed an unqualified opinion on those financial statements.
/s/ Deloitte & Touche LLP |
Dallas, Texas |
February 25, 2016 |
41
Item 9B. | Other Information. |
None.
PART III
Item 10. | Directors, Executive Officers and Corporate Governance. |
The information required by this item is or will be set forth in the definitive proxy statement relating to the 2016 Annual Meeting of Stockholders of Westwood Holdings Group, Inc., which is to be filed with the SEC pursuant to Regulation 14A under the Exchange Act (the “Proxy Statement”). The Proxy Statement relates to a meeting of stockholders involving the election of directors and the portions therefrom required to be set forth in this Report by this item are incorporated herein by reference pursuant to General Instruction G(3) to Form 10-K.
Item 11. | Executive Compensation. |
The information required by this item is or will be set forth in the Proxy Statement. The Proxy Statement relates to a meeting of stockholders involving the election of directors and the portions therefrom required to be set forth in this Report by this item are incorporated herein by reference pursuant to General Instruction G(3) to Form 10-K.
Item 12. | Security Ownership of Certain Beneficial Owners and Management and Related Stockholder Matters. |
The information required by this item is or will be set forth in the Proxy Statement. The Proxy Statement relates to a meeting of stockholders involving the election of directors and the portions therefrom required to be set forth in this Report by this item are incorporated herein by reference pursuant to General Instruction G(3) to Form 10-K.
Item 13. | Certain Relationships and Related Transactions, and Director Independence. |
The information required by this item is or will be set forth in the Proxy Statement. The Proxy Statement relates to a meeting of stockholders involving the election of directors and the portions therefrom required to be set forth in this Report by this item are incorporated herein by reference pursuant to General Instruction G(3) to Form 10-K.
Item 14. | Principal Accounting Fees and Services. |
The information required by this item is or will be set forth in the Proxy Statement. The Proxy Statement relates to a meeting of stockholders involving the election of directors and the portions therefrom required to be set forth in this Report by this item are incorporated herein by reference pursuant to General Instruction G(3) to Form 10-K.
PART IV
Item 15. | Exhibits, Financial Statement Schedules. |
Financial Statement Schedules
The financial statements included in this Report are listed in the Index to Financial Statements on page F-1 of this Report. Schedules for which provision is made in the applicable accounting regulations of the SEC are either not required under the related instructions or are inapplicable.
Exhibits
The exhibits required to be furnished pursuant to Item 15 are listed in the Index to Exhibits filed herewith, which Index to Exhibits is incorporated herein by reference.
42
SIGNATURES
Pursuant to the requirements of Section 13 or 15(d) of the Securities Exchange Act of 1934, the registrant has duly caused this report to be signed on its behalf by the undersigned, thereunto duly authorized.
WESTWOOD HOLDINGS GROUP, INC. | ||
By: | /s/ Brian O. Casey | |
Brian O. Casey | ||
President, Chief Executive Officer and Director | ||
Dated: February 25, 2016
POWER OF ATTORNEY
KNOW ALL MEN BY THESE PRESENTS that each of Westwood Holdings Group, Inc., a Delaware corporation, and the undersigned directors and officers of Westwood Holdings Group, Inc. hereby constitutes and appoints Brian O. Casey its, his or her true and lawful attorney-in-fact and agent, for it, him or her and in its, his or her name, place and stead, in any and all capacities, with full power to act alone, to sign any and all amendments to this Report, and to file each such amendment to the Report, with all exhibits thereto, and any and all other documents in connection therewith, with the Securities and Exchange Commission, hereby granting unto said attorney-in-fact and agent full power and authority to do and perform any and all acts and things requisite and necessary to be done in and about the premises as fully to all intents and purposes as it, he or she might or could do in person, hereby ratifying and confirming all that said attorney-in-fact and agent may lawfully do or cause to be done by virtue hereof.
Pursuant to the requirements of the Securities Exchange Act of 1934, this report has been signed below by the following persons on behalf of the registrant and in the capacities and on the dates indicated.
Signatures | Title | |
/s/ Brian O. Casey | President, Chief Executive Officer and Director | |
Brian O. Casey | (Principal Executive Officer) | |
/s/ Tiffany B. Kice | Chief Financial Officer | |
Tiffany B. Kice | (Principal Financial Officer and Principal Accounting Officer) | |
/s/ Richard M. Frank | Chairman of the Board of Directors | |
Richard M. Frank | ||
/s/ Susan M. Byrne | Vice Chairman of the Board of Directors | |
Susan M. Byrne | ||
/s/ Ellen H. Masterson | Director | |
Ellen H. Masterson | ||
/s/ Robert D. McTeer | Director | |
Robert D. McTeer | ||
/s/ Geoffrey R. Norman | Director | |
Geoffrey R. Norman | ||
/s/ Martin J. Weiland | Director | |
Martin J. Weiland | ||
/s/ Raymond E. Wooldridge | Director | |
Raymond E. Wooldridge | ||
43
INDEX TO FINANCIAL STATEMENTS
Page | |
F-1
Report of Independent Registered Public Accounting Firm
To the Board of Directors and Shareholders
Westwood Holdings Group, Inc.
Dallas, Texas
We have audited the accompanying consolidated balance sheet of Westwood Holdings Group Inc. and subsidiaries (the "Company") as of December 31, 2015 and the related consolidated statements of comprehensive income, stockholders' equity, and cash flows for the year then ended. These financial statements are the responsibility of the Company's management. Our responsibility is to express an opinion on these financial statements based on our audit.
We conducted our audit in accordance with the standards of the Public Company Accounting Oversight Board (United States). Those standards require that we plan and perform the audit to obtain reasonable assurance about whether the financial statements are free of material misstatement. An audit includes examining, on a test basis, evidence supporting the amounts and disclosures in the financial statements. An audit also includes assessing the accounting principles used and significant estimates made by management, as well as evaluating the overall financial statement presentation. We believe that our audit provides a reasonable basis for our opinion.
In our opinion, such consolidated financial statements present fairly, in all material respects, the financial position of Westwood Holdings Group, Inc. and subsidiaries as of December 31, 2015 and the results of their operations and their cash flows for the year then ended, in conformity with accounting principles generally accepted in the United States of America.
We have also audited, in accordance with the standards of the Public Company Accounting Oversight Board (United States), the Company's internal control over financial reporting as of December 31, 2015, based on the criteria established in Internal Control - Integrated Framework (2013) issued by the Committee of Sponsoring Organizations of the Treadway Commission and our report dated February 25, 2016 expressed an unqualified opinion on the Company's internal control over financial reporting.
/s/ Deloitte & Touche LLP |
Dallas, Texas |
February 25, 2016 |
F-2
Report of Independent Registered Public Accounting Firm
Board of Directors and Shareholders
Westwood Holdings Group, Inc.
We have audited the accompanying consolidated balance sheet of Westwood Holdings Group, Inc. (a Delaware corporation) and subsidiaries (the “Company”) as of December 31, 2014, and the related consolidated statements of comprehensive income, changes in stockholders’ equity, and cash flows for each of the two years in the period ended December 31, 2014. These financial statements are the responsibility of the Company's management. Our responsibility is to express an opinion on these financial statements based on our audits.
We conducted our audits in accordance with the standards of the Public Company Accounting Oversight Board (United States). Those standards require that we plan and perform the audits to obtain reasonable assurance about whether the financial statements are free of material misstatement. An audit also includes examining, on a test basis, evidence supporting the amounts and disclosures in the financial statements, assessing the accounting principles used and significant estimates made by management, as well as evaluating the overall financial statement presentation. We believe that our audits provide a reasonable basis for our opinions.
In our opinion, the consolidated financial statements referred to above present fairly, in all material respects, the financial position of Westwood Holdings Group, Inc. and subsidiaries as of December 31, 2014, and the results of their operations and their cash flows for each of the two years in the period ended December 31, 2014 in conformity with accounting principles generally accepted in the United States of America.
/s/ Grant Thornton LLP |
Dallas, Texas |
February 25, 2016 |
F-3
WESTWOOD HOLDINGS GROUP, INC. AND SUBSIDIARIES
CONSOLIDATED BALANCE SHEETS
As of December 31, 2015 and 2014
(in thousands, except par values and share amounts)
2015 | 2014 | |||||||
ASSETS | ||||||||
Current Assets: | ||||||||
Cash and cash equivalents | $ | 22,740 | $ | 18,131 | ||||
Accounts receivable | 19,618 | 14,540 | ||||||
Investments, at fair value | 72,320 | 79,620 | ||||||
Deferred income taxes | — | 4,060 | ||||||
Other current assets | 2,926 | 2,413 | ||||||
Total current assets | 117,604 | 118,764 | ||||||
Goodwill | 27,144 | 11,255 | ||||||
Deferred income taxes | 11,042 | 3,792 | ||||||
Intangible assets, net | 23,354 | 3,430 | ||||||
Property and equipment, net of accumulated depreciation of $3,687 and $2,720 | 2,192 | 2,633 | ||||||
Total assets | $ | 181,336 | $ | 139,874 | ||||
LIABILITIES AND STOCKHOLDERS’ EQUITY | ||||||||
Current Liabilities: | ||||||||
Accounts payable and accrued liabilities | $ | 3,549 | $ | 2,334 | ||||
Dividends payable | 5,749 | 4,868 | ||||||
Compensation and benefits payable | 20,264 | 18,504 | ||||||
Contingent consideration | 9,023 | — | ||||||
Income taxes payable | 6,268 | 1,498 | ||||||
Total current liabilities | 44,853 | 27,204 | ||||||
Accrued dividends | 1,699 | 1,450 | ||||||
Deferred rent | 817 | 1,213 | ||||||
Total long-term liabilities | 2,516 | 2,663 | ||||||
Total liabilities | 47,369 | 29,867 | ||||||
Commitments and contingencies (Note 13) | ||||||||
Stockholders’ Equity: | ||||||||
Common stock, $0.01 par value, authorized 25,000,000 shares, issued 9,425,309 and outstanding 8,630,687 shares at December 31, 2015; issued 9,010,255 and outstanding 8,308,460 shares at December 31, 2014 | 94 | 90 | ||||||
Additional paid-in capital | 143,797 | 119,859 | ||||||
Treasury stock, at cost – 794,622 shares at December 31, 2015; 701,795 shares at December 31, 2014 | (34,910 | ) | (29,028 | ) | ||||
Accumulated other comprehensive loss | (4,688 | ) | (1,231 | ) | ||||
Retained earnings | 29,674 | 20,317 | ||||||
Total stockholders’ equity | 133,967 | 110,007 | ||||||
Total liabilities and stockholders’ equity | $ | 181,336 | $ | 139,874 | ||||
See notes to consolidated financial statements.
F-4
WESTWOOD HOLDINGS GROUP, INC. AND SUBSIDIARIES
CONSOLIDATED STATEMENTS OF COMPREHENSIVE INCOME
For the Years Ended December 31, 2015, 2014 and 2013
(in thousands, except shares and per share data)
2015 | 2014 | 2013 | ||||||||||
Revenues: | ||||||||||||
Advisory fees | ||||||||||||
Asset-based | $ | 99,275 | $ | 88,473 | $ | 70,027 | ||||||
Performance-based | 2,698 | 3,806 | 2,561 | |||||||||
Trust fees | 28,795 | 20,525 | 18,367 | |||||||||
Other revenues, net | 168 | 437 | 870 | |||||||||
Total revenues | 130,936 | 113,241 | 91,825 | |||||||||
Expenses: | ||||||||||||
Employee compensation and benefits | 63,562 | 52,847 | 47,864 | |||||||||
Sales and marketing | 1,839 | 1,673 | 1,252 | |||||||||
Westwood mutual funds | 3,435 | 2,543 | 2,153 | |||||||||
Information technology | 5,732 | 3,469 | 2,882 | |||||||||
Professional services | 5,617 | 4,905 | 4,223 | |||||||||
General and administrative | 8,531 | 5,768 | 5,266 | |||||||||
Total expenses | 88,716 | 71,205 | 63,640 | |||||||||
Income before income taxes | 42,220 | 42,036 | 28,185 | |||||||||
Provision for income taxes | 15,115 | 14,787 | 10,348 | |||||||||
Net income | $ | 27,105 | $ | 27,249 | $ | 17,837 | ||||||
Other comprehensive income (loss), net of tax: | ||||||||||||
Foreign currency translation adjustments | (3,457 | ) | (974 | ) | (287 | ) | ||||||
Other comprehensive loss | (3,457 | ) | (974 | ) | (287 | ) | ||||||
Total comprehensive income | $ | 23,648 | $ | 26,275 | $ | 17,550 | ||||||
Earnings per share: | ||||||||||||
Basic | $ | 3.49 | $ | 3.63 | $ | 2.43 | ||||||
Diluted | $ | 3.33 | $ | 3.45 | $ | 2.32 | ||||||
Weighted average shares outstanding: | ||||||||||||
Basic | 7,756,647 | 7,512,348 | 7,331,874 | |||||||||
Diluted | 8,149,399 | 7,906,545 | 7,692,756 | |||||||||
See notes to consolidated financial statements.
F-5
WESTWOOD HOLDINGS GROUP, INC. AND SUBSIDIARIES
CONSOLIDATED STATEMENTS OF STOCKHOLDERS’ EQUITY
For the Years Ended December 31, 2015, 2014 and 2013
(in thousands, except share and per share data)
Westwood Holdings Group, Inc. Common Stock, Par | Additional Paid-In Capital | Treasury Stock | Accumulated Other Comprehensive Income (Loss) | Retained Earnings | Total | ||||||||||||||||||||||
Shares | Amount | ||||||||||||||||||||||||||
BALANCE, January 1, 2013 | 8,031,045 | $ | 85 | $ | 91,299 | $ | (18,502 | ) | $ | 30 | $ | 3,641 | $ | 76,553 | |||||||||||||
Net income | 17,837 | 17,837 | |||||||||||||||||||||||||
Other comprehensive loss | (287 | ) | (287 | ) | |||||||||||||||||||||||
Issuance of restricted stock, net of forfeitures | 252,015 | 3 | (3 | ) | — | ||||||||||||||||||||||
Stock based compensation expense | 11,679 | 11,679 | |||||||||||||||||||||||||
Reclassification of compensation liability to be paid in shares | 120 | 120 | |||||||||||||||||||||||||
Tax benefit related to stock based compensation | 758 | 758 | |||||||||||||||||||||||||
Dividends declared ($1.64 per share) | (13,330 | ) | (13,330 | ) | |||||||||||||||||||||||
Stock options exercised | (20,251 | ) | (878 | ) | (878 | ) | |||||||||||||||||||||
Restricted stock returned for payment of taxes | (86,392 | ) | (3,789 | ) | (3,789 | ) | |||||||||||||||||||||
BALANCE, December 31, 2013 | 8,176,417 | $ | 88 | $ | 103,853 | $ | (23,169 | ) | $ | (257 | ) | $ | 8,148 | $ | 88,663 | ||||||||||||
Net income | 27,249 | 27,249 | |||||||||||||||||||||||||
Other comprehensive loss | (974 | ) | (974 | ) | |||||||||||||||||||||||
Issuance of restricted stock, net of forfeitures | 231,642 | 2 | (2 | ) | — | ||||||||||||||||||||||
Stock based compensation expense | 13,685 | 13,685 | |||||||||||||||||||||||||
Reclassification of compensation liability to be paid in shares | 170 | 170 | |||||||||||||||||||||||||
Tax benefit related to stock based compensation | 2,153 | 2,153 | |||||||||||||||||||||||||
Dividends declared ($1.82 per share) | (15,080 | ) | (15,080 | ) | |||||||||||||||||||||||
Purchases of treasury stock | (11,476 | ) | (669 | ) | (669 | ) | |||||||||||||||||||||
Restricted stock returned for payment of taxes | (88,123 | ) | (5,190 | ) | (5,190 | ) | |||||||||||||||||||||
BALANCE, December 31, 2014 | 8,308,460 | $ | 90 | $ | 119,859 | $ | (29,028 | ) | $ | (1,231 | ) | $ | 20,317 | $ | 110,007 | ||||||||||||
Net income | 27,105 | 27,105 | |||||||||||||||||||||||||
Other comprehensive loss | (3,457 | ) | (3,457 | ) | |||||||||||||||||||||||
Issuance of common stock for acquisition | 109,712 | 1 | 5,291 | 5,292 | |||||||||||||||||||||||
Issuance of restricted stock, net of forfeitures | 305,342 | 3 | (3 | ) | — | ||||||||||||||||||||||
Stock based compensation expense | 17,574 | 17,574 | |||||||||||||||||||||||||
Reclassification of compensation liability to be paid in shares | 338 | 338 | |||||||||||||||||||||||||
Tax benefit related to stock based compensation | 1,831 | 1,831 | |||||||||||||||||||||||||
Dividends declared ($2.07 per share) | (17,748 | ) | (17,748 | ) | |||||||||||||||||||||||
Purchases of treasury stock | (21,818 | ) | (1,327 | ) | (1,327 | ) | |||||||||||||||||||||
Issuance of treasury stock under employee stock plans | 20,375 | (1,093 | ) | 1,093 | — | ||||||||||||||||||||||
Restricted stock returned for payment of taxes | (91,384 | ) | (5,648 | ) | (5,648 | ) | |||||||||||||||||||||
BALANCE, December 31, 2015 | 8,630,687 | $ | 94 | $ | 143,797 | $ | (34,910 | ) | $ | (4,688 | ) | $ | 29,674 | $ | 133,967 | ||||||||||||
See notes to consolidated financial statements.
F-6
WESTWOOD HOLDINGS GROUP, INC. AND SUBSIDIARIES
CONSOLIDATED STATEMENTS OF CASH FLOWS
For the Years Ended December 31, 2015, 2014 and 2013
(in thousands)
2015 | 2014 | 2013 | ||||||||||
Cash flows from operating activities: | ||||||||||||
Net income | $ | 27,105 | $ | 27,249 | $ | 17,837 | ||||||
Adjustments to reconcile net income to net cash provided by operating activities: | ||||||||||||
Depreciation | 1,050 | 579 | 410 | |||||||||
Amortization of intangible assets | 1,546 | 359 | 359 | |||||||||
Unrealized losses (gains) on trading investments | 613 | (75 | ) | 325 | ||||||||
Stock based compensation expense | 17,574 | 13,685 | 11,679 | |||||||||
Deferred income taxes | (3,285 | ) | (2,133 | ) | (937 | ) | ||||||
Excess tax benefits from stock based compensation | (1,455 | ) | (1,850 | ) | (696 | ) | ||||||
Net sales (purchases) of investments – trading securities | 6,684 | (14,991 | ) | (4,993 | ) | |||||||
Other | (58 | ) | — | — | ||||||||
Changes in operating assets and liabilities: | ||||||||||||
Accounts receivable | (5,192 | ) | (369 | ) | (5,702 | ) | ||||||
Other current assets | (375 | ) | 70 | (887 | ) | |||||||
Accounts payable and accrued liabilities | 1,174 | 353 | 450 | |||||||||
Compensation and benefits payable | 2,912 | 1,307 | 3,598 | |||||||||
Income taxes payable | 6,890 | 2,406 | 160 | |||||||||
Other liabilities | 25 | (67 | ) | 102 | ||||||||
Net cash provided by operating activities | 55,208 | 26,523 | 21,705 | |||||||||
Cash flows from investing activities: | ||||||||||||
Acquisition of Woodway, net of cash acquired | (24,133 | ) | — | — | ||||||||
Purchases of property, equipment and other | (951 | ) | (478 | ) | (1,201 | ) | ||||||
Net cash used in investing activities | (25,084 | ) | (478 | ) | (1,201 | ) | ||||||
Cash flows from financing activities: | ||||||||||||
Purchases of treasury stock | (1,327 | ) | (669 | ) | (878 | ) | ||||||
Restricted stock returned for payment of taxes | (5,648 | ) | (5,190 | ) | (3,789 | ) | ||||||
Excess tax benefits from stock based compensation | 1,455 | 1,850 | 696 | |||||||||
Cash dividends paid | (16,619 | ) | (13,962 | ) | (9,330 | ) | ||||||
Net cash used in financing activities | (22,139 | ) | (17,971 | ) | (13,301 | ) | ||||||
Effect of currency rate changes on cash | (3,376 | ) | (807 | ) | (156 | ) | ||||||
Net increase (decrease) in cash and cash equivalents | 4,609 | 7,267 | 7,047 | |||||||||
Cash and cash equivalents, beginning of year | 18,131 | 10,864 | 3,817 | |||||||||
Cash and cash equivalents, end of year | $ | 22,740 | $ | 18,131 | $ | 10,864 | ||||||
Supplemental cash flow information: | ||||||||||||
Cash paid during the year for income taxes | $ | 11,639 | $ | 14,418 | $ | 11,031 | ||||||
Common stock issued for acquisition | $ | 5,292 | $ | — | $ | — | ||||||
Non-cash accrued contingent consideration | $ | 9,023 | $ | — | $ | — | ||||||
Accrued dividends | $ | 7,448 | $ | 6,318 | $ | 5,201 | ||||||
See notes to consolidated financial statements.
F-7
WESTWOOD HOLDINGS GROUP, INC. AND SUBSIDIARIES
NOTES TO CONSOLIDATED FINANCIAL STATEMENTS
For the years ended December 31, 2015, 2014 and 2013
1. DESCRIPTION OF THE BUSINESS:
Westwood Holdings Group, Inc. (“Westwood”, “the Company”, we”, “us” or “our”) was incorporated under the laws of the State of Delaware on December 12, 2001. Westwood manages investment assets and provides services for its clients through its subsidiaries, Westwood Management Corp. and Westwood Advisors, LLC (together, “Westwood Management”), Westwood Trust (“Westwood Trust”) and Westwood International Advisors Inc. (“Westwood International”). Westwood Management and Westwood International provide investment advisory services to institutional clients, a family of mutual funds called the Westwood Funds®, other mutual funds, an Ireland-domiciled fund organized pursuant to the European Union’s Undertakings for Collective Investment in Transferable Securities (“UCITS”), individuals and clients of Westwood Trust. Westwood Trust provides trust and custodial services and participation in self-sponsored common trust funds to institutions and high net worth individuals. Revenue is largely dependent on the total value and composition of assets under management (“AUM”). Accordingly, fluctuations in financial markets and in the composition of AUM impact our revenues and results of operations.
Westwood Management is a registered investment adviser under the Investment Advisers Act of 1940. Westwood Trust is chartered and regulated by the Texas Department of Banking. Westwood International is registered as a portfolio manager and exempt market dealer with the Ontario Securities Commission and the Autorité des marchés financiers (“AMF”) in Québec.
Acquisition of Woodway Financial Advisors
On January 15, 2015, we entered into an agreement (the "Merger Agreement") to acquire Woodway Financial Advisors (“Woodway”), a Houston-based private wealth and trust company with managed assets of approximately $1.6 billion at December 31, 2014. We completed the acquisition on April 1, 2015. Pursuant to the Merger Agreement, on April 1, 2015 Woodway merged with Westwood Trust, a wholly-owned subsidiary of Westwood, with Westwood Trust being the surviving entity (the “Merger”). The total Merger consideration consisted of (i) $30.6 million in cash and stock, as described below, and (ii) contingent consideration equal to the annualized revenue from the post-closing business of Woodway for the twelve-month period ending March 31, 2016 (the “Earn-Out Period”), adjusted for certain clients or accounts that have terminated, and capped at $15 million (the “Earn-Out Amount”).
The Merger consideration of $39.7 million consisted of (i) closing date consideration of $25.3 million paid in cash and the issuance of 109,712 shares of Westwood common stock, valued at $5.3 million (discounted from $6.7 million due to certain required holding periods), and (ii) contingent consideration of $9.1 million, based on estimates and assumptions as of the closing date of the acquisition, to be paid after the Earn-Out Period. The acquired assets were deemed to constitute a business in a transaction using the purchase method of accounting for business combinations. Accordingly, the purchase price was allocated to the tangible and intangible assets acquired and the liabilities assumed based on their estimated fair values as of the acquisition date. See further discussion of the acquisition of Woodway in Note 5 “Acquisitions, Goodwill and Other Intangible Assets.”
2. SUMMARY OF SIGNIFICANT ACCOUNTING POLICIES:
Principles of consolidation
The accompanying consolidated financial statements include the accounts of Westwood and its subsidiaries. All significant intercompany accounts and transactions have been eliminated upon consolidation.
We assess each legal entity that we manage to determine whether consolidation is appropriate at the onset of the relationship. We first determine whether the entity is a variable interest entity (“VIE”), or a voting interest entity (“VOE”), under U.S. generally accepted accounting principles (“GAAP”) and then whether we have a controlling financial interest in the entity. Assessing whether or not an entity is a VOE or VIE and if it requires consolidation involves judgment and analysis. Factors considered in this assessment include, but are not limited to, the legal organization of the entity, our equity ownership and contractual involvement with the entity and any related party or de facto agent implications of our involvement with the entity. We reconsider whether entities are a VIE or VOE whenever contractual arrangements change, the entity receives additional equity or returns equity to its investors or changes in facts and circumstances occur that change the investors’ ability to direct the activities of the entity.
F-8
WESTWOOD HOLDINGS GROUP, INC. AND SUBSIDIARIES
NOTES TO CONSOLIDATED FINANCIAL STATEMENTS — (Continued)
A VIE is an entity in which (i) the total equity investment at risk is not sufficient to enable the entity to finance its activities without subordinated financial support or (ii) the at-risk equity holders do not have the normal characteristics of a controlling financial interest. That is, the at-risk equity holders do not have the obligation to absorb losses, the right to receive residual returns and/or the right to direct the activities of the entity that most significantly impact the entity’s economic performance. An enterprise must consolidate all VIEs of which it is the primary beneficiary. We determine if a sponsored investment meets the definition of a VIE by considering whether the fund’s equity investment at risk is sufficient to finance its activities without additional subordinated financial support and whether the fund’s at-risk equity holders absorb any losses, have the right to receive residual returns and have the right to direct the activities of the entity most responsible for the entity’s economic performance. For VIEs that are investment companies, the primary beneficiary of the VIE is the party that absorbs a majority of the expected losses of the VIE, receives a majority of the expected residual returns of the VIE, or both. For VIEs that are not investment companies, the primary beneficiary of a VIE is defined as the party who, considering the involvement of related parties and de facto agents, has (i) the power to direct the activities of the VIE that most significantly affect its economic performance and (ii) the obligation to absorb losses of the entity or the right to receive benefits from the entity that could potentially be significant to the VIE. This evaluation is updated continuously.
Westwood Investment Funds PLC (the “UCITS Fund”), which was authorized by the Central Bank of Ireland on June 18, 2013 pursuant to the European Communities (Undertakings for Collective Investment in Transferable Securities) Regulations 2011, is an Ireland domiciled umbrella-type open-ended self-managed investment company. The UCITS Fund is an umbrella fund with segregated assets and liabilities between sub-funds, and notwithstanding the segregation of assets and liabilities within each sub-fund, the UCITS Fund is a single legal entity and no sub-fund constitutes a legal entity separate from the UCITS Fund. The base currency of the UCITS Fund is the British pound sterling. We determined that the UCITS Fund was a VIE as its at-risk equity holders do not have the ability to direct the activities of the UCITS Fund that most significantly impact the entity’s economic performance. The Company and its representatives have a majority control of the UCITS Fund’s Board of Directors and can influence the UCITS Fund’s management and affairs. The UCITS Fund’s Board of Directors maintains this control through its duties, which are stated in the UCITS Fund’s Memorandum, and Articles of Association, which have no expiration date. We concluded that the Company was not the primary beneficiary of the UCITS Fund because, even though it has the power to direct the activities of the UCITS Fund that most significantly impact the fund’s economic performance, it does not absorb a majority of the UCITS Fund’s expected losses and does not receive a majority of the UCITS Fund’s expected residual returns. Therefore, the results of the UCITS Fund are not included in the Company’s consolidated financial results.
We have also evaluated all of our advisory relationships with the Westwood Funds®, collective investment trusts and limited liability companies and our relationship as sponsor of the common trust funds to determine whether or not we qualify as the primary beneficiary based on whether there is an obligation to absorb the majority of expected losses or a right to receive the majority of residual returns. Since all losses and returns are distributed to the shareholders of these VIEs, we are not the primary beneficiary and consequently these VIEs are not included in our consolidated financial statements. We have included the disclosures related to VIEs in Note 11 "Variable Interest Entities".
A VOE is an entity that is outside the scope of the guidance for VIEs. Consolidation of a VOE is required when a reporting entity owns a controlling financial interest in a VOE. Ownership of a majority of the voting interests is the usual condition for a controlling financial interest. At December 31, 2015, none of our sponsored investment entities were VOEs subject to this assessment by the Company.
Use of Estimates
The preparation of consolidated financial statements in conformity with GAAP requires management to make estimates and assumptions that affect the reported amounts of assets and liabilities, the disclosure of contingent assets and liabilities at the date of the consolidated financial statements, and the reported amounts of revenues and expenses during the reporting period. Actual results could differ from those estimates.
Cash and Cash Equivalents
Cash and cash equivalents consist of money market funds and other short-term, highly liquid investments with maturities of three months or less, other than pooled investment vehicles that are considered investments. We maintain some cash and cash equivalents balances with financial institutions that are in excess of Federal Deposit Insurance Corporation insurance limits. The Company has not experienced losses on uninsured cash accounts.
F-9
WESTWOOD HOLDINGS GROUP, INC. AND SUBSIDIARIES
NOTES TO CONSOLIDATED FINANCIAL STATEMENTS — (Continued)
Accounts Receivable
Accounts receivable represents balances arising from services provided to customers and are recorded on an accrual basis, net of any allowance for doubtful accounts. Accounts receivable are written off when they are determined to be uncollectible. Any allowance for doubtful accounts is estimated based on the Company’s historical amounts written off, existing conditions in the industry, and the financial stability of the customer. The majority of our accounts receivable balances consist of advisory and trust fees receivable from customers that we believe and have experienced to be fully collectible. Accordingly our consolidated financial statements do not include an allowance for bad debt nor any bad debt expense.
Investments
Investments are classified as trading securities and are carried at quoted market values on the accompanying consolidated balance sheets. Net unrealized holding gains or losses on investments classified as trading securities are reflected as a component of other revenues. We measure realized gains and losses on investments using the specific identification method.
Fair Value of Financial Instruments
We determined the estimated fair values of our financial instruments using available information. The fair value amounts discussed in Notes 3 "Investments" and 4 "Fair Value of Financial Instruments" are not necessarily indicative of either the amounts realizable upon disposition of these instruments or our intent or ability to dispose of these assets. The estimated fair value of cash and cash equivalents, accounts receivable, other current assets, accounts payable and accrued liabilities, dividends payable, compensation and benefits payable and income taxes payable approximates their carrying value due to their short-term maturities. The carrying amount of investments designated as “trading” securities, primarily U.S. Government and Government agency obligations, money market funds, Westwood Funds® mutual funds and Westwood Trust common trust fund shares, equals fair value based on prices quoted in active markets and, with respect to funds, the reported net asset value of the shares held. Market values of our money market holdings generally do not fluctuate.
Goodwill and Other Intangible Assets
Goodwill represents the excess of the cost of acquired assets over the fair value of the underlying identifiable assets at the date of acquisition. Goodwill is not amortized but is tested at least annually for impairment.
We test more frequently if indicators are present or changes in circumstances suggest that impairment may exist. These indicators include, among others, declines in sales, earnings or cash flows, or the development of a material adverse change in the business climate. We assess goodwill for impairment at the reporting unit level, which is defined as an operating segment or one level below an operating segment, referred to as a component. We have identified two reporting units, which are consistent with our reporting segments: Advisory and Trust. The Company is not required to calculate the fair value of a reporting unit unless we determine that it is more likely than not that its fair value is less than the carrying amount. We assess goodwill for impairment using either a qualitative or quantitative assessment. The qualitative assessment includes consideration of the current trends in the industry in which we operate, macroeconomic conditions, recent financial performance of our reporting units and a market multiple approach valuation. In performing the annual impairment test during the third quarter, or more frequently when impairment indicators exist, and after assessing the qualitative factors, we may be required to utilize the two-step approach prescribed by ASC 350 “Goodwill and Other Intangible Assets”. We may also elect to skip the qualitative assessment and proceed directly to the quantitative analysis. The quantitative analysis requires a comparison of each reporting unit’s carrying value to the fair value of the respective unit. If the carrying value exceeds the fair value, a second step is performed to measure the amount of impairment loss, if any. The fair value of each reporting unit is estimated, entirely or predominantly, using a market multiple approach. During the third quarter of 2015, we completed our annual goodwill impairment assessment and determined that no impairment loss was required. No impairments were recorded during any of the periods presented.
Our intangible assets represent the acquisition date fair value of the acquired client relationships, trade names and non-compete agreements, as well as the cost of internally-developed software, each of which is reflected net of amortization. In valuing these assets, we made significant estimates regarding the useful lives, growth rates and potential attrition. We periodically review our intangible assets for events or circumstances that would indicate impairment. See Note 5 "Acquisitions, Goodwill and Other Intangible Assets."
F-10
WESTWOOD HOLDINGS GROUP, INC. AND SUBSIDIARIES
NOTES TO CONSOLIDATED FINANCIAL STATEMENTS — (Continued)
Property and Equipment
Property and equipment are stated at cost less accumulated depreciation. Depreciation of furniture and equipment is provided over the estimated useful lives of the assets (from 3 to 7 years), and depreciation on leasehold improvements is provided over the lesser of the estimated useful life or lease term using the straight-line method. We capitalize leasehold improvements, furniture and fixtures, computer hardware and most office equipment purchases.
Revenue Recognition
Investment advisory and trust fees are recognized as services are provided. These fees are determined in accordance with contracts between our subsidiaries and their clients and are generally based on a percentage of assets under management. A limited number of our clients have contractual performance-based fee arrangements, which pay us an additional fee if we outperform a specified index over a specific period of time. We record revenue for performance-based fees at the end of the measurement period. Most advisory and trust fees are payable in advance or in arrears on a calendar quarterly basis. Advance payments are deferred and recognized over the periods services are performed. Since billing periods for most of our advance paying clients coincide with the calendar quarter to which payment relates, revenue is fully recognized within the quarter. Consequently no significant amount of deferred revenue is contained in our consolidated financial statements. Deferred revenue is shown on the consolidated balance sheets under the heading of “Accounts payable and accrued liabilities”. Other revenues generally consist of interest and investment income, which are recognized as earned.
Stock-Based Compensation
We account for stock-based compensation in accordance with ASC 718, Compensation-Stock Compensation. Under ASC 718, stock-based compensation expense reflects the fair value of stock-based awards measured at grant date, is recognized over the relevant service period, and adjusted each period for anticipated forfeitures. We expense the fair value of stock-based compensation awards granted to our employees and directors in our consolidated financial statements on a straight-line basis over the period that services are required to be provided in exchange for the award (“requisite service period”), which is typically the period over which the award vests. Stock-based compensation is recognized only for awards that vest, and our periodic accrual of compensation cost is based on the estimated number of awards expected to vest. We measure the fair value of compensation cost related to restricted stock awards based on the closing market price of our common stock on the grant date. For performance-based share awards, we assess actual performance versus the predetermined performance goals and record compensation expense once we conclude it is probable that we will meet the performance goals required to vest the applicable performance-based awards.
We have issued restricted stock in accordance with our Third Amended and Restated Westwood Holdings Group, Inc. Stock Incentive Plan (the “Plan”). We apply judgment in developing an expectation of awards of restricted stock that may be forfeited. If actual experience differs significantly from these estimates, stock-based compensation expense and our results of operations could be materially affected.
The Share Award Plan of Westwood Holdings Group, Inc. for Service Provided in Canada to its Subsidiaries (the “Canadian Plan”) provides compensation in the form of common stock for services performed by employees of Westwood International. We record compensation costs for these awards on a straight-line basis over the vesting period, once we determine it is probable that the award will be earned. Awards expected to be settled in shares are funded into a trust pursuant to an established Canadian employee benefit plan. Generally, the Canadian trust subsequently acquires Westwood common shares in market transactions and holds such shares until the shares are vested and distributed, or forfeited. Shares held in the trust are shown on our consolidated balance sheet as treasury shares. Until shares are acquired by the trust, we record compensation costs and measure the liability as a cash-based award, which is included in “Compensation and benefits payable” on our consolidated balance sheets. For the years ended December 31, 2015, 2014 and 2013, the compensation expense recorded for these awards was $145,000, $359,000 and $344,000, respectively. When the number of shares related to an award is determinable, the award becomes an equity award accounted for in a manner similar to restricted stock, which is described in Note 9 "Employee Benefits".
Tax benefits realized upon the vesting of restricted shares that exceed the expense previously recognized for reporting purposes are recorded in stockholder’s equity and reflected as a financing activity in our Consolidated Statements of Cash Flows. If the tax benefit upon vesting is less than the expense previously recorded, the shortfall is recorded in stockholder’s equity. If the shortfall exceeds available windfall benefits in equity, they are recorded in our Consolidated Statements of Comprehensive Income and as an operating activity on our Consolidated Statements of Cash Flows.
F-11
WESTWOOD HOLDINGS GROUP, INC. AND SUBSIDIARIES
NOTES TO CONSOLIDATED FINANCIAL STATEMENTS — (Continued)
Currency Translation
Assets and liabilities of Westwood International, our non-U.S. dollar functional currency subsidiary, are translated at exchange rates as of applicable reporting dates. Revenues and expenses are translated at average exchange rates during the periods indicated. The gains and losses resulting from translating non-U.S. dollar functional currency into U.S. dollars are recorded through other comprehensive income.
Income Taxes
We file a United States federal income tax return as a consolidated group for Westwood and its subsidiaries based in the US. We file a Canadian income tax return for Westwood International. Deferred income tax assets and liabilities are determined based on temporary differences between the financial statements and income tax bases of assets and liabilities as measured at enacted income tax rates. Deferred income tax expense is generally the result of changes in deferred tax assets and liabilities. Deferred taxes relate primarily to incentive compensation and stock-based compensation expense.
We record net deferred tax assets to the extent we believe such assets will more likely than not be realized. In making such a determination, we consider all available positive and negative evidence, including future reversals of existing taxable temporary differences, projected future taxable income, tax-planning strategies, and results of recent operations. In the event we were to determine that we would not be able to realize our deferred income tax assets in the future, we would record a valuation allowance. No valuation allowance has been recorded in our consolidated financial statements.
We account for uncertain tax positions by recognizing the impact of a tax position in our consolidated financial statements when we believe it is more likely than not that the tax position would not be sustained upon examination by the appropriate tax authority, based on the merits of the position. We include penalties and interest on income-based taxes, if any, in the “General and administrative” line on our consolidated statements of comprehensive income. At December 31, 2015, we had $1.6 million of unrecognized tax benefits accrued, net of $607,000 federal deferred tax assets, related to uncertain tax positions. At December 31, 2014, the Company had not established any reserves for, nor recorded any unrecognized tax benefits related to, uncertain tax positions. See Note 7 "Income Taxes."
Business Combinations
In allocating the purchase price of a business combination, the Company records all assets acquired and liabilities assumed at fair value, with the excess of the purchase price over the aggregate fair values recorded as goodwill. ASC 820 defines fair value as the price that would be received to sell an asset or paid to transfer a liability in an orderly transaction between market participants at the measurement date. The purchase price of an acquisition is allocated to the underlying assets acquired and liabilities assumed based upon their estimated fair values as of the date of acquisition. To the extent the purchase price exceeds the fair value of the net identifiable tangible and intangible assets acquired and liabilities assumed, such excess is allocated to goodwill. The Company determines the estimated fair values after review and consideration of relevant information, including discounted cash flows, quoted market prices and estimates made by management. The fair value assigned to identifiable intangible assets acquired is based on estimates and assumptions made by management at the time of the acquisition. The Company adjusts the preliminary purchase price allocation, as necessary, during the measurement period of up to one year after the acquisition closing date as it obtains more information as to facts and circumstances existing as of the acquisition date. Acquisition-related costs are recognized separately from the acquisition and are expensed as incurred.
The acquired customer accounts, trade names and non-compete agreements are subject to fair value measurements based primarily on significant inputs not observable in the market and thus represent level 3 measurements. The valuation of an acquired customer list utilizes an income approach, which provides an estimate of the fair value of an asset based on discounted cash flows and management estimates, including the estimated growth associated with existing clients, market growth and client attrition. The valuation of acquired trade names uses a relief from royalty method in which the fair value of the intangible asset is estimated to be the present value of royalties saved because the Company owns the intangible asset. Revenue projections and estimated useful lives are used in estimating the fair value of the trade names. The non-compete agreements are calculated using the with-or-without method, which utilizes the probability of these employees competing with the Company and revenue projections to calculate the valuation of non-competition agreements.
When an acquisition includes future contingent consideration on achieving certain annualized revenue from the post-closing acquired business over a specified time period, the Company estimates the fair value of the earn-out using overall revenue growth projections combined with existing customer base lost revenue projections, both discounted and probability-weighted. A liability is recorded for the estimated fair value of the contingent consideration on the acquisition date, and the fair value of the contingent consideration is remeasured at each subsequent reporting period with any change in fair value recognized as income or expense within the consolidated statement of comprehensive income.
F-12
WESTWOOD HOLDINGS GROUP, INC. AND SUBSIDIARIES
NOTES TO CONSOLIDATED FINANCIAL STATEMENTS — (Continued)
Recent Accounting Pronouncements
In May 2014, the FASB issued ASU 2014-09, Revenue from Contracts with Customers (Topic 606), which resulted from a joint project by the FASB and the International Accounting Standards Board to clarify the principles for recognizing revenue and to develop a common revenue standard for GAAP and International Financial Reporting Standards ("IFRS"). The issuance of a comprehensive and converged standard on revenue recognition is expected to improve the ability of financial statement users to understand and consistently analyze an entity’s revenue across industries, transactions, and geographies. The standard will require additional disclosures to help financial statement users better understand the nature, amount, timing, and potential uncertainty of the revenue being recognized. In August 2015, in order to amend the effective date of ASU 2014-09, the FASB issued ASU 2015-14, Revenue from Contracts with Customers – Deferral of the Effective Date. Under the amendment, the effective date of ASU 2014-09 has been extended by one year for all entities. For public entities, the ASU will be effective for annual reporting periods beginning after December 15, 2017, including interim reporting periods within that reporting period. Retrospective application is required, with the entity either applying the change to each prior reporting period presented or applying the cumulative effect of each prior reporting period presented at the date of initial application. Early adoption is permitted based on the initial effective date of December 15, 2016. We are currently evaluating the impact that the application will have on our consolidated financial statements and disclosures and expect to adopt the new standard within the required time frame.
In February 2015, the FASB issued ASU 2015-02, Consolidation – Amendments to the Consolidation Analysis. This amendment modifies the analysis required to evaluate whether certain legal entities should be consolidated, including variable interest entities. This amendment changes the evaluation of fee arrangements and related party transactions when determining whether to consolidate a variable interest entity. The amendment is effective for annual reporting periods beginning after December 15, 2016 and for interim periods within reporting periods beginning after December 15, 2017, although early adoption is permitted. We are currently evaluating the impact that the application of ASU 2015-02 will have on our consolidated financial statements and disclosures.
In April 2015, the FASB issued ASU 2015-05, Intangibles – Goodwill and Other – Internal-Use Software. This amendment provides guidance about whether a cloud computing arrangement includes a software license. The new guidance clarifies that software licenses included in a cloud computing software should be accounted for in the same manner as other software licenses. If the cloud computing arrangement does not include a software license, the arrangement should be accounted for as a service contract. This amendment is effective for annual reporting periods, including interim periods within those periods, beginning after December 15, 2015, with early adoption permitted. We have elected to early adopt this amendment in the current fiscal year, which did not have a material impact on our consolidated financial statements.
In May 2015, the FASB issued ASU 2015-07, Fair Value Measurements – Disclosures for Certain Entities that Calculate Net Asset Value per Share. This amendment updates guidance intended to eliminate the diversity in practice surrounding how investments measured at net asset value under the practical expedient with future redemption dates have been categorized in the fair value hierarchy. Under the updated guidance, investments for which fair value is measured at net asset value per share using the practical expedient should no longer be categorized in the fair value hierarchy. The updated guidance requires retrospective adoption for all periods presented and is effective for interim and annual reporting periods beginning after December 15, 2015, with early adoption permitted. Except for the disclosure requirements, we do not expect the adoption of this guidance to impact our consolidated financial statements.
In September 2015, the FASB issued ASU 2015-16, Business Combinations (Topic 805) - Simplifying the Accounting for Measurement-Period Adjustments. The amendment applies to entities that have reported provisional amounts related to a business combination for which the accounting is incomplete by the end of the reporting period and have an adjustment to provisional amounts previously recognized during a later measurement period. Changes in provisional amounts recorded for acquired assets and liabilities are to be adjusted in the period the adjustment is known, with a corresponding adjustment booked to goodwill. The acquirer is no longer required to revise comparative information from prior years for the effect of changes in provisional amounts. For public business entities, the amendment is effective for fiscal years beginning after December 15, 2015, including interim periods within those fiscal years, with early adoption permitted. We have elected to early adopt this amendment in the current fiscal year. This amendment may impact our disclosure of the Woodway acquisition, should we adjust the fair value of the acquired assets and liabilities during the year ended December 31, 2016.
F-13
WESTWOOD HOLDINGS GROUP, INC. AND SUBSIDIARIES
NOTES TO CONSOLIDATED FINANCIAL STATEMENTS — (Continued)
In November 2015, the FASB issued ASU 2015-17, Income Taxes (Topic 740) - Balance Sheet Classification of Deferred Taxes. The purpose of this amendment is to simplify the presentation of deferred taxes on the statement of financial position and further align the presentation of deferred taxes with IFRS. The amendment requires that deferred tax assets and liabilities be classified as noncurrent in the classified balance sheet, where before they were required to be classified as current and noncurrent based on their nature. This amendment applies to all entities with deferred taxes. The amendment may be applied prospectively or retrospectively. For public business entities, the amendment is affective for interim periods and fiscal years beginning after December 31, 2016, with early adoption permitted. We have elected to prospectively early adopt this amendment in the current fiscal year, and all deferred taxes are classified as noncurrent in our consolidated balance sheet at December 31, 2015. See further discussion in Note 7 "Income Taxes."
3. INVESTMENTS:
Investments are presented below (in thousands). All investments are carried at fair value, and all investments are accounted for as trading securities.
Cost | Gross Unrealized Gains | Gross Unrealized Losses | Estimated Fair Value | |||||||||||||
December 31, 2015: | ||||||||||||||||
U.S. Government and Government agency obligations | $ | 50,972 | $ | 15 | $ | (15 | ) | $ | 50,972 | |||||||
Money market funds | 9,179 | — | — | 9,179 | ||||||||||||
Equity funds | 12,653 | — | (484 | ) | 12,169 | |||||||||||
Marketable securities | $ | 72,804 | $ | 15 | $ | (499 | ) | $ | 72,320 | |||||||
Cost | Gross Unrealized Gains | Gross Unrealized Losses | Estimated Fair Value | |||||||||||||
December 31, 2014: | ||||||||||||||||
U.S. Government and Government agency obligations | $ | 66,761 | $ | 20 | $ | (8 | ) | $ | 66,773 | |||||||
Money market funds | 8,250 | — | — | 8,250 | ||||||||||||
Equity funds | 4,477 | 223 | (103 | ) | 4,597 | |||||||||||
Marketable securities | $ | 79,488 | $ | 243 | $ | (111 | ) | $ | 79,620 | |||||||
F-14
WESTWOOD HOLDINGS GROUP, INC. AND SUBSIDIARIES
NOTES TO CONSOLIDATED FINANCIAL STATEMENTS — (Continued)
The following amounts, except for income tax amounts, are included in our consolidated statements of comprehensive income under the heading “Other revenues” for the years indicated (in thousands):
2015 | 2014 | 2013 | ||||||||||
Realized gains | $ | 283 | $ | 156 | $ | 629 | ||||||
Realized losses | (43 | ) | (50 | ) | (4 | ) | ||||||
Net realized gains | $ | 240 | $ | 106 | $ | 625 | ||||||
Income tax expense from gains | $ | 84 | $ | 37 | $ | 225 | ||||||
Interest income – trading | $ | 143 | $ | 51 | $ | 28 | ||||||
Dividend income | $ | 284 | $ | 212 | $ | 541 | ||||||
Unrealized gains/(losses) | $ | (613 | ) | $ | 75 | $ | (325 | ) | ||||
As of December 31, 2015, corporate funds totaling $8.7 million were invested in the Westwood Funds® and Westwood Common Trust Funds and corporate funds aggregating $2.0 million were invested in a UCITS fund. See Note 11 "Variable Interest Entities".
4. FAIR VALUE OF FINANCIAL INSTRUMENTS:
ASC 820, Fair Value Measurements and Disclosures, defines fair value, establishes a framework for measuring fair value and requires additional disclosures regarding certain fair value measurements. ASC 820 establishes a three-tier hierarchy for measuring fair value as follows:
• | Level 1 – quoted market prices in active markets for identical assets and liabilities, |
• | Level 2 – inputs other than quoted prices that are directly or indirectly observable |
• | Level 3 – unobservable inputs where there is little or no market activity. |
The following table summarizes the values of our assets as of the dates indicated within the fair value hierarchy (in thousands).
Level 1 | Level 2 | Level 3 | Total | |||||||||||||
As of December 31, 2015 | ||||||||||||||||
Investments in trading securities | $ | 69,260 | $ | 3,060 | $ | — | $ | 72,320 | ||||||||
Contingent consideration | — | — | (9,023 | ) | (9,023 | ) | ||||||||||
$ | 69,260 | $ | 3,060 | $ | (9,023 | ) | $ | 63,297 | ||||||||
As of December 31, 2014 | ||||||||||||||||
Investments in trading securities | $ | 77,327 | $ | 2,293 | $ | — | $ | 79,620 | ||||||||
$ | 77,327 | $ | 2,293 | $ | — | $ | 79,620 | |||||||||
Investments categorized as level 2 assets consist of investments in common trust funds sponsored by Westwood Trust. Common trust funds are private investment vehicles comprised of commingled investments held in trusts that are valued using the Net Asset Value (“NAV”) calculated by us as administrator of the funds. The NAV is calculated using indirectly observed inputs, as the unit price is based on the market value of the underlying investments traded on an active market. We can make withdrawals from the common trust funds on a daily basis, as needed for liquidity, and there are no restrictions on redemption as of December 31, 2015.
Contingent consideration categorized as a level 3 liability is related to the acquisition of Woodway (see Note 5 “Acquisitions, Goodwill and Other Intangible Assets”). As of the acquisition date, the Company estimated that the Earn-Out Amount would be $9.1 million, based on then existing facts and circumstances. The fair value of contingent consideration is measured using the projected payment date, discount rates, probabilities of payment, and projected revenues. The projected contingent payment is discounted back to the current period using a discounted cash flow model. Projected revenues are based on the Company’s most recent internal operational budgets and long-range strategic plans. Increases or decreases in projected revenues, probabilities of payment, discount rates or projected payment dates may result in higher or lower fair value measurements. Fluctuations in any of the inputs may result in a significantly lower or higher fair value measurement.
F-15
WESTWOOD HOLDINGS GROUP, INC. AND SUBSIDIARIES
NOTES TO CONSOLIDATED FINANCIAL STATEMENTS — (Continued)
For periods subsequent to the initial measurement of the contingent consideration, changes in the fair value of the contingent consideration are recorded in Other revenues, net on the consolidated statements of comprehensive income. During the fourth quarter of 2015, the Company revised its estimate of the acquisition date Earn-Out Amount to $9.0 million and recorded $78,600 in other revenues.
The following table represents the range of the unobservable inputs utilized in the fair value measurement of the contingent consideration classified as level 3:
Valuation Technique | Unobservable Input | Range | Weighted Average Rate |
Discounted Cash Flow | Discount rate | 6.0 % | 6.0% |
AUM growth rate | (7.5)% to 8.1% | 0.9 % | |
The following table provides a reconciliation of the beginning and ending balances of items measured at fair value on a recurring basis that used significant unobservable inputs (in thousands):
Contingent Consideration | |||
Beginning balance, December 31, 2014 | $ | — | |
Acquisition of Woodway | 9,102 | ||
Change in carrying value | (79 | ) | |
Cash payments | — | ||
Equity payments | — | ||
Ending balance, December 31, 2015 | $ | 9,023 | |
5. ACQUISITIONS, GOODWILL AND OTHER INTANGIBLE ASSETS:
Acquisition of Woodway Financial Advisors
Westwood completed the acquisition of Woodway on April 1, 2015. The total Merger consideration consisted of (i) $30.6 million in cash and stock, as described below, and (ii) contingent consideration equal to the annualized revenue from the post-closing business of Woodway for the twelve-month period ending March 31, 2016 (the “Earn-Out Period”), adjusted for certain clients or accounts that have terminated, and capped at $15 million (the “Earn-Out Amount”). The Earn-Out Amount will be paid 54.84% in cash and 45.16% in shares of Westwood’s common stock, valued using the average closing price during the last 30 calendar days of the Earn-Out Period. In relation to the Merger, Westwood entered into employment agreements with certain Woodway employees, which, among other things, provided for specified compensation and benefits for the related employees.
The Merger consideration of $39.7 million consisted of (i) closing date consideration of $25.3 million paid in cash and issuance of 109,712 shares of Westwood common stock, valued at $5.3 million (discounted from $6.7 million due to certain required holding periods), and (ii) contingent consideration of $9.1 million, based on estimates and assumptions on the closing date of the acquisition, to be paid no later than 75 calendar days after the last day of the Earn-Out Period. The estimated fair value of the Earn-Out Amount was determined by using overall revenue growth projections combined with existing customer base lost revenue projections, both discounted and probability-weighted. The fair value measurement of the Earn-Out Amount was based primarily on significant inputs not observable in the market and thus represents a level 3 measurement as defined in ASC 820. See further discussion in Note 4 "Fair Value of Financial Instruments."
The acquisition of Woodway was accounted for using the acquisition method of accounting. Accordingly, the purchase price was allocated to the tangible and intangible assets acquired and the liabilities assumed based on their estimated fair values as of the acquisition date. As of December 31, 2015, consideration of $39.7 million has been allocated using Woodway’s historical balance sheet at March 31, 2015 based on valuations of acquired assets and assumed liabilities in connection with the acquisition.
F-16
WESTWOOD HOLDINGS GROUP, INC. AND SUBSIDIARIES
NOTES TO CONSOLIDATED FINANCIAL STATEMENTS — (Continued)
The allocation of the purchase price is as follows (in thousands):
Cash and cash equivalents | $ | 1,205 | ||
Accounts receivable | 936 | |||
Other current assets | 253 | |||
Goodwill(i) | 15,889 | |||
Identifiable intangibles(ii) | 21,334 | |||
Property and equipment | 197 | |||
Accounts payable and accrued liabilities | (61 | ) | ||
Income tax payable | (20 | ) | ||
Purchase price | $ | 39,733 | ||
(i) | The excess of the purchase price over the fair value amounts assigned to assets acquired and liabilities assumed represents the goodwill amount resulting from the acquisition. |
(ii) | The fair value of the acquired identifiable intangibles consists of the following (in thousands, except useful lives): |
Intangible Asset | Fair Value | Estimated Useful Lives | ||||
Client relationships | $ | 20,391 | 15 years | |||
Non-compete agreements | 257 | 3 years | ||||
Trade name | 686 | 5 years | ||||
At the time of the acquisition, the Company believed that its enhanced market position and future growth potential were the primary factors that contributed to a total purchase price that resulted in the recognition of goodwill. As of December 31, 2015, $6.8 million of the goodwill arising from the acquisition is expected to be deductible for tax purposes.
We incurred transaction costs of $1.1 million related to the Woodway acquisition, of which $732,000 and $392,000 are included in “Professional services” on our consolidated statements of comprehensive income for the years ended December 31, 2015 and 2014, respectively.
Our consolidated results for the year ended December 31, 2015 included Total revenues and Net income attributable to Woodway of $7.7 million and $2.2 million, respectively.
Pro Forma Financial Information
The following unaudited pro forma results of operations for the twelve months ended December 31, 2015 and 2014 assume that the Woodway acquisition had occurred on January 1, 2014, after giving effect to acquisition accounting adjustments relating to amortization of the valued intangible assets and to record additional compensation costs related to employment contracts entered into as a result of the acquisition. These unaudited pro forma results exclude one-time, non-recurring costs related to the acquisition, including $1.1 million of transaction costs. This unaudited pro forma information should not be relied upon as being necessarily indicative of the historical results that would have been obtained if the Merger had actually occurred on that date, nor of the results that may be obtained in the future.
Year Ended December 31, | ||||||||
(in thousands) | 2015 | 2014 | ||||||
Total revenues | $ | 133,628 | $ | 123,729 | ||||
Net income | $ | 28,080 | $ | 29,429 | ||||
F-17
WESTWOOD HOLDINGS GROUP, INC. AND SUBSIDIARIES
NOTES TO CONSOLIDATED FINANCIAL STATEMENTS — (Continued)
Goodwill
Goodwill represents the excess of the cost of acquired assets over the fair value of the underlying identifiable assets at the date of acquisition. Changes in goodwill are as follows (in thousands):
As of December 31, | ||||||||
2015 | 2014 | |||||||
Beginning balance | $ | 11,255 | $ | 11,255 | ||||
Acquisition of Woodway (1) | 15,889 | — | ||||||
Ending balance | $ | 27,144 | $ | 11,255 | ||||
(1) The $15.9 million of goodwill acquired through the acquisition of Woodway is entirely attributable to the Trust segment.
Goodwill is not amortized but is tested for impairment at least annually. We completed our annual goodwill impairment assessment during the third quarter of 2015 and determined that no impairment loss was required. No impairments were recorded during the year ended December 31, 2015, 2014 or 2013.
Other Intangible Assets
Our intangible assets represent the acquisition date fair value of acquired client relationships, trade names, non-compete agreements and internally-developed software and are reflected net of amortization. In valuing these assets, we made significant estimates regarding their useful lives, growth rates and potential attrition. The following is a summary of intangible assets at December 31, 2015 and 2014 (in thousands, except years):
Weighted Average Amortization Period (years) | Gross Carrying Amount | Accumulated Amortization | Net Carrying Amount | |||||||||||
2015 | ||||||||||||||
Client relationships | 14.8 | $ | 25,396 | $ | (2,954 | ) | $ | 22,442 | ||||||
Trade names | 4.2 | 942 | (358 | ) | 584 | |||||||||
Non-compete agreements | 2.9 | 283 | (91 | ) | 192 | |||||||||
Internally developed software | 7.0 | 136 | — | 136 | ||||||||||
$ | 26,757 | $ | (3,403 | ) | $ | 23,354 | ||||||||
2014 | ||||||||||||||
Client relationships | 14.2 | $ | 5,005 | $ | (1,575 | ) | $ | 3,430 | ||||||
Trade names | 2.0 | 256 | (256 | ) | — | |||||||||
Non-compete agreements | 2.3 | 26 | (26 | ) | — | |||||||||
$ | 5,287 | $ | (1,857 | ) | $ | 3,430 | ||||||||
Amortization expense, which is included in “General and administrative” expense on our consolidated statements of comprehensive income, was $1.5 million, $359,000 and $359,000 for the years ended December 31, 2015, 2014 and 2013, respectively.
Estimated amortization expense for intangible assets over the next five years is as follows (in thousands):
Estimated Amortization Expense | |||
For the year ending December 31, | |||
2016 | $ | 1,960 | |
2017 | 1,960 | ||
2018 | 1,896 | ||
2019 | 1,875 | ||
2020 | 1,760 | ||
F-18
WESTWOOD HOLDINGS GROUP, INC. AND SUBSIDIARIES
NOTES TO CONSOLIDATED FINANCIAL STATEMENTS — (Continued)
6. BALANCE SHEET COMPONENTS:
Property and Equipment
The following table reflects information about our property and equipment as of December 31, 2015 and 2014 (in thousands):
As of December 31, | ||||||||
2015 | 2014 | |||||||
Leasehold improvements | $ | 1,728 | $ | 2,274 | ||||
Furniture and fixtures | 1,804 | 1,516 | ||||||
Computer hardware and office equipment | 2,116 | 1,563 | ||||||
Construction in progress | 231 | — | ||||||
Accumulated depreciation | (3,687 | ) | (2,720 | ) | ||||
Net property and equipment | $ | 2,192 | $ | 2,633 | ||||
Accumulated Other Comprehensive Loss
The components of accumulated other comprehensive loss were as follows (in thousands):
As of December 31, | ||||||||
2015 | 2014 | |||||||
Foreign currency translation adjustment, net of tax of $102 and $127 | $ | (4,688 | ) | $ | (1,231 | ) | ||
Accumulated other comprehensive loss | $ | (4,688 | ) | $ | (1,231 | ) | ||
7. INCOME TAXES:
Income Tax Provision
Income (loss) before income taxes by jurisdiction is as follows (in thousands):
Years ended December 31, | ||||||||||||
2015 | 2014 | 2013 | ||||||||||
United States | $ | 27,324 | $ | 36,104 | $ | 30,799 | ||||||
Canada | 14,896 | 5,932 | (2,614 | ) | ||||||||
Total | $ | 42,220 | $ | 42,036 | $ | 28,185 | ||||||
Income tax expense differs from the amount that would otherwise have been calculated by applying the U.S. Federal corporate tax rate of 35% to income before income taxes.
The difference between the Federal corporate tax rate and the effective tax rate is comprised of the following (in thousands):
Years ended December 31, | |||||||||||||||||||||
2015 | 2014 | 2013 | |||||||||||||||||||
Income tax provision computed at US federal statutory rate | $ | 14,777 | 35.0 | % | $ | 14,712 | 35.0 | % | $ | 9,864 | 35.0 | % | |||||||||
Canadian rate differential | (1,287 | ) | (3.0 | ) | (520 | ) | (1.2 | ) | 222 | 0.7 | |||||||||||
Change in uncertain tax positions, net of federal benefit | 1,059 | 2.5 | — | — | — | — | |||||||||||||||
State and local income taxes, net of federal benefit | 465 | 1.1 | 442 | 1.1 | 386 | 1.4 | |||||||||||||||
Other, net | 101 | 0.2 | 153 | 0.3 | (124 | ) | (0.4 | ) | |||||||||||||
Total income tax expense | $ | 15,115 | 35.8 | % | $ | 14,787 | 35.2 | % | $ | 10,348 | 36.7 | % | |||||||||
Effective income tax rate | 35.8 | % | 35.2 | % | 36.7 | % | |||||||||||||||
We include penalties and interest on income-based taxes in the “General and administrative” line on our consolidated statements of comprehensive income. We recorded $119,000 and $16,000 of penalties and interest in 2015 and 2014, respectively. There were no penalties and interest in 2013.
F-19
WESTWOOD HOLDINGS GROUP, INC. AND SUBSIDIARIES
NOTES TO CONSOLIDATED FINANCIAL STATEMENTS — (Continued)
Income tax provision (benefit) as set forth in the consolidated statements of comprehensive income consisted of the following components (in thousands):
Years ended December 31, | ||||||||||||
2015 | 2014 | 2013 | ||||||||||
Current taxes: | ||||||||||||
US Federal | $ | 12,015 | $ | 16,230 | $ | 10,683 | ||||||
State and local | 2,564 | 690 | 602 | |||||||||
Foreign | 3,821 | — | — | |||||||||
Total | 18,400 | 16,920 | 11,285 | |||||||||
Deferred taxes: | ||||||||||||
US Federal | (3,331 | ) | (3,590 | ) | (240 | ) | ||||||
State and local | (156 | ) | (40 | ) | (5 | ) | ||||||
Foreign | 202 | 1,497 | (692 | ) | ||||||||
Total | (3,285 | ) | (2,133 | ) | (937 | ) | ||||||
Total income tax expense | $ | 15,115 | $ | 14,787 | $ | 10,348 | ||||||
Deferred Income Taxes
The tax effects of temporary differences that give rise to the deferred tax assets and deferred tax liabilities are presented below (in thousands):
As of December 31, | ||||||||
2015 | 2014 | |||||||
Deferred tax assets: | ||||||||
Share-based compensation expense | $ | 6,258 | $ | 5,210 | ||||
Net operating loss | — | 166 | ||||||
Deferred rent | 51 | 186 | ||||||
Compensation and benefits payable | 5,222 | 3,280 | ||||||
Federal unrecognized tax benefit | 607 | — | ||||||
Other | 166 | 112 | ||||||
Total deferred tax assets | 12,304 | 8,954 | ||||||
Deferred tax liabilities: | ||||||||
Property and equipment | (233 | ) | (334 | ) | ||||
Intangibles | (959 | ) | (645 | ) | ||||
Unrealized gains on investments | (70 | ) | (123 | ) | ||||
Total deferred tax liabilities | (1,262 | ) | (1,102 | ) | ||||
Net deferred tax assets | $ | 11,042 | $ | 7,852 | ||||
Net deferred tax assets and liabilities are as follows (in thousands):
As of December 31, | ||||||||
2015 | 2014 | |||||||
Net current deferred tax assets(1) | $ | — | $ | 6,268 | ||||
Net current deferred tax liabilities(1) | — | (2,208 | ) | |||||
Total net current deferred tax assets(1) | — | 4,060 | ||||||
Net non-current deferred tax assets | 12,304 | 4,782 | ||||||
Net non-current deferred tax liabilities | (1,262 | ) | (990 | ) | ||||
Net non-current deferred tax assets reflected on the balance sheets | 11,042 | 3,792 | ||||||
Total net deferred tax assets | $ | 11,042 | $ | 7,852 | ||||
________________
(1) We have elected to prospectively early adopt ASU 2015-17 in the current fiscal year. See further discussion in Note 2 "Summary of Significant Accounting Policies."
F-20
WESTWOOD HOLDINGS GROUP, INC. AND SUBSIDIARIES
NOTES TO CONSOLIDATED FINANCIAL STATEMENTS — (Continued)
The Company is subject to taxation in the United States and various state and foreign jurisdictions. As of December 31, 2015, the Company’s 2012, 2013 and 2014 tax years are open for examination by the Internal Revenue Service, and various state and foreign jurisdiction tax years remain open to examination. We are not currently under audit by any taxing jurisdiction.
We have not provided U.S. income taxes and foreign withholdings taxes on the undistributed earnings of our foreign subsidiary, Westwood International, because we intend to permanently reinvest such earnings outside the U.S.. If these foreign earnings were to be repatriated in the future, the related U.S. tax liability may be reduced by any foreign income taxes previously paid on these earnings. As of December 31, 2015, the cumulative amount of earnings upon which U.S. income taxes have not been provided is approximately $8 million, and the unrecognized deferred tax liability related to these earnings is approximately $600,000.
As of December 31, 2015, the Company's gross liability related to uncertain tax positions was $1.6 million. A number of years may elapse before an uncertain tax position is finally resolved. To the extent that the Company has favorable tax settlements, or determines that accrued amounts are no longer needed due to a lapse in the applicable statute of limitations or other changes in circumstances, such liabilities, as well as the related interest and penalties, would be reversed as a reduction of income tax expense, net of federal tax effects, in the period such determination is made. We had no liability for uncertain tax positions recorded during the years ended December 31, 2013 and 2014. A reconciliation of the change in recorded uncertain tax positions during the year ended December 31, 2015 is as follows (in thousands):
Balance at January 1, 2015 | $ | — | ||
Additions for tax positions related to the current year | 492 | |||
Additions for tax positions related to prior years | 1,137 | |||
Balance at December 31, 2015 | $ | 1,629 | ||
Within the next twelve months, it is reasonably possible that the liability for uncertain tax positions could decrease by as much as $1.6 million as a result of settlements with certain taxing authorities, which if recognized would decrease our provision for income taxes by $1.0 million.
8. REGULATORY CAPITAL REQUIREMENTS:
Westwood Trust is subject to the capital requirements of the Texas Department of Banking and has a minimum capital requirement of $4.0 million. At December 31, 2015, Westwood Trust had approximately $8.9 million in excess of its minimum capital requirement.
Westwood Trust is limited under applicable Texas law in the payment of dividends of undivided profits, which is that part of equity capital equal to the balance of net profits, income, gains and losses since formation minus subsequent distributions to stockholders and transfers to surplus or capital under share dividends or appropriate Board resolutions. At the discretion of its Board of Directors, Westwood Trust has made quarterly and special dividend payments to us out of its undivided profits.
Westwood International is subject to the working capital requirements of the Ontario Securities Commission, which requires that combined cash and receivables exceed current liabilities by at least $100,000 CDN. At December 31, 2015 Westwood International had combined cash and receivables that were $21.5 million CDN (or $15.5 million in U.S. Dollars using the exchange rate on December 31, 2015) in excess of its current liabilities, which satisfies this requirement.
9. EMPLOYEE BENEFITS:
Stock Based Compensation
Restricted Stock Awards
We have issued restricted shares to our employees and non-employee directors. The Plan reserves shares of Westwood common stock for issuance to eligible employees, directors and consultants of Westwood or its subsidiaries in the form of restricted stock and stock options. The total number of shares that may be issued under the Plan (including predecessor plans to the Plan) may not exceed 4,398,100 shares. In the event of a change in control of Westwood, the Plan contains provisions providing for the acceleration of the vesting of restricted stock. At December 31, 2015, approximately 678,900 shares remain available for issuance under the Plan.
F-21
WESTWOOD HOLDINGS GROUP, INC. AND SUBSIDIARIES
NOTES TO CONSOLIDATED FINANCIAL STATEMENTS — (Continued)
Canadian Plan
As discussed in Note 2, the Canadian Plan provides compensation in the form of common stock for services performed by employees of Westwood International. Under the Canadian Plan, no more than $10 million CDN (or $7.2 million in U.S. Dollars using the exchange rate on December 31, 2015) may be funded to the Plan Trustee to fund purchases of common stock with respect to awards granted under the Canadian Plan. At December 31, 2015, approximately $4.9 million remains available for issuance under the Canadian Plan, or approximately 93,900 shares based on the closing share price of our stock of $52.09 as of the last business day of 2015. During 2015, the trust formed pursuant to the Canadian Plan purchased in the open market 21,818 Westwood common shares for approximately $1.3 million. On December 15, 2015, 20,375 shares vested at a total fair value of $1.1 million. As of December 31, 2015, the trust holds 33,174 shares of Westwood common stock. As of December 31, 2015, unrecognized compensation cost related to restricted stock grants under the Canadian Plan totaled $854,000, which we expect to recognize over a weighted-average period of 1.8 years.
The following table presents the total stock-based compensation expense recorded and the total income tax benefit recognized for stock-based compensation arrangements for the years indicated (in thousands):
For the years ended December 31, | ||||||||||||
2015 | 2014 | 2013 | ||||||||||
Service condition restricted stock expense | $ | 9,439 | $ | 7,580 | $ | 7,602 | ||||||
Performance-based restricted stock expense | 7,403 | 5,718 | 3,842 | |||||||||
Restricted stock expense under the Plan | 16,842 | 13,298 | 11,444 | |||||||||
Canadian Plan restricted stock expense | 732 | 387 | 235 | |||||||||
Total stock based compensation expense | $ | 17,574 | $ | 13,685 | $ | 11,679 | ||||||
Total income tax benefit recognized related to stock-based compensation | $ | 6,217 | $ | 5,764 | $ | 4,384 | ||||||
Restricted Stock
Under the Plan, we have granted to employees and non-employee directors restricted stock subject to service conditions, and to certain key employees restricted stock subject to both service and performance conditions. We accrue dividends on unvested restricted stock, which are due and payable upon vesting of restricted stock. Accrued dividends coming due within the next twelve months are included in "Dividends payable" on the consolidated balance sheet, with the remaining noncurrent portion of accrued dividends included in "Accrued dividends" on the consolidated balance sheet. At December 31, 2015, we had recorded $5.7 million and $1.7 million in Dividends payable and Accrued dividends, respectively. At December 31, 2014, we had recorded $4.9 million and $1.5 million in Dividends payable and Accrued dividends, respectively.
As of December 31, 2015, there was approximately $22.3 million of unrecognized compensation cost for restricted stock grants under the Plan, which we expect to recognize over a weighted-average period of 2.5 years. In order to satisfy tax liabilities that employees will owe on their shares that vest, we may withhold a sufficient number of vested shares from employees on the date vesting occurs to cover minimum tax withholding requirements. We withheld 91,384 shares in 2015 for this purpose. Our two types of restricted stock grants under the Plan are discussed below.
Restricted Stock Subject Only to a Service Condition
For the years ended December 31, 2015, 2014 and 2013, we granted restricted stock to employees and non-employee directors. Employee shares generally vest over four years and Director shares vest over one year. We calculate compensation cost for restricted stock grants using the fair market value of our common stock at the date of grant, the number of shares issued, an adjustment for restrictions on dividends and an estimate of shares that will not vest due to forfeitures. This compensation cost is amortized on a straight-line basis over the applicable vesting period.
F-22
WESTWOOD HOLDINGS GROUP, INC. AND SUBSIDIARIES
NOTES TO CONSOLIDATED FINANCIAL STATEMENTS — (Continued)
The following table details the status and changes in our restricted stock grants that are subject only to a service condition for the year ended December 31, 2015:
Restricted shares subject only to a service condition: | Number of Shares | Weighted Average Grant Date Fair Value | |||||
Non-vested, January 1, 2015 | 496,457 | $ | 48.14 | ||||
Granted | 309,932 | 61.42 | |||||
Vested | (186,330 | ) | 41.85 | ||||
Forfeited | (39,590 | ) | 55.38 | ||||
Non-vested, December 31, 2015 | 580,469 | $ | 56.76 | ||||
The following table shows the weighted-average grant date fair value for shares granted and the total fair value of shares vested during the years indicated:
Years ended December 31, | ||||||||||||
Restricted shares subject only to a service condition: | 2015 | 2014 | 2013 | |||||||||
Weighted-average grant date fair value | $ | 61.42 | $ | 58.70 | $ | 43.68 | ||||||
Fair value of shares vested (in thousands) | $ | 7,797 | $ | 7,236 | $ | 7,568 | ||||||
Restricted Stock Subject to Service and Performance Conditions
Under the Plan, certain key employees were provided agreements for grants of restricted shares that vest over a five-year period subject to achieving annual performance goals established by the Compensation Committee of Westwood’s Board of Directors. Each year the Compensation Committee establishes a specific goal for that year’s vesting of the restricted shares, which historically has been based upon Westwood’s adjusted pre-tax income, as defined. The date that the Compensation Committee establishes the annual goal is considered to be the grant date and the fair value measurement date to determine expense on the shares that are likely to vest. The vesting period ends when the Compensation Committee formally approves the performance-based restricted stock vesting based on the final calculation of adjusted pre-tax income as derived from the Company’s audited financial statements. If a portion of the performance-based restricted shares does not vest, no compensation expense is recognized for that portion and any previously recognized compensation expense related to shares that do not vest is reversed. In March 2015, the Compensation Committee established the 2015 goal as adjusted pre-tax income of at least $46 million, representing a five-year compound annual growth rate of 10% over annual adjusted pre-tax income recorded in 2009. Adjusted pre-tax income is determined based on our audited financial statements and is equal to income before income taxes increased by expenses incurred for the year for (i) incentive compensation for all officers and employees, (ii) performance-based restricted stock awards, and (iii) mutual fund share incentive awards, excluding start-up, non-recurring, and similar expense items, at the Committee’s discretion. In the first quarter of 2015, we concluded that it was probable that we would meet the performance goals required to vest the applicable percentage of the performance-based restricted shares this year and began recording expense related to those shares.
Restricted shares subject to service and performance conditions: | Number of Shares | Weighted Average Grant Date Fair Value | |||||
Non-vested, January 1, 2015 | 101,313 | $ | 58.59 | ||||
Granted | 101,313 | 61.29 | |||||
Vested | (101,313 | ) | 58.59 | ||||
Forfeited | — | — | |||||
Non-vested, December 31, 2015 | 101,313 | $ | 61.29 | ||||
F-23
WESTWOOD HOLDINGS GROUP, INC. AND SUBSIDIARIES
NOTES TO CONSOLIDATED FINANCIAL STATEMENTS — (Continued)
The following table shows the weighted-average grant date fair value for shares granted and the total fair value of shares vested during the years indicated:
Years ended December 31, | ||||||||||||
Restricted shares subject to service and performance conditions: | 2015 | 2014 | 2013 | |||||||||
Weighted-average grant date fair value | $ | 61.29 | $ | 58.59 | $ | 44.55 | ||||||
Fair value of shares vested (in thousands) | $ | 5,936 | $ | 4,143 | $ | 2,948 | ||||||
The above amounts as of December 31, 2015 do not include 118,939 non-vested restricted shares that potentially vest over performance years subsequent to 2015, as the annual performance goals for those years have not been set by the Compensation Committee and therefore no grant date has been established.
Deferred Share Units
We have a deferred share unit (“DSU”) plan for employees of Westwood International. A DSU is an award linked to the value of Westwood’s common stock and is represented by a notional credit to a participant account. The value of a DSU is initially equal to the value of a share of our common stock. DSUs vest 20%, 40%, 60%, and 80% after two, three, four and five years of service, respectively. DSUs become fully vested after six years of service and the liability for these units is settled in cash upon termination of the participant’s service. We record expense for DSUs based on the number of units vested on a straight line basis, which may increase or decrease based on changes in the price of our common shares, and will increase for additional units received from dividends declared on our shares. As of December 31, 2015, we had an accrued liability of $174,000 for 5,822 deferred share units related to the 2012, 2013 and 2014 awards issued in 2013, 2014 and 2015, respectively, which is based on the $52.09 per share closing price of our common stock on the last trading day of the year ended December 31, 2015.
Mutual Fund Share Incentive Awards
Each year we grant mutual fund incentive awards to certain employees based on our mutual funds achieving certain performance goals. Awards granted are notionally credited to a participant account maintained by us that contains a number of mutual fund shares equal to the award amount divided by the net closing value of a fund share on the date the amount is credited to the account.
These awards vest after approximately one year of service following the year in which the participant earns the award. We begin accruing a liability for mutual fund incentive awards when we determine it is probable that the award will be earned and record expense for these awards over the service period of the award, which is approximately two years. During the year in which the amount of the award is determined, we record expense based on the expected value of the award. After the award is earned, we record expense based on the value of the shares awarded and the percentage of the vesting period that has transpired. Our liability under these awards may increase or decrease based on changes in the value of the mutual fund shares awarded, including reinvested income from the mutual funds during the vesting period. Upon vesting, participants receive the value of the mutual fund share awards adjusted for earnings or losses attributable to the underlying mutual funds. For the years ended December 31, 2015, 2014, and 2013, we recorded expense of $1.2 million, $863,000 and $1.8 million, respectively, related to mutual fund share incentive awards. As of December 31, 2015 and 2014, we had an accrued liability of $2.0 million and $844,000, respectively, related to mutual fund incentive awards.
Benefit Plans
Westwood has a defined contribution 401(k) and profit-sharing plan that was adopted in July 2002 and covers substantially all of our U.S. employees. Discretionary employer profit-sharing contributions become fully vested after six years of service by the participant. For the 401(k) portion of the plan, Westwood provides a match of up to 6% of eligible compensation. These 401(k) matching contributions vest immediately.
The following table displays our profit-sharing and 401(k) contributions for the periods presented (in thousands):
Years ended December 31, | ||||||||||||
2015 | 2014 | 2013 | ||||||||||
Profit-sharing contributions | $ | 965 | $ | 816 | $ | 674 | ||||||
401(k) matching contributions | 1,319 | 928 | 871 | |||||||||
F-24
WESTWOOD HOLDINGS GROUP, INC. AND SUBSIDIARIES
NOTES TO CONSOLIDATED FINANCIAL STATEMENTS — (Continued)
10. EARNINGS PER SHARE:
Basic earnings per common share (“EPS”) is computed by dividing net income available to common stockholders by the weighted average number of shares outstanding. Diluted EPS is computed based on the weighted average shares of common stock outstanding plus the effect of any dilutive shares of restricted stock granted to employees and non-employee directors. There were 323 and 5,993 anti-dilutive restricted shares as of December 31, 2015 and 2014, respectively. There were no anti-dilutive restricted shares as of December 31, 2013.
The following table sets forth the computation of basic and diluted earnings per share (in thousands, except per share and share amounts):
Years ended December 31, | ||||||||||||
2015 | 2014 | 2013 | ||||||||||
Net income | $ | 27,105 | $ | 27,249 | $ | 17,837 | ||||||
Weighted average shares outstanding – basic | 7,756,647 | 7,512,348 | 7,331,874 | |||||||||
Dilutive potential shares from unvested restricted shares | 350,755 | 394,197 | 360,882 | |||||||||
Dilutive potential shares from contingent consideration | 41,997 | — | — | |||||||||
Weighted average shares outstanding – diluted | 8,149,399 | 7,906,545 | 7,692,756 | |||||||||
Earnings per share: | ||||||||||||
Basic | $ | 3.49 | $ | 3.63 | $ | 2.43 | ||||||
Diluted | $ | 3.33 | $ | 3.45 | $ | 2.32 | ||||||
11. VARIABLE INTEREST ENTITIES:
Westwood Trust sponsors common trust funds (“CTFs”) for its clients. These funds allow clients to commingle assets to achieve economies of scale. Westwood Management provides investment advisory services to the Westwood Funds®, a family of mutual funds, and two collective investment trusts (“CITs”). Some clients of Westwood Management hold their investments in ten limited liability companies (“LLCs”). The CTFs, Westwood Funds®, CITs and LLCs (“Westwood VIEs”) are considered VIEs because our clients, who hold the equity at risk, do not have direct or indirect ability through voting or similar rights to make decisions about the funds that may have a significant effect on their economic performance. We receive fees for managing assets in these entities commensurate with market rates.
We evaluate all of our advisory relationships and CTFs to determine whether or not we qualify as the primary beneficiary based on whether there is an obligation to absorb the majority of the expected losses or a right to receive the majority of the expected residual returns or both. Since all losses and returns are distributed to the shareholders of the Westwood VIEs, we are not the primary beneficiary and consequently, the Westwood VIEs are not consolidated into our financial statements.
In May 2015, the Company provided seed investments of $5.4 million for two new Westwood mutual funds. In both December 2015 and January 2014, the Company provided seed investments of $2.0 million to two common trust funds. In October 2014, the Company provided €1.6 million, or approximately $2.0 million, to the UCITS Fund. These seed investments were provided for the sole purpose of showing economic substance needed to establish the funds or sub-funds. The corporate capital invested in these funds is included in “Investments, at fair value” on our consolidated balance sheet at December 31, 2015.
Otherwise, we have not provided any financial support that we were not previously contractually obligated to provide and there are no arrangements that would require us to provide additional financial support to any of these variable interest entities. Our investments in the Westwood Funds®, the UCITS Fund, and the CTFs are accounted for as investments in accordance with our other investments described in Note 3 "Investments". We recognized fee revenue from the Westwood VIEs of approximately $56.4 million, $48.2 million and $36.2 million for the twelve months ended December 31, 2015, 2014 and 2013, respectively.
F-25
WESTWOOD HOLDINGS GROUP, INC. AND SUBSIDIARIES
NOTES TO CONSOLIDATED FINANCIAL STATEMENTS — (Continued)
The following table displays the assets under management, amount of corporate money invested that are included in “Investments, at fair value” on the consolidated balance sheets, and the risk of loss in each vehicle (in millions):
As of December 31, 2015 | ||||||||||||
Assets Under Management | Corporate Investment | Amount at Risk | ||||||||||
VIEs: | ||||||||||||
Westwood Funds® | $ | 3,617 | $ | 6 | $ | 6 | ||||||
Common Trust Funds | 2,885 | 3 | 3 | |||||||||
Collective Investment Trusts | 284 | — | — | |||||||||
LLCs | 133 | — | — | |||||||||
UCITS Fund | 615 | 2 | 2 | |||||||||
All other assets: | ||||||||||||
Private Wealth | 2,375 | |||||||||||
Institutional | 10,853 | |||||||||||
Total AUM | $ | 20,762 | ||||||||||
12. RELATED PARTY TRANSACTIONS:
Some of our directors, executive officers and their affiliates invest their personal funds directly in trust accounts that we manage. There were no amounts due from these accounts as of December 31, 2015 and 2014. For the years ended December 31, 2015, 2014 and 2013, we recorded trust fees from these accounts of $454,000, $264,000, and $278,000, respectively.
The Company engages in transactions with its affiliates in the ordinary course of business. Westwood International and Westwood Management provide investment advisory services to the UCITS Fund. Certain members of the Company’s management and board of directors serve on the board of directors of the UCITS Fund, which began operations in August 2013. Under the terms of the investment advisory agreements, the Company earns quarterly fees paid by either clients of the UCITS Fund or directly by the UCITS Fund. The fees are based on negotiated fee schedules applied to AUM. These fees are commensurate with market rates and are negotiated and contracted at arm’s length. For the years ended December 31, 2015 and 2014, we recorded fees from the UCITS Fund of $1.3 million and $1.1 million, respectively, which are included in “Asset-based advisory fees” on our consolidated statement of comprehensive income. As of December 31, 2015 and 2014, $96,000 and $256,000 of these fees were unpaid and included in “Accounts receivable” on our consolidated balance sheet, respectively. For the year ended December 31, 2013, we did not earn or receive any fees from the UCITS Fund.
F-26
WESTWOOD HOLDINGS GROUP, INC. AND SUBSIDIARIES
NOTES TO CONSOLIDATED FINANCIAL STATEMENTS — (Continued)
13. COMMITMENTS AND CONTINGENCIES:
Leases
We lease our offices under non-cancelable operating lease agreements with expiration dates that run through 2026. Rental expense for facilities and equipment leases for years ended December 31, 2015, 2014 and 2013 aggregated approximately $2.0 million, $1.5 million and $1.6 million, respectively, and is included in general and administrative and information technology expenses in the accompanying consolidated statements of comprehensive income.
At December 31, 2015, the future contractual rental payments for noncancelable operating leases for each of the following five years and thereafter are as follows (in thousands):
Year ending: | |||
2016 | $ | 2,275 | |
2017 | 1,989 | ||
2018 | 1,812 | ||
2019 | 1,373 | ||
2020 | 1,310 | ||
Thereafter | 6,800 | ||
Total payments due | $ | 15,559 | |
Litigation
On August 3, 2012, AGF Management Limited and AGF Investments Inc. (together “AGF”) filed a lawsuit in the Ontario Superior Court of Justice against Westwood, certain Westwood employees and Warren International, LLC, an executive recruiting firm. The action relates to the hiring of certain members of Westwood’s global and emerging markets investment team previously employed by AGF. AGF is alleging that the former employees breached certain obligations when they resigned from AGF and that Westwood and Warren induced such breaches. AGF is seeking an unspecified amount of damages and punitive damages of $10 million (CAD) in the lawsuit. On November 5, 2012, Westwood issued a response to AGF’s lawsuit with a counterclaim against AGF for defamation. Westwood is seeking $1 million (CAD) in general damages, $10 million (CAD) in special damages, $1 million (CAD) in punitive damages, and costs. On November 6, 2012, AGF filed a second lawsuit against Westwood, Westwood Management and an employee of a Westwood subsidiary, alleging that the employee made defamatory statements about AGF. In this second lawsuit, AGF is seeking $5 million (CAD) in general damages, $1 million (CAD) per defendant in punitive damages, unspecified special damages, interest and costs. The pleadings phase was completed in 2013, and we are currently in the discovery phase.
While we intend to vigorously defend both actions and pursue our counterclaims, we are currently unable to estimate the ultimate aggregate amount of monetary gain, loss or financial impact of these actions and counterclaims. Defending these actions and pursuing these counterclaims may be expensive for us and time consuming for our personnel. While we do not currently believe these proceedings will have a material impact, adverse resolution of these actions and counterclaims could have a material adverse effect on our business, financial condition or results of operations.
Our policy is to not accrue legal fees and directly related costs as part of potential loss contingencies. We have agreed with our Directors & Officers insurance provider that 50% of the defense costs related to both AGF claims, excluding Westwood’s counterclaim against AGF, will be covered by insurance. We expense legal fees and directly-related costs as they are incurred. We received insurance proceeds of $714,000 and $379,000 during 2015 and 2014, respectively, and had recorded a receivable of $240,000 and $210,000 as of December 31, 2015 and 2014, respectively, which represented our minimum estimate of related incurred expenses that we expect to recover under our insurance policies. This receivable is part of “Other current assets” on our consolidated balance sheets.
F-27
WESTWOOD HOLDINGS GROUP, INC. AND SUBSIDIARIES
NOTES TO CONSOLIDATED FINANCIAL STATEMENTS — (Continued)
14. SEGMENT REPORTING:
We operate two segments: Advisory and Trust. These segments are managed separately based on the types of products and services offered and their related client bases. The Company’s segment information is prepared on the same basis that management reviews the financial information for operational decision-making purposes. Our Chief Operating Decision Maker evaluates the performance of our segments based primarily on fee revenues and economic earnings. Westwood Holdings Group, Inc., the parent company of Advisory and Trust, does not have revenues and is the entity in which we record typical holding company expenses including employee compensation and benefits for holding company employees, directors’ fees and investor relations costs. All segment accounting policies are the same as those described in the summary of significant accounting policies. Intersegment balances that eliminate in consolidation have been applied to the appropriate segment.
Advisory
Our Advisory segment provides investment advisory services to corporate retirement plans, public retirement plans, endowments, foundations, individuals and the Westwood Funds®, as well as investment subadvisory services to mutual funds and our Trust segment. Westwood Management and Westwood International, which provide investment advisory services to clients of similar type, are included in our Advisory segment, along with Westwood Advisors, LLC.
Trust
Westwood Trust provides trust and custodial services to its clients and to our Advisory segment and sponsors common trust funds to institutions and high net worth individuals.
F-28
WESTWOOD HOLDINGS GROUP, INC. AND SUBSIDIARIES
NOTES TO CONSOLIDATED FINANCIAL STATEMENTS — (Continued)
(in thousands) | Advisory | Trust | Westwood Holdings | Eliminations | Consolidated | |||||||||||||||
Year Ended December 31, 2015 | ||||||||||||||||||||
Revenues: | ||||||||||||||||||||
Net fee revenues from external sources | $ | 101,973 | $ | 28,795 | $ | — | $ | — | $ | 130,768 | ||||||||||
Net intersegment revenues | 19,001 | — | — | (19,001 | ) | — | ||||||||||||||
Net interest and dividend revenue | 425 | 1 | — | — | 426 | |||||||||||||||
Other revenue | (341 | ) | 83 | — | — | (258 | ) | |||||||||||||
Total revenues | 121,058 | 28,879 | — | (19,001 | ) | 130,936 | ||||||||||||||
Expenses: | ||||||||||||||||||||
Depreciation and amortization | 773 | 1,724 | 99 | — | 2,596 | |||||||||||||||
Other operating expenses | 63,658 | 25,882 | 15,581 | (19,001 | ) | 86,120 | ||||||||||||||
Total expenses | 64,431 | 27,606 | 15,680 | (19,001 | ) | 88,716 | ||||||||||||||
Income (loss) before income taxes | 56,627 | 1,273 | (15,680 | ) | — | 42,220 | ||||||||||||||
Income tax expense (benefit) | 19,330 | 517 | (4,732 | ) | — | 15,115 | ||||||||||||||
Net income | $ | 37,297 | $ | 756 | $ | (10,948 | ) | $ | — | $ | 27,105 | |||||||||
Add: | ||||||||||||||||||||
Restricted stock expense | $ | 11,877 | $ | 2,613 | $ | 3,084 | $ | — | $ | 17,574 | ||||||||||
Intangible amortization | 161 | 1,385 | — | — | 1,546 | |||||||||||||||
Deferred taxes on goodwill | 38 | 233 | — | 271 | ||||||||||||||||
Economic Earnings | $ | 49,373 | $ | 4,987 | $ | (7,864 | ) | $ | — | $ | 46,496 | |||||||||
Segment assets | $ | 183,004 | $ | 60,459 | $ | 8,816 | $ | (70,943 | ) | $ | 181,336 | |||||||||
Segment goodwill | $ | 5,219 | $ | 21,925 | $ | — | $ | — | $ | 27,144 | ||||||||||
Expenditures for long-lived assets | $ | 369 | $ | 180 | $ | 267 | $ | 815 | ||||||||||||
Year Ended December 31, 2014 | ||||||||||||||||||||
Revenues: | ||||||||||||||||||||
Net fee revenues from external sources | $ | 92,279 | $ | 20,525 | $ | — | $ | — | $ | 112,804 | ||||||||||
Net intersegment revenues | 13,527 | — | — | (13,527 | ) | — | ||||||||||||||
Net interest and dividend revenue | 261 | 2 | — | — | 263 | |||||||||||||||
Other revenue | 173 | 1 | — | — | 174 | |||||||||||||||
Total revenues | 106,240 | 20,528 | — | (13,527 | ) | 113,241 | ||||||||||||||
Expenses: | ||||||||||||||||||||
Depreciation and amortization | 603 | 302 | 33 | — | 938 | |||||||||||||||
Other operating expenses | 51,265 | 19,867 | 12,662 | (13,527 | ) | 70,267 | ||||||||||||||
Total expenses | 51,868 | 20,169 | 12,695 | (13,527 | ) | 71,205 | ||||||||||||||
Income (loss) before income taxes | 54,372 | 359 | (12,695 | ) | — | 42,036 | ||||||||||||||
Income tax expense (benefit) | 19,057 | 132 | (4,402 | ) | — | 14,787 | ||||||||||||||
Net income | $ | 35,315 | $ | 227 | $ | (8,293 | ) | $ | — | $ | 27,249 | |||||||||
Add: | ||||||||||||||||||||
Restricted stock expense | $ | 9,074 | $ | 1,847 | $ | 2,764 | $ | — | $ | 13,685 | ||||||||||
Intangible amortization | 161 | 198 | — | — | 359 | |||||||||||||||
Deferred taxes on goodwill | 38 | 114 | — | — | 152 | |||||||||||||||
Economic Earnings | $ | 44,588 | $ | 2,386 | $ | (5,529 | ) | $ | — | $ | 41,445 | |||||||||
Segment assets | $ | 144,385 | $ | 18,133 | $ | 10,435 | $ | (33,079 | ) | $ | 139,874 | |||||||||
F-29
WESTWOOD HOLDINGS GROUP, INC. AND SUBSIDIARIES
NOTES TO CONSOLIDATED FINANCIAL STATEMENTS — (Continued)
Segment goodwill | $ | 5,219 | $ | 6,036 | $ | — | $ | — | $ | 11,255 | ||||||||||
Expenditures for long-lived assets | $ | 226 | $ | 29 | $ | 223 | $ | — | $ | 478 | ||||||||||
Year Ended December 31, 2013 | ||||||||||||||||||||
Revenues: | ||||||||||||||||||||
Net fee revenues from external sources | $ | 72,588 | $ | 18,367 | $ | — | $ | — | $ | 90,955 | ||||||||||
Net intersegment revenues | 10,402 | 14 | — | (10,416 | ) | — | ||||||||||||||
Net interest and dividend revenue | 568 | 1 | — | — | 569 | |||||||||||||||
Other revenue | 301 | — | — | — | 301 | |||||||||||||||
Total revenues | 83,859 | 18,382 | — | (10,416 | ) | 91,825 | ||||||||||||||
Expenses: | ||||||||||||||||||||
Depreciation and amortization | 468 | 301 | — | — | 769 | |||||||||||||||
Other operating expenses | 46,545 | 16,943 | 9,799 | (10,416 | ) | 62,871 | ||||||||||||||
Total expenses | 47,013 | 17,244 | 9,799 | (10,416 | ) | 63,640 | ||||||||||||||
Income (loss) before income taxes | 36,846 | 1,138 | (9,799 | ) | — | 28,185 | ||||||||||||||
Income tax expense (benefit) | 13,738 | 408 | (3,798 | ) | — | 10,348 | ||||||||||||||
Net income | $ | 23,108 | $ | 730 | $ | (6,001 | ) | $ | — | $ | 17,837 | |||||||||
Add: | ||||||||||||||||||||
Restricted stock expense | $ | 7,586 | $ | 1,803 | $ | 2,290 | $ | — | $ | 11,679 | ||||||||||
Intangible amortization | 161 | 198 | — | — | 359 | |||||||||||||||
Deferred taxes on goodwill | 38 | 114 | — | — | 152 | |||||||||||||||
Economic Earnings | $ | 30,893 | $ | 2,845 | $ | (3,711 | ) | $ | — | $ | 30,027 | |||||||||
Segment assets | $ | 114,871 | $ | 14,190 | $ | 6,354 | $ | (19,365 | ) | $ | 116,050 | |||||||||
Segment goodwill | $ | 5,219 | $ | 6,036 | $ | — | $ | — | $ | 11,255 | ||||||||||
Expenditures for long-lived assets | $ | 962 | $ | 239 | $ | — | $ | — | $ | 1,201 | ||||||||||
We are providing a performance measure that we refer to as Economic Earnings. Both our management and Board of Directors review Economic Earnings to evaluate our ongoing performance, allocate resources and review our dividend policy. We also believe that this performance measure is useful for management and investors when evaluating our underlying operating and financial performance and our available resources.
In calculating Economic Earnings, we add to net income the non-cash expense associated with equity-based compensation awards of restricted stock, amortization of intangible assets and the deferred taxes related to the tax-basis amortization of goodwill. Although depreciation on property and equipment is a non-cash expense, we do not add it back when calculating Economic Earnings because depreciation charges represent a decline in the value of the related assets that will ultimately require replacement.
The following table provides a reconciliation of net income to Economic Earnings (in thousands, except per share and share amounts):
For the years ended December 31, | ||||||||||||
2015 | 2014 | 2013 | ||||||||||
Net Income | $ | 27,105 | $ | 27,249 | $ | 17,837 | ||||||
Add: Restricted stock expense | 17,574 | 13,685 | 11,679 | |||||||||
Add: Intangible amortization | 1,546 | 359 | 359 | |||||||||
Add: Tax benefit from goodwill amortization | 271 | 152 | 152 | |||||||||
Economic Earnings | $ | 46,496 | $ | 41,445 | $ | 30,027 | ||||||
F-30
WESTWOOD HOLDINGS GROUP, INC. AND SUBSIDIARIES
NOTES TO CONSOLIDATED FINANCIAL STATEMENTS — (Continued)
Geographical information
Years ended December 31, | ||||||||||||
(in thousands) | 2015 | 2014 | 2013 | |||||||||
Revenues by geographic location of client: | ||||||||||||
U.S. | $ | 109,816 | $ | 94,955 | $ | 83,622 | ||||||
Canada | 9,238 | 8,635 | 5,567 | |||||||||
Europe | 6,019 | 8,146 | 1,843 | |||||||||
Asia | 4,538 | 21 | — | |||||||||
Australia | 1,325 | 1,484 | 793 | |||||||||
Total | $ | 130,936 | $ | 113,241 | $ | 91,825 | ||||||
As of December 31, | ||||||||
(in thousands) | 2015 | 2014 | ||||||
Property and equipment, net, by geographic area: | ||||||||
U.S. | $ | 1,806 | $ | 2,057 | ||||
Canada | 386 | 576 | ||||||
Total | $ | 2,192 | $ | 2,633 | ||||
15. CONCENTRATION:
For each of the years ended December 31, 2015, 2014 and 2013, our ten largest clients accounted for over 20% of our fee revenue. No single customer accounted for 10% or more of our fee revenues in any of these years.
Years ended December 31, | ||||||||||||
(in thousands) | 2015 | 2014 | 2013 | |||||||||
Advisory fees from Westwood Management’s largest client: | ||||||||||||
Asset-based fees | $ | 2,109 | $ | 2,183 | $ | 1,729 | ||||||
Performance-based fees | 2,206 | 3,806 | 2,561 | |||||||||
Percent of fee revenue | 3.3 | % | 5.3 | % | 4.7 | % | ||||||
16. SUBSEQUENT EVENTS:
Dividends Declared
On February 3, 2016, the Board of Directors declared a quarterly cash dividend of $0.57 per share on common stock payable on April 1, 2016 to stockholders of record on March 11, 2016.
Restricted Stock Grants
On February 23, 2016, we issued 248,436 shares of restricted stock to employees. On February 23, 2016, shares of our stock closed at a price of $47.52 per share. The shares are subject to vesting conditions described in Note 9 "Employee Benefits" of these consolidated financial statements.
Share Repurchases
On July 20, 2012, our Board of Directors authorized management to repurchase up to $10 million of our outstanding common stock on the open market or in privately negotiated transactions. The share repurchase program has no expiration date and may be discontinued at any time by the Board of Directors. As of December 31, 2015, there had been no repurchases of our common stock under this plan, and $10 million remained available for repurchase.
Between January 1, 2016 and February 25, 2016, the Company repurchased 74,121 shares of our common stock at an average price of $46.93, including commissions, under our share repurchase program.
F-31
WESTWOOD HOLDINGS GROUP, INC. AND SUBSIDIARIES
NOTES TO CONSOLIDATED FINANCIAL STATEMENTS — (Continued)
17. QUARTERLY FINANCIAL DATA (Unaudited):
The following is a summary of unaudited quarterly results of operations for the years ended December 31, 2015 and 2014 (in thousands, except per share amounts):
Quarter | ||||||||||||||||
First | Second | Third | Fourth | |||||||||||||
2015 | ||||||||||||||||
Revenues | $ | 29,608 | $ | 37,311 | $ | 32,451 | $ | 31,566 | ||||||||
Income before income taxes | 8,378 | 14,752 | 10,502 | 8,588 | ||||||||||||
Net income | 5,610 | 9,795 | 7,013 | 4,687 | ||||||||||||
Basic earnings per common share | 0.74 | 1.25 | 0.90 | 0.60 | ||||||||||||
Diluted earnings per common share | 0.71 | 1.23 | 0.87 | 0.58 | ||||||||||||
2014 | ||||||||||||||||
Revenues | $ | 25,949 | $ | 30,905 | $ | 28,122 | $ | 28,265 | ||||||||
Income before income taxes | 8,613 | 13,356 | 10,592 | 9,475 | ||||||||||||
Net income | 5,562 | 8,591 | 7,118 | 5,978 | ||||||||||||
Basic earnings per common share | 0.74 | 1.14 | 0.95 | 0.79 | ||||||||||||
Diluted earnings per common share | 0.72 | 1.12 | 0.92 | 0.77 | ||||||||||||
F-32
INDEX TO EXHIBITS
Exhibit Number | Description of Exhibits | |
2.1 | Securities Purchase Agreement by and among Westwood Holdings Group, Inc., McCarthy Group Advisors, LLC, MGA Holdings, LLC, and The Members of MGA Holdings, LLC (incorporated by reference from the Form 10-K filed with the SEC on February 28, 2013) | |
2.2 | Reorganization Agreement and Agreement and Plan of Merger dated as of January 15, 2015 by and among Westwood Holdings Group, Inc., Westwood Trust, Woodway Financial Advisors, A Trust Company and the Shareholders of Woodway Financial Advisors, A Trust Company (incorporated by reference from the Form 8-K filed with the SEC on January 16, 2016) | |
3.1 | Amended and Restated Certificate of Incorporation of Westwood Holdings Group, Inc. (incorporated by reference from Amendment No. 2 to Registration Statement on Form 10/A filed with the SEC on April 30, 2002) | |
3.1.1 | Amendment to Amended and Restated Certificate of Incorporation of Westwood Holdings Group, Inc. (incorporated by reference from the Form 8-K filed with the SEC on May 7, 2008) | |
3.2 | Amended and Restated Bylaws of Westwood Holdings Group, Inc. (incorporated by reference from the Form 8-K filed with the SEC on April 25, 2012) | |
4.1 | Form of Common Stock Certificate of Westwood Holdings Group, Inc. (incorporated by reference from Amendment No. 2 to Registration Statement on Form 10/A filed with the SEC on April 30, 2002) | |
10.1+ | Third Amended and Restated Westwood Holdings Group, Inc. Stock Incentive Plan (including related forms of Stock Option Agreement and Restricted Stock Agreement) (incorporated by reference from the Form S-8 filed with the SEC on July 1, 2009) | |
10.1.1+ | Amendment to Third Amended and Restated Westwood Holdings Group, Inc. Stock Incentive Plan (including related form of Restricted Stock Agreement) (incorporated by reference from the Form 10-Q filed with the SEC on October 21, 2010) | |
10.1.2+ | Second Amendment to Third Amended and Restated Westwood Holdings Group, Inc. Stock Incentive Plan (incorporated by reference from the Registration Statement on Form S-8 filed with the SEC on April 18, 2012) | |
10.1.3+ | Third Amendment to Third Amended and Restated Westwood Holdings Group, Inc. Stock Incentive Plan (incorporated by reference from the Registration Statement on Form S-8 with the SEC on April 29, 2015) | |
10.2 | Tax Separation Agreement between SWS Group, Inc. and Westwood Holdings Group, Inc. (incorporated by reference from Amendment No. 5 to Registration Statement on Form 10/A filed with the SEC on June 6, 2002) | |
10.3 | Office Lease between Westwood Management Corp. and Crescent Real Estate Funding I, L.P., dated as of April 4, 1990, and amendment thereto (incorporated by reference from the Registration Statement on Form 10 filed with the SEC on February 8, 2002) | |
10.3.1 | Ninth Modification of Office Lease between Westwood Management Corp. and Crescent Real Estate Funding I, dated as of November 25, 2003 (incorporated by reference from the Form 10-K filed with the SEC on February 27, 2004) | |
10.3.2 | Tenth Modification of Office Lease between Westwood Management Corp. and Crescent Real Estate Funding I, dated as of February 23, 2004 (incorporated by reference from the Form 10-K filed with the SEC on February 27, 2004) | |
10.3.3 | Eleventh Modification of Office Lease between Westwood Management Corp. and Crescent Real Estate Funding I, dated as of December 9, 2010 (incorporated by reference from the Form 10-K filed with the SEC on February 25, 2011) | |
10.3.4 | Twelfth Modification of Office Lease between Westwood Management Corp. and Crescent TC Investors LP, dated as of August 17, 2012 (incorporated by reference from the Form 10-K filed with the SEC on February 28, 2013) | |
10.3.5* | Thirteenth Modification of Office Lease between Westwood Management Corp. and Crescent TC Investors LP, dated as of October 9, 2014 | |
F-33
Exhibit Number | Description of Exhibits | |
10.3.6* | Fourteenth Modification of Office Lease between Westwood Management Corp. and Crescent TC Investors LP, dated as of February 5, 2015 | |
10.3.7* | Fifteenth Modification of Office Lease between Westwood Management Corp. and Crescent TC Investors LP, dated as of July 30, 2015 | |
10.4 | Software License Agreement between Infovisa and Westwood Trust, dated as of December 1, 2001 (incorporated by reference from the Registration Statement on Form 10 filed with the SEC on February 8, 2002) | |
10.5 | Software License and Support Agreement between Advent Software, Inc. and Westwood Management Corp., dated as of December 30, 1996 (incorporated by reference from the Registration Statement on Form 10 filed with the SEC on February 8, 2002) | |
10.6 | Investment Sub-advisory Agreement between Teton Advisers, LLC and Westwood Management Corp., dated as of October 6, 1994 (incorporated by reference from the Form 10-K filed with the SEC on February 28, 2013) | |
10.7+ | Form of Indemnification Agreement for Westwood Holdings Group, Inc. (incorporated by reference from the Form 10-K filed with the SEC on February 27, 2004) | |
10.8+ | Form of Indemnification Agreement for Westwood Management Corp. (incorporated by reference from the Form 10-K filed with the SEC on February 27, 2004) | |
10.9+ | Form of Indemnification Agreement for Westwood Trust (incorporated by reference from the Form 10-K filed with the SEC on February 27, 2004) | |
10.10+ | Executive Employment Agreement between Westwood Holdings Group, Inc. and Mark Freeman (incorporated by reference from the Form 8-K filed with the SEC on March 12, 2014) | |
10.11+ | Executive Employment Agreement between Westwood Holdings Group, Inc. and Brian O. Casey (incorporated by reference from the Form 8-K filed with the SEC on April 23, 2010) | |
10.11.1+ | First Amendment to Executive Employment Agreement dated as of April 2, 2015 between the Company and Brain O. Casey (incorporated by reference from the Form 8-K filed with the SEC on April 2, 2015) | |
10.12+ | Executive Employment Agreement between Westwood Holdings Group, Inc. and Brian O. Casey (incorporated by reference from the Form 8-K filed with the SEC on December 18, 2015) | |
10.13+ | Restricted Stock Agreement between Westwood Holdings Group, Inc. and Brian O. Casey (incorporated by reference from the Form 8-K filed with the SEC on April 23, 2010) | |
10.14+ | Restricted Stock Agreement between Westwood Holdings Group, Inc. and Brian O. Casey (incorporated by reference from the Form 8-K filed with the SEC on April 2, 2015) | |
10.15+ | Mutual Fund Share Incentive Agreement, by and between Mark Freeman and Westwood Holdings Group, Inc. dated as of March 19, 2013 (incorporated by reference from the Form 8-K filed with the SEC on March 12, 2014) | |
10.16+ | Mutual Fund Share Incentive Agreement Amendment, by and between Mark Freeman and Westwood Holdings Group, Inc. dated as of March 7, 2014 (incorporated by reference from the Form 8-K filed with the SEC on March 12, 2014) | |
10.17+ | Form of Mutual Fund Share Incentive Agreement, by and between Mark Freeman and Westwood Holdings Group, Inc. (incorporated by reference from the Form 10-K filed with the SEC on February 26, 2015) | |
10.18+ | Share Award Plan of Westwood Holdings Group, Inc. for Service Provided in Canada to its Subsidiaries (incorporated by reference from the Registration Statement on Form S-8 filed with the SEC on April 18, 2012) | |
10.19+ | Consulting Agreement, dated as of March 17, 2015, between Westwood Holdings Group, Inc. and Susan Byrne (incorporated by reference from the Form 10-Q filed with the SEC on July 29, 2015) | |
16.1 | Letter from Grant Thornton LLP, dated October 8, 2015 (incorporated by reference from the Form 8-K filed with the SEC on October 8, 2015) | |
F-34
Exhibit Number | Description of Exhibits | |
21.1 | Subsidiaries (incorporated by reference from the Form 10-K filed with the SEC on February 28, 2013) | |
23.1* | Consent of Deloitte & Touche LLP | |
23.2* | Consent of Grant Thornton LLP | |
24.1* | Power of Attorney (included on first signature page) | |
31.1* | Certification of the Chief Executive Officer of Westwood required by Section 302 of the Sarbanes-Oxley Act of 2002 | |
31.2* | Certification of the Chief Financial Officer of Westwood required by Section 302 of the Sarbanes-Oxley Act of 2002 | |
32.1# | Certification of Chief Executive Officer Pursuant to 18 U.S.C. Section 1350, as Adopted Pursuant to Section 906 of the Sarbanes-Oxley Act of 2002 | |
32.2# | Certification of Chief Financial Officer Pursuant to 18 U.S.C. Section 1350, as Adopted Pursuant to Section 906 of the Sarbanes-Oxley Act of 2002 | |
101.INS* | XBRL Instance Document | |
101.SCH* | XBRL Taxonomy Extension Schema Document | |
101.CAL* | XBRL Taxonomy Extension Calculation Linkbase Document | |
101.DEF* | XBRL Taxonomy Extension Definition Linkbase Document | |
101.LAB* | XBRL Taxonomy Extension Label Linkbase Document | |
101.PRE* | XBRL Taxonomy Extension Presentation Linkbase Document | |
* Filed herewith.
+ | Indicates management contract or compensation plan, contract or arrangement. |
# | Pursuant to Item 601(b)(32) of SEC Regulation S-K, these exhibits are furnished rather than filed with this Report. |
F-35