Attached files
| file | filename |
|---|---|
| EX-99.1 - EX-99.1 - LODGENET INTERACTIVE CORP | a12-16713_1ex99d1.htm |
| 8-K - 8-K - LODGENET INTERACTIVE CORP | a12-16713_18k.htm |
Exhibit 99.2
|
|
LodgeNet Interactive Corporation Q2 2012 Earnings Presentation July 19, 2012 |
|
|
2 Certain statements in this presentation constitute “forward-looking statements.” Such forward-looking statements are subject to risks, uncertainties and other factors that could cause the actual results, performance or achievements to be materially different from any future results, performance or achievements expressed or implied by such forward-looking statements. Such factors include, among others, the following: uncertainties relating to our ability to reduce room churn and stabilize revenues; the effects of economic conditions, including general financial conditions; the economic condition of the lodging industry, which can be particularly affected the financial conditions referenced above, as well as by high gas prices, levels of unemployment, consumer confidence, acts or threats of terrorism and public health issues; competition from providers of similar services and from alternative systems for accessing in-room entertainment; competition from HSIA providers; changes in demand for our products and services; programming availability, timeliness, quality and costs; technological developments by competitors; developmental costs, difficulties and delays; relationships with customers and property owners, in particular as we reduce capital investment; the availability of capital to finance growth; compliance with credit facility covenants; the impact of governmental regulations; potential effects of litigation; risks of diversification into new products, services, or markets; risks related to the security of our data systems; and other factors detailed, from time to time, in our filings with the Securities and Exchange Commission. For any of the foregoing reasons, our guidance and our actual financial results may not meet our expectations. These forward-looking statements speak only as of the date of this presentation. We expressly disclaim any obligation or undertaking to release publicly any updates or revisions to any forward-looking statements contained herein to reflect any change in our expectations with regard thereto or any change in events, conditions or circumstances on which any such statement is based. |
|
|
Phillip Spencer – Interim CEO 20+ years with Private Equity Backed Cable, Telecom, and Technology Companies Most Recently Served as CEO of Windjammer Cable Operated 143 cable systems Competitor of LodgeNet Significant Experience Building Customer Centric Organizations Addressing Top Line Revenue Growth Reversing Customer Churn 3 |
|
|
First 45 Days Conducting Financial and Operational Review Meeting/Talking with Customers and Employees Reviewing the Organizational Structure Analysis of Financials Extensive Focus on GE Revenue and Room Churn Assessing Other Growth Opportunities 4 |
|
|
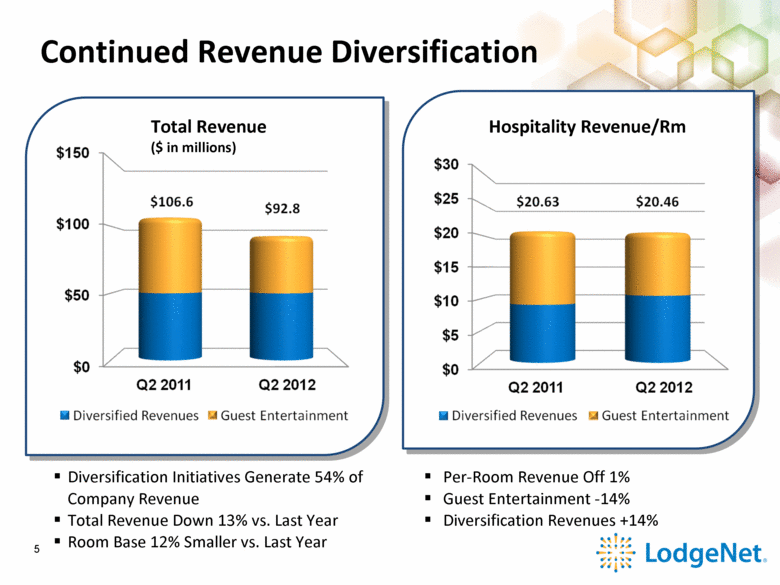
Diversification Initiatives Generate 54% of Company Revenue Total Revenue Down 13% vs. Last Year Room Base 12% Smaller vs. Last Year Continued Revenue Diversification 5 Per-Room Revenue Off 1% Guest Entertainment -14% Diversification Revenues +14% Hospitality Revenue/Rm Total Revenue ($ in millions) |
|
|
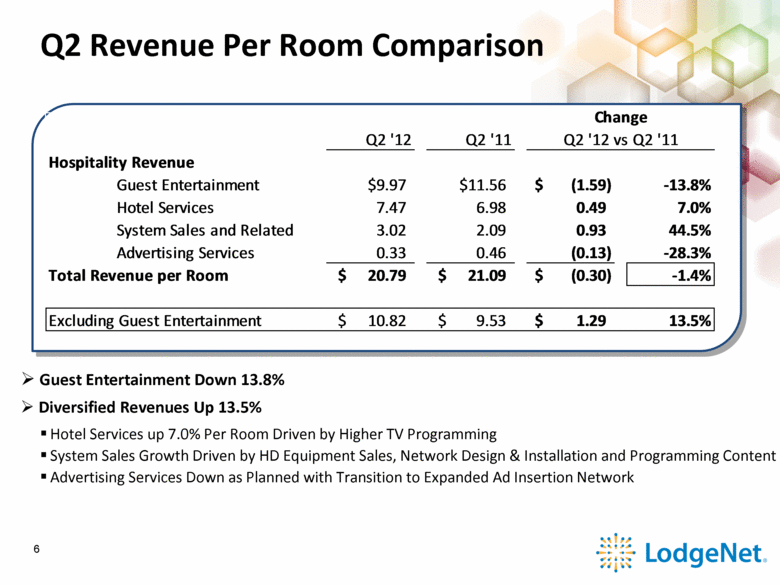
Q2 Revenue Per Room Comparison Guest Entertainment Down 13.8% Diversified Revenues Up 13.5% Hotel Services up 7.0% Per Room Driven by Higher TV Programming System Sales Growth Driven by HD Equipment Sales, Network Design & Installation and Programming Content Advertising Services Down as Planned with Transition to Expanded Ad Insertion Network 6 Q2 '12 Q2 '11 Hospitality Revenue Guest Entertainment $9.97 $11.56 (1.59) $ -13.8% Hotel Services 7.47 6.98 0.49 7.0% System Sales and Related 3.02 2.09 0.93 44.5% Advertising Services 0.33 0.46 (0.13) -28.3% Total Revenue per Room 20.79 $ 21.09 $ (0.30) $ -1.4% Excluding Guest Entertainment 10.82 $ 9.53 $ 1.29 $ 13.5% Change Q2 '12 vs Q2 '11 |
|
|
Superior High Definition Performance HD Rooms = 64% Higher Revenue per Month vs. Analog Rooms 59% More Guest Entertainment 71% More TV Programming Installed 15,000 HD Rooms in 2nd Quarter Average Cost of $143 Per Room Solid Return on Capital Investment $125 - $175 Investment per Room Capital Returned within 18 Months 5 Year Contract with Upgrade Supports Envision Platform All Future HD Upgrades Support Envision Apps Existing HD Rooms Upgradeable to Envision HD Systems Now in 340,000 Rooms (24% of Room Base) Significant Revenue Opportunity as HD Penetration Increases 7 |
|
|
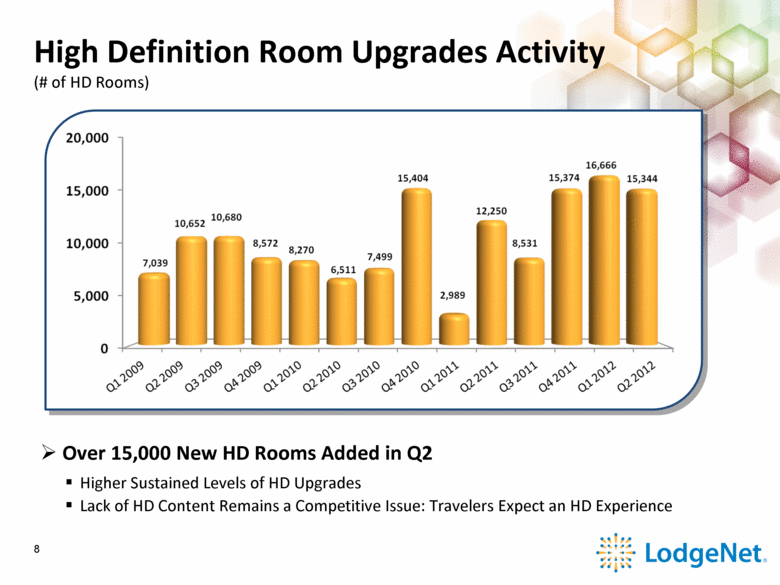
High Definition Room Upgrades Activity (# of HD Rooms) 8 Over 15,000 New HD Rooms Added in Q2 Higher Sustained Levels of HD Upgrades Lack of HD Content Remains a Competitive Issue: Travelers Expect an HD Experience |
|
|
Steady Gross Margins Total Margin Rate Impacted by Revenue Mix Changes Guest Entertainment – Maintained 60%+ Gross Margins Hotel Services – Steady Margin on TV Programming Fees System Sales & Related – Lower Margin HD Equipment Sales Advertising – Driven by Server-Based Advertising and Carriage Revenue Healthcare – Lower Margin Q2 Installation – Margins Expected to Normalize in Q3 9 ppt Q2 '12 Q2 '11 Change Guest Entertainment 60.5% 61.7% -1.2% Hotel Services 16.8% 16.7% 0.1% System Sales & Related 28.6% 30.4% -1.8% Advertising Services 87.0% 43.7% 43.3% Healthcare 39.5% 53.0% -13.5% Total Gross Margin 40.6% 43.6% -3.0% |
|
|
Lower Operating Expenses -17% Operating Expenses ($ in millions) 10 Continued Op Ex Reduction Broad Based Expense Reduction: - Compensation Expense - System Repair Costs - Content Delivery - Property Taxes and Facilities Costs 8% Decline in 2012 Following a 10% Reduction in Q2 ‘11 Headcount Down 8% vs Prior Year |
|
|
Profitability Metrics * Adjusted Operating Cash Flow Definition - see slide 21 Adjusted Operating Cash Flow (Trailing Twelve Months, $ in millions) 11 Operating Margins Maintained Product Margins Operating Expense Control Down $1.6 Million Year Over Year |
|
|
Profitability Metrics, Adjusted for Impairment Write-Offs Operating Income Down $9.7M on adj. basis Lower Margin Partially Offset by Reduced Operating Expenses Earnings Per Share Down 112% on adj. basis Operating Income ($ in millions) Earnings (Loss) Per Common Share 12 |
|
|
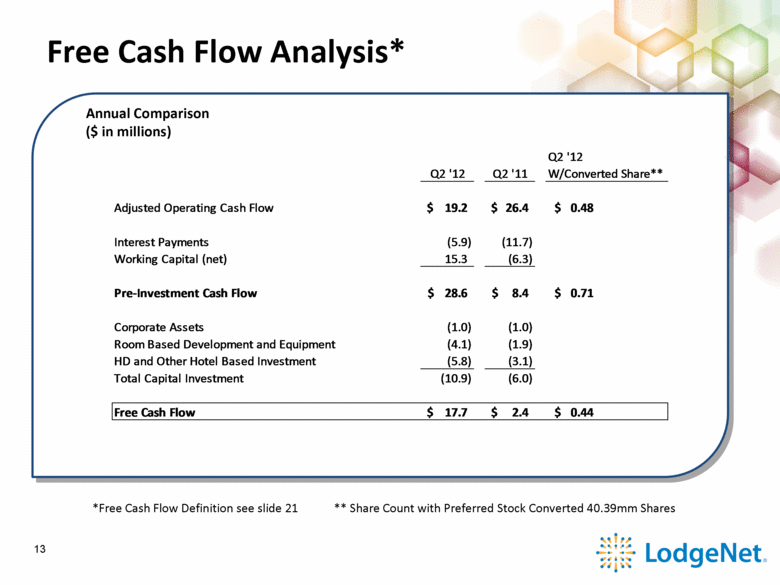
Free Cash Flow Analysis* Annual Comparison ($ in millions) *Free Cash Flow Definition see slide 21 ** Share Count with Preferred Stock Converted 40.39mm Shares 13 Q2 '12 Q2 '11 Adjusted Operating Cash Flow 19.2 $ 26.4 $ 0.48 $ Interest Payments (5.9) (11.7) Working Capital (net) 15.3 (6.3) Pre-Investment Cash Flow 28.6 $ 8.4 $ 0.71 $ Corporate Assets (1.0) (1.0) Room Based Development and Equipment (4.1) (1.9) HD and Other Hotel Based Investment (5.8) (3.1) Total Capital Investment (10.9) (6.0) Free Cash Flow 17.7 $ 2.4 $ 0.44 $ Q2 '12 W/Converted Share** |
|
|
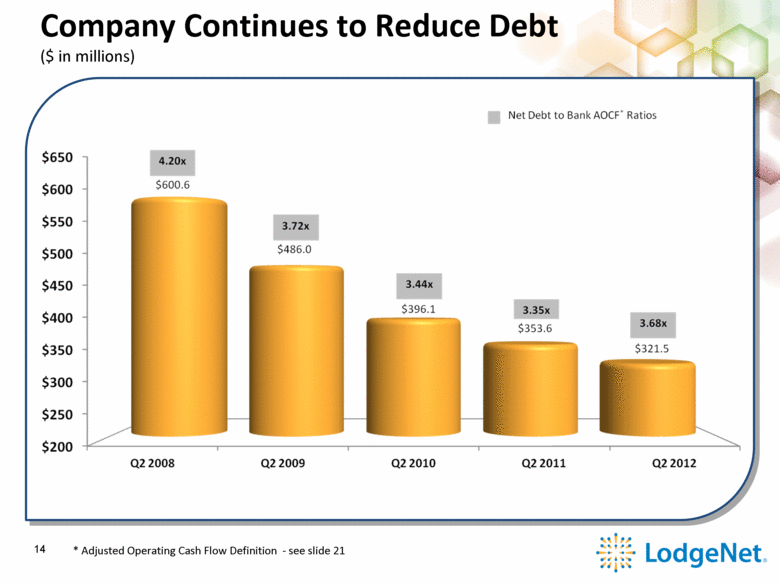
Company Continues to Reduce Debt ($ in millions) 14 * Adjusted Operating Cash Flow Definition - see slide 21 |
|
|
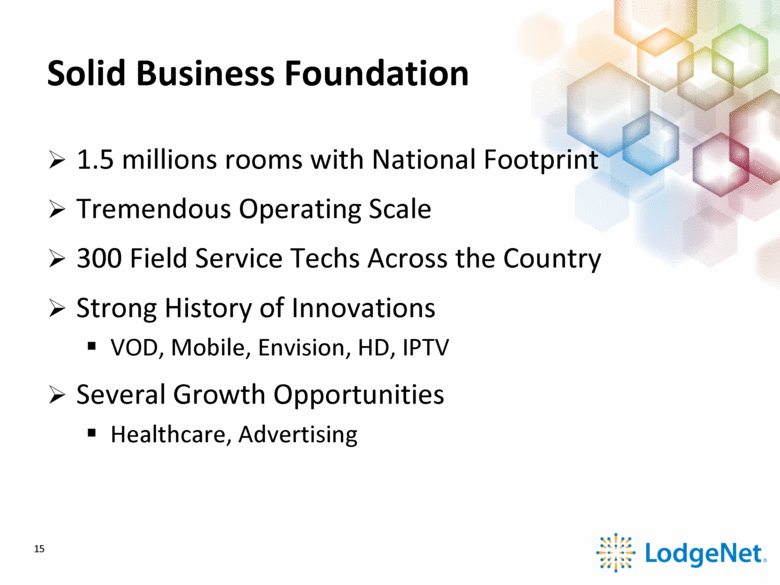
Solid Business Foundation 1.5 millions rooms with National Footprint Tremendous Operating Scale 300 Field Service Techs Across the Country Strong History of Innovations VOD, Mobile, Envision, HD, IPTV Several Growth Opportunities Healthcare, Advertising 15 |
|
|
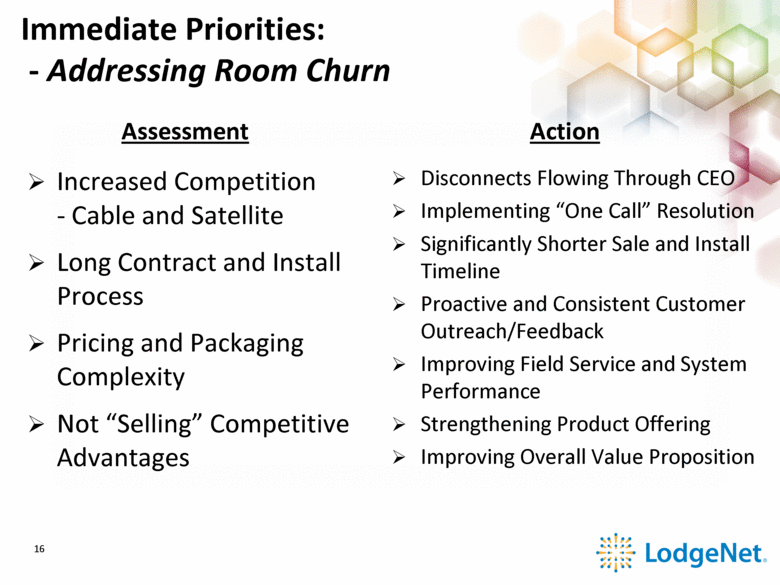
Immediate Priorities: - Addressing Room Churn Increased Competition - Cable and Satellite Long Contract and Install Process Pricing and Packaging Complexity Not “Selling” Competitive Advantages Assessment Disconnects Flowing Through CEO Implementing “One Call” Resolution Significantly Shorter Sale and Install Timeline Proactive and Consistent Customer Outreach/Feedback Improving Field Service and System Performance Strengthening Product Offering Improving Overall Value Proposition Action 16 |
|
|
Immediate Priorities - Stabilize Guest Entertainment Technology Changes: Anywhere/anytime content availability Proliferation of mobile/wireless devices Industry Significantly Lagged Residential HD TV Adoption Inconsistent Systems and Menus Assessment Action Exploit Advanced Content Window, Best Screen and Studio Relationships Simplify Guest Interface/Menu Movies First/Remove the “Clutter” Enhance Pricing/Promotion Strategy to Maximize Buys and Profit Standardize Middleware and Address System Performance 17 |
|
|
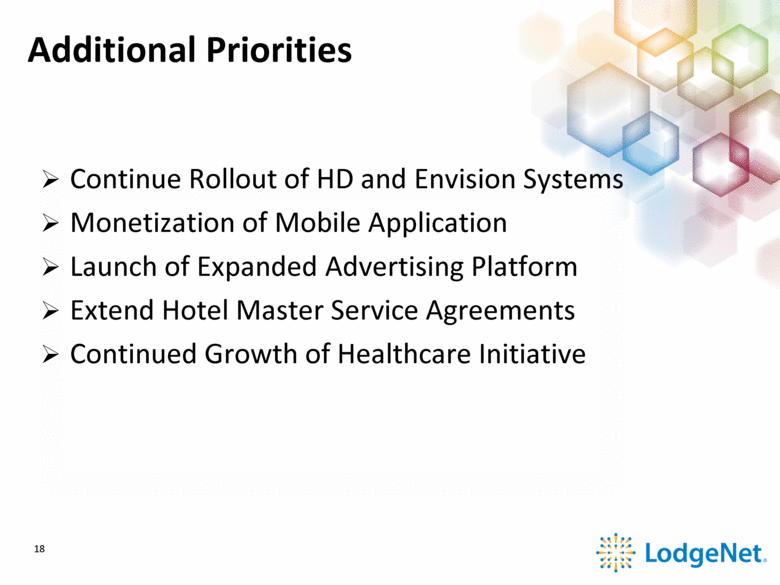
Additional Priorities Continue Rollout of HD and Envision Systems Monetization of Mobile Application Launch of Expanded Advertising Platform Extend Hotel Master Service Agreements Continued Growth of Healthcare Initiative 18 |
|
|
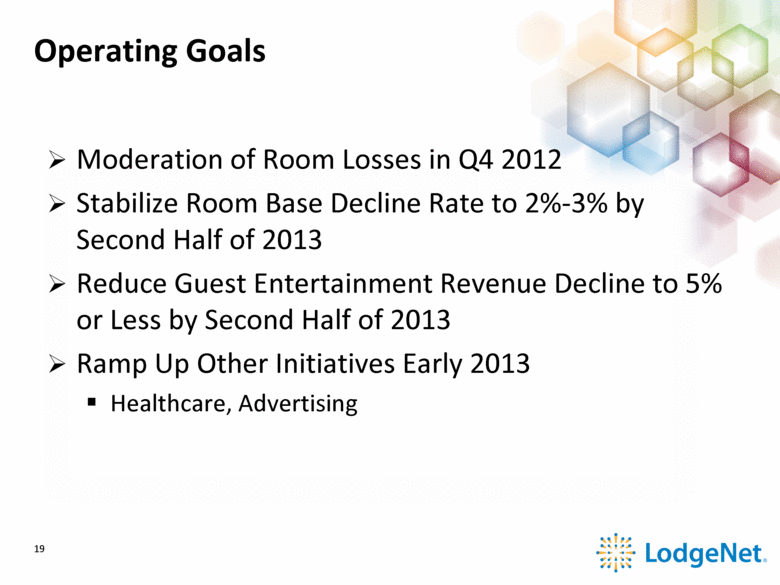
Operating Goals Moderation of Room Losses in Q4 2012 Stabilize Room Base Decline Rate to 2%-3% by Second Half of 2013 Reduce Guest Entertainment Revenue Decline to 5% or Less by Second Half of 2013 Ramp Up Other Initiatives Early 2013 Healthcare, Advertising 19 |
|
|
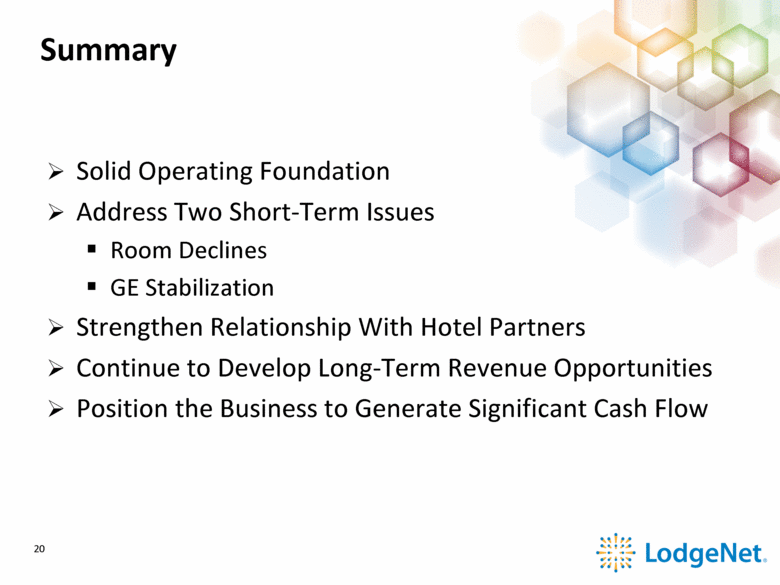
Summary Solid Operating Foundation Address Two Short-Term Issues Room Declines GE Stabilization Strengthen Relationship With Hotel Partners Continue to Develop Long-Term Revenue Opportunities Position the Business to Generate Significant Cash Flow 20 |
|
|
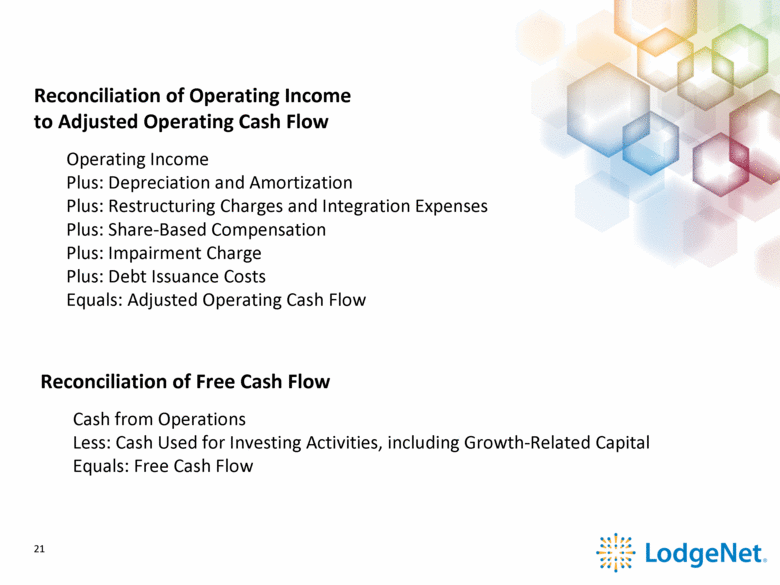
Reconciliation of Operating Income to Adjusted Operating Cash Flow Operating Income Plus: Depreciation and Amortization Plus: Restructuring Charges and Integration Expenses Plus: Share-Based Compensation Plus: Impairment Charge Plus: Debt Issuance Costs Equals: Adjusted Operating Cash Flow Reconciliation of Free Cash Flow Cash from Operations Less: Cash Used for Investing Activities, including Growth-Related Capital Equals: Free Cash Flow 21 |

