Attached files
| file | filename |
|---|---|
| 8-K - 8-K - KEYCORP /NEW/ | d381145d8k.htm |
| EX-99.1 - EX-99.1 - KEYCORP /NEW/ | d381145dex991.htm |
| EX-99.3 - EX-99.3 - KEYCORP /NEW/ | d381145dex993.htm |
| KeyCorp
Second Quarter 2012 Earnings Review
July 19, 2012
Beth E. Mooney
Chairman and
Chief Executive Officer
Jeffrey B. Weeden
Chief Financial Officer
Exhibit 99.2 |
| 2
FORWARD-LOOKING STATEMENTS AND ADDITIONAL
INFORMATION DISCLOSURE
This presentation contains and we may, from time to time, make forward-looking statements within
the meaning of the Private Securities Litigation Reform Act of 1995, including statements about
Key’s financial condition, results of operations, earnings outlook, asset quality trends, capital
levels and profitability. Forward-looking statements are not historical facts but instead
represent only management’s current expectations and forecasts regarding future events,
many of which, by their nature, are inherently uncertain and outside of Key’s control. Forward-looking
statements usually can be identified by the use of words such as “goal,”
“objective,” plan,” “expect,” “anticipate,” “intend,” “project,” “believe,”
“estimate” or other words of similar meaning. Our forward-looking
statements are subject to the following principal risks and uncertainties: the economic recovery may face challenges causing
its momentum to falter or a further recession; the Dodd-Frank Wall Street Reform and Consumer
Protection Act and other reforms will subject us to a variety of new and more stringent legal
and regulatory requirements, including increased scrutiny from our regulators; changes in local,
regional and international business, economic or political conditions in the regions where we operate
or have significant assets; changes in trade, monetary and fiscal policies of various
governmental bodies and central banks could affect the economic environment in which we operate; our
ability to effectively deal with an economic slowdown or other economic or market difficulty; adverse
changes in credit quality trends; our ability to determine accurate values of certain assets
and liabilities; adverse behaviors in foreign exchange rates, securities, public debt, and capital
markets, including changes in market liquidity and volatility; our ability to anticipate
interest rate changes correctly and manage interest rate risk presented through unanticipated
changes in our interest rate risk position and/or short- and long-term interest rates; unanticipated changes in our
liquidity position, including but not limited to our ability to enter the financial markets to manage
and respond to any changes to our liquidity position; adequacy of our risk management
program; reduction of the credit ratings assigned to KeyCorp and KeyBank; increased competitive
pressure due to industry consolidation; unanticipated adverse affects of acquisitions and dispositions
of assets, business units or affiliates; and operational or risk management failures due to
technological, cybersecurity threats or other factors.
We provide greater detail regarding some of these factors in our 2011 Form 10-K, including in Item
1A. Risk Factors and in Item 7. Management’s Discussion and Analysis of Financial
Condition and Results of Operation under the heading “Risk Management,” as well as in our subsequent
SEC filings, all of which are accessible on our website at www.key.com/ir and on the SEC’s
website at www.sec.gov.
Key does not undertake any obligation to update the forward-looking statements to reflect the
impact of circumstances or events that may arise after the date of the forward-looking
statements. Actual results or future events could differ, possibly materially, from those anticipated in forward-
looking statements, as well as from historical performance. This presentation also includes
certain Non-GAAP financial measures related to “tangible common equity, “Tier 1 common equity,” and “pre-
provision net revenue.” Management believes these ratios may assist investors, analysts and
regulators in analyzing Key’s financials. Although Key has procedures in place to
ensure that these measures are calculated using the appropriate GAAP or regulatory components, they have
limitations as analytical tools and should not be considered in isolation, or as a substitute for
analysis of results under GAAP. For more information on these calculations and to view
the reconciliations to the most comparable GAAP measures, please refer to the Appendix to this
presentation or our most recent earnings press release, which is accessible at www.key.com/ir. Web addresses referenced in this
slide are inactive textual references only. Information on these websites is not part of this document. |
 3
Second quarter net income up 11% from 1Q12
Company-wide initiatives to improve efficiency
Continued improvement in credit quality
Growing client relationships and engagement
Acquired 37 branches in Upstate New York
Growth in average loans driven by C&I
Growing the
Franchise
Executing common stock repurchase program
Increased common dividend for 2Q12 from $.03 to $.05
Strong capital levels; positioned for Basel III
Execution of
Business
Plan
Investor Highlights –
Second Quarter 2012
Strategic statement: Key grows by building enduring relationships
through client-focused solutions and extraordinary service
Disciplined
Capital
Management |
 Driving
Growth through Efficiency Expected Benefit
$150 -
$200 MM
December 2013
69%
60% -
65%
$150 -
$200 MM
Efficiency Ratio
(a)
2Q12
Target
Impact of
Initiatives
4
(a)
From continuing operations, before restructuring costs
.
Corporate
Bank
Community
Bank
Shared
Services
End-to-end process
optimization
Organizational design –
span and layers
Strategic sourcing
Branch rationalization
Improve variability of cost
to serve
Sales and service
productivity
Occupancy
Demand management
Company-wide Initiatives
Aligning cost structure with operating environment |
 Branch
Acquisition Strengthens Market Share Key Branch
HSBC Branch
Source: SNL; based on Buffalo-Niagara Falls MSA and Rochester MSA
Buffalo
Rochester
5
Benefits of Acquisition
Gaining Meaningful Share
Strengthens Key’s local presence in attractive
markets of Buffalo and Rochester, New York
Enhances ability to acquire customers and
provide exceptional service
Adds ATM check imaging capabilities
Provides liquidity to fund organic growth and
remain flexible with debt maturities
Leverages existing cost structure across larger
base
Seamless and successful conversion
Transaction closed July 13, 2012, adding $2.1 billion in deposits and $260 million in
loans |
 6
Delivering Shareholder Value
Executing Relationship Strategy
Moderate Risk Profile
High Quality, Diverse Revenue Streams
Positive Operating Leverage
Disciplined Capital Management
ROA Target: 1.00% -
1.25% |
 7
Financial Review |
 8
Financial Summary –
Second Quarter 2012
Capital
(b)
Asset Quality
(a)
Financial
Performance
(a)
TE = Taxable equivalent, EOP = End of Period
(a)
From continuing operations
(b)
From consolidated operations
(c)
6-30-12 ratios are estimated
(d)
Non-GAAP measure: see slide 24 of Appendix for reconciliation
Income from continuing operations attributable to Key
$.23
$.21
$.26
common shareholders
Net interest margin (TE)
3.06%
3.16%
3.19%
Return on average total assets
1.12
1.02
1.23
Tier 1 common equity
(c), (d)
11.7%
11.5%
11.1%
Tier 1 risk-based capital
(c)
12.5
13.3
13.9
Tangible common equity to tangible assets
(d)
10.4
10.3
9.7
Book value per common share
$10.43
$10.26
$9.88
Net loan charge-offs to average loans
.63%
.82%
1.11%
NPLs to EOP portfolio loans
1.32
1.35
1.76
NPAs to EOP portfolio loans + OREO + Other NPAs
1.51
1.55
1.98
Allowance for loan losses to period-end loans
1.79
1.92
2.57
Allowance for loan losses to NPLs
135.2
141.7
146.1
Metrics
2Q12
1Q12 2Q11 |
 $0
$10
$20
$30
$40
$50
$60
2Q11
3Q11
4Q11
1Q12
2Q12
9
Average balances grew for the third consecutive
quarter, driven by growth in C&I loans
Strong spring home equity campaign drove
period-end Community Bank home equity loans
5% higher in 2Q12
Originated $10.3 billion in new or renewed lending
commitments during 2Q12, up 8% from prior year
Continuing to leverage integrated business model
and focus on targeted segments
Loan Growth
$ in billions
Highlights
Average Commercial & Industrial Loans
C&I loans
Utilization rate
Quarterly % Change in Average C&I Loans
Average Loans
Exit Portfolios
Home Equity & Other
C&I & Leasing
Commercial Real Estate
$ in billions
$48.5
$20.1
$19.6
$18.3
$17.4
$16.9
47.3%
46.9%
46.3%
44.4%
43.4%
$0
$5
$10
$15
$20
$25
2Q11
3Q11
4Q11
1Q12
2Q12
30%
40%
50%
60%
(5.7)%
(4.4)%
(2.3)%
(1.5)%
3.7%
5.4%
7.2%
2.5%
2.7%
(12.0)%
(8.0)%
(4.0)%
.0%
4.0%
8.0%
2Q10
3Q10
4Q10
1Q11
2Q11
3Q11
4Q11
1Q12
2Q12
$48.0
$48.7
$49.4
$49.4 |
 10
$45.3
$46.5
$48.2
$48.8
$50.8
.10%
.12%
.17%
.13%
.15%
$25
$35
$45
$55
2Q11
3Q11
4Q11
1Q12
2Q12
.00%
.10%
.20%
.30%
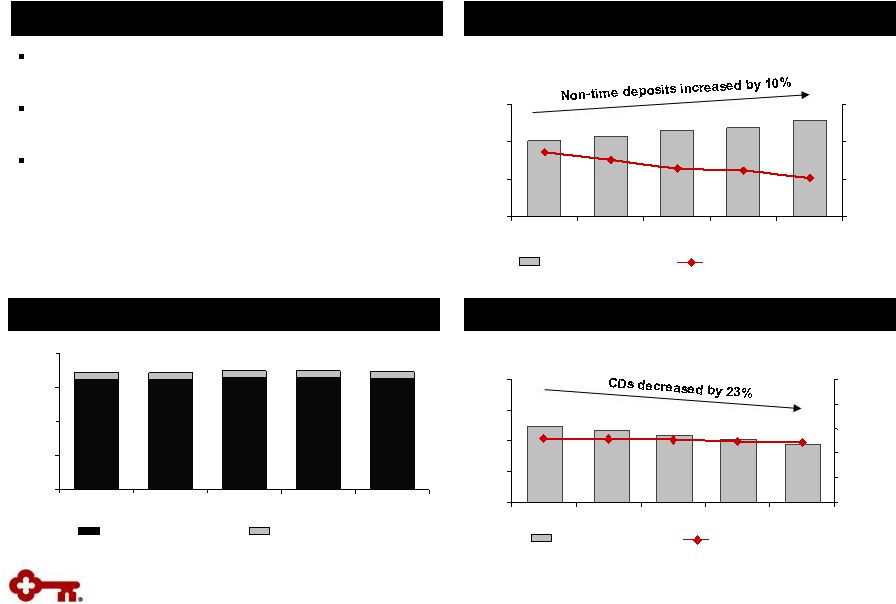
Improving Deposit Mix
Highlights
Average Non-time Deposits
(a)
Higher cost CDs continue to decline, while lower
cost deposits have remained strong
Improved funding mix has reduced the cost of
deposits, which is down 6 bps from 1Q12
Total CD maturities and average cost
–
2012 Q3: $2.5 billion at 2.23%
–
2012 Q4: $1.3 billion at 2.18%
–
2013: $3.2 billion at 1.77%
–
2014 & beyond: $2.0 billion at 3.28%
Average
CD Balances
$ in billions
$ in billions
(a) Excludes time deposits and deposits in foreign office
(b) Represents period-end consolidated total loans and loans held for
sale (excluding education loans in the securitization trusts) divided by
period-end consolidated total deposits (excluding deposits in foreign office)
Loan to Deposit Ratio
(b)
Continuing operations
Discontinued operations
Cost of non-time deposits
Non-time deposits
Average rate on CDs
Total average CDs
81%
80%
82%
82%
82%
86%
86%
87%
87%
86%
0%
25%
50%
75%
100%
2Q11
3Q11
4Q11
1Q12
2Q12
$9.5
$10.1
$10.8
$11.7
$12.4
2.59%
2.53%
2.60%
2.48%
2.42%
$0
$5
$10
$15
$20
2Q11
3Q11
4Q11
1Q12
2Q12
.00%
1.00%
2.00%
3.00%
4.00%
5.00% |
 11
$950
$914
$859
$767
$751
1.32%
1.35%
1.47%
1.64%
1.76%
$0
$400
$800
$1,200
$1,600
2Q11
3Q11
4Q11
1Q12
2Q12
0.00%
1.00%
2.00%
3.00%
$888
$944
$1,004
$1,131
$1,230
2.35%
2.03%
2.57%
1.92%
1.79%
$0
$400
$800
$1,200
$1,600
2Q11
3Q11
4Q11
1Q12
2Q12
0.00%
1.00%
2.00%
3.00%
4.00%
135.2%
141.7%
138.1%
143.5%
146.1%
0%
50%
100%
150%
200%
2Q11
3Q11
4Q11
1Q12
2Q12
$134
$109
$105
$101
$77
$21
$42
$(22)
$10
$(8)
.63%
.82%
.86%
.90%
1.11%
-$100
$0
$100
$200
$300
2Q11
3Q11
4Q11
1Q12
2Q12
-1.00%
.00%
1.00%
2.00%
3.00%
Nonperforming Assets
Net Charge-offs & Provision for Loan and Lease Losses
NPLs
NPLs to period-end loans
NCOs
Provision for loan and
lease losses
NCOs to average loans
Allowance for Loan and Lease Losses
Allowance to Nonperforming Loans
Allowance for loan
and lease losses
ALLL to period-end loans
$ in millions
$ in millions
$ in millions
NPLs held for sale,
OREO & other NPAs
Continued Improvement in Asset Quality |
 12
Total Revenue
TE = Taxable equivalent
$ in millions
Continuing Operations
Net interest margin
Net interest income
Highlights
Net Interest Margin (TE) Trend
Net interest margin down due to early
termination of leveraged leases and continued
low rate environment
Higher noninterest income driven by leveraged
lease terminations and gains from loan sales
Pressure in market-sensitive businesses
continues to challenge Key and the industry
New client acquisition and execution of
relationship-based model will provide
opportunities to grow noninterest income
Noninterest Income and % of Total Revenue
Noninterest income
Noninterest income to
total revenue
$ in millions
$544
$559
$563
$555
$570
3.09%
3.13%
3.19%
3.16%
3.06%
$0
$150
$300
$450
$600
$750
2Q11
3Q11
4Q11
1Q12
2Q12
0.00%
2.00%
4.00%
6.00%
$454
$483
$414
$472
$485
47.1%
45.8%
44.3%
42.4%
46.5%
$0
$200
$400
$600
2Q11
3Q11
4Q11
1Q12
2Q12
30.0%
40.0%
50.0%
60.0% |
 13
$380
$382
$387
$385
$389
$300
$310
$330
$318
$325
$0
$200
$400
$600
$800
2Q11
3Q11
4Q11
1Q12
2Q12
Focused Expense Management
Noninterest Expense
Personnel expense
$ in millions
Highlights
Noninterest expense increased $11 million from
1Q12
–
Elevated expenses related to acquisition of
branches in Upstate New York
–
Costs related to company-wide efficiency
initiatives
–
Higher marketing expense correlated with
robust spring home equity campaign
Key remains focused on operating leverage, with
newly announced efficiency initiatives in place
–
Targeting $150 -
$200 million in expense
reductions by December 2013, with full-year
impact expected in 2014
Average FTEs
Non-personnel expense
$680
15,584
15,404
15,424
15,665
15,301
15,349
15,490
15,381
15,455
14,000
15,000
16,000
17,000
18,000
2Q10
3Q10
4Q10
1Q11
2Q11
3Q11
4Q11
1Q12
2Q12
$692
$717
$703
$714 |
 14
Strong capital position supports growth
Disciplined capital management process
–
Executing share repurchases
–
Increased dividend for 2Q12 from $.03 to
$.05 per common share
Estimated Basel III tier 1 common equity ratio of
10.9%
(a)
Tier 1 Common Equity
(b), (c)
Tangible Common Equity to Tangible Assets
(b)
Strong Capital Ratios
Highlights
Book Value per Share
10.4%
10.3%
9.7%
9.8%
9.9%
0.00%
3.00%
6.00%
9.00%
12.00%
2Q11
3Q11
4Q11
1Q12
2Q12
$10.43
$10.26
$9.88
$10.09
$10.09
$8.00
$8.50
$9.00
$9.50
$10.00
$10.50
2Q11
3Q11
4Q11
1Q12
2Q12
11.1%
11.7%
11.5%
11.3%
11.3%
0.00%
3.00%
6.00%
9.00%
12.00%
2Q11
3Q11
4Q11
1Q12
2Q12
(a)
Based upon June 30, 2012 pro forma analysis; see slide 25 of Appendix for further
detail (b)
Non-GAAP measure: see slide 24 of Appendix for reconciliation
(c)
6-30-12 ratio is estimated |
 15
Appendix |
 16
(a)
Continuing operations, unless otherwise noted
(b)
Represents period-end consolidated total loans and loans held for sale
(excluding education loans in the securitization trusts) divided by
period-end consolidated total deposits (excluding deposits in foreign office)
Progress on Targets for Success
KEY Business
Model
KEY Metrics
(a)
KEY
2Q12
KEY
1Q12
Targets
Action Plans
Core funded
Loan to deposit ratio
(b)
86%
87%
90-100%
Leverage integrated model to grow
relationships and loans
Improve deposit mix
Returning to a
moderate risk
profile
NCOs to average loans
.63%
.82%
40-50 bps
Focus on relationship clients
Exit noncore portfolios
Limit concentrations
Focus on risk-adjusted returns
Growing high
quality, diverse
revenue streams
Net interest margin
3.06%
3.16%
>3.50%
Improve funding mix
Focus on risk-adjusted returns
Grow client relationships
Leverage Key’s total client solutions and
cross-selling capabilities
Noninterest income
to total revenue
47%
46%
>40%
Creating positive
operating
leverage
Efficiency ratio
69%
68%
60-65%
Improve efficiency and effectiveness
Leverage technology
Change cost base to more variable from
fixed
Executing our
strategies
Return on average
assets
1.12%
1.02%
1.00-1.25%
Execute our client insight-driven
relationship model
Focus on operating leverage
Improved funding mix with lower cost core
deposits |
 17
Community Bank: Engaging Relationships
Performance Metrics
* Initiated tracking of engaged clients
Engaged: A relationship client as determined by product or transaction
activity Focusing on targeted clients, alignment, capabilities and
channels •
Four consecutive quarters of average
loan growth
•
Strong spring borrowing campaign
drove home equity balances 5% higher
during 2Q12
•
Continued improvement in deposit mix
•
Net charge-offs of 74 bps at lowest level
in 4 years
•
2Q12 noninterest income up 8% from
prior quarter and 2% from prior year
•
Relationship Rewards program
enrollment continues to grow
3Q11*
2Q12
Unengaged Client
Engaged Client
•
Results in deeper, more profitable engaged clients |
 Corporate Bank: Deepening Relationships
Note:
New client relationships have YTD revenue exceeding $5,000
Leveraging product breadth, industry focus, distinctive knowledge and
capabilities
•
Results in client acquisition and broadened relationships
•
$37MM in YTD revenue from new
client relationships
•
New corporate and investment
banking and real estate capital
clients have average YTD revenue
of $300K
•
Our targeted new clients provide
more fee income, borrow more and
have a better risk profile than our
overall portfolio average
•
$54MM in YTD revenue from
enhanced client relationships, an
average of $497K per client
Performance Metrics
18
36
91
118
167
224
284
0
60
120
180
240
300
Jan-12
Feb-12
Mar-12
Apr-12
May-12
Jun-12
3
10
25
55
82
109
0
25
50
75
100
125
Jan-12
Feb-12
Mar-12
Apr-12
May-12
Jun-12
Expanded client relationships require YTD revenue to exceed FY11 revenue by more than $100,000
|
 19
$17.4
$17.5
$18.4
$18.5
$19.0
2.89%
3.01%
3.07%
3.15%
3.20%
$0
$5
$10
$15
$20
$25
2Q11
3Q11
4Q11
1Q12
2Q12
0.00%
1.00%
2.00%
3.00%
4.00%
5.00%
Average Total Investment Securities
Highlights
Average AFS securities
$ in billions
High Quality Investment Portfolio
Portfolio composed of Agency or GSE backed:
GNMA, Fannie & Freddie
–
No private label MBS or financial paper
Average portfolio life at 6/30/12: 2.3 years
Unrealized net gain of $437 million on available-
for-sale securities portfolio at 6/30/12
Mortgage paydowns of $1.5 billion in both 2Q12
and 1Q12
Securities to Total Assets
(a)
(a) Includes end of period held-to-maturity and
available-for-sale securities 20.3%
20.2%
21.1%
21.0%
20.4%
0%
5%
10%
15%
20%
25%
2Q11
3Q11
4Q11
1Q12
2Q12
Average yield
Average HTM securities |
 20
N/M = Not Meaningful
(a)
Net loan charge-off amounts are annualized in calculation. NCO ratios for
discontinued operations and consolidated Key exclude education loans in the
securitization trusts since valued at fair-market value (b)
6-30-12 allowance by portfolio is estimated. Allowance/period loans ratios
for discontinued operations and consolidated Key exclude education loans in
the securitization trusts since valued at fair-market value Credit
Quality Credit Quality by Portfolio
$ in millions
Allowance /
period-end
loans
(b)
Allowance /
NPLs
Net loan
charge-offs
Net loan
charge-offs
(a)
/
average loans
Nonperforming
loans
Ending
allowance
(b)
Period-end
loans
Average
loans
6/30/12
2Q12
2Q12
1Q12
2Q12
1Q12
6/30/12
3/31/12
6/30/12
6/30/12
6/30/12
Allowance /
period-end
loans
(b)
Allowance /
NPLs
Net loan
charge-offs
Net loan
charge-offs
(a)
/
average loans
Nonperforming
loans
Ending
allowance
(b)
Commercial, financial and agricultural
$20,386
$20,132
$3
$15
.06
%
.31
%
$141
$168
$304
1.49
%
215.60
%
Commercial real estate:
Commercial mortgage
7,409
7,613
9
21
.48
1.06
172
175
250
3.37
145.35
Construction
1,172
1,216
4
10
1.32
3.13
68
66
55
4.69
80.88
Commercial lease financing
5,636
5,700
10
-
.71
-
18
22
68
1.21
377.78
Real estate - residential mortgage
2,016
1,990
6
5
1.21
1.03
78
82
26
1.29
33.33
Home equity:
Key Community Bank
9,601
9,359
21
23
.90
1.01
141
109
80
.83
56.74
Other
479
493
7
7
5.71
5.40
17
12
24
5.01
141.18
Consumer other— Key Community Bank
1,263
1,247
8
9
2.58
3.03
2
1
34
2.69
N/M
Consumer other:
Marine
1,542
1,596
7
10
1.76
2.35
19
30
47
3.05
247.37
Other
101
100
2
1
8.04
3.41
1
1
-
-
N/M
Continuing total
$49,605
$49,446
$77
$101
.63
%
.82
%
$657
$666
$888
1.79
%
135.16
%
Discontinued operations - education
lending business
5,483
5,613
12
19
1.64
2.51
18
19
79
2.72
438.89
Consolidated total
$55,088
$55,059
$89
$120
.68
%
.92
%
$675
$685
$967
1.84
%
143.26
% |
 Vintage (% of Loans)
Loan Balances
Average Loan
Size ($)
Average
FICO
Average
LTV
% of Loans
LTV>90%
2011 and
later
2010
2009
2008
2007 and
prior
Home equity loans and lines
First lien
21
$
23,012
$
745
33
%
.4
%
-
-
-
2
%
98
%
Second lien
458
24,321
730
82
32.4
-
-
-
2
98
Total home equity loans and lines
479
$
24,260
$
731
80
31.0
-
-
-
1
99
Nonaccrual loans
First lien
1
$
19,377
$
730
29
%
-
-
-
-
-
100
%
Second lien
16
27,016
706
84
37.2
%
-
-
-
1
%
99
Total home equity nonaccrual loans
17
$
26,598
$
706
82
35.7
-
-
-
1
99
Exit Portfolio - Home Equity
Second quarter net charge-offs
7
$
-
-
-
1
%
99
%
Net loan charge-offs to average loans
5.71
%
21
(a)
Average LTVs are at origination. Current average LTVs for Community Bank total
home equity loans and lines is approximately 79%, which compares to 81% at
the end of the first quarter 2012. Community Bank –
Home Equity
Exit Portfolio –
Home Equity
$ in millions, except average loan size
$ in millions, except average loan size
(a)
(a)
Home Equity Loans –
6/30/12
Vintage (% of Loans)
Loan Balances
Average Loan
Size ($)
Average
FICO
Average
LTV
% of Loans
LTV>90%
2011 and
later
2010
2009
2008
2007 and
prior
Home equity loans and lines
First lien
5,220
$
62,244
$
756
67
%
.6
%
25
%
7
%
7
%
10
%
51
%
Second lien
4,381
46,995
754
75
3.1
16
6
6
17
55
Total home equity loans and lines
9,601
$
54,217
$
755
71
1.8
21
6
7
13
53
Nonaccrual loans
First lien
66
$
65,339
$
719
72
%
1.1
%
1
%
3
%
6
%
5
%
85
%
Second lien
75
50,767
713
78
3.1
1
1
2
17
79
Total home equity nonaccrual loans
141
$
56,728
$
716
75
1.9
1
2
4
10
83
Community Bank - Home Equity
Second quarter net charge-offs
21
$
1
%
1
%
3
%
22
%
73
%
Net loan charge-offs to average loans
.90
% |
 22
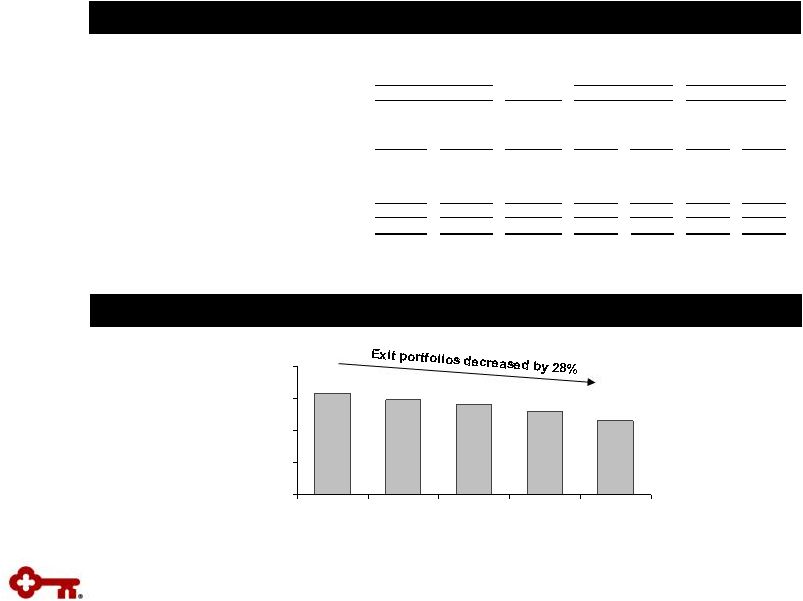
Exit Loan Portfolio Trend (Excluding Discontinued Operations)
Exit Loan Portfolio
$ in millions
(a)
Includes (1) the business aviation, commercial vehicle, office products,
construction and industrial leases; (2) Canadian lease financing
portfolios; and (3) all remaining balances related to lease in, lease out; sale
in, lease out; service contract leases; and qualified technological
equipment leases
(b)
Includes loans in Key’s consolidated education loan securitization
trusts (c)
Credit amounts indicate recoveries exceeded charge-offs
$ in millions
Exit Loan Portfolio
$3,431
$3,899
$4,217
$4,435
$4,736
$0
$1,500
$3,000
$4,500
$6,000
2Q11
3Q11
4Q11
1Q12
2Q12
Change
6-30-12 vs.
6-30-12
3-31-12
3-31-12
2Q12
1Q12
(c)
6-30-12
3-31-12
Residential properties –
homebuilder
$33
$34
$(1)
-
$2
$14
$17
Marine and RV floor plan
39
59
(20)
$2
7
15
32
Commercial lease financing
(a)
1,237
1,534
(297)
1
(1)
9
11
Total commercial loans
1,309
1,627
(318)
3
8
38
60
Home equity –
Other
479
507
(28)
7
7
17
12
Marine
1,542
1,654
(112)
7
10
19
31
RV and other consumer
101
111
(10)
2
1
1
-
Total consumer loans
2,122
2,272
(150)
16
18
37
43
Total exit loans in loan portfolio
$3,431
$3,899
$(468)
$19
$26
$75
$103
Discontinued operations -
education
lending business (not included in exit loans above)
(b)
$5,483
$5,715
$(232)
$12
$19
$18
$19
Balance on
Nonperforming
Status
Balance
Outstanding
Charge-offs
Net Loan |
 23
Credit Quality Trends
Quarterly Change in Criticized Outstandings
(a)
Delinquencies to Period-end Total Loans
(a)
Loan and Lease Outstandings
30 –
89 days delinquent
90+ days delinquent
(14.4)%
(6.8)%
(13.6)%
(10.2)%
(12.3)%
(11.2)%
(16.7)%
(14.3)%
(12.8)%
(1.0)%
(8.1)%
(2.0)%
2.8%
-20%
-15%
-10%
-5%
0%
5%
2Q09
3Q09
4Q09
1Q10
2Q10
3Q10
4Q10
1Q11
2Q11
3Q11
4Q11
1Q12
2Q12 |
 GAAP
to Non-GAAP Reconciliation $ in millions
24
(a)
Includes net unrealized gains or losses on securities available for sale (except for net unrealized
losses on marketable equity securities), net gains or losses on cash flow hedges, and amounts
resulting from the December 31, 2006, adoption and subsequent application of the applicable accounting guidance for
defined benefit and other postretirement plans.
(b)
Other assets deducted from Tier 1 capital and net risk-weighted assets consist of disallowed
deferred tax assets of $75 million at June 30, 2011, disallowed intangible assets (excluding
goodwill) and deductible portions of nonfinancial equity investments. There were no disallowed deferred tax assets at June 30,
2012 and March 31, 2012.
(c)
6-30-12 amount is estimated. |
 (3) Includes
AFS mark-to-market, cash flow hedges on items recognized at fair value on the balance sheet, and defined
benefit pension liability.
(2) 6-30-12 capital information is estimated.
(4) Deferred tax asset subject to future taxable income for realization, primarily tax credit
carryforwards. (1) Tier 1 common equity is a non-generally accepted accounting
principle (GAAP) financial measure that is used by investors, analysis and bank regulatory
agencies to assess the capital position of financial services companies. Management
reviews Tier 1 common equity along with other measures of capital as part of its financial analyses.
(5) The amount of regulatory capital and risk-weighted assets estimated under Basel III (as fully
phased-in on January 1, 2019) is based upon the federal banking agencies' notices of
proposed rulemaking, which implement Basel III and the Standardized Approach.
Tier 1 Common Equity under Basel III (estimated)
KeyCorp & Subsidiaries
25
TIER 1 COMMON EQUITY UNDER BASEL III (ESTIMATES)
(1)
Quarter ended
June 30,
($ in billions)
2012
(2)
Tier 1 Common Equity under Basel I
$9.0
Adjustments from Basel I to Basel III:
(0.1)
(0.1)
$8.8
Total risk-weighted assets under Basel I
$77.0
Adjustments from Basel I to Basel III:
Market Risk Impact
0.6
Loan Commitments < 1 Year
1.1
Residential Mortgage Loans & Home Equity
1.7
Other
0.7
Total risk-weighted assets under Basel III
81.1
Tier 1 common equity to total risk-weighted assets
anticipated under Basel III
10.9%
Deferred Tax Assets
(4)
Cumulative Other Comprehensive Income
(3)
Tier 1 common equity anticipated under Basel III
(5) |