Attached files
| file | filename |
|---|---|
| EX-99.1 - EXHIBIT 99.1 - TECHPRECISION CORP | ex99-1.htm |
| 8-K - TECHPRECISION CORPORATION FORM 8-K - TECHPRECISION CORP | tcps8k.htm |

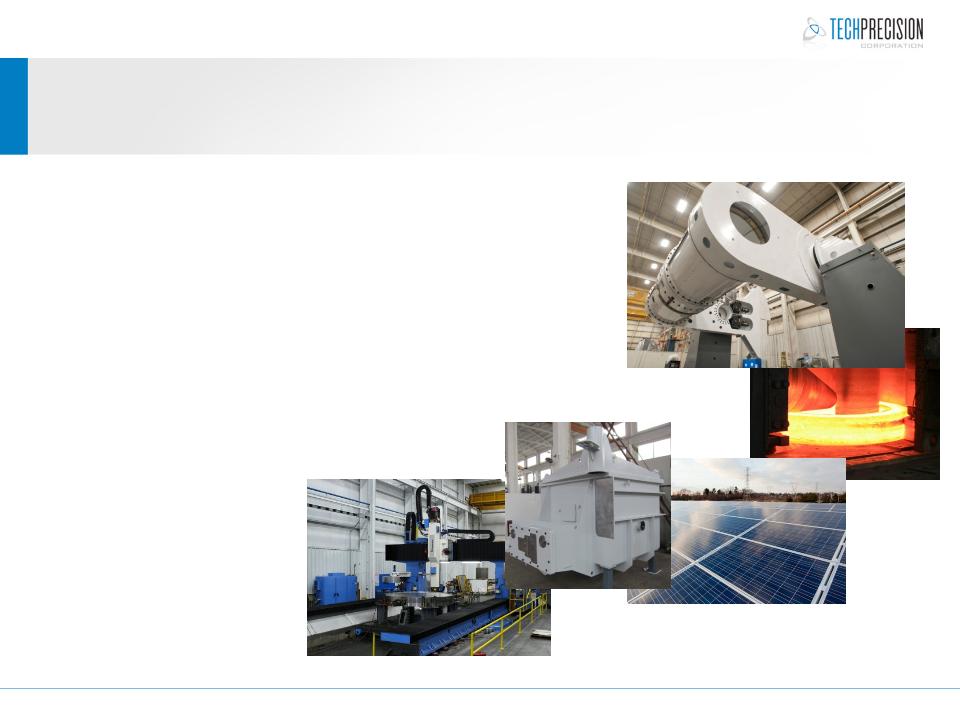
Q4 FY12 Shareholder Conference Call
July 16, 2012
© 2012. All rights reserved.

© 2012. All rights reserved.
2
Safe Harbor Statement
Safe Harbor Statement Under the Private Securities Litigation Reform Act of 1995: Any
statements set forth in this presentation that are not historical facts are forward-looking
statements that involve risks and uncertainties that could cause actual results to differ materially
from those in the forward-looking statements, which may include, but are not limited to, such
factors as unanticipated changes in product demand, increased competition, downturns in the
economy, failure to comply with specific regulations pertaining to government projects,
fluctuation of revenue due to the nature of project lifecycles, and other information detailed
from time to time in the Company filings and future filings with the United States Securities and
Exchange Commission. The forward-looking statements contained in this presentation are made
only of this date, and the Company is under no obligation to revise or update these forward-
looking statements.
Agenda
© 2012. All rights reserved.
3
• Q4 Overview
• Q4 and FY 2012 Financial Detail
• Ranor Challenges and Responses
• Product Diversification
• FY13 Outlook
Q4 Income Statement
|
Consolidated Income
Statement ($ in Millions except
Shares & EPS) |
Q4 2012
|
Q4 2011
|
FY 2012
|
FY 2011
|
|
Revenues
|
$6.1
|
$8.1
|
$33.3
|
$32.3
|
|
Gross Margin
|
0.03%
|
26.7%
|
15.3%
|
30.7%
|
|
Operating Income (loss)
|
$(2.8)
|
$0.4
|
$(3.4)
|
$4.7
|
|
Net Income (loss)
|
$(1.3)
|
$0.2
|
$(2.1)
|
$2.7
|
|
EPS - Diluted
|
$(0.07)
|
$0.00
|
$(0.13)
|
$0.12
|
4
© 2012. All rights reserved.
4
• Legacy pricing and
operational issues at
Ranor with prototypes
or first-article products
contributed to lower
top line revenue and
bottom-line loss
operational issues at
Ranor with prototypes
or first-article products
contributed to lower
top line revenue and
bottom-line loss
• China ramp progressing;
particularly in the
Sapphire market sector
particularly in the
Sapphire market sector
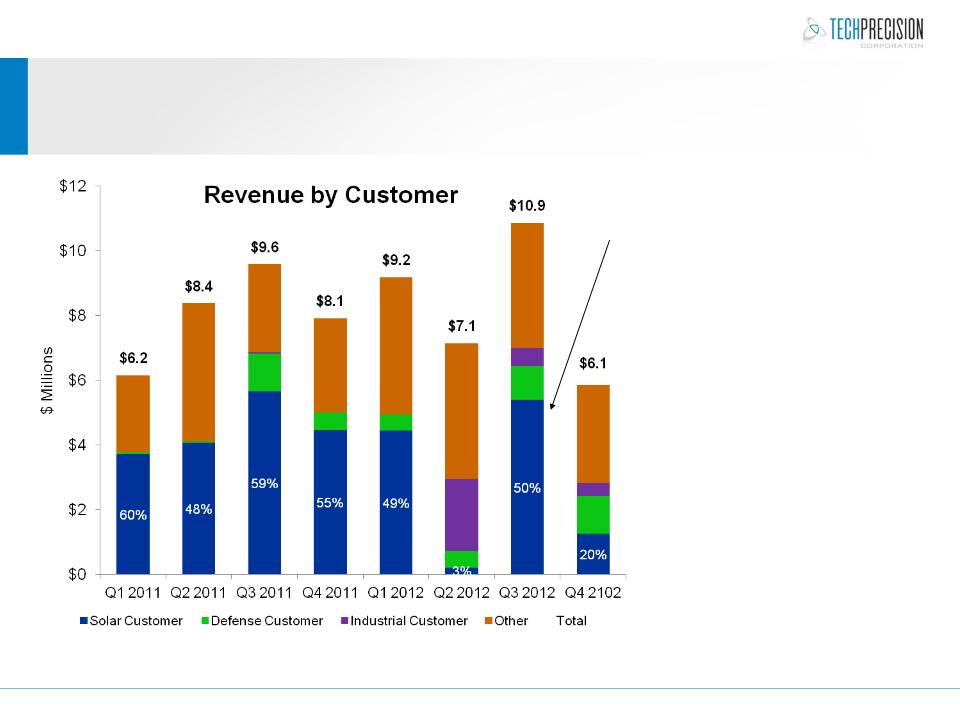
Revenue Distribution
© 2012. All rights reserved.
5
Solar Production
from Q2
recognized in Q3
from Q2
recognized in Q3
• Solar equipment revenues
decreased from ~50% to 20%
of total business
decreased from ~50% to 20%
of total business
• WCMC division revenue was
$4.6-million from Solar
Customer(s) from 9-months of
volume production in fiscal
2012
$4.6-million from Solar
Customer(s) from 9-months of
volume production in fiscal
2012
• Ranor division missed its
internal revenue plan by ~$5-
million
internal revenue plan by ~$5-
million
• For FY2013; growth will be in
Medical, Defense, Nuclear and
Sapphire
Medical, Defense, Nuclear and
Sapphire
• Medical and Sapphire expected
to be the largest year-on-year
growth sectors (% basis)
to be the largest year-on-year
growth sectors (% basis)
Q4 Income Statement
|
Consolidated Income Statement
($ in Millions except Shares & EPS)
|
Q4 2012
|
Q4 2011
|
FY 2012
|
FY 2011
|
|
Revenues
|
$6.1
|
$8.1
|
$33.3
|
$32.3
|
|
Gross Profit
|
$0.002
|
$2.2
|
$5.1
|
$9.9
|
|
Gross Margin
|
0.03%
|
26.7%
|
15.3%
|
30.7%
|
|
Operating Expenses
|
$2.8
|
$1.8
|
$8.5
|
$5.2
|
|
Operating (Loss) Income
|
$(2.8)
|
$0.4
|
$(3.4)
|
$4.7
|
|
Operating Margin
|
(45.9%)
|
5.0%
|
(10.2%)
|
14.7%
|
|
Net (Loss) Income
|
$(1.3)
|
$0.2
|
$(2.0)
|
$2.7
|
|
Net Margin
|
(21.3%)
|
2.5%
|
(6.0%)
|
8.3%
|
|
Weighted Average Shares - Basic
|
17.8
|
15.0
|
16.7
|
14.5
|
|
EPS - Diluted
|
$(0.07)
|
$0.00
|
$(0.11)
|
$0.12
|
6
© 2012. All rights reserved.
6
Balance Sheet Highlights
© 2010. All rights reserved.
7
|
($ in Millions)
|
March 31, 2012
|
March 31, 2011
|
|
Cash
|
2.8
|
7.5
|
|
Current Assets
|
16.3
|
17.7
|
|
Total Assets
|
24.0
|
22.9
|
|
Current Liabilities
|
6.1
|
4.1
|
|
Total Liabilities
|
11.9
|
9.3
|
|
Total Stockholders’ Equity
|
12.2
|
13.9
|
|
Long-Term Debt
|
March 31, 2012
|
|
Term Note
|
571,429
|
|
Series A & B Bonds
|
5,627,082
|
|
Capex Debt/Capital Lease
|
936,716
|
|
Total Long-Term Debt
|
7,135,227
|
Ranor Challenges and Transition
Moving the Ranor division from dominant single customer and repetitious
“production environment” of the previous 5+ years to larger-scale prototypes
which will evolve to volume products in Medical, Nuclear and Defense sectors
“production environment” of the previous 5+ years to larger-scale prototypes
which will evolve to volume products in Medical, Nuclear and Defense sectors
Bob Francis was hired to lead Ranor through the challenges and has
established a new senior management team to support the transition
established a new senior management team to support the transition
© 2012. All rights reserved.
8
Cultural improvements:
empowerment, teamwork,
accountability for all
management levels
empowerment, teamwork,
accountability for all
management levels
Improve and enhance ERP
systems, reporting
functionalities and information
gathering capabilities
systems, reporting
functionalities and information
gathering capabilities
Maintain and enhance quality
and on-time shipments:
Delight our customers
and on-time shipments:
Delight our customers
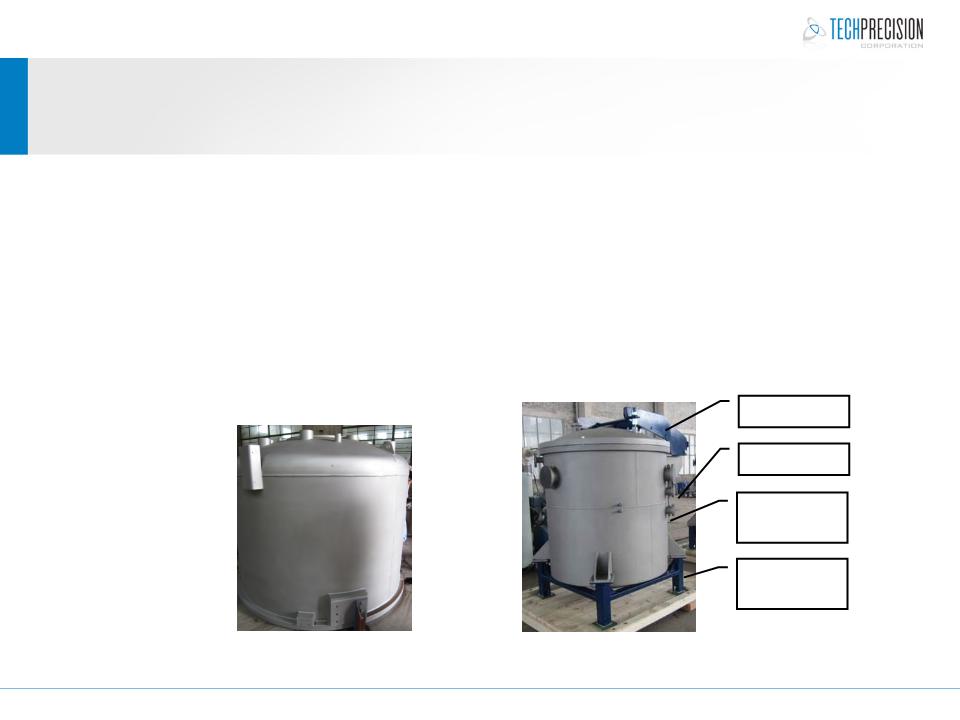
Product Solution Strategy
© 2012. All rights reserved.
9
• Historically the Company produced piece-part (highly competitive/less value-add to
customers) vs. product solutions (less competitive/more value-add to customers)
customers) vs. product solutions (less competitive/more value-add to customers)
• Product Solution involves supplying the manufacturing engineering, large-parts,
small parts (mechanical and electrical) in a complete/tested solution
small parts (mechanical and electrical) in a complete/tested solution
• Example: solar furnace “piece-part” vs. sapphire furnace “product solution”
Electro/Mechanical
Actuation Cylinder
Assembled and
Tested Assembly
Tested Assembly
Small Value-add
Parts (Completed
Assembly)
Parts (Completed
Assembly)
Support and Install
Frame (Completed
Assembly)
Frame (Completed
Assembly)
Sapphire Furnace
“Product Solution”
Solar Furnace
“Piece Part”
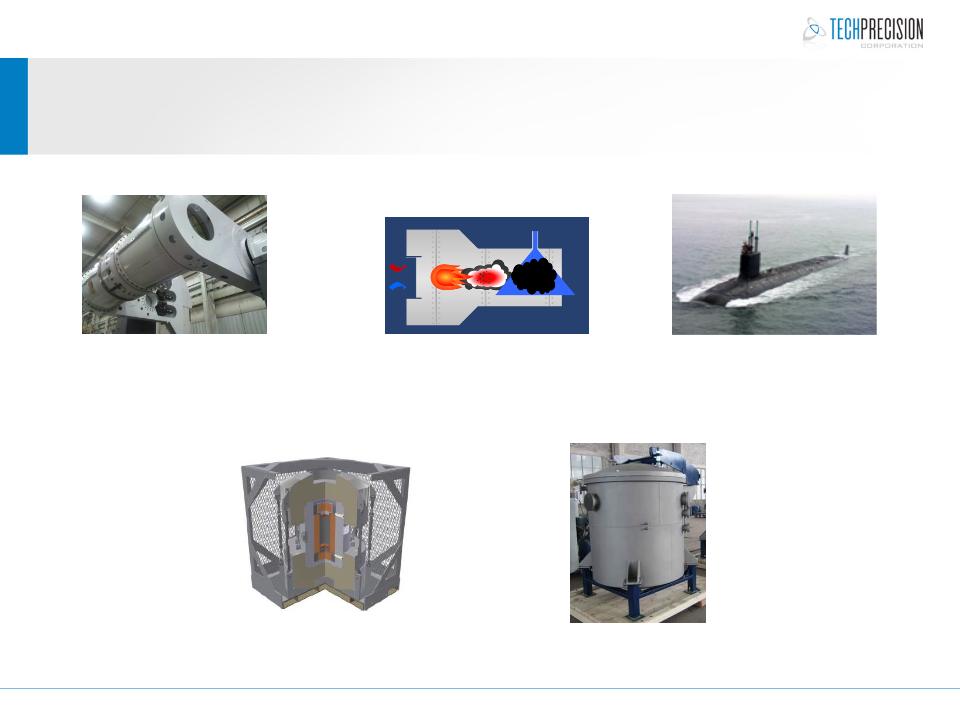
Strategic Production Solutions for Profitable Growth
© 2012. All rights reserved.
10
NRC approved Nuclear Isotope and
Fissile (pending) Transport Casks
Fissile (pending) Transport Casks
S250 Proton Beam
Cancer Treatment
(510k clearance)
Carbon Black
Furnaces
GDEB/BAE: Multiple
Confidential Virginia Class
Product Assemblies
Confidential Virginia Class
Product Assemblies
Sapphire Furnaces
FY2013 Customer and Sector Pipeline
© 2012. All rights reserved.
11
Alternative Energy:
Sapphire Pipeline: $6 - $12M
Solar Pipeline: $5 - $8M
Nuclear: $7 - $12M
Defense and Aerospace: $10 - $14M
Medical: $8 - $10M
Commercial Industrial: $3 - $6M
Current Backlog
(July 13th) $28.9-million
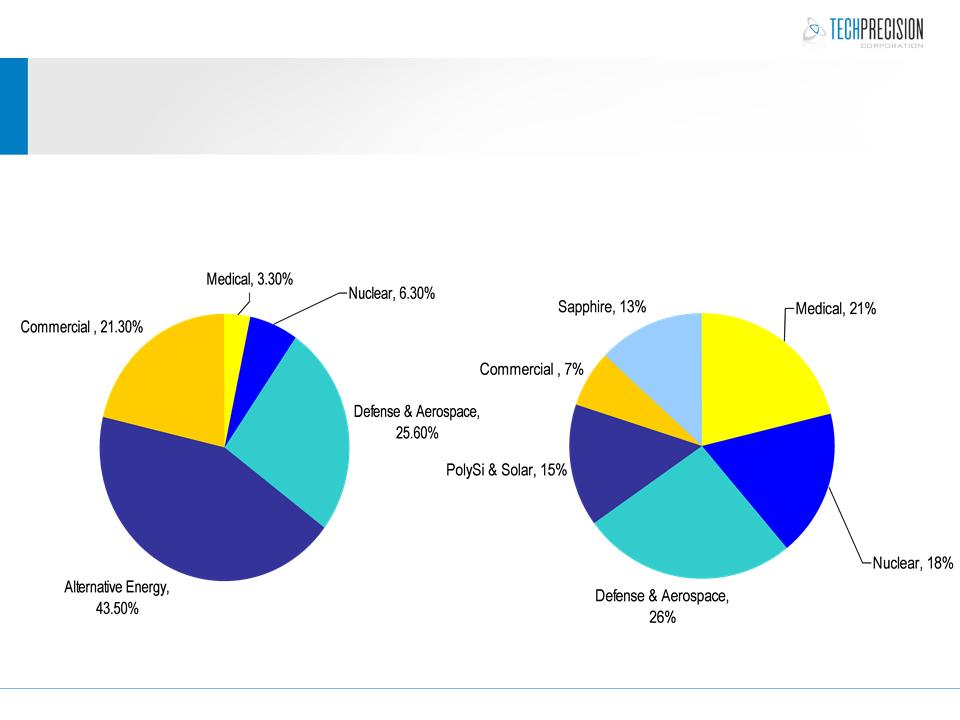
Served Markets: “Achieving Balance” in FY2013
12
© 2012. All rights reserved.
FY2012: Single Product
Dependence and Risk
Dependence and Risk
FY2013 Outlook:
Balance with Multiple Volume
Products
Products

www.TechPrecision.com
www.ranor.com
www.wcmcsolutions.com