Attached files
| file | filename |
|---|---|
| 8-K - FORM 8-K - Matson, Inc. | form8kabh.htm |
1
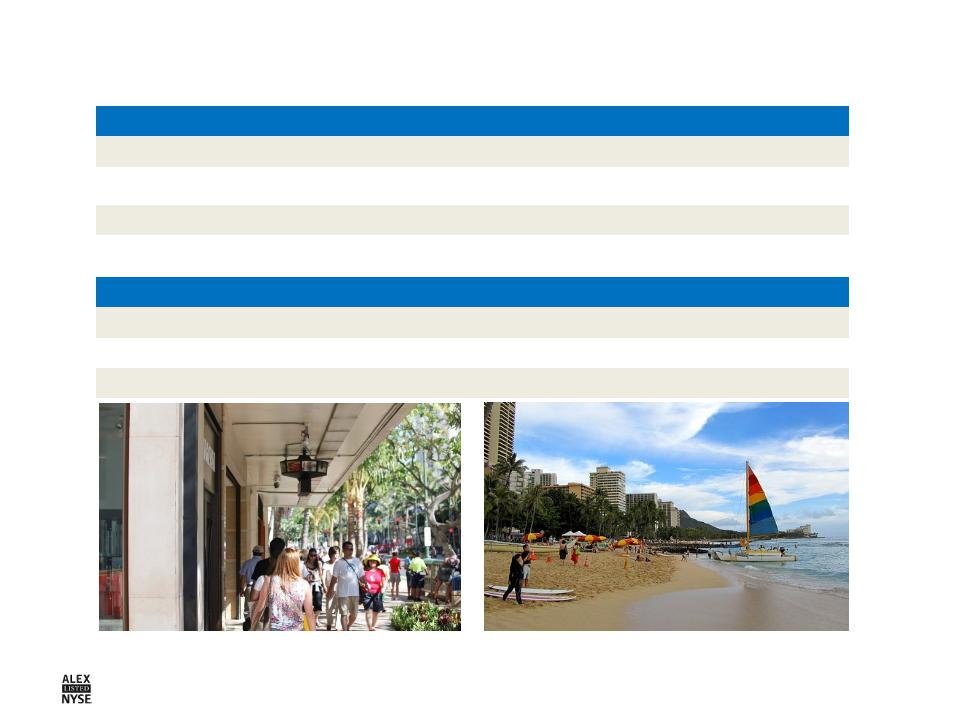
A&B: A Premier Hawaii Real Estate & Land Company ● June 18-22, 2012
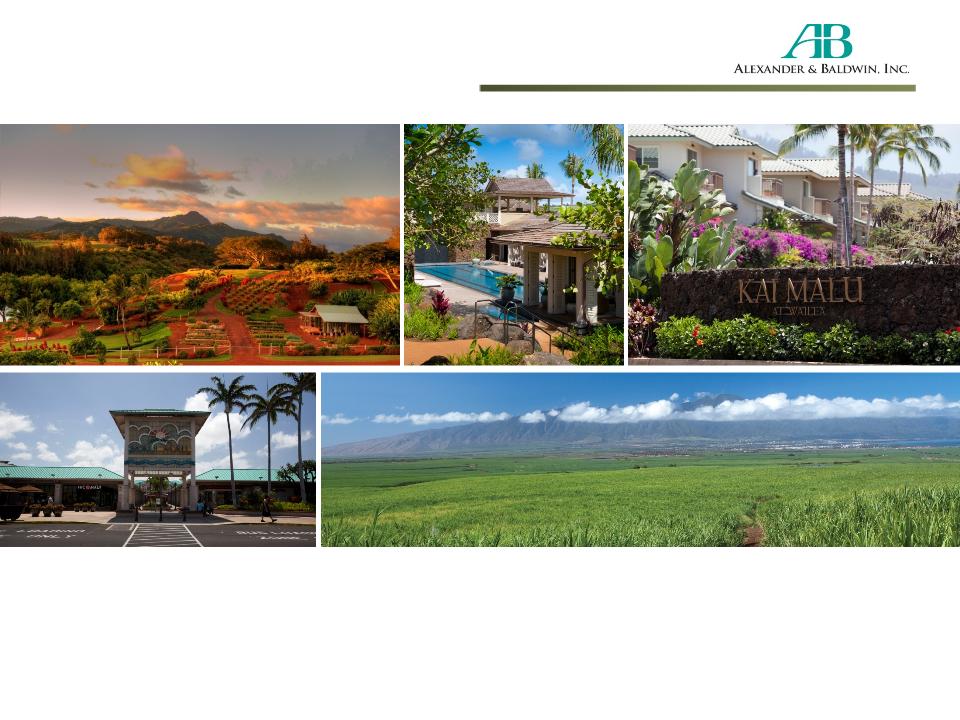
A&B: A Premier Hawaii Real Estate & Land Company
June 18-22, 2012
2
A&B: A Premier Hawaii Real Estate & Land Company ● June 18-22, 2012
Statements in this presentation that set forth
expectations or predictions are based on
facts and situations that are known to us as
of June 18, 2012.
expectations or predictions are based on
facts and situations that are known to us as
of June 18, 2012.
Actual results may differ materially, due to
risks and uncertainties, such as those
described on pages 20-39 of A & B II, Inc.’s
Form 10 and our other subsequent filings
with the SEC. Statements in this
presentation are not guarantees of future
performance. We do not undertake any
obligation to update our forward-looking
statements.
risks and uncertainties, such as those
described on pages 20-39 of A & B II, Inc.’s
Form 10 and our other subsequent filings
with the SEC. Statements in this
presentation are not guarantees of future
performance. We do not undertake any
obligation to update our forward-looking
statements.
Forward-Looking Statements
3
A&B: A Premier Hawaii Real Estate & Land Company ● June 18-22, 2012
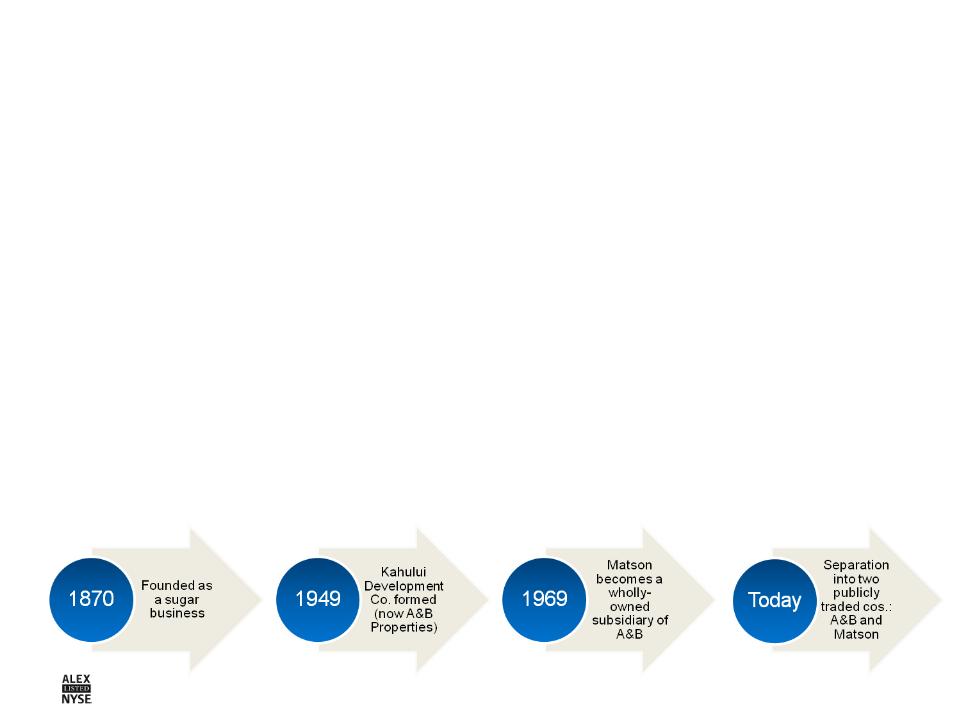
Alexander & Baldwin Overview and Evolution
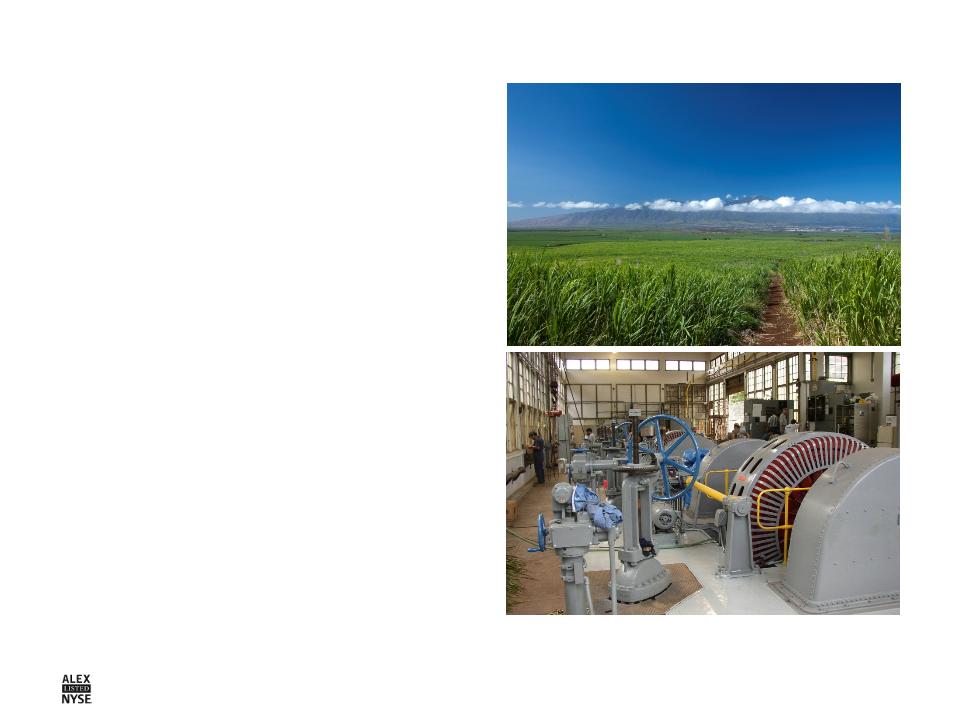
§ Agribusiness (Hawaiian Commercial & Sugar Co.)
– 12 acres on Maui eventually led to 3 sugar plantations, 130,000 acres
– Foundation for our real estate & shipping businesses
– Today: State’s largest farmer, only remaining sugar plantation
§ Real Estate (A&B Properties)
– Development of master-planned community on Maui for sugar workers
– Entitlement & development of other non-sugar lands
– Land sales led to 1031 acquisition of Mainland commercial properties
– Today: State’s most active real estate investor
§ Shipping (Matson)
– Transportation of raw sugar to West Coast refinery
– A wholly owned subsidiary in 1969
– Today: Primary carrier to Hawaii & Guam, weekly service to China & nationwide
provider of logistics services
provider of logistics services

4
A&B: A Premier Hawaii Real Estate & Land Company ● June 18-22, 2012
Key Milestones
Completed
Completed
Separation Approved on June 8, 2012
§ Received IRS letter ruling on tax-free nature of spin off
§ Form 10 declared effective by the SEC
§ Post-separation financing in place
§ Merger and reorganization completed
Important
Dates
Dates
§ Record: Monday, June 18, 2012, 5:00PM EDT
§ Distribution: Friday, June 29, 2012, 4:00PM EDT
§ First day of “regular way” trading for A&B (NYSE: ALEX)
and Matson (NYSE: MATX): Monday, July 2, 2012
and Matson (NYSE: MATX): Monday, July 2, 2012
Three-Way
Trading
Information
Trading
Information
§ June 14 through the distribution date
§ A&B Holdings, Inc. stock trading “regular way” until the
distribution date under the symbol “ALEX”
distribution date under the symbol “ALEX”
§ Matson ex-distribution trading under the symbol “MATX WI”
§ New A&B stock when issued trading under the symbol
“ALEX WI”
“ALEX WI”

5
A&B: A Premier Hawaii Real Estate & Land Company ● June 18-22, 2012
Unique assets
& competitive
strengths
& competitive
strengths
The “New A&B”
Tangible
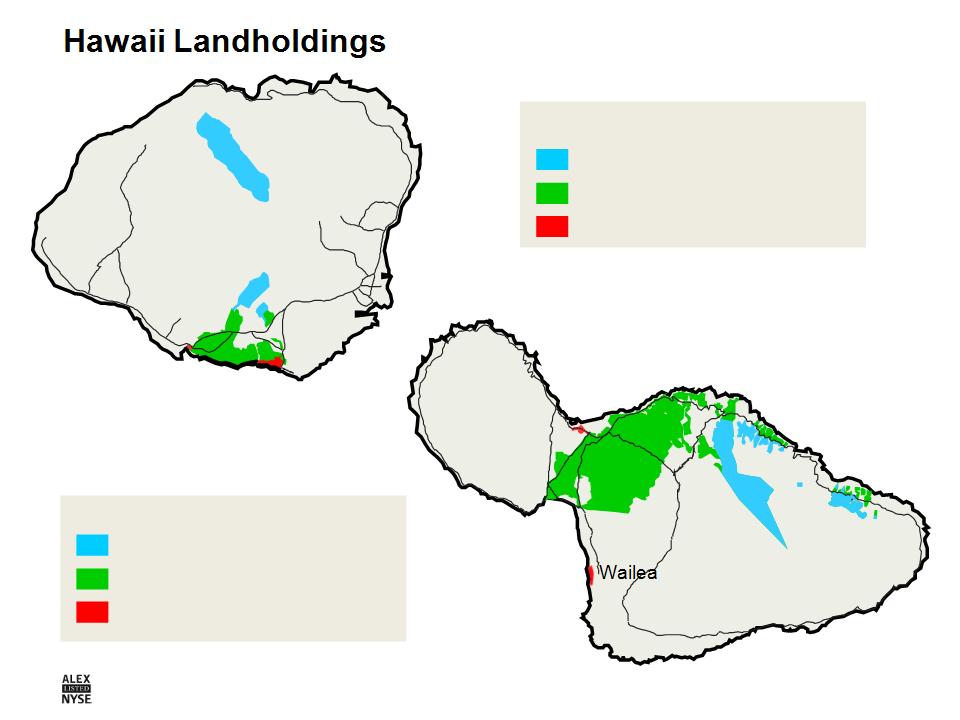
§ 88,000 acres primarily on Maui and Kauai
§ 7.9 million square feet of high-quality commercial properties in
Hawaii & Mainland
Hawaii & Mainland
§ Robust Hawaii development pipeline (fully entitled) of over
3,500 residential and commercial units
3,500 residential and commercial units
§ 36,000-acre sugar plantation - a future energy business
§ Strong balance sheet & ample debt capacity
Intangible
§ A staff with deep experience, network & understanding of Hawaii
§ Reputation for integrity, performance & commitment to the community
§ Disciplined underwriting & investment
Track record of success
Attractive “Hawaii Play”: well positioned to capitalize on Hawaii upside
A PREMIER HAWAII REAL ESTATE & LAND COMPANY

6
A&B: A Premier Hawaii Real Estate & Land Company ● June 18-22, 2012
How Our Land Businesses Fit Together
7
A&B: A Premier Hawaii Real Estate & Land Company ● June 18-22, 2012
Real Estate Development & Investment Strategy
§ Focus on entitlement and
development of core
Hawaii lands
development of core
Hawaii lands
§ Invest in high-returning real
estate opportunities in Hawaii
estate opportunities in Hawaii
– Diversify to new markets and
asset classes
asset classes
– Leverage market knowledge
and expertise
and expertise
§ Scale and stage development
portfolio to market opportunity
portfolio to market opportunity
– Ready inventory to meet
market demand
market demand
§ Utilize strategic joint ventures

8
A&B: A Premier Hawaii Real Estate & Land Company ● June 18-22, 2012
Leasing Strategy
§ Active portfolio management
– Maximize cash flow to support
development activities
development activities
– Optimize asset values
§ Reinvest land and commercial
property sales proceeds, on a
tax-advantaged basis, into
commercial property
investments having favorable
growth prospects
property sales proceeds, on a
tax-advantaged basis, into
commercial property
investments having favorable
growth prospects
§ Opportunistic migration of
portfolio to Hawaii over time
portfolio to Hawaii over time
9
A&B: A Premier Hawaii Real Estate & Land Company ● June 18-22, 2012
Land Stewardship Strategy
§ Employ lands at highest
and best use
and best use
§ Identify and pursue
entitlements, developments and
transactions that enhance the
value of raw landholdings
entitlements, developments and
transactions that enhance the
value of raw landholdings
§ Optimize cash flow to cover the
cost of maintaining land and
infrastructure
cost of maintaining land and
infrastructure
§ Target renewable energy
growth for strategically
located land parcels
growth for strategically
located land parcels

10
A&B: A Premier Hawaii Real Estate & Land Company ● June 18-22, 2012
A&B: Investment Thesis
§ Unique assets & competitive strengths
§ Proven track record
§ Embedded growth opportunities in a
development pipeline positioned for market
recovery
development pipeline positioned for market
recovery
§ Hawaii economy at a positive inflection point
§ Healthy balance sheet & liquidity
§ Best public company vehicle for capitalizing
on Hawaii’s upside and creating long-term
shareholder value
on Hawaii’s upside and creating long-term
shareholder value
11
A&B: A Premier Hawaii Real Estate & Land Company ● June 18-22, 2012
Kihei
Kahului
Conservation 15,850 acres
Agriculture 50,831 acres
Urban/Entitled 559 acres
Maui - 67,240 acres
* Includes 961 acres at Kukui’ula joint venture
Conservation 13,320 acres
Agriculture 6,944 acres
Urban/Entitled1,072 acres*
Kauai - 21,366 acres
Lihue
Poipu
Wainiha
Princeville
12
A&B: A Premier Hawaii Real Estate & Land Company ● June 18-22, 2012
|
|
Product
Type
|
Planned units,
lots or sf |
Current
Status
|
2012
|
2013
|
2014 and
Beyond |
|
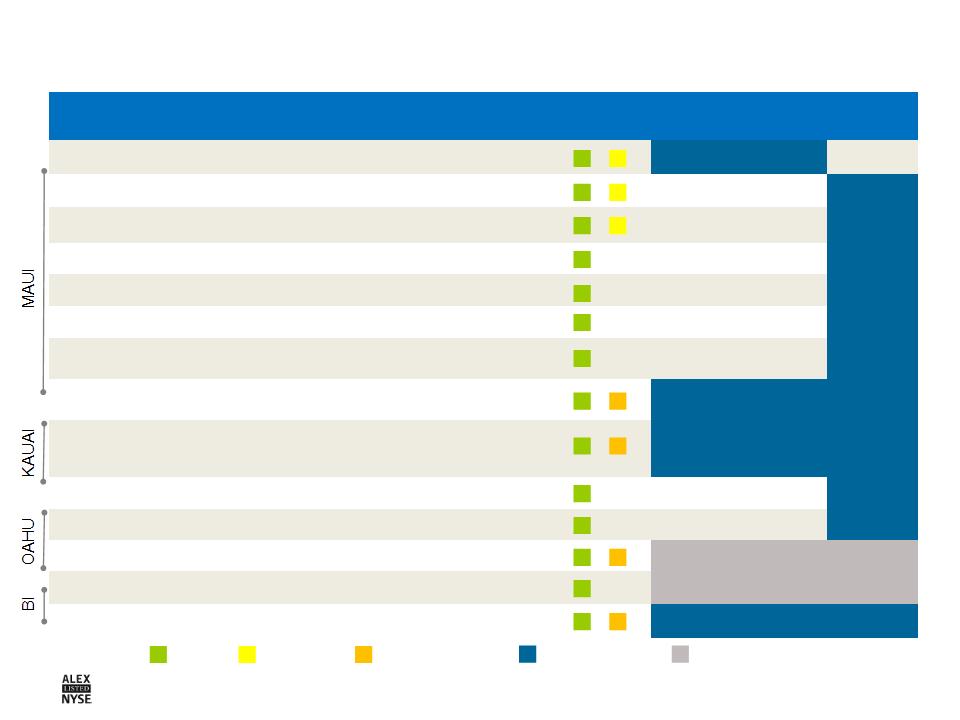
Kai Malu at Wailea
|
Resort Res.
|
150 units
|
|
|
|
|
|
Wailea MF-11
|
Resort Res.
|
12 lots
|
|
|
|
|
|
Wailea MF-19
|
Resort Res.
|
9 lots
|
|
|
|
|
|
Additional Wailea
|
Resort Res.
|
400-600 units
|
|
|
|
|
|
Haliimaile
|
Primary Res.
|
170 lots
|
|
|
|
|
|
Aina ‘O Kane
|
Primary Res.
|
103 units
|
|
|
|
|
|
Kahului Town Center
|
Retail/Primary Res.
|
440 units, 225,000 sf
|
|
|
|
|
|
Maui Business Park II
|
Commercial
|
131 lots on 155
salable acres |
|
|
|
|
|
Kukui’ula
|
Resort Res.
|
up to 1,500 units on
640 saleable acres |
|
|
|
|
|
Brydeswood
|
Primary Res.
|
24 lots
|
|
|
|
|
|
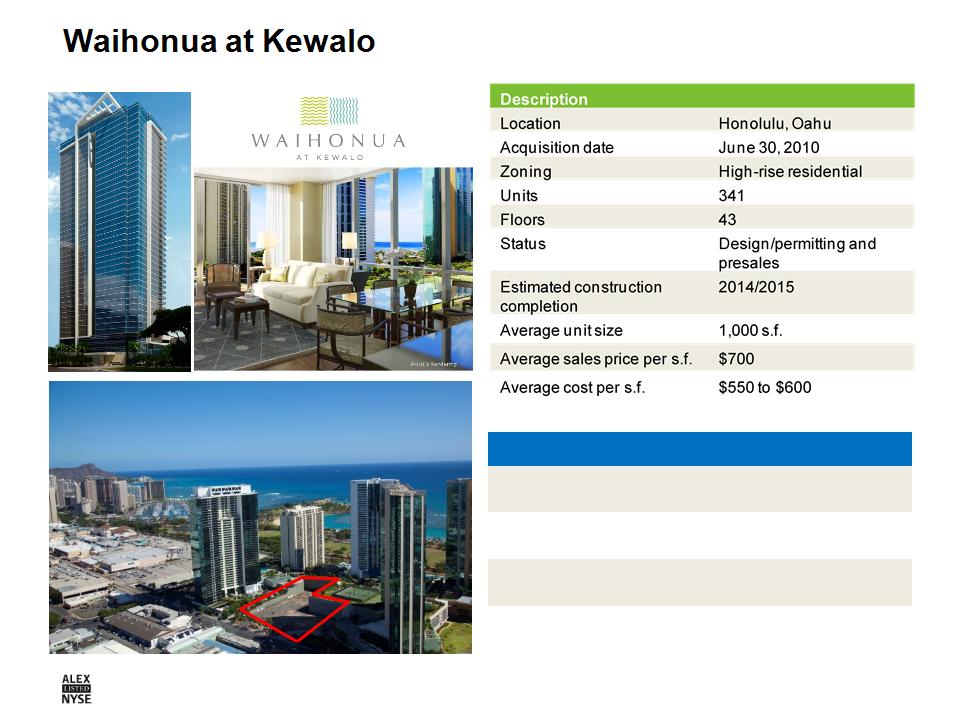
Waihonua
|
Primary Res.
|
341 units
|
|
|
|
|
|
Gateway at Mililani Mauka
|
Retail
|
28,400 sf
|
|
|
|
|
|
Gateway South
|
Office
|
20,000 sf
|
|
|
|
|
|
Ka Milo at Mauna Lani
|
Resort Res.
|
137 units
|
|
|
|
|
Robust Development Pipeline
Entitled
Constructed
Under Construction
Timing of closings
Developing for lease
13
A&B: A Premier Hawaii Real Estate & Land Company ● June 18-22, 2012
* Includes cash NOI of $3.5M from Hawaii unimproved properties and cash NOI from properties sold in 2011
Note: See appendix for statement regarding the Company's use of non-GAAP financial measures and a reconciliaton of GAAP to non-GAAP
measures.
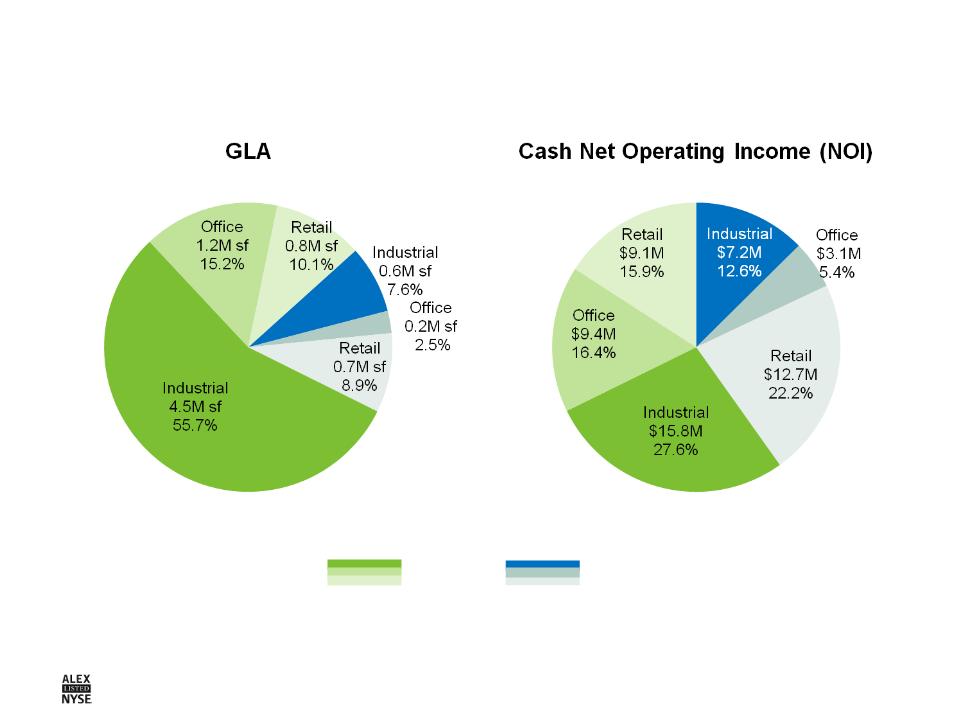
Mainland
Hawaii
7.9M sf
$60.8M*
Diversified Commercial Portfolio
14
A&B: A Premier Hawaii Real Estate & Land Company ● June 18-22, 2012
|
|
|
|
Number of properties
|
21
|
|
Square feet
|
|
|
Industrial
|
565K
|
|
Office
|
170K
|
|
Retail
|
698K
|
|
Total
|
1.4M
|
|
Occupancy
|
91%
|
|
Outstanding debt
|
-
|
|
Portfolio cash NOI (2011)1
|
$23.0M
|
|
Portfolio cash NOI to total
portfolio NOI |
40%
|
|
Cash NOI from Hawaii
ground leases |
$3.5M
|
|
Total Hawaii cash NOI
|
$26.5M
|
Note: See appendix for statement regarding the Company’s use of non-GAAP financial measures and a reconciliation of GAAP to non-GAAP measures
15
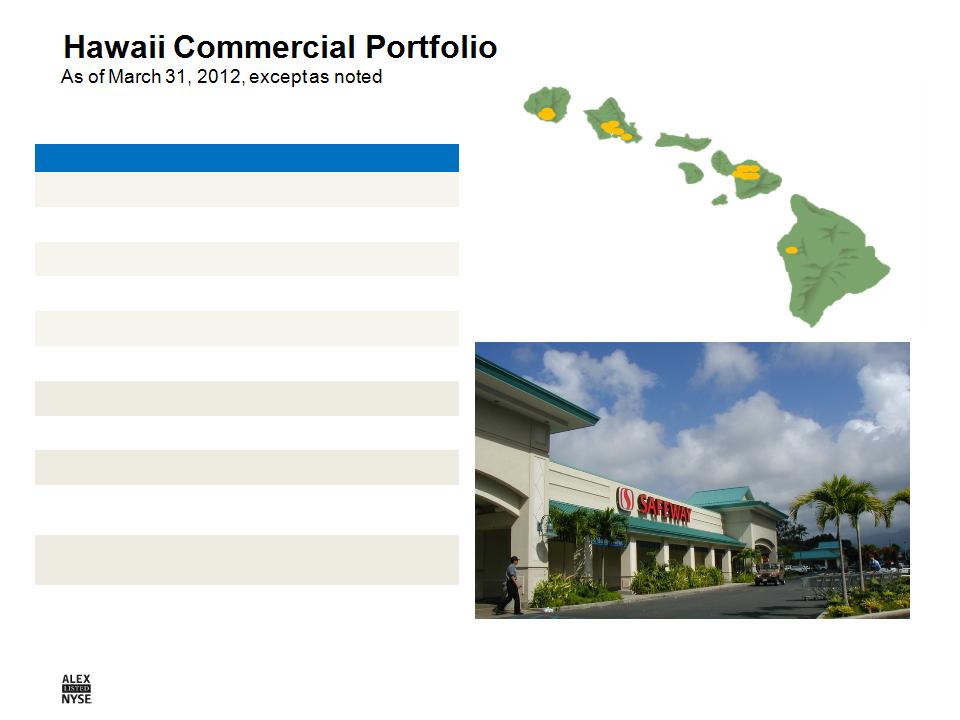
A&B: A Premier Hawaii Real Estate & Land Company ● June 18-22, 2012
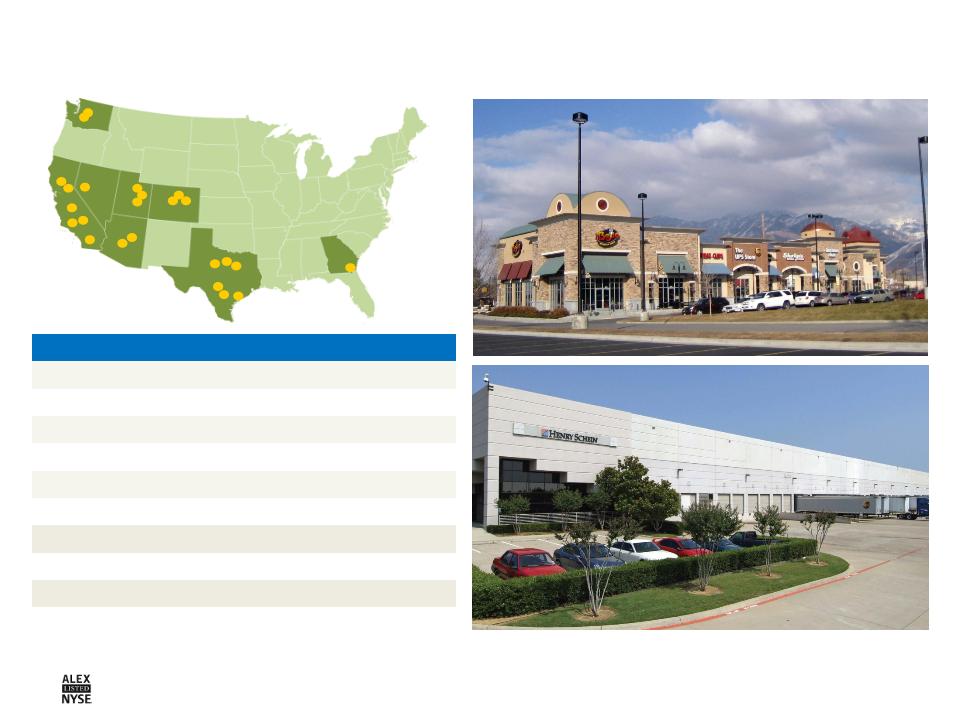
Mainland Commercial Portfolio
As of March 31, 2012, except as noted
As of March 31, 2012, except as noted
|
|
|
|
Number of properties
|
23
|
|
Square feet
|
|
|
Industrial
|
4.5M
|
|
Office
|
1.3M
|
|
Retail
|
0.7M
|
|
Total
|
6.5M
|
|
Occupancy
|
93%
|
|
Outstanding debt
|
$28.2M
|
|
Cash NOI (2011)
|
$34.3M
|
|
Cash NOI to total portfolio
|
60%
|
Note: See appendix for statement regarding the Company’s use of non-GAAP financial measures and a reconciliation of GAAP to non-GAAP measures
16
A&B: A Premier Hawaii Real Estate & Land Company ● June 18-22, 2012
Market Knowledge & Expertise
§ Real estate team with extremely deep and broad acquisition,
development and asset management expertise
development and asset management expertise
§ Competitive advantages when competing with both smaller, local
investors and large Mainland institutional investors for Hawaii deals
investors and large Mainland institutional investors for Hawaii deals
– Local knowledge and expertise that out-of-state investors can’t match
– Financial capacity, expertise and liquidity advantage over
most local investors
most local investors
§ Investment “sweet spot” from $10 million to $50 million, but
look at everything from $2 million to $200 million
look at everything from $2 million to $200 million
|
Colliers Hawaii Year-End 2011 Investment
Market Report |
Local Investors
|
Out-of-State
Investors |
|
Avg. Purchase Price
|
$4.4M
|
$19.2M
|
|
Total Investments
|
$409M
|
$825M
|
|
Purchase Price to Assessed Value
|
74.3%
|
122.3%
|

17
A&B: A Premier Hawaii Real Estate & Land Company ● June 18-22, 2012
A&B: Investment Thesis
§ Unique assets & competitive strengths
§ Proven track record
§ Embedded growth opportunities in a
development pipeline positioned for market
recovery
development pipeline positioned for market
recovery
§ Hawaii economy at a positive inflection point
§ Healthy balance sheet & liquidity
§ Best public company vehicle for capitalizing
on Hawaii’s upside and creating long-term
shareholder value
on Hawaii’s upside and creating long-term
shareholder value
18
A&B: A Premier Hawaii Real Estate & Land Company ● June 18-22, 2012
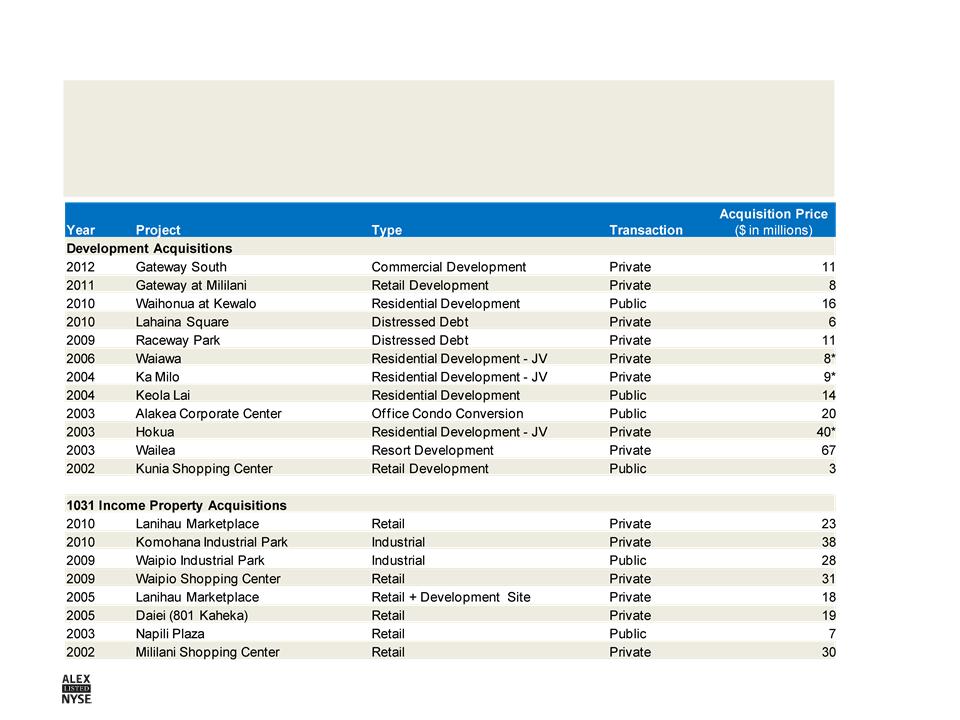
Successful Hawaii Track Record
§ Since 2000, invested $800 million in Hawaii development projects
($420 million completed)
($420 million completed)
§ Returns on completed projects averaged 22%
19
A&B: A Premier Hawaii Real Estate & Land Company ● June 18-22, 2012
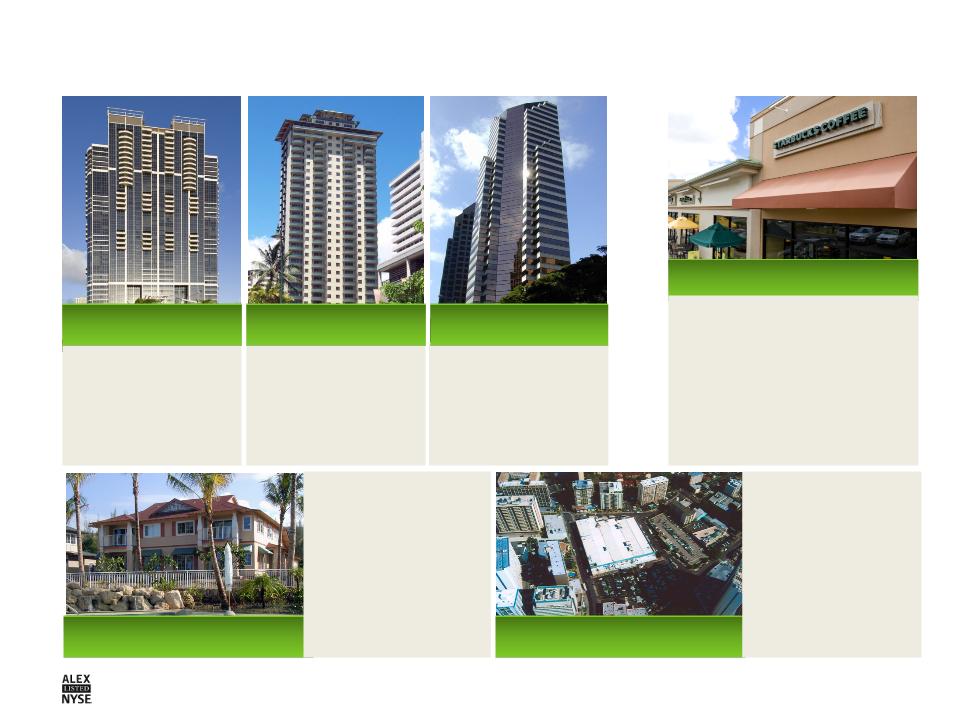
Successful Development Track Record
352-unit high-rise
residential
condominium near
downtown Honolulu.
$224M revenue
generated.
residential
condominium near
downtown Honolulu.
$224M revenue
generated.
100-unit condominium
with surrounding
ocean and mountain
views in Waikiki.
$63M revenue
generated.
with surrounding
ocean and mountain
views in Waikiki.
$63M revenue
generated.
Conversion of office
building into office
condominium. $35M
revenue generated
(including leasing).
building into office
condominium. $35M
revenue generated
(including leasing).
Keola Lai
Lanikea
Alakea Corporate
Tower
Tower
Kai Lani
Partnered with a
prominent local home
builder to develop
116-residential
condominiums in the
Ko Olina Resort. The
project sold out over
14 months, generating
$57M in revenue.
prominent local home
builder to develop
116-residential
condominiums in the
Ko Olina Resort. The
project sold out over
14 months, generating
$57M in revenue.
Daiei (Retail)
Originally acquired
4-acre site for a
potential condo
development.
Opportunistic sale at
market peak for gain
similar to the gain
expected from
development.
4-acre site for a
potential condo
development.
Opportunistic sale at
market peak for gain
similar to the gain
expected from
development.
Kunia Shopping Center
Development of 60,400 s.f.
retail space on 4.6 acres.
Designed to serve the growing
suburban area of Kunia on
Oahu. Held asset in portfolio.
Built to a 13.4% cap rate.
retail space on 4.6 acres.
Designed to serve the growing
suburban area of Kunia on
Oahu. Held asset in portfolio.
Built to a 13.4% cap rate.

20
A&B: A Premier Hawaii Real Estate & Land Company ● June 18-22, 2012
A&B: Investment Thesis
§ Unique assets & competitive strengths
§ Proven track record
§ Embedded growth opportunities in a
development pipeline positioned for
market recovery
development pipeline positioned for
market recovery
§ Hawaii economy at a positive inflection point
§ Healthy balance sheet & liquidity
§ Best public company vehicle for capitalizing
on Hawaii’s upside and creating long-term
shareholder value
on Hawaii’s upside and creating long-term
shareholder value
21
A&B: A Premier Hawaii Real Estate & Land Company ● June 18-22, 2012
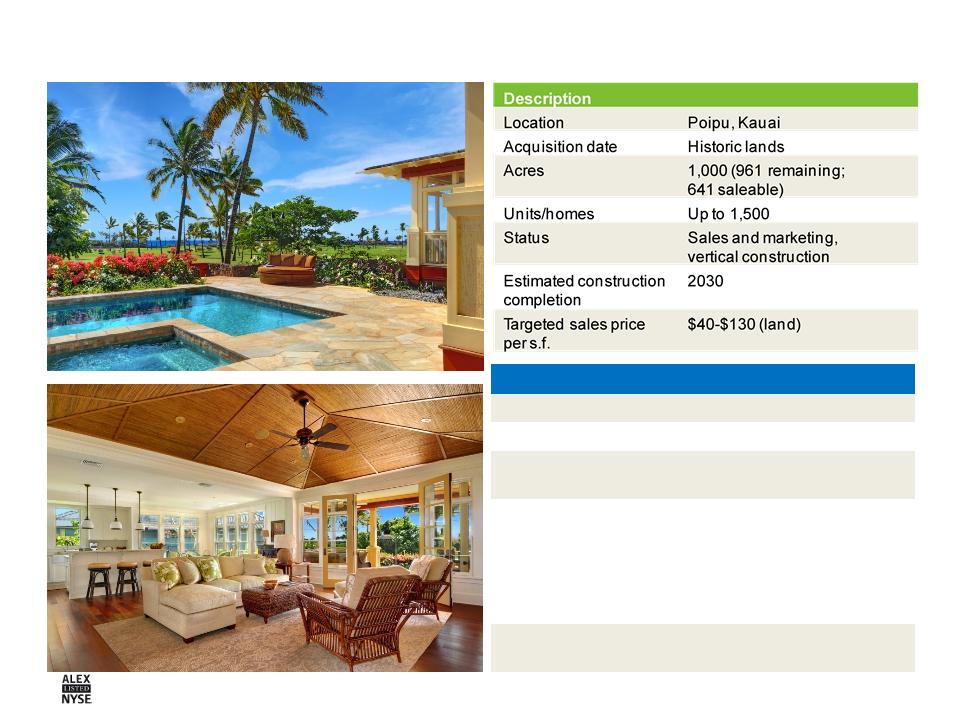
Kukui’ula
|
Overview
|
|
§ Incomparable product with limited competition
|
|
§ Offsite infrastructure complete for 450 additional lots
|
|
§ Attractive price points relative to other luxury resort
communities in Hawaii |
|
§ Positive sales momentum building:
– Increased overall sales activity
– Good market response to built product
– Increased vertical construction
– Increased 3rd party developer interest
|
|
§ Overall, 83 lots closed; 5 sold; 82 available at
June 14, 2012 |
22
A&B: A Premier Hawaii Real Estate & Land Company ● June 18-22, 2012
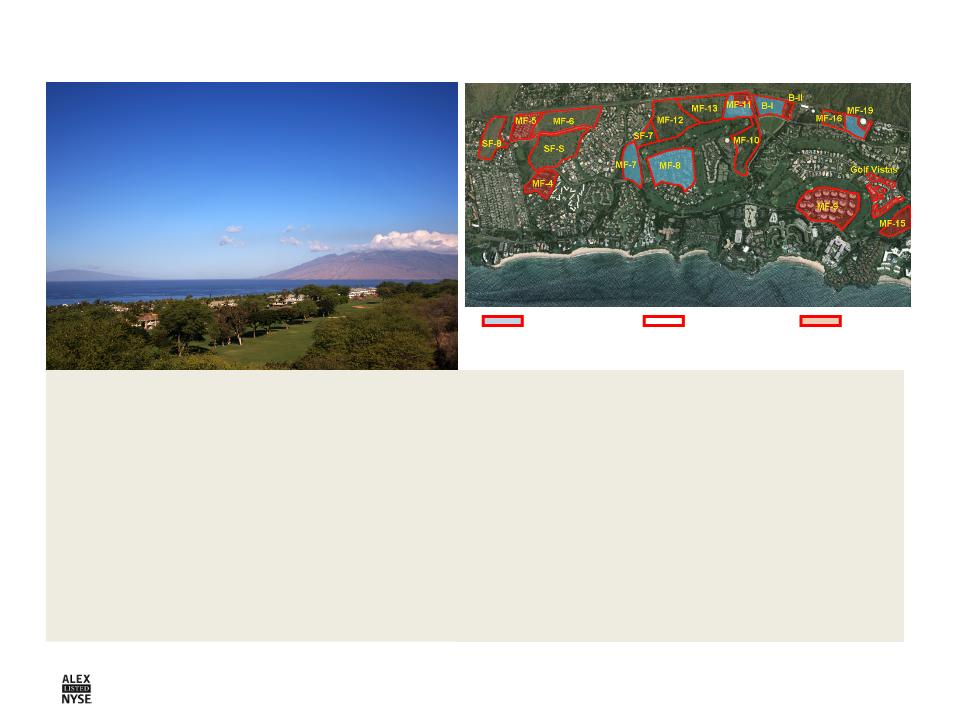
Wailea
|
Fully Entitled Acreage
|
Acres
|
|
Acquisition/Improvements
|
270
|
|
Contributed to JV/Sold
|
(103)
|
|
Remaining
|
167
|
|
Lots for sale
|
14
|
|
Under development
|
24
|
|
Future development
|
129
|
§ Original developer in the 1970s and 1980s
§ Sold in 1989, repurchased 270 acres in
2003 for $67 million
2003 for $67 million
§ Sold/developed 100 acres, recapturing
investment
investment
§ 167 remaining acres fully zoned for
residential and commercial uses with a plan
for up to 700 units
residential and commercial uses with a plan
for up to 700 units
§ 38 acres in active development
Future
development
development
Active
development/
sales
development/
sales
Sold

23
A&B: A Premier Hawaii Real Estate & Land Company ● June 18-22, 2012
Maui Business Park II
|
Description
|
|
|
Location
|
Kahului, Maui
|
|
Acquisition date
|
Historic lands
|
|
Zoning
|
Light industrial
|
|
Acres
|
179 (155 saleable)
|
|
Lots
|
131
|
|
Status
|
Construction and presales
|
|
Estimated
construction completion |
2019
|
|
Targeted sales price
per s.f. |
$40-$60
|
|
Overview
|
|
§ Well-located in Central Maui, near Kahului Airport,
Harbor and Maui’s primary residential district |
|
§ Adjacent to MBPI, which A&B transformed into
Maui’s primary retail destination |
|
§ Limited competition over the next 20 years
|
|
§ Offsite infrastructure work completed
|
|
§ 4-acre parcel sold to Costco in January 2012 for
$38 per square foot |
Phase I
Phase II
24
A&B: A Premier Hawaii Real Estate & Land Company ● June 18-22, 2012
|
Overview
|
|
§ Extremely well located near shopping, restaurants
and beaches |
|
§ Successful navigation of complex permitting process
|
|
§ Limited new product during development timeframe
|
|
§ 203 binding + 17 nonbinding sales as of
June 14, 2012 ($156M in sale value) |
25
A&B: A Premier Hawaii Real Estate & Land Company ● June 18-22, 2012
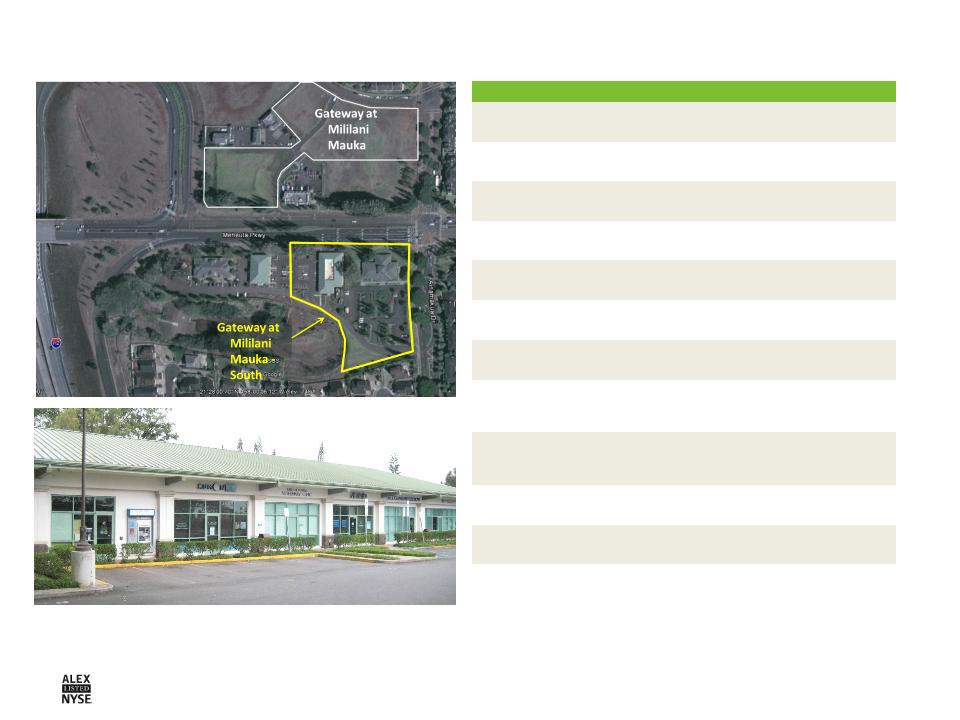
Gateway at Mililani Mauka
|
Description
|
Gateway at Mililani
|
Gateway South
|
|
Location
|
Mililani, Oahu
|
Mililani, Oahu
|
|
Projected
Acquisition |
December 2011
|
June 2012
|
|
Stabilized
NOI |
$1.0 million
|
$1.4 M
|
|
Zoning
|
B-1 Business
|
B-1 Business
|
|
Acres
|
4.35
|
4.2
|
|
GLA
(in sq. ft.) |
28,400 (future),
5,900 (existing) |
20,000 (future),
18,700 (existing) |
|
Occupancy
|
100%
|
100%
|
|
Est.
construction start |
3Q12
|
To be determined
|
|
Est.
construction completion |
2013
|
To be determined
|
|
Funded by
|
1031 exchange funds
|
1031 exchange funds
|
|
Future
|
Office/retail
|
Office/retail
|
|
Status
|
Under construction
|
Pre-development
planning in progress |

26
A&B: A Premier Hawaii Real Estate & Land Company ● June 18-22, 2012
Future Kaka'ako Project
§ Long-term option to purchase
a 3.3-acre fully-zoned high-rise
condominium site in urban
Honolulu
a 3.3-acre fully-zoned high-rise
condominium site in urban
Honolulu
§ Kaka'ako site targeted for
high-rise condominium
high-rise condominium
– 468 units total, including tower
and surrounding town homes
and surrounding town homes
– Slated for pre-sales in 2013,
completion in 2016
completion in 2016
§ Thorough evaluation of
Kaka'ako market and site
underway
Kaka'ako market and site
underway
27
A&B: A Premier Hawaii Real Estate & Land Company ● June 18-22, 2012
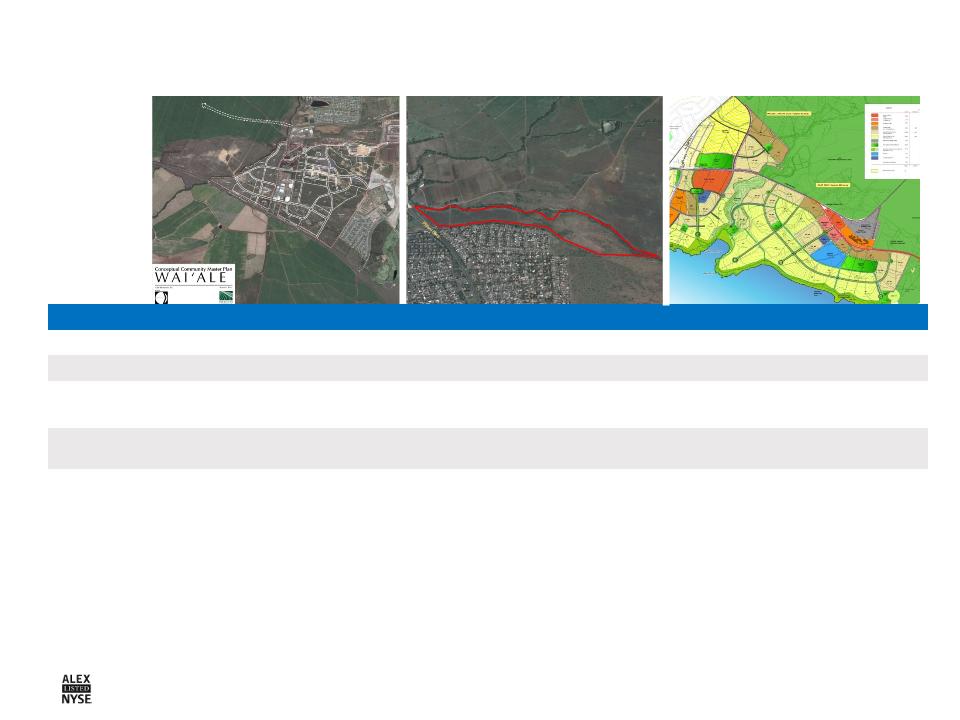
|
Waiale
|
Kihei Residential
|
Ele’ele Expansion
|
|
|
Target
|
Primary Residential
|
Primary Residential
|
Primary Residential
|
|
Location
|
Central Maui
|
Maui’s South Shore
|
Kauai’s South Shore
|
|
Project Size
(acres/units) |
545 acres/2,550 units
|
95 acres/600 units
|
840 acres
|
|
Project
description |
Master-planned community
|
Residential subdivision
|
Master-planned community
|
|
Current
Status |
The State Land Use Commission
(SLUC) approved the designation of the land from agriculture to urban in June 2012. The Company is proceeding with County zoning. |
The SLUC approved the designation of
the land from agriculture to urban in January 2009. The Planning Commission approved the zoning change and community plan amendment applications. Applications have been transmitted to City Council for review and final approval. |
Being pursued through Kauai’s multi-
year General Plan Update Process. Working through the process to ensure the inclusion of Eleele, and related recreational and commercial uses, as an appropriate future urban growth area. |
Entitlement Areas of Focus
28
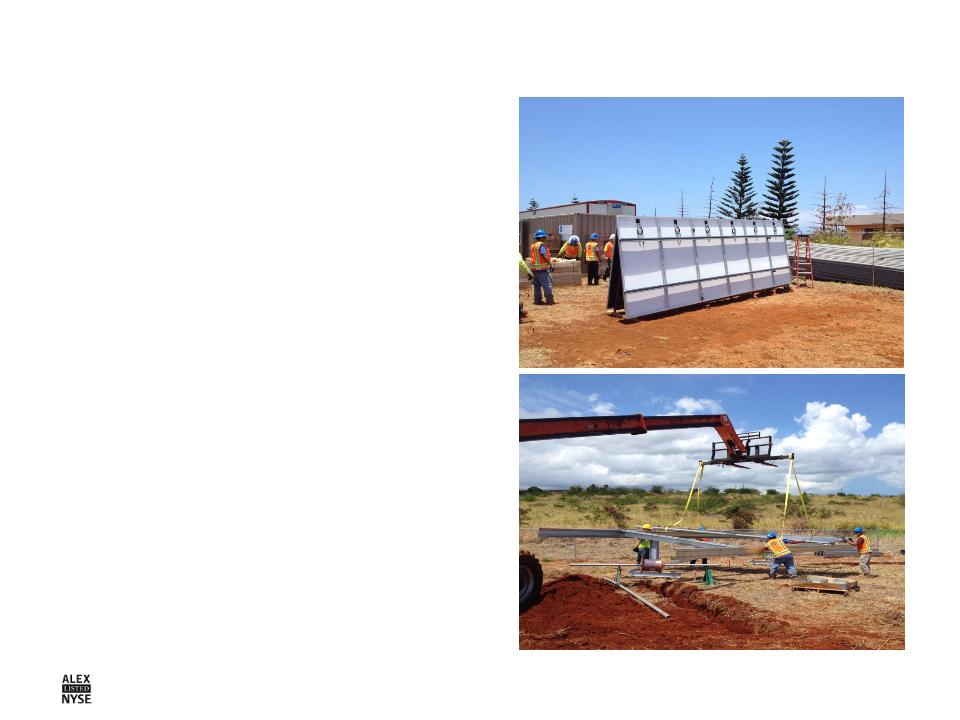
A&B: A Premier Hawaii Real Estate & Land Company ● June 18-22, 2012
§ 6-MW (AC) facility built on 20-acres
of Company-owned land
of Company-owned land
§ 20-year fixed rate agreement to sell
power generated to local utility at
$200 per MW
power generated to local utility at
$200 per MW
§ All-in development cost of $25M to
$27M
$27M
§ Payback in under 5 years, aided by
substantial federal and state tax
credits in first year
substantial federal and state tax
credits in first year
§ Project proceeding on schedule for
late 2012 completion
late 2012 completion
Port Allen Solar Project
Value Creation from Land Stewardship Activities
Value Creation from Land Stewardship Activities
29
A&B: A Premier Hawaii Real Estate & Land Company ● June 18-22, 2012
Value Creation from Land Stewardship Activities
§ HC&S: 36,000-acre Maui sugar
plantation (35,500 owned acres)
plantation (35,500 owned acres)
§ McBryde Resources: 4,000 acres
leased for farming operations
(coffee and corn) on Kauai
leased for farming operations
(coffee and corn) on Kauai
§ Focused on de-risking operations
§ Significant renewable energy
provider on Maui (hydro and
bagasse) and Kauai (hydro and
planned solar)
provider on Maui (hydro and
bagasse) and Kauai (hydro and
planned solar)
§ Expansion of renewable energy
under evaluation using $12M of
Federal research grants
under evaluation using $12M of
Federal research grants

30
A&B: A Premier Hawaii Real Estate & Land Company ● June 18-22, 2012
A&B: Investment Thesis
§ Unique assets & competitive strengths
§ Proven track record
§ Embedded growth opportunities in a
development pipeline positioned for market
recovery
development pipeline positioned for market
recovery
§ Hawaii economy at a positive inflection
point
point
§ Healthy balance sheet & liquidity
§ Best public company vehicle for capitalizing
on Hawaii’s upside and creating long-term
shareholder value
on Hawaii’s upside and creating long-term
shareholder value

31
A&B: A Premier Hawaii Real Estate & Land Company ● June 18-22, 2012
§ Positive trends in key economic indicators
– Strong performance trends for Hawaii’s visitor industry
– 2011 near-record year
– April YTD expenditures up 17% and arrivals up 9%
– 2012 outlook for record arrivals and expenditures
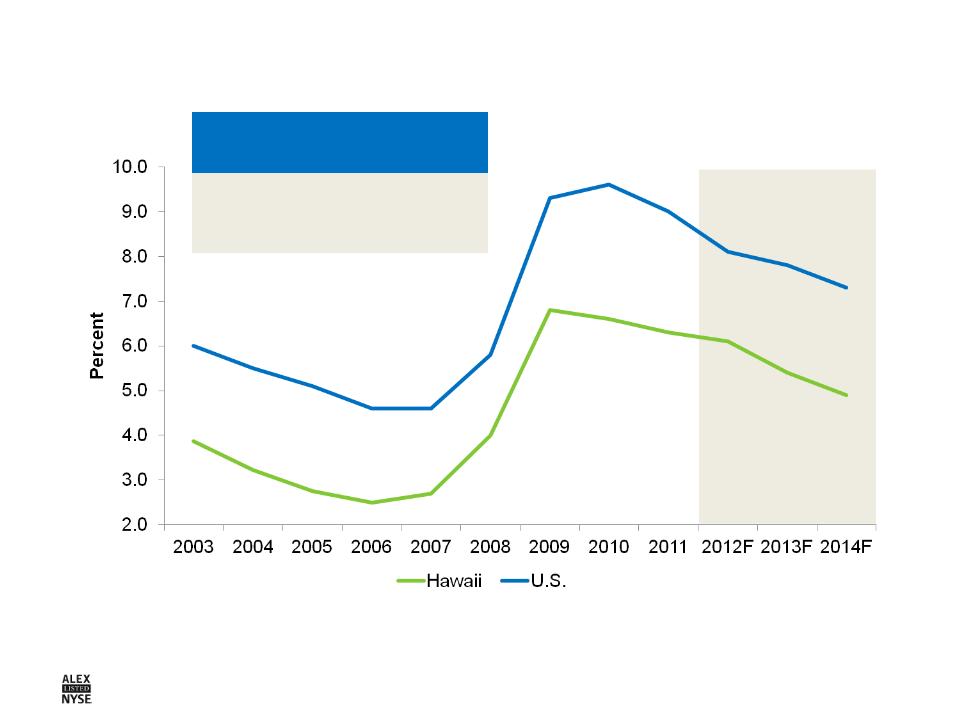
– Unemployment declining and relatively low at 6.3% v. 8.1% for U.S.
– YTD May bankruptcies down 25%
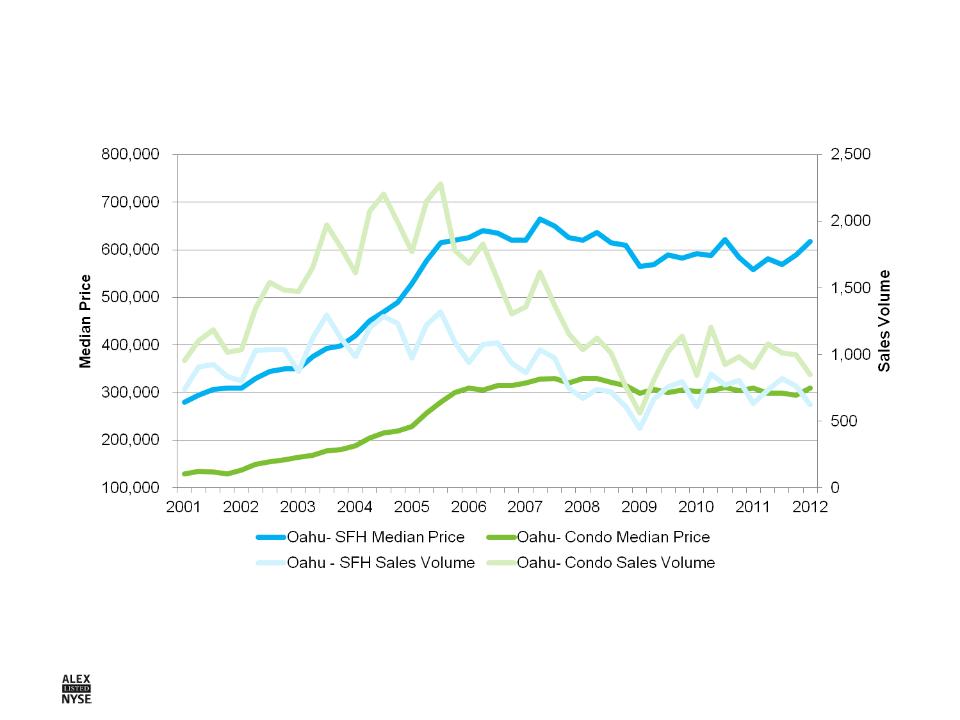
– YOY median prices for Oahu homes in May $664,000, up 12%
§ Catalysts for future growth
– Military
– Rail
– International tourism, especially from China and Korea
Hawaii Economy at a Positive Inflection Point
Sources: Hawaii Tourism Authority, May 31, 2012; Department of Labor and Industrial Relations Report, April 2012; DBEDT Quarterly Statistical &
Economic Report, 2nd Quarter 2012 http://hawaii.gov/dbedt; Hawaii Bankruptcy Court http://www.hib.uscourts.gov/stats/index_stats.html;
Honolulu Board of Realtors, June 7, 2012
Economic Report, 2nd Quarter 2012 http://hawaii.gov/dbedt; Hawaii Bankruptcy Court http://www.hib.uscourts.gov/stats/index_stats.html;
Honolulu Board of Realtors, June 7, 2012
Data provided for informational purposes only; no endorsement of forecast implied.
32
A&B: A Premier Hawaii Real Estate & Land Company ● June 18-22, 2012
The China Potential for Hawaii
Source: Title Guaranty (RE Transactions); Hawaii Tourism Authority (Visitor #’s); National Bureau of Statistics of China (Population);
Japan Ministry of Internal Affairs and Communications (Population)
|
Japan
|
2009
|
2010
|
2011
|
|
Number of Visitors (in millions)
|
1.2
|
1.2
|
1.2
|
|
Real Estate Investment (in millions)
|
$278.9
|
$263.4
|
$274.0
|
|
Average Investment (in millions)
|
$1.1
|
$1.2
|
$1.0
|
|
Population (in millions)
|
127.5
|
128.1
|
127.8
|
|
China
|
2009
|
2010
|
2011
|
|
Number of Visitors
|
41,900
|
61,500
|
79,500
|
|
Real Estate Investment
|
?
|
?
|
?
|
|
Population (in billions)
|
1.33
|
1.34
|
1.35
|

33
A&B: A Premier Hawaii Real Estate & Land Company ● June 18-22, 2012
A&B: Investment Thesis
§ Unique assets & competitive strengths
§ Proven track record
§ Embedded growth opportunities in a
development pipeline positioned for market
recovery
development pipeline positioned for market
recovery
§ Hawaii economy at a positive inflection point
§ Healthy balance sheet & liquidity
§ Best public company vehicle for capitalizing
on Hawaii’s upside and creating long-term
shareholder value
on Hawaii’s upside and creating long-term
shareholder value

34
A&B: A Premier Hawaii Real Estate & Land Company ● June 18-22, 2012
|
Capital Structure
|
Capacity/
Limit (in millions)
|
Pro Forma at
Separation (in millions, unaudited)
|
|
Prudential Term Debt
|
$300
|
$207
|
|
Revolver Debt
|
$260
|
$50
|
|
Existing Mortgages on Commercial
Portfolio Properties |
-
|
$29
|
|
Total Debt
|
-
|
$286
|
|
Undrawn Capacity
|
-
|
$303
|
|
Statistics
|
Pro Forma at Separation
|
|
Debt to Debt + Equity
|
25%
|
|
Debt to Total Assets
|
20%
|
|
5-Year Average Debt Maturities (2012-2016)
|
$15M
|
|
5-Year Range of Debt Maturities (2012-2016)
|
$14M to $19M
|
|
5-Year Average EBITDA (2007-2011)
|
$129M
|
35
A&B: A Premier Hawaii Real Estate & Land Company ● June 18-22, 2012
A&B: Investment Thesis
§ Unique assets & competitive strengths
§ Proven track record
§ Embedded growth opportunities in a
development pipeline positioned for market
recovery
development pipeline positioned for market
recovery
§ Hawaii economy at a positive inflection point
§ Healthy balance sheet & liquidity
§ Best public company vehicle for
capitalizing on Hawaii’s upside and
creating long-term shareholder value
capitalizing on Hawaii’s upside and
creating long-term shareholder value
36
A&B: A Premier Hawaii Real Estate & Land Company ● June 18-22, 2012
Appendix A: Leadership

37
A&B: A Premier Hawaii Real Estate & Land Company ● June 18-22, 2012
Board of Directors
Stanley M. Kuriyama
Chairman and Chief Executive Officer, Alexander & Baldwin, Inc.
Chairman and Chief Executive Officer, Alexander & Baldwin, Inc.
W. Allen Doane
Retired Chairman of the Board and Chief Executive Officer, Alexander & Baldwin, Inc.
Retired Chairman of the Board and Chief Executive Officer, Alexander & Baldwin, Inc.
Walter A. Dods, Jr.
Chairman of the Board, Matson and Retired Chairman and Chief Executive Officer of BancWest
and First Hawaiian Bank
Chairman of the Board, Matson and Retired Chairman and Chief Executive Officer of BancWest
and First Hawaiian Bank
Robert S. Harrison
President and Chief Executive Officer, First Hawaiian Bank
President and Chief Executive Officer, First Hawaiian Bank
Charles G. King
President, King Auto Center
President, King Auto Center
Douglas M. Pasquale
Director of Ventas, Inc. and Retired Chairman of the Board and Chief Executive Officer,
National Health Properties, Inc.
Director of Ventas, Inc. and Retired Chairman of the Board and Chief Executive Officer,
National Health Properties, Inc.
Michele K. Saito
President, Farmers Insurance Hawaii
President, Farmers Insurance Hawaii
Jeffrey N. Watanabe
Chairman of the Board, Hawaiian Electric Industries, Inc. and Retired Founder of Watanabe Ing
LLP, a Limited Liability Law Partnership
Chairman of the Board, Hawaiian Electric Industries, Inc. and Retired Founder of Watanabe Ing
LLP, a Limited Liability Law Partnership
Eric K. Yeaman
President and Chief Executive Officer, Hawaiian Telcom
President and Chief Executive Officer, Hawaiian Telcom
38
A&B: A Premier Hawaii Real Estate & Land Company ● June 18-22, 2012
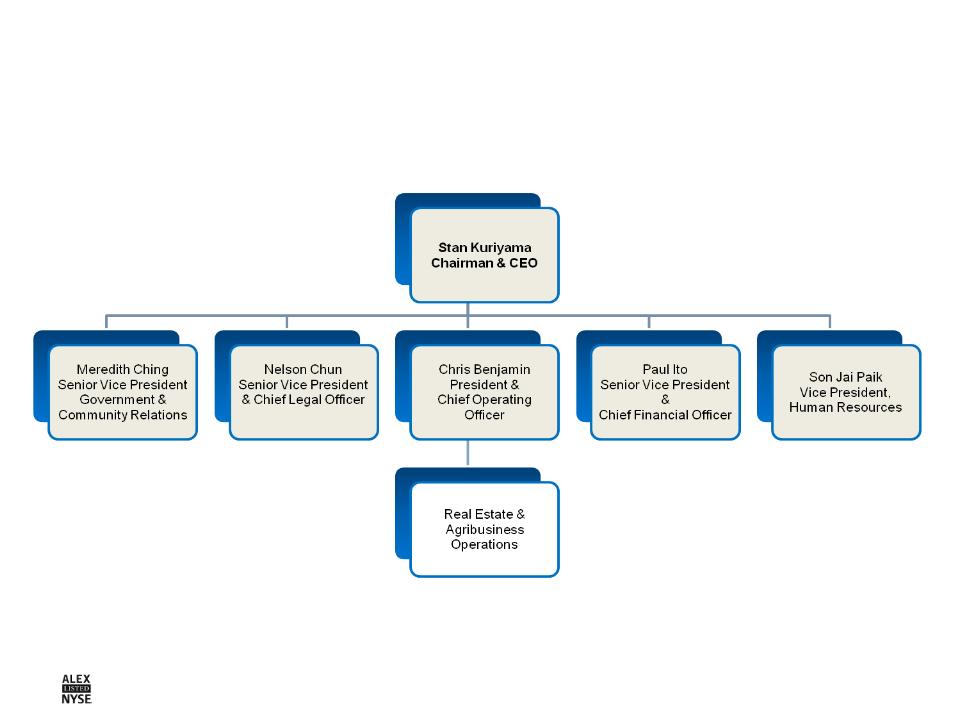
Management Team
New A&B
New A&B

39
A&B: A Premier Hawaii Real Estate & Land Company ● June 18-22, 2012
Appendix B: Organization & Financial Overview

40
A&B: A Premier Hawaii Real Estate & Land Company ● June 18-22, 2012
RE Leasing Segment
RE Sales Segment
Agribusiness Segment

41
A&B: A Premier Hawaii Real Estate & Land Company ● June 18-22, 2012
2 See appendix for statement regarding the Company’s use of non-GAAP financial measures and a reconciliation of GAAP to non-GAAP measures; Cash NOI is not adjusted
for changes in discontinued operations from sales of commercial real estate after the year indicated.
for changes in discontinued operations from sales of commercial real estate after the year indicated.
3 Excludes 1031 exchanges; maintenance capital expenditures average between $15M and $20M annually.

42
A&B: A Premier Hawaii Real Estate & Land Company ● June 18-22, 2012
Management’s Use of Non-GAAP Financial Measures
The Company presents cash NOI, which is a non-GAAP measure derived from real estate
revenues (determined in accordance with GAAP, less straight-line rental adjustments) minus
property operating expenses (determined in accordance with GAAP). Cash NOI does not have
any standardized meaning prescribed by GAAP, and therefore, may differ from definitions of
cash NOI used by other companies. Cash NOI should not be considered as an alternative to net
income (determined in accordance with GAAP) as an indicator of the Company’s financial
performance, or as an alternative to cash flow from operating activities as a measure of the
Company’s liquidity. Cash NOI is commonly used as a measure of operating performance
because it is an indicator of the return on property investment, and provides a method of
comparing property performance over time. Cash NOI excludes general and administrative
expenses, straight-line rental adjustments, interest income, interest expense, depreciation and
amortization, and gains on sales of interests in real estate. The Company believes that the Real
Estate Leasing segment’s operating profit after subtracting discontinued operations is the most
directly comparable GAAP measurement to cash NOI. A required reconciliation of Real Estate
Leasing operating profit to Real Estate Leasing segment cash NOI is presented on slide 43.
43
A&B: A Premier Hawaii Real Estate & Land Company ● June 18-22, 2012
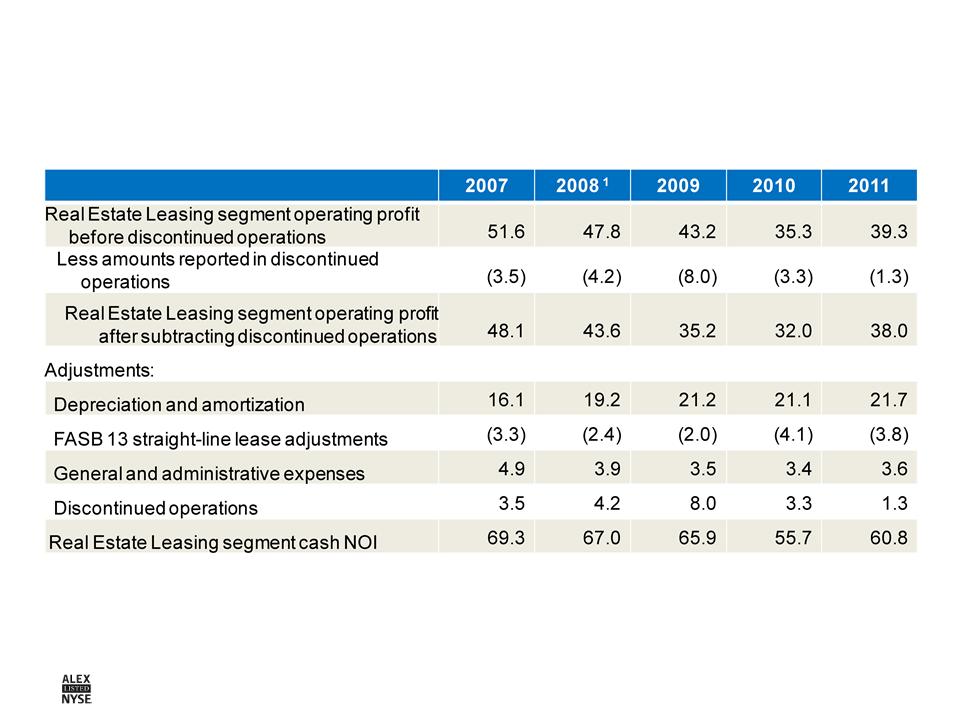
Reconciliation of Leasing Operating Profit to Cash NOI
Dollars in Millions
Dollars in Millions
1 Includes Kahului Shopping Center business interruption payment of $1.5 million
Note: Discontinued operations are not adjusted for sales of commercial real estate occurring after the indicated year.

44
A&B: A Premier Hawaii Real Estate & Land Company ● June 18-22, 2012
Appendix C: Landholdings and Valuation

45
A&B: A Premier Hawaii Real Estate & Land Company ● June 18-22, 2012
Valuation Methodologies - Overall Approach
§ “Sum-of-the-parts” approach to perform a net asset valuation (NAV)
most commonly used
most commonly used
‒ Break down holdings into key asset classes
‒ Value assets within asset class using one or more methodologies
‒ Sum and subtract certain liabilities
§ A&B does not routinely perform such valuations
§ Valuations will require analysts to make a number of assumptions on key
factors which will have a material impact on resultant value (e.g., cap rates,
construction spending timing, sales absorption)
factors which will have a material impact on resultant value (e.g., cap rates,
construction spending timing, sales absorption)
46
A&B: A Premier Hawaii Real Estate & Land Company ● June 18-22, 2012
Valuation Data Sources
|
Asset Class
|
Information & Data Sources
|
|
Income properties
|
|
|
Commercial properties
|
Company : 10-K, RE Supplement, Presentations, Website, Form 10
Third Party: Commercial Property Brokers, REITs, NAREIT, CCIM, Hawaii public
companies, commercial property sales listing websites (e.g., Loopnet) |
|
Ground leases
|
Company: RE Supplement, 10-K, Website,
Third Party: Maui/Kauai Boards of Realtors
|
|
Development lands
|
|
|
Active developments
|
Company: 10-K, RE Supplement, Presentations, Website, Form 10
Third Party: Hawaii public companies, developers, Maui/Kauai Boards of Realtors
|
|
Future or planned dev.
|
Company: 10-K, RE Supplement, Presentations, Website, Form 10
Third Party: Commercial Property Brokers, Hawaii public companies, commercial property
sales listing websites (e.g., Loopnet) |
|
Core Ag & conservation lands
|
|
|
Maui
|
Company: 10-K, RE Supplement, Presentations, Website, Form 10
Third Party: Maui Board of Realtors, Maui public company
|
|
Kauai
|
Company: 10-K, RE Supplement, Presentations, Website, Form 10
Third Party: Kauai Board of Realtors
|
|
Non-core Ag & conservation
lands |
Company: 10-K, RE Supplement, Presentations, Website, Form 10
Third Party: Maui/Kauai Board of Realtors, Hawaii public companies
|
47
A&B: A Premier Hawaii Real Estate & Land Company ● June 18-22, 2012
Total Landholdings
As of 12/31/11
|
Description
|
Maui
|
Kauai
|
Oahu
|
Big Island
|
Mainland
|
Total Acres
|
|
Fully entitled
|
|
|
|
|
|
|
|
Hawaii - development/other
|
|
|
|
|
|
|
|
Active development/sales
|
217
|
-
|
7
|
-
|
-
|
224
|
|
Future development
|
188
|
44
|
-
|
-
|
-
|
232
|
|
Ground leases to third parties
|
64
|
1
|
-
|
-
|
-
|
65
|
|
Land used by affiliates
|
22
|
4
|
-
|
-
|
-
|
26
|
|
Other, including land not planned for development
|
17
|
54
|
-
|
-
|
-
|
71
|
|
Total Hawaii - development/other
|
508
|
103
|
7
|
-
|
-
|
618
|
|
Mainland - development
|
|
|
|
|
28
|
28
|
|
Hawaii - commercial improved properties
|
51
|
8
|
63
|
10
|
-
|
132
|
|
Mainland - commercial improved properties
|
-
|
-
|
-
|
-
|
443
|
443
|
|
Subtotal - fully entitled
|
559
|
111
|
70
|
10
|
471
|
1,221
|
|
|
|
|
|
|
|
|
|
Agricultural, pasture and miscellaneous
|
|
|
|
|
|
|
|
Hawaiian Commercial & Sugar Company
|
35,500
|
-
|
-
|
-
|
-
|
35,500
|
|
Leased to third parties
|
7,150
|
4,620
|
-
|
-
|
-
|
11,770
|
|
Other agricultural, pasture and misc. purposes
|
8,181
|
2,324
|
-
|
-
|
-
|
10,505
|
|
Subtotal - agricultural, pasture & misc.
|
50,831
|
6,944
|
-
|
-
|
-
|
57,775
|
|
|
|
|
|
|
|
|
|
Watershed/conservation
|
|
|
|
|
|
|
|
Wainiha Valley
|
-
|
10,120
|
-
|
-
|
-
|
10,120
|
|
Other Kauai
|
-
|
3,200
|
-
|
-
|
-
|
3,200
|
|
Maui
|
15,850
|
-
|
-
|
-
|
-
|
15,850
|
|
Subtotal - watershed/conservation
|
15,850
|
13,320
|
-
|
-
|
-
|
29,170
|
|
|
|
|
|
|
|
|
|
Total landholdings
|
67,240
|
20,375
|
70
|
10
|
471
|
88,166
|
|
|
|
|
|
|
|
|
1
1 Of this acreage, roughly 10,000 acres represents lands that have higher sale or development potential.
48
A&B: A Premier Hawaii Real Estate & Land Company ● June 18-22, 2012
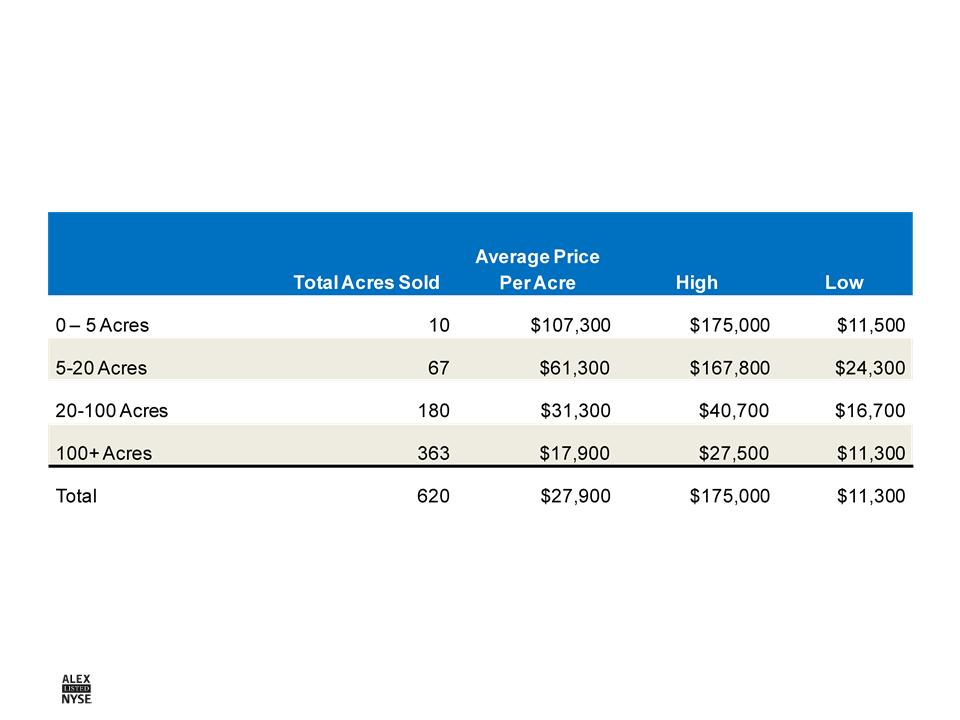
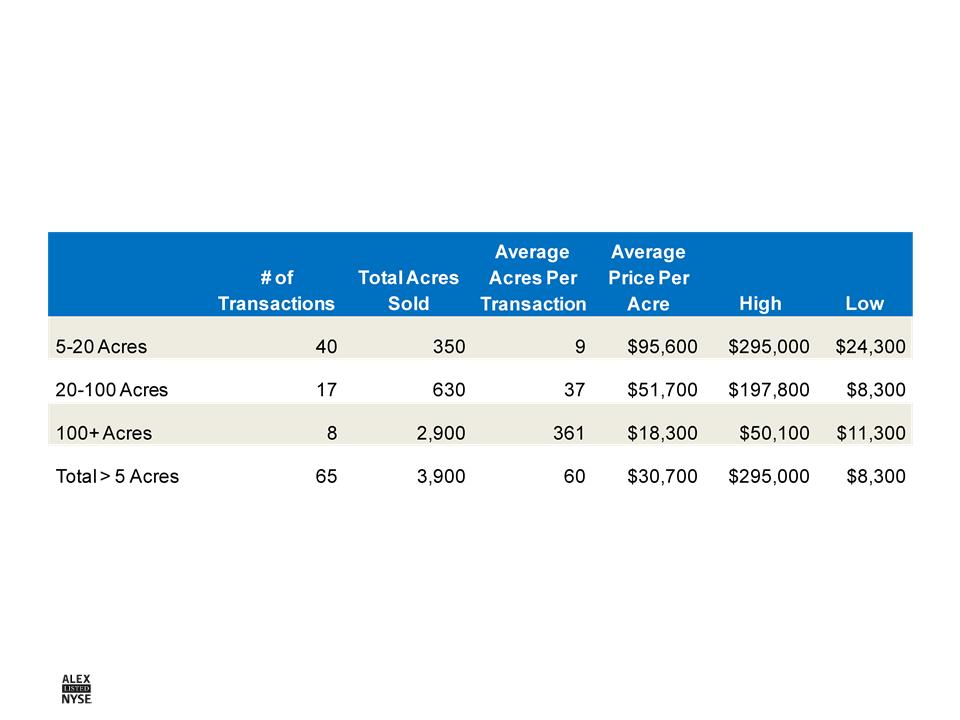
Valuation Methodologies -
A&B Ag Zoned Land 5-Year Sales Data
A&B Ag Zoned Land 5-Year Sales Data
A&B Ag Zoned Land Sales Transactions
2007 to 2011
A&B’s gross margin on unimproved land sales averaged 87% from 2007-2011
49
A&B: A Premier Hawaii Real Estate & Land Company ● June 18-22, 2012
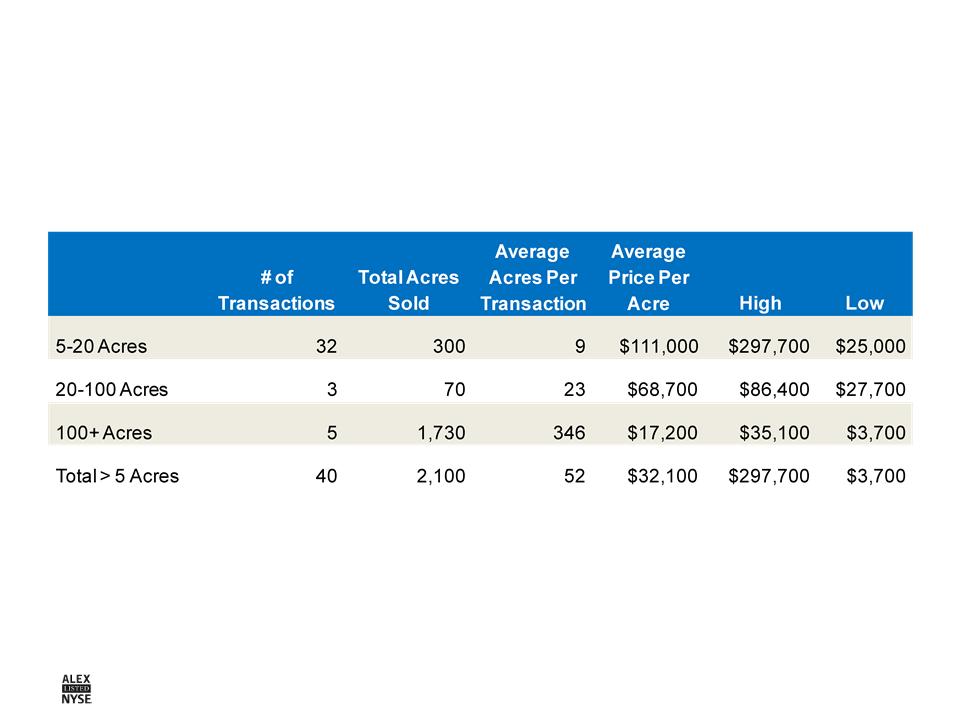
Valuation Methodologies - Market Data
North Shore/Upcountry Maui Ag Zoned Land Sales Comps
(Haiku /Kula /Makawao /Olinda)
2006 to 2011
Source: A&B compilation and analysis of Maui Board of Realtors data
50
A&B: A Premier Hawaii Real Estate & Land Company ● June 18-22, 2012
Valuation Methodologies - Market Data
Kauai Ag Zoned Land Sales Comps
2007 to 2010
Source: A&B compilation and analysis of Hawaii Information Service data

51
A&B: A Premier Hawaii Real Estate & Land Company ● June 18-22, 2012
Appendix D: Hawaii Economic Data
52
A&B: A Premier Hawaii Real Estate & Land Company ● June 18-22, 2012
Key Hawaii Economic Indicators
|
Indicator
(% Change YOY, except
unemployment rate) |
2009
DBEDT
|
2010
DBEDT
|
2011
DBEDT
|
2012F
|
2013F
|
2014F
|
|||
|
UHERO
|
DBEDT
|
UHERO
|
DBEDT
|
UHERO
|
DBEDT
|
||||
|
Real Gross
Domestic Product |
(2.6)
|
1.2
|
1.2
|
2.2
|
2.2
|
3.1
|
2.3
|
3.6
|
2.4
|
|
Visitor Arrivals
|
(4.4)
|
7.7
|
3.8
|
5.2
|
6.5
|
2.5
|
2.2
|
1.7
|
2.4
|
|
Real Personal
Income |
(1.4)
|
1.5
|
0.7
|
1.5
|
1.7
|
2.7
|
2.1
|
2.9
|
2.6
|
|
Unemployment
Rate |
6.8
|
6.6
|
6.3
|
6.1
|
NF
|
5.4
|
NF
|
4.9
|
NF
|
|
Building Permits
|
(29.0)
|
9.7
|
(26.2)
|
48.3
|
NF
|
6.2
|
NF
|
12.0
|
NF
|
Sources: University of Hawaii Economic Research Organization (UHERO), State Forecast, May11, 2012 ,and Hawaii Construction Forecast, March 16, 2012,
http://www.uhero.hawaii.edu/ ; Hawaii Department of Business, Economic Development & Tourism (DBEDT), 2nd Quarter 2012 Report http://hawaii.gov/dbedt.
http://www.uhero.hawaii.edu/ ; Hawaii Department of Business, Economic Development & Tourism (DBEDT), 2nd Quarter 2012 Report http://hawaii.gov/dbedt.
Data provided for informational purposes only; no endorsement implied.
NF: Not forecasted
53
A&B: A Premier Hawaii Real Estate & Land Company ● June 18-22, 2012
Hawaii Economic Indicators
As of April 30, 2012
As of April 30, 2012
1Increase in building permits primarily due to increase in alterations and additions.
2 Months of inventory is a Honolulu Board of Realtors figure for the month of May 2012
Sources: Hawaii Tourism Authority, Monthly Visitor Statistics, April 2012; DBEDT Monthly Economic Indicators, April 2012; Title Guaranty Report, April 2012; Hawaii
Department of Labor and Industrial Relations.
Department of Labor and Industrial Relations.
Data provided for informational purposes only; no endorsement implied.
|
|
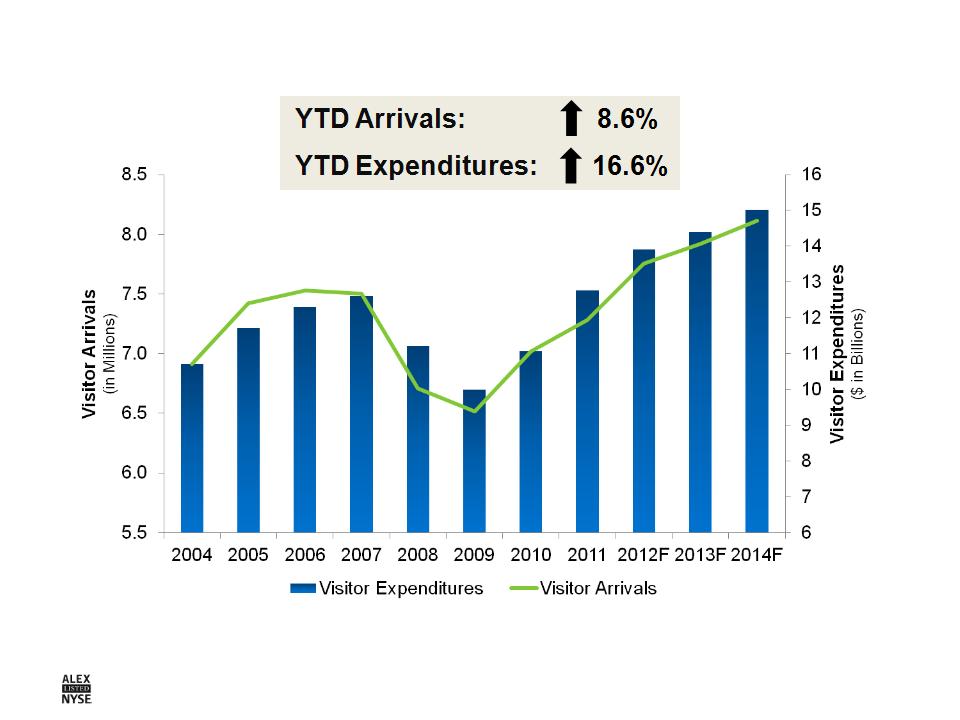
YTD
|
% Change From
2011 |
|
Visitors (by air)
|
|
|
|
Arrivals (millions)
|
2.6
|
8.6
|
|
Expenditures (billions)
|
$4.8
|
16.6
|
|
Building permits (millions)
|
$703.4
|
23.11
|
|
Oahu residential real estate
|
|
|
|
Median home prices
|
$607,000
|
6.9
|
|
Home volumes
|
853
|
(1.5)
|
|
Home months of inventory (May)2
|
3.7
|
(35.1)
|
|
Median condo prices
|
$310,000
|
0.9
|
|
Condo volumes
|
1,200
|
(6.8)
|
|
Condo months of inventory (May) 2
|
4.4
|
(24.1)
|
|
Unemployment rate (April)
|
6.3
|
(0.3)
|
54
A&B: A Premier Hawaii Real Estate & Land Company ● June 18-22, 2012
Visitor Arrivals and Expenditures
Source: DBEDT Quarterly Statistical & Economic Report, 2nd Quarter 2012 http://hawaii.gov/dbedt;
Hawaii Tourism April 2012 Visitor Highlights http://www.hawaiitourismauthority.org
Hawaii Tourism April 2012 Visitor Highlights http://www.hawaiitourismauthority.org
Data provided for informational purposes only; no endorsement of forecast implied.
55
A&B: A Premier Hawaii Real Estate & Land Company ● June 18-22, 2012
Hawaii and U.S. Unemployment Rate
Sources: DBEDT Quarterly Statistical & Economic Report, 2nd Quarter 2012 http://hawaii.gov/dbedt; UHERO State Forecast Update, May11, 2012
http://www.uhero.hawaii.edu/; United States Department of Labor, Unemployment Data; Bloomberg Composite Forecast as of June 6, 2012
http://www.uhero.hawaii.edu/; United States Department of Labor, Unemployment Data; Bloomberg Composite Forecast as of June 6, 2012
Data provided for informational purposes only; no endorsement of forecast implied.
|
Hawaii Average
Unemployment |
|
April 2012 - 6.3%
|
|
April 2011 - 6.6%
|
56
A&B: A Premier Hawaii Real Estate & Land Company ● June 18-22, 2012
Hawaii Real Estate Overview
Residential Real Estate Resales; YTD Ended May 31, 2012
Residential Real Estate Resales; YTD Ended May 31, 2012
|
County
|
Single Family Homes
|
Condominiums
|
||||||
|
Sales
|
%
Change from 2011 |
Median
Price |
%
Change from 2011 |
Sales
|
%
Change from 2011 |
Median
Price |
%
Change from 2011 |
|
|
Hawaii
|
658
|
(3)
|
241,500
|
(2)
|
252
|
(8)
|
256,250
|
27
|
|
Kauai
|
170
|
16
|
452,500
|
(9)
|
126
|
(1)
|
285,000
|
38
|
|
Maui
|
353
|
(3)
|
435,000
|
(3)
|
544
|
0
|
347,300
|
6
|
|
Oahu
|
1,099
|
(1)
|
619,000
|
8
|
1,586
|
(4)
|
310,000
|
2
|
|
Total
|
2,280
|
(1)
|
|
|
2,508
|
(3)
|
|
|
Source: Title Guaranty Sales of Existing Homes & Condominiums report, May 2012
Data provided for informational purposes only; no endorsement implied.
57
A&B: A Premier Hawaii Real Estate & Land Company ● June 18-22, 2012
Hawaii Real Estate Overview - Oahu
Oahu Single Family Homes and Condo Resales
Oahu Single Family Homes and Condo Resales
Source: Title Guaranty Sales of Existing Homes & Condominiums report, Honolulu Board of Realtors March 2012.
Data provided for informational purposes only; no endorsement implied.
Data provided for informational purposes only; no endorsement implied.

58
A&B: A Premier Hawaii Real Estate & Land Company ● June 18-22, 2012
Hawaii Real Estate Overview
Oahu Commercial Markets as of March 31, 2012, except for Retail
Oahu Commercial Markets as of March 31, 2012, except for Retail
|
Retail*
|
|
|
YTD net absorption
|
154,308 SF
|
|
Vacancy rate
|
4.26%
|
|
Average asking
rent range |
$2.70 - $3.53
PSF/MO |
|
Average operating
expense |
$1.08 PSF/MO
|
|
Industrial
|
|
|
YTD net absorption
|
19,925 SF
|
|
Vacancy rate
|
4.72%
|
|
Average asking rent
NNN |
$0.95 PSF/MO
|
|
Average operating
expense |
$0.32 PSF/MO
|
|
Office
|
|
|
YTD net absorption
|
(8,033) SF
|
|
Vacancy rate
|
13.60%
|
|
Average full
asking rent |
$2.84 PSF/MO
|
|
Average operating
expense |
$1.27 PSF/MO
|
* Retail data as of May 31,2012 or for the period from November 1, 2011 to May 31, 2012.
Sources: Colliers International Oahu First Quarter 2012, Office and Industrial Market Reports; Colliers International Mid Year 2012, Retail Market Report
Data provided for informational purposes only; no endorsement implied.