Attached files
| file | filename |
|---|---|
| 8-K - FORM 8-K - NORTHWEST PIPE CO | d367480d8k.htm |
 2012 Annual Shareholder Meeting
June 14, 2012
Exhibit 99.1 |
 2
Forward Looking Statements
This presentation includes certain estimates and other forward-looking statements within the
meaning of Section 21E of the Securities Exchange Act of 1934, as amended, including
statements with respect to anticipated operating and financial performance, growth opportunities,
growth rates, potential acquisition opportunities, and other statements of expectation. Words
such as ”forecasts”, “expects,” “anticipates,”
“intends,” “plans,” “believes,” “assumes,” “seeks,”
“estimates,” “should,” and variations of these words and similar expressions, are
intended to identify these forward-looking statements. While we believe these statements
are accurate, forward-looking statements are inherently uncertain and we cannot assure you
that these expectations will occur and our actual results may be significantly different. These
statements by the Company and its management are based on estimates, projections, beliefs and
assumptions of management and are not guarantees of future performance. Important factors that
could cause actual results to differ from those in the forward-looking statements include
the factors described in the “Risk Factors” section of our most recent 10-Q
filing with the SEC. The Company disclaims any obligation to update or revise any
forward-looking statement based on the occurrence of future events, the receipt of new
information, or otherwise. This presentation includes certain non-GAAP financial
measures, that are different from financial measures calculated in accordance with GAAP and may
be different from similar measures used by other
companies. |
 3
Investment Highlights
•
Strong energy pipe markets
•
Industry leader with strategically located water
transmission manufacturing facilities
•
Strategic plan to capitalize on current position
and new opportunities
•
Experienced, energized and proven
management team |
 4
Northwest Pipe at a Glance
•
Diversified manufacturer
of welded steel pipe for
water infrastructure,
energy, agricultural,
industrial and other uses
•
Industry leader
–
Over 100 years of operating
history
–
Widely recognized for quality
and customer service
•
National presence
•
Record net sales in 2011
Net Sales 2007-2011 |
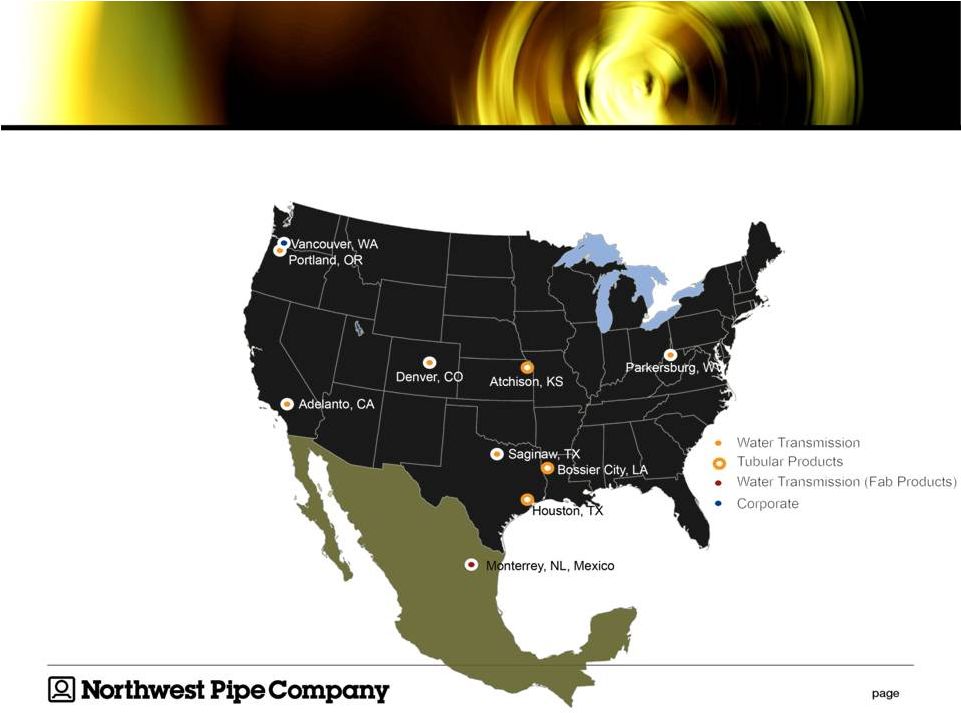 5
Northwest Pipe Company Locations
5 |
 6
Income
Statement
Summary
($ in millions)
2010
2011
Q1-2012
Net Sales
Water Transmission
$ 221.3
$ 271.9
$ 58.4
Tubular Products
165.5
239.8
83.8
Net Sales
386.8
511.7
142.2
Gross Profit
Water Transmission
19.4
43.2
9.7
Tubular Products
10.3
15.9
6.8
Gross Profit
29.7
59.1
16.5
SG&A
29.1
26.3
7.3
Operating Income/(Loss)
0.6
32.8
9.2
Other (Income)/Expense
(0.4)
1.3
0.1
Interest Income
(0.8)
(0.1)
(0.0)
Interest Expense
8.9
9.3
1.6
Income/(Loss) Before Taxes
(7.1)
22.3
7.5
Provision/(Benefit) for Income Taxes
(1.7)
9.6
2.8
Net Income/(Loss)
(5.4)
12.7
4.7
Diluted Earnings per Share
$ (0.59)
$ 1.35
$ 0.50 |
 7
Backlog |
 8
Balance
Sheet
Summary
($ in millions)
Dec. 31,
2010
Dec. 31,
2011
Mar. 31,
2012
Assets
Cash and Cash Equivalents
$ 0.1
$ 0.2
$ 0.1
Trade and Other Receivables, Net
66.5
69.9
64.9
Costs and Estimated Earnings in Excess
of Billings on Uncompleted Contracts
45.5
38.0
44.1
Inventories
80.9
107.2
98.6
Other Current Assets
23.5
11.6
12.2
Total Current Assets
216.5
226.9
219.9
Property and Equipment, Net
154.3
152.8
153.2
Other Assets
44.1
33.7
34.4
Total Assets
$ 414.9
$ 413.4
$ 407.5
Liabilities
Current Maturities of Long-Term Debt
$ 9.0
$ 9.1
$ 9.0
Accounts Payable
28.5
20.2
21.4
Accrued Liabilities
11.5
19.2
21.6
Billings in Excess of Cost and Estimated Earnings
on Uncompleted Contracts
14.8
7.8
4.4
Total Current Liabilities
63.7
56.3
56.4
Long-Term Note Payable to Financial Institution
68.0
62.0
53.8
Other Long-Term Debt, Less Current Maturities
33.5
24.4
20.9
Other Liabilities
23.3
30.4
30.9
Total Liabilities
188.6
173.1
162.0
Stockholders' Equity
226.3
240.3
245.5
Total Liabilities and Stockholders' Equity
$ 414.9
$ 413.4
$ 407.5 |
 Tubular Products |
 10
Tubular Net Sales $$ by Product Group
Energy
73%
Non-Energy
27%
2011
Energy
61%
Non-Energy
39%
2010
Energy
82%
Non
-
Energy
18%
Q1-2012 |
 11
U.S. Rig
Counts |
 12
Hydraulic
Fracturing |
 13
U.S. Shale
Formations |
 Water Transmission |
 15
Well Positioned Industry Leader
•
Largest, most flexible capacity in the market
•
Strong relationships with public water agencies,
contractors, engineering firms
–
Assist in development process of projects prior to bidding
•
Competitive position
–
Experienced workforce
–
Low freight costs
–
Excellent reputation for quality and service
–
Wide range of capabilities to address varying market needs
–
Emphasis on continuous improvement and customer service
|
 16
Water Infrastructure Overview
•
Intakes, Raw Water Lines
•
Pump Stations
•
Pipeline Linings & Coatings (rehab)
•
Corrosion Protection/Monitoring
•
Couplings, Valves & Pumps
•
Interior & Yard Piping
•
Water Treatment Systems
•
Quality Monitoring
•
Flow Control
Sewer Treatment Products
•
Gravity Sewer Pipe & Force Mains
•
Water Quality Monitoring
•
Treatment Instrumentation
•
Manways, Culverts, & Vault Boxes
•
Water Storage Tanks
•
Commercial Water Mains
•
Residential Water Lines
•
Industrial (Power Plants, Agriculture, Mining) Systems •
Couplings, Valves & Pumps
Water Supply Products
Water
Treatment
Products
Water
Distribution
Products |
 17
Current Conditions and a Look Ahead
•
Difficult market conditions in 2012 as water
infrastructure projects compete with other
infrastructure needs and municipal funding
decreases
•
The bidding activity is significantly lower in 2012
•
Emergency drought-related work and expected
infrastructure projects in Texas should improve
results in 2013 and beyond. |
 18
Tarrant Regional Water District Integrated
Pipeline Project (IPL)
Source: Tarrant Regional Water District
http://www.trwd.com/IPLMap.aspx
•
The pipeline will run
from Lake Palestine to
Lake Benbrook, with
connections to Cedar
Creek and Richland-
Chambers Reservoirs
•
It will integrate TRWD's
existing pipelines to the
Dallas system to provide
up to an additional 350
million gallons per day
(MGD) of raw water to
North Central Texas |
 19
Timeline / Project Components
Source: Tarrant Regional Water District
http://www.trwd.com/IPLMap.aspx
•
IPL Components:
–
150 miles of buried
pipeline
•
72 -
108”
diameter
welded steel pipe*
–
3 lake intake pump
stations
–
2 booster pump stations
•
Communities Served:
–
DFW metroplex
–
Ellis County
•
Cost:
–
Estimated over $1.6 B
•
Water delivery could
begin by 2021 |
 20
Northwest Pipe Strategic Plans
•
Double EBITDA from 2011 to 2014
•
Improve margins
–
Increase yields
–
Decrease downtime
–
Decrease costs
•
Capital investment in Atchison, KS to take advantage of line pipe
market
•
Capital investment in Saginaw, TX to take advantage of large water
infrastructure opportunities seen towards end of 2013 and beyond
•
Pursue strategic investment opportunities that will encourage growth
but not distract management |
 2012 Annual Shareholder Meeting
June 14, 2012 |