Attached files
Table of Contents
UNITED STATES
SECURITIES AND EXCHANGE COMMISSION
WASHINGTON, D.C. 20549
FORM 10-K
| x | ANNUAL REPORT PURSUANT TO SECTION 13 OR 15(d) OF THE SECURITIES EXCHANGE ACT OF 1934 |
For the Fiscal Year Ended: December 31, 2009
OR
| ¨ | TRANSITION REPORT PURSUANT TO SECTION 13 OR 15(d) OF THE SECURITIES EXCHANGE ACT OF 1934 |
For the transition period from to
Commission File Number: 0-27140
NORTHWEST PIPE COMPANY
(Exact name of registrant as specified in its charter)
| OREGON | 93-0557988 | |
| (State or other jurisdiction of incorporation or organization) |
(I.R.S. Employer Identification No.) |
5721 SE Columbia Way, Suite 200
Vancouver, WA 98661
(Address of principal executive offices and zip code)
360-397-6250
(Registrant’s telephone number including area code)
Securities registered pursuant to Section 12(b) of the Act:
| Title of Each Class of Stock |
Name of Each Exchange on Which Registered | |
| Common Stock, par value $0.01 per share |
NASDAQ Global Select Market | |
| Preferred Stock Purchase Rights |
NASDAQ Global Select Market |
Securities registered pursuant to Section 12(g) of the Act: None
Indicate by check mark if the registrant is a well-known seasoned issuer, as defined in Rule 405 of the Securities Act. Yes ¨ No x
Indicate by check mark if the registrant is not required to file reports pursuant to Section 13 or Section 15(d) of the Act. Yes ¨ No x
Indicate by check mark whether the Registrant (1) has filed all reports required to be filed by Section 13 or 15(d) of the Securities Exchange Act of 1934 during the preceding 12 months (or for such shorter period that the Registrant was required to file such reports), and (2) has been subject to such filing requirements for the past 90 days. Yes ¨ No x
Indicate by check mark whether the registrant has submitted electronically and posted on its corporate Website, if any, every Interactive Data File required to be submitted and posted pursuant to Rule 405 of Regulation S-T during the preceding 12 months (or for such shorter period that the registrant was required to submit and post such files). Yes ¨ No ¨
Indicate by check mark if disclosure of delinquent filers pursuant to Item 405 of Regulation S-K is not contained herein, and will not be contained, to the best of Registrant’s knowledge, in definitive proxy or information statements incorporated by reference in Part III of this Form 10-K, or any amendment to this Form 10-K. ¨
Indicate by check mark whether the Registrant is a large accelerated filer, an accelerated filer, a non-accelerated filer, or a smaller reporting company. See definitions of “large accelerated filer”, “accelerated filer”, and “smaller reporting company” in Rule 12b-2 of the Act. (Check one):
Large accelerated filer ¨ Accelerated filer x Non-accelerated filer ¨ Smaller reporting company ¨
Indicate by check mark whether the registrant is a shell company (as defined in Rule 12b-2 of the Act). Yes ¨ No x
The aggregate market value of the common equity that was held by non-affiliates of the Registrant was $243,070,701 as of June 30, 2009 based upon the last sales price as reported by Nasdaq.
The number of shares outstanding of the Registrant’s Common Stock as of October 8, 2010 was 9,291,541 shares.
Documents Incorporated by Reference
None.
Table of Contents
2009 ANNUAL REPORT ON FORM 10-K
TABLE OF CONTENTS
Table of Contents
CAUTIONARY STATEMENT REGARDING FORWARD-LOOKING STATEMENTS
Certain statements in this Annual Report on Form 10-K for the year ended December 31, 2009 (the “2009 Form 10-K”), other than purely historical information, are “forward-looking statements” within the meaning of the Private Securities Litigation Reform Act of 1995 and Section 21E of the Securities Exchange Act of 1934, as amended (the “Exchange Act”) that are based on current expectations, estimates and projections about our business, management’s beliefs, and assumptions made by management. Words such as “expects,” “anticipates,” “intends,” “plans,” “believes,” “seeks,” “estimates,” “forecasts,” “should,” and variations of such words and similar expressions are intended to identify such forward-looking statements. These statements are not guarantees of future performance and involve a number of risks and uncertainties that are difficult to predict. Actual outcomes and results may differ materially from the results anticipated in these forward-looking statements as a result of a variety of important factors. While it is impossible to identify all such factors, those that could cause actual results to differ materially from those estimated by us include the important factors discussed in Part I – Item 1A “Risk Factors.” Such forward-looking statements speak only as of the date they are made and we do not undertake any obligation to update any forward-looking statements to reflect events or circumstances after the date of this 2009 Form 10-K. If we do update one or more forward-looking statements, investors and others should not conclude that we will make additional updates or corrections with respect thereto or with respect to other forward-looking statements.
In this 2009 Form 10-K, Northwest Pipe Company is restating and updating to reflect the effects of the restatement on the following previously issued consolidated financial statements, data and related disclosures: (i) our audited consolidated financial statements as of December 31, 2008 and for the years ended December 31, 2008 and 2007 in Part II—Item 8, “Financial Statements and Supplementary Data”; (ii) our selected financial data as of and for the years ended December 31, 2008, 2007, 2006 and 2005 in Part II—Item 6, “Selected Financial Data”; (iii) our unaudited quarterly financial data for each of the quarters in the year ended December 31, 2008 and the first two quarters in the year ended December 31, 2009 in Note 18 of our Consolidated Financial Statements in Part II—Item 8, “Financial Statements and Supplementary Data” and (iv) Part II—Item 7, “Management’s Discussion and Analysis of Financial Condition and Results of Operations” in both tabular and textual form as it relates to the years ended December 31, 2008 and 2007. References to the “Company,” “we,” “our” and “us” in this 2009 Form 10-K refer to Northwest Pipe Company together, in each case, with our subsidiaries and any predecessor entities unless the context suggests otherwise.
Concurrent with the filing of this 2009 Form 10-K, we are filing our quarterly report for the period ended September 30, 2009, which contains restated financial information for the three and nine months ended September 30, 2008. When we file our quarterly reports for the periods ended March 31, 2010 and June 30, 2010, we will also restate our financial information for the three months ended March 31, 2009 and the three and six months ended June 30, 2009, respectively. We do not plan to amend previously filed reports in connection with the restatement as we believe the expenditure of resources required to produce this information is not justified by any related benefit that would result. The financial information that has been previously filed or otherwise reported for these periods is superseded by the information in this 2009 Form 10-K.
Background of the Restatement and Extended Filing Delays
The filing of this 2009 Form 10-K has been delayed due to, among other things, the time required for the Audit Committee of our Board of Directors (the “Audit Committee”) to conduct an investigation, for us to review the issues identified in the Audit Committee investigation, and for us to restate our previously issued consolidated financial statements, data and related disclosures. As previously disclosed, the Audit Committee, with the assistance of independent professionals retained by the Audit Committee, has conducted an investigation of certain accounting matters, including certain revenue recognition practices. In addition, at the direction of the Audit Committee, we retained an external consulting firm to assist in performing certain related analyses of our accounting practices and previously issued consolidated financial statements.
i
Table of Contents
Restatement of Previously Issued Financial Statements
As previously disclosed, based upon its consideration of the issues identified in the Audit Committee investigation and the related accounting analyses, and after discussions with management and our external consultants, the Audit Committee concluded that our previously issued consolidated financial statements contained material errors and should be restated. For further detail on the financial statement impacts and the adjustments made as a result of the restatement, please see Note 2 of the Consolidated Financial Statements in Part II—Item 8, “Financial Statements and Supplementary Data”, Part II—Item 6, “Selected Financial Data” and Part II—Item 7, “ Management’s Discussion and Analysis of Financial Condition and Results of Operations.”
Ineffectiveness of Internal Control over Financial Reporting and Disclosure Controls and Procedures
Management has assessed the effectiveness of our internal control over financial reporting as of December 31, 2009 based on the framework in Internal Control-Integrated Framework issued by the Committee of Sponsoring Organizations of the Treadway Commission. Based upon our consideration of the issues identified in the Audit Committee investigation and our related accounting analyses, we have determined that certain material weaknesses in our internal controls existed as of December 31, 2009. For a description of the material weaknesses in our internal control over financial reporting and our plan to remediate those material weaknesses, see Part II—Item 9A, “Controls and Procedures” of this 2009 Form 10-K. In addition, as a result of the existence of material weaknesses in our internal controls, we have also concluded that our disclosure controls and procedures were not effective as of December 31, 2009.
ii
Table of Contents
| Item 1. | Business |
We are a leading North American manufacturer of large-diameter, high-pressure steel pipeline systems for use in water infrastructure applications, primarily related to drinking water systems. Our pipeline systems are also used for hydroelectric power systems, wastewater systems and other applications. With a history that dates back more than 100 years, we have established a leading position based on a strong, widely recognized reputation for quality and service and an extensive array of product offerings. Our manufacturing facilities in North America are strategically located to provide us with broad geographic coverage of our target markets, giving us competitive advantages in serving our customers.
We manufacture water infrastructure products through our Water Transmission Group, which in 2009, 2008 and 2007 generated approximately 76%, 63%, and 74%, respectively, of our net sales. We market our water infrastructure products through an in-house sales force. Our sales have historically been driven by the need for new water infrastructure, which is based primarily on overall population growth and population movement between regions. We believe the need for new water infrastructure, upgrades, repairs and replacements will continue to be a significant demand factor for us.
In addition to manufacturing water infrastructure products, we also manufacture other welded steel products through our Tubular Products Group, which in 2009, 2008, and 2007 generated approximately 24%, 37% and 26%, respectively, of our net sales. Tubular products are marketed through a network of direct sales force personnel, sales agents, and independent distributors. Our Tubular Products Group has the capability to manufacture a broad array of small-diameter, electric resistance welded (“ERW”) steel pipe for use in a wide range of applications, including energy, construction, agricultural, industrial, and traffic signpost systems.
We have also invested in an unconsolidated subsidiary, Northwest Pipe Asia, located in Singapore. Northwest Pipe Asia has established temporary operations in Batam, Indonesia to produce structural piling to be supplied to a construction project in Singapore.
Our Industries
Water Transmission. The U.S. market for water delivery equipment and systems is estimated to be approximately $14 billion annually. Within this market, we focus on engineered pipeline systems that utilize large-diameter, high-pressure steel pipe. In addition to these water infrastructure applications, our Water Transmission Group manufactures products for certain structural piling applications and in-plant pipeline systems for power plants and other industrial applications. We believe the current addressable market for the products sold by our Water Transmission Group will total approximately $2 billion over the next three years. Our core market is the large-diameter, high-pressure portion of the pipeline that is typically at the “upper end” of a pipeline system. This is the portion of the overall water pipeline that generally transports water from the source to a treatment plant or from a treatment plant into the distribution system, rather than the small lines that deliver water directly into households.
A combination of population growth, movement to new population centers, dwindling supplies from developed water sources, substantial underinvestment in water infrastructure over the past several decades, and an increasingly stringent regulatory environment are driving demand for water infrastructure projects in the United States. These trends are increasing the need for new water infrastructure as well as the need to upgrade, repair and replace existing water infrastructure, and we believe this offers potential for increased demand for our water infrastructure products and other products related to water transmission and distribution.
The primary drivers of growth in new water infrastructure installation are population growth and movement and dwindling supplies from developed water sources. According to the U.S. Census Bureau, the population of the United States will increase by over 90 million people between 2010 and 2050. The resulting increase in
1
Table of Contents
demand will require substantial new infrastructure, as the existing U.S. water infrastructure is not equipped to provide water to millions of new residents. The combination of population growth and movement is projected to result in approximately 50 million new residents in the southern and western regions of the United States. In addition, many current water supply sources are in danger of being exhausted. The development of new sources of water at greater distances from population centers will drive the demand for new water transmission lines. Our manufacturing facilities are well located to take advantage of the anticipated growth and demand in these regions.
Much of the U.S. water infrastructure is antiquated and many authorities, including the U.S. Environmental Protection Agency (the “EPA”), believe the U.S. water infrastructure is in critical need of updates, repairs or replacements. The American Society of Civil Engineers has given poor ratings to many aspects of the U.S. water infrastructure in their 2009 Report Card for America’s Infrastructure. In the fourth national assessment of public water system infrastructure, the EPA in 2009 estimated that a total investment of approximately $335 billion will be needed to install, upgrade and replace infrastructure over the next 20 years. The EPA estimates that approximately $201 billion of this needed investment applies to the rehabilitation or replacement of deteriorated or undersized water transmission and distribution infrastructure components.
Increased public awareness of problems with the quality of drinking water and efficient water usage has resulted in more stringent application of federal and state environmental regulations. The need to comply with these regulations in an environment of heightened public awareness towards water issues is expected to contribute to demand in the water infrastructure industry over the next several years. Water systems will need to be installed, upgraded and replaced in order to satisfy these water quality laws and regulations.
Tubular Products. The tubular products industry encompasses a wide variety of products serving a diverse group of end markets. We have been active in several of these markets, including energy pipe, standard pipe, structural pipe and traffic signpost systems. In 2009, the tubular products industry experienced an oversaturation of imported pipe and a collapse of natural gas prices in a very short time frame. In addition, non-residential construction declined. These factors had a severe negative impact on all of our tubular products. However, we believe energy products offer significant growth opportunities in the near future, and we intend to capitalize on this potential. In the fourth quarter of 2009, we finalized installation of a pipe mill repositioned from our Portland, Oregon facility to our Bossier City, Louisiana facility. This equipment provides expanded production for the energy market, namely, oil country tubular goods. We began limited production of pipe for the oil country tubular goods market at this plant in the first quarter of 2010. Certain pipe finishing and inspection processes are complete and are expected to be fully functioning by the end of 2010. During 2009 we redirected the focus of our Houston, Texas plant from mechanical tubing to energy pipe production and began production of energy pipe there in April 2010.
Products
Water Transmission. Water transmission pipe is used for high-pressure applications, typically requiring pipe to withstand pressures in excess of 150 pounds per square inch. Most of our water transmission products are made to custom specifications and are for fully engineered, large diameter, high-pressure water infrastructure systems. Other uses include pipe for piling and hydroelectric projects, wastewater transmission, treatment plants and other applications. Our primary manufacturing process has the capability to manufacture water transmission pipe in diameters ranging from 4.5 inches to 156 inches with wall thickness of 0.135 inches to 1.00 inch. We also have the ability to manufacture even larger and heavier pipe with other processes. We can coat and/or line these products with cement mortar, polyethylene tape, polyurethane paints, epoxies, Pritec®, and coal tar enamel according to our customers’ specifications. We maintain fabrication facilities that provide installation contractors with custom fabricated sections as well as straight pipe sections. We typically deliver a complete pipeline system to the installation contractor.
2
Table of Contents
Tubular Products. Our tubular products range in size from 1.5 inches to 16 inches in diameter with wall thickness from 0.035 inches to 0.375 inches. These products are typically sold to distributors or Original Equipment Manufacturers (OEMs) and are used for a wide variety of applications, including energy, construction, agriculture and traffic signpost systems.
Marketing
Water Transmission. The primary customers for water transmission products are installation contractors for projects funded by public water agencies. Our plant locations in Oregon, Colorado, California, West Virginia, Texas, Utah and Mexico allow us to efficiently serve customers throughout the United States, as well as Canada and Mexico. Our water transmission marketing strategy emphasizes early identification of potential water projects, promotion of specifications consistent with our capabilities and close contact with the project designers and owners throughout the design phase. Our in-house sales force is comprised of sales representatives, engineers and support personnel who work closely with public water agencies, contractors and engineering firms, often years in advance of projects being bid. This allows us to identify and evaluate planned projects at early stages and participate in the engineering and design process and ultimately promote the advantages of our systems. After an agency completes a design, they publicize the upcoming bid for a water transmission project. We then obtain detailed plans and develop our estimate for the pipe portion of the project. We typically bid to installation contractors who include our bid in their proposals to public water agencies. A public water agency generally awards the entire project to the contractor with the lowest responsive bid.
Tubular Products. Our tubular products are marketed through a network of direct sales force personnel, sales agents, and independent distributors in the United States and Canada. Our tubular product facilities are located in Kansas, Texas, and Louisiana. Our marketing strategy focuses on quality, customer service and customer relationships. For example, we are willing to sell in small lot sizes and are able to provide mixed truckloads of finished products to our customers. Our tubular products are primarily sold to distributors, although to a lesser extent we also sell to OEMs. Our sales effort emphasizes regular personal contact with current and potential customers. We supplement this effort with targeted advertising and brochures and participation in trade shows.
Manufacturing
Water Transmission. Water transmission manufacturing begins with the preparation of engineered drawings of each unique piece of pipe in a project. These drawings are prepared on our proprietary computer-aided design system and are used as blueprints for the manufacture of the pipe. After the drawings are completed and approved, manufacturing begins by feeding steel coil continuously at a specified angle into a spiral weld mill which cold-forms the band into a tubular configuration with a spiral seam. Automated arc welders, positioned on both the inside and the outside of the tube, are used to weld the seam. The welded tube is then cut at the specified length. After completion of the forming and welding phases, the finished cylinder is tested and inspected in accordance with project specifications, which may include 100% radiographic analysis of the weld seam. The cylinders are then coated and lined as specified. Possible coatings include coal tar enamel, polyethylene tape, polyurethane paint, epoxies, Pritec® and cement mortar. Linings may be cement mortar, polyurethane or epoxies. Following coating and lining, certain pieces may be custom fabricated as required for the project. This process is performed in our fabrication facilities. Upon final inspection, the pipe is prepared for shipment. We ship our products to project sites principally by truck and rail.
Tubular Products. Tubular products are manufactured by an ERW process in diameters ranging from 1.5 inches to 16 inches. This process begins by unrolling and slitting steel coils into narrower bands sized to the circumference of the finished product. Each band is re-coiled and fed into the material handling equipment at the front end of the ERW mill and fed through a series of rolls that cold-form it into a tubular configuration. The resultant tube is welded by high-frequency electric resistance welders. Some products are reconfigured into rectangular and square shapes and then cut into the appropriate lengths. After exiting the mill, the products are straightened, inspected, tested and end-finished. Certain products are coated.
3
Table of Contents
Technology. Advances in technology help us produce high quality products at competitive prices. We continue to invest in technological improvements, which include the addition of a state of the art edge milling machine to prepare steel edges for optimum welding quality and speed. To stay current with technological developments in the United States and abroad, we participate in trade shows, industry associations, research projects and vendor trials of new products.
Quality Assurance. We have quality management systems in place that assure we consistently provide products that meet or exceed customer and applicable regulatory requirements. The Quality Assurance department reports directly to the Chief Executive Officer. All of our quality management systems in the United States are registered by the International Organization for Standardization, or ISO, under a multi-site registration. In addition to ISO qualification, the American Institute of Steel Construction, American Petroleum Institute, American Society for Mechanical Engineers, Factory Mutual, National Sanitation Foundation, and Underwriters Laboratory have certified us for specific products or operations. The Quality Assurance department is responsible for monitoring and measuring characteristics of the product. Inspection capabilities include, but are not limited to, visual, dimensional, liquid penetrant, magnetic particle, hydrostatic, ultrasonic, phased array ultrasonics, real-time imaging enhancement, real-time radioscopic, base material tensile, yield and elongation, sand sieve analysis, coal-tar penetration, concrete compression, lining and coating dry film thickness, adhesion, absorption, guided bend, charpy impact, hardness, metallurgical examinations, chemical analysis, spectrographic analysis and finished product final inspection. Product is not released for shipment to our customers until there is verification that all product requirements have been met.
Product Liability. The manufacturing and use of our products involves a variety of risks. Certain losses may result, or be alleged to result, from defects in our products, thereby subjecting us to claims for damages, including consequential damages. We warrant our products to be free of certain defects for one year. We maintain insurance coverage against potential product liability claims in the amount of $52 million, which we believe to be adequate. However, there can be no assurance that product liability claims exceeding our insurance coverage will not be experienced in the future or that we will be able to maintain such insurance with adequate coverage.
Backlog
Our backlog includes confirmed orders, including the balance of projects in process, and projects for which we have been notified that we are the successful bidder even though a binding agreement has not been executed. Projects for which a binding contract has not been executed could be cancelled. Binding orders received by us may be subject to cancellation or postponement; however, cancellation would generally obligate the customer to pay the costs incurred by us. As of December 31, 2009, our backlog of orders was approximately $222 million. Our Water Transmission segment accounted for approximately 90% of the total backlog of orders, and included backlog from one project of $55.3 million. Binding contracts had been executed for this backlog as of September 30, 2010. Backlog as of any particular date may not be indicative of actual operating results for any fiscal period. There can be no assurance that any amount of backlog ultimately will be realized.
Competition
Water Transmission. We have several regional competitors in the Water Transmission business. Most water transmission projects are competitively bid and price competition is vigorous. Price competition may reduce the gross margin on sales, which may adversely affect overall profitability. Other competitive factors include timely delivery, ability to meet customized specifications and high freight costs which may limit the ability of manufacturers located in other market areas to compete with us. With Water Transmission manufacturing facilities in Oregon, Colorado, California, West Virginia, Texas, Utah and Mexico, we believe we can more effectively compete throughout the United States, Canada and Mexico. Our primary competitor in the water transmission business in the western United States and southwestern Canada is Ameron International, Inc. East of
4
Table of Contents
the Rocky Mountains, our primary competition includes: American Cast Iron Pipe Company and Mueller Water Products, both of which manufacture ductile iron pipe; American Spiral Weld Pipe Company, which manufactures spiral welded steel pipe; and Hanson Pipe & Precast, which manufactures concrete pressure pipe and spiral welded steel pipe.
No assurance can be given that other new or existing competitors will not establish new facilities or expand capacity within our market areas. New or expanded facilities or new competitors could have a material adverse effect on our ability to capture market share and maintain product pricing.
Tubular Products. The market for tubular products is highly fragmented and diversified with over 100 manufacturers in the United States and a number of foreign-based manufacturers that export such pipe into the United States. Manufacturers compete with one another primarily on the basis of price, quality, established business relationships, customer service and delivery. In some of the sectors within the tubular products industry, competition may be less vigorous due to the existence of a relatively small number of companies with the capabilities to manufacture certain products. In particular, we operate in a variety of different markets that require pipe with lighter wall thickness in relation to diameter than many of our competitors can manufacture. In our markets, we typically compete with Lindsay Corporation, Valmont Industries, Inc., Tex Tube, TMK Ipsco, Tenaris, U.S. Steel, Allied Tube and Conduit Corp. and John Maneely Company, as well as foreign competitors.
Additionally, several companies have announced new plants or the expansion of product lines at existing facilities. New or expanded facilities or new competitors could have a material adverse affect on our ability to capture market share and maintain product pricing.
Raw Materials and Supplies
We purchase hot rolled and galvanized steel coil from both domestic and foreign steel mills. Domestic suppliers include ArcelorMittal, SSAB, New Process Steel, Nucor Corporation, Gallatin Steel Company, California Steel Industries, Steel Dynamics, Inc., SeverStal, U.S. Steel Corporation and NLMK Indiana. Foreign suppliers include BlueScope Steel and Ternium. We order steel according to our business forecasts for our Tubular Products business. Steel for the Water Transmission business is normally purchased only after a project has been awarded to us. From time to time, we may purchase additional steel when it is available at favorable prices. Purchased steel represents a substantial portion of our cost of sales. The steel industry is highly cyclical in nature and steel prices are influenced by numerous factors beyond our control, including general economic conditions, availability of raw materials, energy costs, import duties, other trade restrictions and currency exchange rates.
We also rely on certain suppliers of coating materials, lining materials and certain custom fabricated items. We have at least two suppliers for most of our raw materials. We believe our relationships with our suppliers are positive and have no indication that we will experience shortages of raw materials or components essential to our production processes or that we will be forced to seek alternative sources of supply. Any shortages of raw materials may result in production delays and costs, which could have a material adverse effect on our financial position, results of operations or cash flows.
Environmental and Occupational Safety and Health Regulation
We are subject to federal, state, local and foreign environmental and occupational safety and health laws and regulations, violation of which could lead to fines, penalties, other civil sanctions or criminal sanctions. These environmental laws and regulations govern emissions to air; discharges to water (including storm water); and the generation, handling, storage, transportation, treatment and disposal of waste materials. We are also subject to environmental laws requiring the investigation and cleanup of environmental contamination at properties we presently own or operate and at third-party disposal or treatment facilities to which these sites send or arrange to send hazardous waste. For example, we have been identified as a potentially responsible party at the Portland
5
Table of Contents
Harbor Site discussed under “Legal Proceedings” below. We believe we are in material compliance with these laws and regulations and do not currently believe that future compliance with such laws and regulations will have a material adverse effect on our financial position, results of operations or cash flows.
Based on our assessment of potential liability, we have no reserves for environmental investigations and cleanup. However, estimating liabilities for environmental investigations and cleanup is complex and dependent upon a number of factors beyond our control which may change dramatically. Accordingly, although we believe maintaining no reserve is appropriate based on current information, we cannot assure you that our future environmental investigation and cleanup costs and liabilities will not result in a material expense.
We operate under numerous governmental permits and licenses relating to air emissions, storm-water run-off and other environmental matters. In September and October of 2009, we received several notices of violation and notices to comply from the Mohave Desert Air Quality Management District (“District”) for violations of permitted particulate matter emissions limits and other violations at our Adelanto, California facility. We are negotiating with the District to settle these matters. We do not believe that resolution of these matters will result in material adverse effects on our business, financial condition, results of operations or cash flows.
Employees
As of December 31, 2009, we had approximately 1,100 full-time employees. Approximately 28% were salaried and approximately 72% were employed on an hourly basis. A union represents all of the hourly employees at our Monterrey, Mexico facility. All other employees are non-union. We consider our relations with our employees to be good.
Available Information
Our internet website address is www.nwpipe.com. Our Annual Report on Form 10-K, quarterly reports on Form 10-Q, current reports on Form 8-K and amendments to those reports filed or furnished pursuant to Section 13 or 15(d) of the Exchange Act are available through our internet website as soon as reasonably practical after we electronically file such material with, or furnish it to, the SEC. Financial information that has been previously filed or otherwise reported for the periods contained in this 2009 Form 10-K, and related earnings press releases and similar communications issued by us describing our financial statements for these periods should not be relied upon and are superseded in their entirety by this 2009 Form 10-K. All statements made in any of our securities filings, including all forward-looking statements or information, are made as of the date of the document in which the statement is included, and we do not assume or undertake any obligation to update any of those statements or documents unless we are required to do so by law. Our internet website and the information contained therein or connected thereto are not incorporated into this 2009 Form 10-K.
Additionally, the public may read and copy any materials we file with the SEC at the SEC’s Public Reference Room at 100 F Street, N.W., Washington D.C. 20549. The public may obtain information on the operation of the Public Reference Room by calling the SEC at 1-800-SEC-0330. The SEC also maintains an Internet site that contains reports, proxy and information statements, and other information regarding issuers that file electronically with the SEC at www.sec.gov.
| Item 1A. | Risk Factors |
You should carefully consider the following factors, together with all the other information included in this 2009 Form 10-K, in evaluating our Company and our business. If any of the following risks actually occur, our business, financial condition, results of operations, or cash flows could be materially and adversely affected, and the value of our stock could decline. The risks and uncertainties described below are those that we currently believe may materially affect our Company. Additional risks and uncertainties not presently known to us or that we currently deem immaterial also may impair our business operations. As such, you should not consider this list to be a complete statement of all potential risks or uncertainties.
6
Table of Contents
Risks Related to the State of Our Internal Control Over Financial Reporting, the Restatement of Our Financial Statements and Our Failure to Timely File Periodic Reports with the SEC.
Matters relating to or arising from our Audit Committee investigation of certain accounting matters, including regulatory proceedings, litigation matters and potential additional expenses, may adversely affect our business and results of operations. We recently concluded an investigation conducted by the Audit Committee of the Board of Directors with the assistance of independent professionals retained by the Audit Committee, the focus of which related to certain accounting matters, including certain revenue recognition practices. In addition, at the direction of the Audit Committee, an external consulting firm was retained to assist in performing certain related analyses of our accounting practices and previously issued consolidated financial statements. As previously disclosed, based upon its consideration of the issues identified in the Audit Committee investigation and the related accounting analyses, the Audit Committee concluded that certain of our previously issued consolidated financial statements contained material errors and should be restated. To date, we have incurred significant expenses related to legal, accounting, and other professional services in connection with the investigation, the restatement and related matters, and may continue to incur significant additional expenses with regard to these matters and our remediation efforts. In addition, our Chief Executive Officer (“CEO”) and Chief Financial Officer (“CFO”), as well as senior members of our finance and accounting departments, have spent substantial amounts of time and effort with regard to the investigation and related accounting analyses, the restatement and related matters. The significant amount of time and effort spent by our management team on these matters has diverted, and is expected to continue to divert, their attention from the operation of our business. The expenses incurred, and expected to be incurred, on the investigation, the restatement and related matters, and the diversion of the attention of the management team which has occurred and is expected to continue, has, and could continue to have, a material adverse effect on our business, financial condition, results of operations or cash flows.
Our Audit Committee and management have identified material weaknesses in our internal controls over financial reporting, and we may be unable to develop, implement and maintain appropriate controls in future periods. The Sarbanes-Oxley Act of 2002 and SEC rules require that management report annually on the effectiveness of our internal control over financial reporting and our disclosure controls and procedures. Among other things, management must conduct an assessment of our internal control over financial reporting to allow management to report on, and our independent registered public accounting firm to audit, the effectiveness of our internal control over financial reporting, as required by Section 404 of the Sarbanes-Oxley Act. Based on our management’s assessment, we believe that, as of December 31, 2009, our internal controls over financial reporting were not effective. The specific material weaknesses are described in Part II—Item 9A, “Controls and Procedures” of this 2009 Form 10-K in “Management’s Report on Internal Control over Financial Reporting”. A “material weakness” is a deficiency, or a combination of deficiencies, in internal control over financial reporting, such that there is a reasonable possibility that a material misstatement of our annual or interim consolidated financial statements would not be prevented or detected. We cannot assure you that additional material weaknesses in our internal control over financial reporting will not be identified in the future. Any failure to maintain or implement required new or improved controls, or any difficulties we encounter in their implementation, could result in additional material weaknesses, or could result in material misstatements in our financial statements. These misstatements could result in a further restatement of financial statements, cause us to fail to meet our reporting obligations or cause investors to lose confidence in our reported financial information, leading to a decline in our stock price.
We have work remaining to remedy the material weaknesses in our internal control over financial reporting. We are in the process of developing and implementing our remediation plan for the identified material weaknesses, and this work will continue during fiscal year 2010 and thereafter. There can be no assurance as to when the remediation plan will be fully developed, when it will be fully implemented and the aggregate cost of implementation. Until our remediation plan is fully implemented, we will continue to devote significant time and attention to these efforts. If we do not complete our remediation in a timely fashion, or at all, or if our remediation plan is inadequate, there will continue to be an increased risk that we will be unable to timely file future periodic reports with the SEC and that our future financial statements could contain errors that will be
7
Table of Contents
undetected. We will rely upon additional interim control procedures prescribed by management, including the use of manual mitigating control procedures and the utilization of external consultants, to fairly state our financial statements in all material respects. However, the establishment of these interim controls does not provide the same degree of assurance as a Company remediated control environment. Further and continued determinations that there are material weaknesses in the effectiveness of our internal controls could also reduce our ability to obtain financing or could increase the cost of any financing we obtain and require additional expenditures of both money and management’s time to comply with applicable requirements. For more information relating to our internal control over financial reporting and disclosure controls and procedures, and the remediation plan undertaken by us, see Part II—Item 9A, “Controls and Procedures” of this 2009 Form 10-K.
Our failure to prepare and timely file our periodic reports with the SEC limits our access to the public markets to raise debt or equity capital. We did not file this 2009 Form 10-K, nor the Form 10-Q for the third quarter of 2009 and the first and second quarters of 2010, within the timeframe required by the SEC. Because we are not current in our reporting requirements with the SEC, we are limited in our ability to access the public markets to raise debt or equity capital. Our limited ability to access the public markets could prevent us from pursuing transactions or implementing business strategies that we believe would be beneficial to our business. Until one year after the date we regain compliance with our SEC reporting obligations, we will be ineligible to use shorter and less costly filings, such as Form S-3, to register our securities for sale. We may use Form S-1 to register a sale of our stock to raise capital or complete acquisitions, but doing so would likely increase transaction costs and adversely impact our ability to raise capital or complete acquisitions of other companies in a timely manner.
Outstanding comments from past SEC staff review and any additional comments from future SEC staff review may require that we amend our periodic reports filed with the SEC, which could lead to significant changes in our past and current disclosure. On July 23, 2009, we received correspondence from the staff of the SEC relating to our Form 10-K for the fiscal year ended December 31, 2008 (the “2008 Form 10-K”) and our Definitive Proxy Statement filed on April 3, 2009 (the “2009 Proxy Statement”). We have subsequently engaged in communications and correspondence with the SEC staff, and as of the date of this filing, we have outstanding unresolved comments from the SEC staff with respect to disclosure contained in our 2008 Form 10-K and 2009 Proxy Statement. We have modified the disclosure in this 2009 Form 10-K in an effort to reflect all of the SEC staff’s prior comments. We believe that the SEC staff is waiting to resolve the outstanding comments until after we have filed this 2009 Form 10-K. As a result, we may receive additional comments from the SEC staff relating to our responses to the prior staff comments, new matters related to this 2009 Form 10-K or other periodic reports filed by us with the SEC. Such comments may require that we amend or supplement, possibly significantly, the disclosures in this 2009 Form 10-K, including the restated consolidated financial statements included herein, or other periodic reports filed by us with the SEC.
Certain of our periodic reports filed with the SEC are inaccurate and cannot be relied upon. We have not amended and do not plan to amend our Annual Reports on Form 10-K and Quarterly Reports on Form 10-Q that have been filed by us prior to the date of this 2009 Form 10-K. Accordingly, the consolidated financial statements and related financial information contained in such reports should not be relied upon as described in our Current Report on Form 8-K filed on July 30, 2010. For the same reason, investors also should not rely on the unaudited financial results reported in Current Reports on Form 8-K prior to the date of this 2009 Form 10-K.
Risks Related to the Pending SEC Investigation and Pending Litigation Arising Out of our Restatement
The SEC’s formal investigation and pending putative securities class action and derivative litigation have resulted in significant costs and expenses, have diverted resources and could have a material adverse effect on our business, financial condition, results of operations or cash flows. As further described in Part I—Item 3, “Legal Proceedings” of this 2009 Form 10-K, we were advised by the staff of the SEC Enforcement Division that the SEC has commenced a formal investigation. As also further described in Part I—Item 3, “Legal Proceedings” of this 2009 Form 10-K, several lawsuits, including two putative shareholder class
8
Table of Contents
action complaints (that have since been consolidated into one action) and one putative derivative complaint have been filed against us and certain of our current and former officers and directors arising out of our announcement of the Audit Committee investigation and related matters. We have incurred significant professional fees and other costs in responding to the SEC investigation and in defending against the lawsuits. We expect to continue to incur significant professional fees and other costs in responding to the SEC investigation and in defending against these lawsuits. If we do not prevail in one or more of these lawsuits, we may be required to pay a significant amount of monetary damages. Further, if the SEC were to conclude that enforcement action is appropriate, we could be required to pay large civil penalties and fines. The SEC also could impose other sanctions against us or certain of our current and former directors and officers. Any of these events would have a material adverse effect on our business, financial condition, results of operations, or cash flows. Additionally, while we believe we have made appropriate judgments in determining the correct adjustments in preparing our restated consolidated financial statements, the SEC may disagree with the manner in which we have accounted for and reported these adjustments. Accordingly, there is a risk that we may have to further restate our historical consolidated financial statements, amend prior filings with the SEC or take other actions not currently contemplated. In addition, our Board of Directors, management and employees have expended a substantial amount of time on the SEC investigation and pending litigation, diverting a significant amount of resources and attention that would otherwise be directed toward our operations and implementation of our business strategy, all of which could materially adversely affect our business, financial condition, results of operations or cash flows.
Our indemnification obligations and limitations of our director and officer liability insurance may have a material adverse effect on our financial condition, results of operations and cash flows. Under Oregon law, our articles of incorporation and bylaws and certain indemnification agreements to which we are a party, we have an obligation to indemnify, or we have otherwise agreed to indemnify, certain of our current and former directors and officers with respect to current and future investigations and litigation, including the matters discussed in Part I—Item 3, “Legal Proceedings.” In connection with some of these pending matters, we are required to, or we have otherwise agreed to, advance, and have advanced, legal fees and related expenses to certain of our current and former directors and officers and expect to continue to do so while these matters are pending. Certain of these obligations may not be “covered matters” under our directors’ and officers’ liability insurance, or there may be insufficient coverage available. Further, in the event the directors and officers are ultimately determined to not be entitled to indemnification, we may not be able to recover the amounts we previously advanced to them.
In addition, we have incurred significant expenses in connection with the pending SEC investigation and litigation. We cannot provide any assurances that pending claims, or claims yet to arise, will not exceed the limits of our insurance policies, that such claims are covered by the terms of our insurance policies or that our insurance carrier will be able to cover our claims. The insurers also may seek to deny or limit coverage in some or all of these matters. Furthermore, the insurers could become insolvent and unable to fulfill their obligation to defend, pay or reimburse us for insured claims. Accordingly, we cannot be sure that claims will not arise that are in excess of the limits of our insurance or that are not covered by the terms of our insurance policy. Due to these coverage limitations, we may incur significant unreimbursed costs to satisfy our indemnification obligations, which may have a material adverse effect on our business, financial condition, results of operations or cash flows.
Continuing negative publicity may have a material adverse effect on our business, financial condition, results of operations or cash flows. As a result of the ongoing SEC investigation, shareholder and derivative litigation, Nasdaq delisting proceedings, restatement of our financial statements and related matters, we have been the subject of negative publicity. This negative publicity may adversely affect our stock price and may harm our reputation and our relationships with current and future investors, lenders, customers, suppliers and employees. As a result, our business, financial condition, results of operations or cash flows may be materially adversely affected.
9
Table of Contents
Risks Related to Our Financial Condition
Our significant debt obligations and the restrictions under which we operate as a result of our debt obligations could have a material adverse effect on our business, financial condition, results of operations or cash flows. We have financed our operations through cash flows from operations, available borrowings and other financing arrangements. As of December 31, 2009, we had approximately $57.8 million of outstanding debt and capital lease obligations.
Our debt and our debt service obligations could:
| • | limit our ability to obtain additional financing for working capital or other purposes in the future; |
| • | reduce the amount of funds available to finance our operations, capital expenditures and other activities; |
| • | increase our vulnerability to economic downturns, illiquid capital markets, and adverse industry conditions; |
| • | limit our flexibility in responding to changing business and economic conditions, including increased competition; |
| • | place us at a disadvantage when compared to our competitors that have less debt; and |
| • | with respect to our borrowings that bear interest at variable rates, cause us to be vulnerable to increases in interest rates. |
Our ability to make scheduled payments on our debt will depend on our future operating performance and cash flows, which are subject to prevailing economic conditions, prevailing interest rate levels and other financial, competitive and business factors, many of which are beyond our control. Our inability to make scheduled payments on our debt or any of the foregoing factors would have a material adverse effect on our business, financial condition, results of operations, or cash flows.
We will need to substantially increase working capital when market conditions and customer order levels improve. As business conditions deteriorated in 2009, we reduced working capital by $70.0 million. When market conditions and customer order levels improve we will have to increase our working capital substantially, as it will take several months for new orders to be translated into cash receipts. In general, availability under our credit agreement, which was amended in 2010, is limited to $110 million. We may not have sufficient availability under this agreement to borrow the amounts we need, and other opportunities to borrow additional funds or raise capital in the equity markets may be limited or nonexistent. A shortage in the availability of working capital would have a material adverse effect on our business, financial condition, results of operations, or cash flows.
Our failure to comply with covenants in our debt instruments could result in our indebtedness being immediately due and payable, which would have a material adverse effect on our business, financial condition, results of operations or cash flows. The agreements governing our outstanding debt include financial and other restrictive covenants that impose certain requirements with respect to our financial condition and results of operations and general business activities. These covenants require us to maintain certain financial ratios and place restrictions on, among other things, our ability to incur certain additional debt and to create liens or other encumbrances on assets. As a result of the Audit Committee investigation, we have been unable to comply with covenants requiring us to provide our lenders with audited financial statements and interim financial information on a timely basis. In addition, we failed to comply with certain of the financial covenants in our debt instruments at December 31, 2009. However, subsequent to December 31, 2009, we have entered into amendments to our debt instruments which have included waivers to, or changes in, the financial and other covenants included in such debt instruments such that we have not experienced a default under any of our debt instruments. These amendments have also reduced the amount available to us under our line of credit, increased
10
Table of Contents
the interest rates payable under these debt instruments and imposed substantial amendment fees. Effective as of October 15, 2010, we have entered into the most recent amendments to our debt instruments which are described in Note 17 “Subsequent Events” of the Notes to Consolidated Financial Statements in Part II—Item 8, “Financial Statements and Supplementary Data”.
Our ability to comply with the financial and other covenants under our debt instruments in the future is uncertain and will be affected by our results of operations and financial condition as well as other events and circumstances beyond our control. If market and other economic conditions do not improve, our ability to comply with these covenants may be impaired. A failure to comply with the requirements of these covenants, if not waived or cured, could permit acceleration of the related debt and acceleration of debt under other instruments that include cross-acceleration or cross-default provisions. If any of our debt is accelerated, we cannot assure you that we would have sufficient assets to repay such debt or that we would be able to refinance such debt on commercially reasonable terms or at all. The acceleration of a significant portion of our debt would have a material adverse effect on our business, financial condition, results of operations, or cash flows.
Recent disruptions in the financial markets and the general economic slowdown could cause us to be unable to obtain financing and expose us to risks related to the overall macro-economic environment, which could have a material adverse effect on our business, financial condition, results of operations or cash flows. The United States equity and credit markets have recently experienced significant price volatility, dislocations and liquidity disruptions, which have caused market prices of many equities to fluctuate substantially and the spreads on prospective debt financings to widen considerably. These circumstances have materially impacted liquidity in the financial markets, making terms for certain financings less attractive, and in some cases have resulted in the unavailability of financing, even for companies who are otherwise qualified to obtain financing. These events may make it less likely that we will be able to obtain additional financing and also may make it more difficult or prohibitively costly for us to raise capital through the issuance of debt or equity securities.
Risks Related to our Business
The success of our business is affected by general economic conditions, and our business may be adversely affected by an economic slowdown or recession. Periods of economic slowdown or recession in the United States, or the public perception that one may occur, have and could further decrease the demand for our products, affect the price of our products and adversely impact our business. We have been impacted in the past by the general slowing of the economy, and the recent economic slowdown has had an adverse impact on our business, financial position, results of operations or cash flows. In particular, our Tubular Products Group is exposed to the energy exploration, highway spending, non-residential construction, and agriculture markets, and a significant downturn in any one of these markets could cause a reduction in our revenues that could be difficult to offset.
Our exposure to the energy market is growing. Products serving the energy market, including line pipe and oil country tubular goods, comprised over 85% of the backlog in the Tubular Products Group at December 31, 2009. Sales of these products are tied to the exploration, development, and production of natural gas and oil reserves. Factors affecting the profitability of exploration and production of hydrocarbons such as the price of oil and gas will have an effect on the market for energy pipe products. The current outlook remains consistent with stable levels of exploration and production activity, but a decline in this activity could adversely affect our business. The energy market has a history of extreme volatility, and for 2009, sales of our energy pipe products fell by 79% compared to 2008. We cannot provide assurance that there will not be similar volatility in the future, which would have an adverse effect on our business, financial position, results of operations, or cash flows.
Increased levels of imports could adversely affect pricing and demand for our products serving the energy market. Although certain imported steel products from China have been curtailed by anti-dumping
11
Table of Contents
duties, imported products from other countries have increased, notably from Canada and Italy, and imports from Korea and India continue to command significant market share. Any increase in imports of steel products that compete with our products serving the energy market could have a material adverse effect on our business, financial condition, results of operations, or cash flows.
A downturn in government spending related to public water transmission projects would adversely affect our business. Our water transmission business accounted for approximately 76% of our net sales in 2009. Our water transmission business is primarily dependent upon spending on public water transmission projects, including water infrastructure upgrades, repairs and replacement and new water infrastructure spending, which, in turn, depends on, among other things:
| • | the need for new or replacement infrastructure; |
| • | the priorities placed on various projects by governmental entities; |
| • | federal, state and local government spending levels, including budgetary constraints related to capital projects and the ability to obtain financing; and |
| • | the ability of governmental entities to obtain environmental approvals, right-of-way permits and other required approvals and permits. |
Decreases in the number of, or government funding of, public water transmission projects would adversely affect our business, financial position, results of operations, or cash flows.
Project delays in public water transmission projects could adversely affect our business. The public water agencies constructing water transmission projects generally announce the projects well in advance of the bidding and construction process. It is not unusual for projects to be delayed and rescheduled. Projects are delayed and rescheduled for a number of reasons, including changes in project priorities, difficulties in complying with environmental and other government regulations and additional time required to acquire rights-of-way or property rights. Delays in public water transmission projects may occur with too little notice to allow us to replace those projects in our manufacturing schedules. As a result, our business, financial position, results of operations or cash flows may be adversely affected by unplanned downtime.
We operate in highly competitive industries, and increased competition could reduce our gross profit and net income. We face significant competition in all of our businesses. We have recently seen new domestic and foreign competitors bidding on projects. Orders in the water transmission business are competitively bid, and price competition can be vigorous. Price competition may reduce the gross margin on sales, which may adversely affect overall profitability. Other competitive factors include timely delivery, ability to meet customized specifications and high freight costs. Although our Water Transmission manufacturing facilities in Oregon, Colorado, California, West Virginia, Texas, Utah and Mexico allow us to compete throughout the United States, Canada and Mexico, we cannot assure you that new or existing competitors will not establish new facilities or expand capacity within our market areas. New or expanded facilities or new competitors could have a material adverse effect on our market share and product pricing in our water transmission business. There are many competitors in the Tubular Products business, and price is often a prime consideration for purchase of our products. Price competition may reduce our gross profit, which may adversely affect our net income. Some of our competitors have greater financial, technical and marketing resources than we do. We cannot assure you that we will be able to compete successfully with our competitors. Failure to compete successfully could reduce our gross profit and net income, as well as have a material adverse effect on our business, financial position, results of operations or cash flows.
12
Table of Contents
Operating problems in our business could adversely affect our business, financial position, results of operations or cash flows. Our manufacturing operations are subject to typical hazards and risks relating to the manufacture of similar products such as:
| • | explosions, fires, inclement weather and natural disasters; |
| • | mechanical failure; |
| • | unscheduled downtime; |
| • | labor difficulties; |
| • | loss of process control and quality; |
| • | disruptions to supply; |
| • | raw materials quality defects; |
| • | service provider delays or failures; |
| • | transportation delays or failures; |
| • | an inability to obtain or maintain required licenses or permits; and |
| • | environmental hazards such as chemical spills, discharges or releases of toxic or hazardous substances or gases into the environment or workplace. |
The occurrence of any of these operating problems at our facilities may have a material adverse effect on the productivity and profitability of a particular manufacturing facility or on our operations as a whole, during and after the period of these operating difficulties. These operating problems may also cause personal injury and loss of life, severe damage to or destruction of property and equipment, and environmental damage. In addition, individuals could seek damages for alleged personal injury or property damage. Furthermore, we could be subject to present and future claims with respect to workplace injury, exposure to hazardous materials, workers’ compensation and other matters. Although we maintain property and casualty insurance of the types and in the amounts that we believe are customary for our industries, we cannot assure you that our insurance coverage will be adequate for liability that may be ultimately incurred or that such coverage will continue to be available to us on commercially reasonable terms. Any claims that result in liability exceeding our insurance coverage could have an adverse effect on our business, financial position, results of operations or cash flows.
Our Water Transmission business faces competition from concrete, ductile iron, polyvinyl chloride (“PVC”) and high density polyethylene (“HDPE”) pipe manufacturers. Water transmission pipe is manufactured generally from steel, concrete, HDPE, PVC or ductile iron. Each pipe material has advantages and disadvantages. Steel and concrete are more common materials for larger diameter water transmission pipelines because ductile iron pipe generally is limited in diameter due to the manufacturing process. The public agencies and engineers who determine the specifications for water transmission projects analyze these pipe materials for suitability for each project. Individual project circumstances normally dictate the preferred material. If we experience cost increases in raw materials, labor and overhead specific to our industry or the location of our facilities, while competing products or companies do not experience similar changes, we could experience an adverse change in the demand, price and profitability of our products, which could have a material adverse effect on our business, financial position, results of operations or cash flows.
Our quarterly results of operations are subject to significant fluctuation. Our net sales and operating results may fluctuate significantly from quarter to quarter due to a number of factors, including:
| • | the commencement, completion or termination of contracts during any particular quarter; |
| • | unplanned down time due to project delays or mechanical failure; |
| • | underutilized capacity or factory productivity; |
| • | the seasonal variation in demand for tubular products; |
| • | adverse weather conditions; |
13
Table of Contents
| • | fluctuations in the cost of steel and other raw materials; and |
| • | competitive pressures. |
Results of operations in any period are not indicative of results for any future period, and comparisons between any two periods may not be meaningful.
We depend on our senior management team, and the loss of any member could adversely affect our operations. Our success depends on the management and leadership skills of our senior management team. The loss of any of these individuals, or our inability to attract, retain and maintain additional personnel, could prevent us from fully implementing our business strategy. We cannot assure you that we will be able to retain our existing senior management personnel or to attract qualified personnel when needed.
Fluctuations in steel prices may affect our future results of operations. Purchased steel represents a substantial portion of our cost of sales, particularly in our tubular products business. The steel industry is highly cyclical in nature, and, at times, pricing can be highly volatile due to a number of factors beyond our control, including general economic conditions, import duties, other trade restrictions and currency exchange rates. Over the past three years, steel prices have fluctuated significantly. Our cost for a ton of steel in December 2007 was approximately $610. It rose to approximately $1,160 per ton in September 2008 and fell to approximately $550 per ton in May 2009. We were able to purchase steel for approximately $730 per ton in July 2010. This volatility can significantly affect our gross profit. Although we seek to recover increases in steel prices through price increases in our products, we have not always been completely successful. Any increase in steel prices that is not offset by an increase in our prices could have an adverse effect on our business, financial position, results of operations or cash flows.
We may be subject to claims for damages for defective products, which could adversely affect our business, financial position, results of operations or cash flows. We warrant our products to be free of certain defects. We have, from time to time, had claims alleging defects in our products. We cannot assure you that we will not experience material product liability losses in the future or that we will not incur significant costs to defend such claims. While we currently have product liability insurance, we cannot assure you that our product liability insurance coverage will be adequate for liability that may be incurred in the future or that such coverage will continue to be available to us on commercially reasonable terms. Any claims relating to defective products that result in liability exceeding our insurance coverage could have an adverse effect on our business, financial position, results of operations or cash flows.
We may not be able to recover costs and damages from vendors that supply defective materials. We may receive defective materials from our vendors that are incorporated into our products during the manufacturing process. The cost to repair, remake or replace defective products could be greater than the amount that can be recovered from the vendor. Such excess costs could have an adverse effect on our business, financial position, results of operations or cash flows.
Sustained increases in fuel costs could have an adverse impact on our profitability. We have periodically experienced significant fluctuations in fuel costs primarily as a result of macro-economic factors beyond our control. The price of fuel fluctuates significantly over time, and events beyond our control could adversely affect the supply and cost of fuel. Although we seek to recover increases in fuel costs through price increases in our products, we have not always been completely successful. Any increase in fuel costs that is not offset by increases in our prices could have an adverse impact on our business, financial position, results of operations or cash flows.
We may be unable to develop or successfully market new products or our products might not obtain necessary approvals or achieve market acceptance, which could adversely affect our growth. We will continue to actively seek to develop new products and to expand our existing products into new markets, but we
14
Table of Contents
cannot assure you that we will be successful in these efforts. If we are unsuccessful in developing and marketing new products, expanding into new markets, or we do not obtain or maintain requisite approvals for our products, the demand for our products could be adversely affected, which could affect our business, financial position, results of operations or cash flows.
We have foreign operations, which exposes us to the risks of doing business abroad. Our fabrication facility in Monterrey, Mexico primarily exports products to the United States. Additionally, we recently opened a manufacturing facility in Indonesia. We may operate in additional countries in the future. Any material changes in the quotas, regulations or duties on imports imposed by the U.S. government and our agencies or on exports imposed by these foreign governments and their agencies could adversely affect our foreign operations.
We also sell some of our products internationally. Our foreign activities are also subject to various other risks of doing business in a foreign country, including:
| • | currency fluctuations; |
| • | transportation delays and interruptions; |
| • | political, social and economic instability and disruptions; |
| • | government embargoes or foreign trade restrictions; |
| • | the imposition of duties, tariffs and other trade barriers; |
| • | import and export controls; |
| • | labor unrest and current and changing regulatory environments; |
| • | limitations on our ability to enforce legal rights and remedies; and |
| • | potentially adverse tax consequences. |
No assurance can be given that our operations may not be adversely affected in the future. Any of these events could have an adverse effect on our operations in the future by reducing the demand for our products and services, decreasing the prices at which we can sell our products or increasing costs such that there would be an adverse effect on our business, financial position, results of operations or cash flows. We cannot assure you that we will continue to operate in compliance with applicable customs, currency exchange control regulations, transfer pricing regulations or any other laws or regulations to which we may be subject, or that any such regulations or laws will not be modified. Any failure by us to comply with any such applicable regulations or laws, or any changes in any such regulations or laws could have a material adverse effect on our business, financial position, results of operations or cash flows.
Our use of the percentage-of-completion method of accounting could result in a change to previously recorded revenue and profit. In particular, revenue from construction contracts in our water transmission segment is recognized on the percentage-of-completion method, measured by the costs incurred to date as a percentage of the estimated total costs of each contract (the cost-to-cost method). Estimated total costs of each contract are reviewed on a monthly basis by project management and operations personnel for substantially all projects that are 50% or more complete except that major projects, usually over $5.0 million, are reviewed earlier if sufficient production has been completed to provide enough information to revise the original estimated total cost of the project. All cost revisions that result in the gross profit as a percent of sales increasing or decreasing by more than two percent are reviewed by senior management personnel.
The use of estimated cost to complete each contract is a significant variable in the process of determining income earned and is a significant factor in the accounting for contracts. The cumulative impact of revisions in total cost estimates during the progress of work is reflected in the period in which these changes become known. Due to the variability of events affecting our estimates which have a material impact on our contract accounting,
15
Table of Contents
actual results could differ from those estimates, which could adversely affect our financial position, results of operations or cash flows.
Our backlog is subject to reduction and cancellation. Backlog represents products or services that our customers have committed to purchase from us and projects for which we have been notified that we are the successful bidder even though a binding agreement has not been executed. Projects for which a binding contract has not been executed could be cancelled. Our backlog as of December 31, 2009 was $222 million, which included one project with backlog of $55.3 million. Our backlog is subject to fluctuations; moreover, cancellations of purchase orders, change orders on contracts, or reductions of product quantities could materially reduce our backlog and, consequently, future revenues. Our failure to replace canceled or reduced backlog could result in lower revenues, which could adversely affect our business, financial position, results of operations or cash flows.
Our tubular products business has faced intense competition from imports in the past. The level of imports of tubular products has historically impacted the domestic tubular products market. High levels of imports may reduce the volume of tubular products sold by domestic producers and depress selling prices of tubular products. We believe import levels are affected by, among other things, overall worldwide demand for tubular products, lower cost of production in other countries, the trade practices of foreign governments, government subsidies to foreign producers and governmentally imposed trade restrictions in the United States. Increased imports of tubular products in the United States and Canada could adversely affect our business, financial position, results of operations or cash flows
We are subject to stringent environmental and health and safety laws, which may require us to incur substantial compliance and remediation costs, thereby reducing our profits. We are subject to many federal, state, local and foreign environmental and health and safety laws and regulations, particularly with respect to the use, handling, treatment, storage, discharge and disposal of substances and hazardous wastes used or generated in our manufacturing processes. Compliance with these laws and regulations is a significant factor in our business. We have incurred, and expect to continue to incur, significant expenditures to comply with applicable environmental laws and regulations. Our failure to comply with applicable environmental laws and regulations and permit requirements could result in civil or criminal fines or penalties or enforcement actions, including regulatory or judicial orders enjoining or curtailing operations or requiring corrective measures, installation of pollution control equipment or remedial actions.
We are currently, and may in the future be, required to incur costs relating to the environmental assessment or environmental remediation of our property, and for addressing environmental conditions, including, but not limited to, the issues associated with our Portland, Oregon facility as discussed in Part I—Item 3, “Legal Proceedings” below. Some environmental laws and regulations impose liability and responsibility on present and former owners, operators or users of facilities and sites for contamination at such facilities and sites without regard to causation or knowledge of contamination. Consequently, we cannot assure you that existing or future circumstances, the development of new facts or the failure of third parties to address contamination at current or former facilities or properties will not require significant expenditures by us.
We expect to continue to be subject to increasingly stringent environmental and health and safety laws and regulations. It is difficult to predict the future interpretation and development of environmental and health and safety laws and regulations or their impact on our future earnings and operations. We anticipate that compliance will continue to require capital expenditures and operating costs. Any increase in these costs, or unanticipated liabilities arising, for example, out of discovery of previously unknown conditions or more aggressive enforcement actions, could adversely affect our results of operations, and there is no assurance that they will not have a material adverse effect on our business, financial position, results of operations or cash flows.
We face risks in connection with potential acquisitions. Acquiring businesses that complement or expand our operations has been an important element of our business strategy, and we continue to evaluate potential acquisitions that may expand and complement our business. We may not be able to successfully identify
16
Table of Contents
attractive acquisition candidates or negotiate favorable terms in the future. Furthermore, our ability to effectively integrate any future acquisitions will depend on, among other things, the adequacy of our implementation plans, the ability of our management to oversee and operate effectively the combined operations and our ability to achieve desired operational efficiencies. If we are unable to successfully integrate the operations of any businesses that we may acquire in the future, our business, financial position, results of operations or cash flows could be adversely affected.
Risks Related to Our Common Stock
If our common stock fails to meet the continued listing requirements of The Nasdaq Stock Market (the “Nasdaq”) and is delisted from trading on the Nasdaq, it could negatively impact the market price of our common stock, our ability to access the capital markets and the liquidity of our common stock. Our common stock is currently listed on Nasdaq under the symbol “NWPX.” We received letters from Nasdaq on November 12, 2009 and March 17, 2010 stating that we were no longer in compliance with Nasdaq Listing Rule 5250(c)(1) because we did not timely file our Quarterly Report on Form 10-Q for the quarter ended September 30, 2009 and our Annual Report on Form 10-K for the year ended December 31, 2009. Nasdaq granted us an exception allowing us until May 10, 2010 to regain compliance with Nasdaq Listing Rule 5250(c)(1). As a result of not regaining compliance within the specified compliance period, on May 11, 2010 we received a staff determination letter from Nasdaq stating that, unless we requested an appeal of the Nasdaq staff determination to a Nasdaq Hearings Panel, our common stock would be suspended from trading and cease being listed on the Nasdaq Global Select Market on May 20, 2010. We timely requested an appeal of the Nasdaq staff determination, and a hearing before the Hearings Panel was held on June 24, 2010. On July 23, 2010, we received from Nasdaq the written decision of the Hearings Panel, advising us that the Hearings Panel had determined to continue the listing of our shares on the Nasdaq Global Select Market, subject to the condition that we, on or before November 4, 2010, file with the SEC our Quarterly Report on Form 10-Q for the quarter ended September 30, 2009, our 2009 Form 10-K, and our Quarterly Report on Form 10-Q for the quarter ended March 31, 2010. We also believe we will be required to file our Quarterly Report on Form 10-Q for the quarter ended June 30, 2010 on or before November 4, 2010.
We can regain compliance with Nasdaq Listing Rule 5250(c)(1) by filing this 2009 Form 10-K and our other delinquent period reports on or before November 4, 2010. However, if we are unable to do so, or otherwise fail to comply with Nasdaq Listing Rules, there can be no assurance that we will be successful in maintaining the continued listing of our common stock on Nasdaq. A delisting of our common stock from the Nasdaq would adversely affect the liquidity of the trading market for our common stock and therefore the market price of our common stock. If Nasdaq determines to delist our common stock and our common stock is not eligible for quotation on another market or exchange, trading of our common stock could be conducted in the over-the-counter market or on an electronic bulletin board established for unlisted securities such as the Pink Sheets or the OTC Bulletin Board. In such event, it could become more difficult to dispose of, or obtain accurate quotations for the price of our common stock, and there would likely also be a reduction in our coverage by security analysts and the news media, which could cause the price of our common stock to decline further. If an active trading market for our common stock is not sustained, it will be difficult for our shareholders to sell shares of our common stock without further depressing the market price of our common stock or at all. A delisting of our common stock also could make it more difficult for us to raise capital that may be needed for future operations. Delisting of our common stock could also have other negative results, including the potential loss of confidence by customers, suppliers and employees, the loss of institutional investor interest and investment, and fewer business development opportunities.
The relatively low trading volume of our common stock may limit your ability to sell your shares. Although our shares of common stock are listed on the Nasdaq, we have historically experienced a relatively low trading volume. If we have a low trading volume in the future, holders of our shares may have difficulty selling a large number of shares of our common stock in the manner or at a price that might otherwise be attainable.
17
Table of Contents
The market price of our common stock could be subject to significant fluctuations. The market price of our common stock has experienced, and may continue to experience, significant volatility. Among the factors that could affect our stock price are:
| • | our operating and financial performance and prospects; |
| • | quarterly variations in the rate of growth of our financial indicators, such as earnings per share, net income and sales; |
| • | changes in revenue or earnings estimates or publication of research reports by analysts; |
| • | loss of any member of our senior management team; |
| • | speculation in the press or investment community; |
| • | strategic actions by us or our competitors, such as acquisitions or restructuring; |
| • | sales of our common stock by shareholders; |
| • | relatively low trading volume; |
| • | general market conditions and market expectations for our industry and the financial health of our customers; and |
| • | domestic and international economic, legal and regulatory factors unrelated to our performance. |
The stock markets in general have experienced broad fluctuations that have often been unrelated to the operating performance of particular companies. These broad market fluctuations may adversely affect the trading price of our common stock.
Certain provisions of our governing documents and Oregon law could discourage potential acquisition proposals. Our articles of incorporation contain provisions that:
| • | classify the board of directors into three classes, each of which serves for a three-year term with one class elected each year; |
| • | provide that directors may be removed by shareholders only for cause and only upon the affirmative vote of 75% of the outstanding shares of common stock; and |
| • | permit the board of directors to issue preferred stock in one or more series, fix the number of shares constituting any such series and determine the voting powers and all other rights and preferences of any such series, without any further vote or action by our shareholders. |
In addition, we are subject to the Oregon Business Combination Act, which imposes certain restrictions on business combination transactions and may encourage parties interested in acquiring us to negotiate in advance with our board of directors. We also have a shareholder rights plan that acts to discourage any person or group from making a tender offer for, or acquiring, more than 15% of our common stock without the approval of our board of directors. Any of these provisions could discourage potential acquisition proposals, could deter, delay or prevent a change in control that our shareholders consider favorable and could depress the market value of our common stock.
| Item 1B. | Unresolved Staff Comments |
On July 23, 2009, we received correspondence from the staff of the SEC relating to our 2008 Form 10-K and our 2009 Proxy Statement. We subsequently engaged in communications and correspondence with the SEC staff, and as of the date of this filing, we have outstanding unresolved comments from the SEC staff with respect to disclosure contained in our Form 10-K for the fiscal year ended December 31, 2008, our Form 10-Q for the quarter ended March 31, 2009 and our Definitive Proxy Statement filed April 3, 2009. We have modified the
18
Table of Contents
disclosure in this 2009 Form 10-K in an effort to reflect all of the SEC staff’s prior comments. We believe that the SEC staff is waiting to resolve the outstanding comments until after we have filed this 2009 Form 10-K. As a result, we may receive additional comments from the SEC staff relating to our responses to the prior staff comments, new matters related to this 2009 Form 10-K or other periodic reports filed by us with the SEC. Such comments may require that we amend or supplement, possibly significantly, the disclosures in this 2009 Form 10-K, including our restated financial statements included herein, or other periodic reports filed by us with the SEC.
| Item 2. | Properties |
Properties
The following table provides certain information about our ten operating facilities as of December 31, 2009:
| Location |
Manufacturing Space (approx. sq. ft.) |
Property Size (approx. acres) |
Products |
Number and Type of Mills | ||||||
| Portland, Oregon |
300,000 | 25 | Water transmission | 3 spiral mills | ||||||
| Atchison, Kansas |
106,000 | 60 | Tubular products | 2 electric resistance mills | ||||||
| Adelanto, California |
200,000 | 100 | Water transmission | 3 spiral mills | ||||||
| Denver, Colorado |
182,000 | 40 | Water transmission | 2 spiral mills | ||||||
| Houston, Texas |
175,000 | 15 | Tubular products | 4 electric resistance mills | ||||||
| Parkersburg, West Virginia |
145,000 | 90 | Water transmission | 2 spiral mills | ||||||
| Saginaw, Texas (2 facilities) |
170,000 | 50 | Water transmission | 1 spiral mill | ||||||
| Pleasant Grove, Utah |
87,000 | 40 | Water transmission | 1 spiral mill | ||||||
| Monterrey, Mexico |
40,000 | 5 | Water transmission | Multiple line fabrication capability | ||||||
| Bossier City, Louisiana |
180,000 | 25 | Tubular products | 1 electric resistance mill | ||||||
As of December 31, 2009, we owned all of our facilities except for our Pleasant Grove facility, one of our Saginaw, Texas facilities, and property adjacent to our Oregon facility, which are leased.
Our facilities serve regional markets, which vary in the number and sizes of projects year-over-year. Consequently, we have excess manufacturing capacity from time to time at each of our facilities. We believe the quality and productive capacity of our facilities are sufficient to maintain our competitive position for the foreseeable future.
| Item 3. | Legal Proceedings |
Class Action and Derivative Lawsuits
On November 20, 2009, a complaint against us, captioned Richard v. Northwest Pipe Co. et al., No. C09-5724 RBL, was filed in the United States District Court for the Western District of Washington. The plaintiff is allegedly a purchaser of our stock. In addition to the Company, Brian W. Dunham, our former President and CEO, and Stephanie J. Welty, our current CFO, are named as defendants. The complaint alleges that defendants violated Section 10(b) of the Exchange Act by making false or misleading statements between April 23, 2008 and November 11, 2009. Plaintiff seeks to represent a class of persons who purchased our stock during the same period and seeks damages for losses caused by the alleged wrongdoing.
A similar complaint, captioned Plumbers and Pipefitters Local Union No. 630 Pension-Annuity Trust Fund v. Northwest Pipe Co. et al., No. C09-5791 RBL, was filed against us in the same court on December 22, 2009. In addition to the Company, Brian W. Dunham, Stephanie J. Welty and William R. Tagmyer, our current Chairman of the Board, are named as defendants in the Plumbers complaint. In the Plumbers complaint, as in the
19
Table of Contents
Richard complaint, the plaintiff is allegedly a purchaser of our stock and asserts that defendants violated Section 10(b) of the Exchange Act by making false or misleading statements between April 23, 2008 and November 11, 2009. Plaintiff seeks to represent a class of persons who purchased our stock during that period, and seeks damages for losses caused by the alleged wrongdoing.
The Richard action and the Plumbers action were consolidated on February 25, 2010. Plumbers and Pipefitters Local No. 630 Pension-Annuity Trust Fund was appointed lead plaintiff in the consolidated action. Defendants and lead plaintiff subsequently agreed that defendants do not need to respond to either of the two outstanding complaints, and that a consolidated amended complaint will be filed within 45 days of us having completed the filing of our Quarterly Report on Form 10-Q for the quarter ended September 30, 2009 (the “September 2009 Form 10-Q”) and our 2009 Form 10-K with the SEC. The parties also have stipulated to a briefing schedule for motions to dismiss to be filed after the filing of a consolidated amended complaint. We intend to vigorously defend ourselves against these claims. This securities litigation is at a very early stage and, at this time, it is not possible to predict its outcome. Therefore, we have not accrued any charges related to this litigation.
On March 3, 2010, the Company was served with a derivative complaint, captioned Ruggles v. Dunham et al., No. C10-5129 RBL, and filed in the United States District Court for the Western District of Washington. The plaintiff in this action is allegedly a current shareholder of ours. The Company is a nominal defendant in this litigation. Plaintiff seeks to assert, on the Company’s behalf, claims against Brian W. Dunham, Stephanie J. Welty, William R. Tagmyer, Keith R. Larson, Wayne B. Kingsley, Richard A. Roman, Michael C. Franson and Neil R. Thornton. The asserted basis of the claims is that defendants breached fiduciary duties to the Company by causing the Company to make improper statements between April 23, 2008 and August 7, 2009. Plaintiff seeks to recover, on the Company’s behalf, damages for losses caused by the alleged wrongdoing.
The Company and the defendants have entered into an agreement with plaintiff in the Ruggles action. Pursuant to that agreement, neither the Company nor the defendants are required to respond to the current complaint. Plaintiffs may file an amended complaint within 60 days of our having completed the filing of our September 2009 Form 10-Q and our 2009 Form 10-K with the SEC. The parties have agreed on a briefing schedule for motions to dismiss to be filed after the filing of an amended complaint. It should also be noted that derivative claims by their nature do not seek to recover damages from us, but purport instead to seek to recover damages for the benefit of us. This litigation is at a very early stage and, at this time, it is not possible to predict its outcome. Therefore, we have not accrued any charges related to this litigation.
SEC Investigation
On March 8, 2010, the staff of the Enforcement Division of the SEC advised our counsel that they had obtained a formal order of investigation with respect to matters related to the Audit Committee investigation. We are cooperating fully with the SEC in connection with these matters. We cannot predict if, when or how they will be resolved or what, if any, actions we may be required to take as part of any resolution of these matters. Any action by the SEC or other governmental agency could result in civil or criminal sanctions against us and/or certain of our current and former officers, directors and employees. The investigation is at a very early stage and, at this time, it is not possible to predict its outcome. Therefore, we have not accrued any charges related to this investigation.
Other Matters
On December 1, 2000, a section of the lower Willamette River known as the Portland Harbor was included on the National Priorities List at the request of the U.S. Environmental Protection Agency (the “EPA”). While the Company’s Portland, Oregon manufacturing facility does not border the Willamette River, an outfall from the facility’s storm water system drains into a neighboring property’s privately owned slip. The Company and over 100 other parties have been notified by the EPA and the Oregon Department of Environmental Quality (the
20
Table of Contents
“ODEQ”) of potential liability under the Comprehensive Environmental Response, Compensation and Liability Act (“CERCLA”). As of September 2010, more than 280 potentially responsible parties on and nearby the river have been asked to file information disclosure reports with the EPA. By agreement with the EPA, the ODEQ is charged with ensuring that all upland sites have “source control” to prevent future contamination to the river. A remedial investigation and feasibility study of the Portland Harbor is currently being directed by a group of potentially responsible parties known as the Lower Willamette Group (the “LWG”). The Company made a payment of $175,000 to the LWG in June 2007 as part of an interim settlement, and is under no obligation to make any further payment. A draft remedial investigation report was submitted to the EPA by the LWG in the fall of 2009. The feasibility study is underway, and is expected to be completed by the LWG in 2011.
In 2001, groundwater containing elevated organic compounds (“VOCs”) was identified in one localized area of the Company’s property furthest from the river. Assessment work in 2002 and 2003 to further characterize the groundwater is consistent with the initial conclusion that the source of the VOC’s is located off of Company-owned property. On January 25, 2005, the Company entered into a Voluntary Agreement for Remedial Investigation and Source Control Measures (“Agreement”) with the ODEQ. The Company is one of 84 Upland Source Control Sites working with the ODEQ on Source Control and is ranked a “medium” priority. The Company performed Remedial Investigation work required under the Agreement and submitted a draft Remedial Investigation/Source Control Evaluation Report on December 30, 2005. The conclusions of the report indicate that the VOCs found in the groundwater do not present an unacceptable risk to human or ecological receptors in the Willamette River. The report also indicates there is no evidence at this time showing a connection between detected VOCs in groundwater and Willamette River sediments.
Also, based on the remedial investigation and reporting required under the Portland, Oregon manufacturing facility’s National Pollutant Discharge Elimination System permit for storm water, the Company and the ODEQ have identified a possible source of small amounts of polynuclear aromatic compounds and polychlorinated biphenyls and have periodically identified trace amounts of zinc in storm water. Storm water from the Portland, Oregon manufacturing facility site is discharged to a neighboring property’s privately owned slip, as is storm water from surrounding industrial properties. The slip was historically used for shipbuilding and subsequently for ship breaking and metal recycling. Studies of the river sediments have revealed concentration of polynuclear aromatic compounds, polychlorinated biphenyls and zinc, which are common constituents in urban storm water discharges. To minimize the zinc traces in its storm water, the Company painted a substantial part of the Portland facility’s roofs in 2009 at a cost of $364,000. In addition, paving improvements were made at the Portland facility at a cost of $215,000. Total spending on environmental capital projects at the Portland facility was $603,000 in 2009. Based on National Pollutant Discharge Elimination System storm water sampling, the painting seems to have reduced the zinc in the storm water runoff. In June 2009, under the ODEQ Agreement, we submitted a Final Supplemental Work Plan to evaluate and assess soil and storm water, and further assess groundwater risk. We are working with the City of Portland and the ODEQ to facilitate further soil and storm water source control measures.
Concurrent with the activities of the EPA and the ODEQ, the Portland Harbor Natural Resources Trustee Council (“Trustees”) sent some or all of the same parties, including the Company, a notice of intent to perform a Natural Resource Damage Assessment (“NRDA”) for the Portland Harbor Site to determine the nature and extent of natural resource damages under CERCLA section 107. The Trustees for the Portland Harbor Site consist of representatives from several Northwest Indian Tribes, three federal agencies and one state agency. The Trustees act independently of the EPA and the ODEQ, but the Company expects their assessment will be coordinated with the remedial investigation and feasibility study work underway at the Portland Harbor Site. In 2009, the Trustees completed phase one of their three-phase NRDA. Phase one of the NRDA consisted of environmental studies to fill gaps in the information available from the EPA, and development of a framework for evaluating, quantifying and determining the extent of injuries to the natural resource and the resulting damages. Phase two of the NRDA began in 2010 and consists largely of implementing the framework developed in phase one.
The Trustees have encouraged potentially responsible parties to voluntarily participate in the funding of their injury assessments. In 2009, one of the Tribal Trustees (the Yakima Nation) resigned and has requested
21
Table of Contents
funding from the same parties to support its own assessment. The Company has not assumed any payment obligation or liability related to either request. The extent of the Company’s obligation with respect to Portland Harbor matters is not known, and no further adjustment to the consolidated financial statements has been recorded as of December 31, 2009.
We operate under numerous governmental permits and licenses relating to air emissions, storm-water run-off and other environmental matters. In September and October of 2009 we received several notices of violation and notices to comply from the Mohave Desert Air Quality Management District (“District”) for violations of permitted particulate matter emissions limits and other violations at our Adelanto, California facility. We are negotiating with the District to settle these matters. We do not believe that resolution of these matters will result in material adverse effects on our business, financial condition, results of operations or cash flows.
From time to time, we are involved in litigation relating to claims arising out of our operations in the normal course of our business. We maintain insurance coverage against potential claims in amounts that we believe to be adequate. Management believes that it is not presently a party to any other litigation, the outcome of which would have a material adverse effect on our business, financial condition, results of operations or cash flows.
| Item 4. | [Removed and Reserved] |
22
Table of Contents
| Item 5. | Market for the Registrant’s Common Equity, Related Stockholder Matters and Issuer Purchases of Equity Securities |
Market Information
Our common stock is quoted on the Nasdaq under the symbol “NWPX.” The high and low sales prices as reported on the Nasdaq for each quarter in the years ended December 31, 2009 and 2008 were as follows.
| Low | High | |||||||
| 2009 |
||||||||
| First Quarter |
$ | 22.15 | $ | 46.29 | ||||
| Second Quarter |
27.17 | 41.98 | ||||||
| Third Quarter |
30.54 | 40.47 | ||||||
| Fourth Quarter |
24.80 | 35.56 | ||||||
| 2008 |
||||||||
| First Quarter |
$ | 35.10 | $ | 44.37 | ||||
| Second Quarter |
37.75 | 58.73 | ||||||
| Third Quarter |
39.68 | 65.19 | ||||||
| Fourth Quarter |
18.75 | 44.64 | ||||||
There were 65 shareholders of record and approximately 3,700 beneficial shareholders at October 8, 2010. There were no cash dividends declared or paid in fiscal years 2009 or 2008, and we do not intend to pay cash dividends in the foreseeable future.
23
Table of Contents
Stock Performance Graph
The following graph compares the performance of our common stock to the performance of the Russell 2000 Index and a weighted composite index of certain peer companies (the “Peer Group”) selected by us. The Peer Group is comprised of the following companies: Ameron International Corporation, Insituform Technologies and Lindsay Corporation.
The comparisons in the chart below are provided in response to SEC disclosure requirements and, therefore, are not intended to forecast or be indicative of future performance of our common stock.
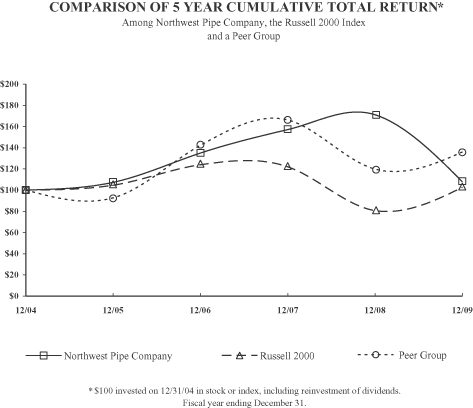
| Indexed Return | ||||||||||||
| Northwest Pipe Company |
Russell 2000 Index |
Peer Group | ||||||||||
| December 31, 2004 |
100.00 | 100.00 | 100.00 | |||||||||
| December 31, 2005 |
107.25 | 104.55 | 92.62 | |||||||||
| December 31, 2006 |
134.75 | 123.76 | 142.06 | |||||||||
| December 31, 2007 |
156.87 | 121.82 | 165.92 | |||||||||
| December 31, 2008 |
170.78 | 80.66 | 119.69 | |||||||||
| December 31, 2009 |
107.66 | 102.58 | 135.86 | |||||||||
Securities Authorized for Issuance under Equity Compensation Plans
The information with respect to equity compensation plans is included under Part III—Item 12, “Security Ownership of Certain Beneficial Owners and Management and Related Stockholder Matters” of this 2009 Form 10-K.
24
Table of Contents
| Item 6. | Selected Financial Data |
The following information as of and for the years ended December 31, 2008, 2007, 2006 and 2005 has been updated to reflect the restatement to our financial statements as discussed in Note 2 to the Consolidated Financial Statements included in Part II—Item 8, “Financial Statements and Supplementary Data” of this 2009 Form 10-K. You should read the selected consolidated historical financial information set forth below along with our restated audited consolidated financial statements included in Item 15 of this 2009 Form 10-K.
The following selected consolidated financial data as of December 31, 2009 and 2008 and for the years ended December 31, 2009, 2008 and 2007 are derived from our audited consolidated financial statements included in this 2009 Form 10-K. The consolidated financial data as of December 31, 2007, 2006 and 2005 and for the years ended December 31, 2006 and 2005 have been updated to reflect the restatement for matters similar to those described in Note 2 to the Consolidated Financial Statements included in Part II—Item 8, “Financial Statements and Supplementary Data” of this 2009 Form 10-K.
We have not amended our previously-filed Annual Reports on Form 10-K or Quarterly Reports on Form 10-Q for the periods affected by the restatement. The financial information that has been previously-filed or otherwise reported for these periods is superseded by the information in this 2009 Form 10-K, and the financial statements and related financial information contained in such previously-filed reports should no longer be relied upon. The information presented in the following tables has been updated to reflect the effects of the restatement of our financial results, which is more fully described in Note 2 to the Consolidated Financial Statements in Part II—Item 8, “Financial Statements and Supplementary Data” of this 2009 Form 10-K.
| Year Ended December 31, | ||||||||||||||||||||
| 2009 | 2008 | 2007 | 2006 | 2005 | ||||||||||||||||
| (In thousands, except per share amounts) | ||||||||||||||||||||
| Consolidated Statement of Operations Data: |
||||||||||||||||||||
| Net sales |
$ | 278,654 | $ | 451,419 | $ | 364,314 | $ | 329,032 | $ | 339,765 | ||||||||||
| Gross profit |
11,686 | 84,587 | 48,453 | 41,891 | 47,924 | |||||||||||||||
| Net (loss) income |
(7,277 | ) | 31,338 | 11,919 | 14,348 | 13,396 | ||||||||||||||
| Basic earnings (loss) per share |
(0.79 | ) | 3.43 | 1.33 | 2.01 | 1.98 | ||||||||||||||
| Diluted earnings (loss) per share |
(0.79 | ) | 3.35 | 1.29 | 1.93 | 1.90 | ||||||||||||||
| As of December 31, | ||||||||||||||||||||
| 2009 | 2008 | 2007 | 2006 | 2005 | ||||||||||||||||
| (In thousands) | ||||||||||||||||||||
| Consolidated Balance Sheet Data: |
||||||||||||||||||||
| Working capital |
$ | 122,344 | $ | 192,385 | $ | 160,885 | $ | 152,964 | $ | 135,792 | ||||||||||
| Total assets |
391,237 | 470,280 | 413,821 | 401,478 | 310,573 | |||||||||||||||
| Long-term debt and capital lease obligations, less current portion |
51,722 | 114,444 | 93,336 | 90,915 | 94,931 | |||||||||||||||
| Stockholders’ equity |
246,299 | 252,504 | 218,187 | 201,644 | 135,955 | |||||||||||||||
25
Table of Contents
Summary Financial Impacts of Restatements
The following table presents “as restated” and “as previously reported” summary financial data for revenue, gross profit, net income, basic earnings per share and diluted earnings per share to reflect the effects of the restatement discussed in Note 2 to the Consolidated Financial Statements included in Part II—Item 8, “Financial Statements and Supplementary Data” of this 2009 Form 10-K to these earlier periods presented herein.
| Net Sales | Gross Profit |
Net Income | Basic Earnings per Share |
Diluted Earnings per Share |
||||||||||||||||
| (in thousands) | ||||||||||||||||||||
| Year Ended December 31, 2006 |
||||||||||||||||||||
| As previously reported |
$ | 346,591 | $ | 56,713 | $ | 20,019 | $ | 2.80 | $ | 2.69 | ||||||||||
| Restatement adjustments |
(17,559 | ) | (14,822 | ) | (5,671 | ) | (0.79 | ) | (0.76 | ) | ||||||||||
| As restated |
$ | 329,032 | $ | 41,891 | $ | 14,348 | $ | 2.01 | $ | 1.93 | ||||||||||
| Year Ended December 31, 2005 |
||||||||||||||||||||
| As previously reported |
$ | 329,006 | $ | 53,790 | $ | 13,386 | $ | 1.97 | $ | 1.90 | ||||||||||
| Restatement adjustments |
10,759 | (5,866 | ) | 10 | 0.01 | — | ||||||||||||||
| As restated |
$ | 339,765 | $ | 47,924 | $ | 13,396 | $ | 1.98 | $ | 1.90 | ||||||||||
The following table presents “as restated” and “as previously reported” summary financial data for working capital; total assets; long-term debt and capital lease obligations, less current portion; and stockholders’ equity to reflect the effects of the restatement discussed in Note 2 to the Consolidated Financial Statements included in Part II—Item 8, “Financial Statements and Supplementary Data” of this 2009 Form 10-K to these earlier periods presented herein.
| Working capital |
Total assets |
Long-term debt and capital lease obligations, less current portion |
Stockholders’ equity |
|||||||||||||
| (in thousands) | ||||||||||||||||
| As of December 31, 2007 |
||||||||||||||||
| As previously reported |
$ | 181,524 | $ | 453,563 | $ | 93,336 | $ | 256,282 | ||||||||
| Restatement adjustments |
(20,639 | ) | (39,742 | ) | — | (38,095 | ) | |||||||||
| As restated |
$ | 160,885 | $ | 413,821 | $ | 93,336 | $ | 218,187 | ||||||||
| As of December 31, 2006 |
||||||||||||||||
| As previously reported |
$ | 166,743 | $ | 424,451 | $ | 90,915 | $ | 230,826 | ||||||||
| Restatement adjustments |
(13,779 | ) | (22,973 | ) | — | (29,182 | ) | |||||||||
| As restated |
$ | 152,964 | $ | 401,478 | $ | 90,915 | $ | 201,644 | ||||||||
| As of December 31, 2005 |
||||||||||||||||
| As previously reported |
$ | 150,428 | $ | 338,485 | $ | 94,931 | $ | 159,465 | ||||||||
| Restatement adjustments |
(14,636 | ) | (27,912 | ) | — | (23,510 | ) | |||||||||
| As restated |
$ | 135,792 | $ | 310,573 | $ | 94,931 | $ | 135,955 | ||||||||
26
Table of Contents
| Item 7. | Management’s Discussion and Analysis of Financial Condition and Results of Operations |
Forward-Looking Statements
This Management’s Discussion and Analysis of Financial Condition and Results of Operations and other sections of this 2009 Form 10-K contain forward-looking statements within the meaning of the Securities Litigation Reform Act of 1995 and Section 21E of the Exchange Act that are based on current expectations, estimates and projections about our business, management’s beliefs, and assumptions made by management. Words such as “expects,” “anticipates,” “intends,” “plans,” “believes,” “seeks,” “estimates,” “forecasts,” “should,” and variations of such words and similar expressions are intended to identify such forward-looking statements. These statements are not guarantees of future performance and involve risks and uncertainties that are difficult to predict. Therefore, actual outcomes and results may differ materially from the results anticipated in these forward-looking statements as a result of a variety of important factors. While it is impossible to identify all such factors, those that could cause actual results to differ materially from those estimated by us include the important factors discussed in Part 1—Item 1A “Risk Factors.” Such forward-looking statements speak only as of the date on which they are made and we do not undertake any obligation to update any forward-looking statement to reflect events or circumstances after the date of this 2009 Form 10-K. If we do update or correct one or more forward-looking statements, investors and others should not conclude that we will make additional updates or corrections with respect thereto or with respect to other forward-looking statements.
Restatement of Previously Issued Financial Statements
As previously disclosed, the Audit Committee, with the assistance of independent professionals retained by the Audit Committee, has conducted an investigation of certain accounting matters, including certain revenue recognition practices. In addition, at the direction of the Audit Committee, we retained an external consulting firm to assist in performing certain related analyses of our accounting practices and previously issued consolidated financial statements. Based upon its consideration of the issues identified in the Audit Committee investigation and the related accounting analyses, and after discussions with management, the Audit Committee concluded that our previously issued consolidated financial statements contained material errors and should be restated.
Management’s Discussion and Analysis of Financial Condition and Results of Operations in both tabular and textual form as it relates to the years ended December 31, 2008 and 2007 has been updated to reflect the effects of the restatement described in Note 2 of the Consolidated Financial Statements in Part II—Item 8, “Financial Statements and Supplementary Data”.
Overview
We are a leading North American manufacturer of large-diameter, high-pressure steel pipeline systems for use in water infrastructure applications, primarily related to drinking water systems. Our pipeline systems are also used for hydroelectric power systems, wastewater systems and other applications. We also make products for industrial plant piping systems and certain structural applications. These pipeline systems are produced by our Water Transmission Group from seven manufacturing facilities located in Portland, Oregon; Denver, Colorado; Adelanto, California; Parkersburg, West Virginia; Saginaw, Texas; Pleasant Grove, Utah; and Monterrey, Mexico. Our Water Transmission Group accounted for approximately 76% of net sales in 2009. In February 2009, we announced a temporary shutdown of our Utah facility. We installed a new mill at that facility and resumed operations in June 2010.
Our water infrastructure products are sold generally to installation contractors, who include our products in their bids to municipal agencies or privately-owned water companies for specific projects. We believe our sales are substantially driven by spending on new water infrastructure with a recent trend towards spending on water infrastructure replacement, repair and upgrade. Within the total range of pipe products, our products tend to fit the larger-diameter, higher-pressure applications.
27
Table of Contents
Our Tubular Products Group manufactures other welded steel products in three facilities: Atchison, Kansas; Houston, Texas; and starting in 2010 Bossier City, Louisiana. We produce a range of products used in several different markets. We currently make energy pipe, standard pipe, structural pipe, and traffic signpost systems, which are sold to distributors and used in many different applications. Our Tubular Products Group generated approximately 24% of our net sales in 2009. Our Tubular Products Group’s sales volume is typically driven by energy spending, non-residential construction spending, highway spending and general economic conditions. We currently believe the greatest potential for significant sales growth in our Tubular Products Group is through our energy products.
We have also invested in an unconsolidated subsidiary, Northwest Pipe Asia, located in Singapore. Northwest Pipe Asia produces steel pipe mills and also has established temporary operations in Batam, Indonesia to produce structural piling to be supplied to a construction project in Singapore.
Our Current Economic Environment
We are monitoring the current economic environment, and we believe there are substantial growth opportunities based on key factors impacting demand for our products. Although the 2009 economic slowdown had the biggest impact on our Tubular Products Group, we expect the recovery of the energy markets to have a positive impact on our Tubular Products business, as natural gas exploration and production companies continue to restart rig operations and increase explorations. Additionally, in April 2010, the U.S. Department of Commerce imposed tariffs on oil country tubular goods imported from China. Chinese steel suppliers recently held as much as 50% of the oil country tubular goods import market. With regard to our Water Transmission Group, we operate our business with a long-term time horizon. Projects are often planned for many years in advance, and are sometimes part of fifty-year build out plans. However, in the near term we expect strained municipal budgets will impact the Water Transmission Group. Fluctuating steel costs will be a factor in both our Tubular Products Group and our Water Transmission Group, as the ability to adjust our selling prices as steel costs fluctuate will depend on market conditions.
Critical Accounting Policies
The discussion and analysis of our financial condition and results of operations are based upon our consolidated financial statements, which have been prepared in accordance with accounting principles generally accepted in the United States.
Management Estimates:
The preparation of our financial statements requires us to make estimates and judgments that affect the reported amounts of assets, liabilities, revenues and expenses, and disclosure of contingent assets and liabilities. We base our estimates on historical experience and on various other assumptions that are believed to be reasonable under the circumstances. On an on-going basis, we evaluate all of our estimates, including those related to revenue recognition, allowance for doubtful accounts and product warranties, depreciation and amortization, goodwill and intangible assets, accrued liabilities, income taxes, and litigation and other contingencies. Actual results may differ from these estimates under different assumptions or conditions. We believe the following critical accounting policies and related judgments and estimates affect the preparation of our consolidated financial statements.
Revenue Recognition:
Revenue from construction contracts in our Water Transmission Group is recognized on the percentage-of-completion method, measured by the costs incurred to date as a percentage of the estimated total costs of each contract (cost-to-cost method). Contract costs include all direct material and labor costs and those indirect costs related to contract performance, such as indirect labor, supplies, tools, repairs and depreciation.
28
Table of Contents
Selling, general and administrative costs are charged to expense as incurred. The cost of steel is recognized as a project cost when the steel is introduced into the manufacturing process. Estimated total costs of each contract are reviewed on a monthly basis by project management and operations personnel for substantially all projects that are 50% or more complete except that major projects, usually over $5.0 million, are reviewed earlier if sufficient production has been completed to provide enough information to revise the original estimated total cost of the project. All cost revisions that result in the gross profit as a percent of sales increasing or decreasing by more than two percent are reviewed by senior management personnel.
We begin recognizing revenue on a project when we have persuasive evidence of an arrangement and project costs are incurred. Costs may be incurred before we have persuasive evidence of an arrangement. In those cases, the project costs are deferred if we believe we will obtain persuasive evidence of an arrangement and if recoverability from that arrangement is probable.
Provisions for losses on uncompleted contracts are made in the period such losses are known. Changes in job performance, job conditions and estimated profitability, including those arising from contract penalty provisions, foreign currency exchange rate movements, and final contract settlements may result in revisions to revenue, costs and income and are recognized in the period in which the revisions are determined. Historically, our estimates of total job costs for each job have been reasonably dependable.
Revenue from our Tubular Products Group is recognized when all four of the following criteria have been satisfied: persuasive evidence of an arrangement exists; the price is fixed or determinable; delivery has occurred; and collectability is reasonably assured.
Allowance for Doubtful Accounts and Product Warranties:
We maintain allowances for estimated losses resulting from the inability of our customers to make required payments and contract disputes, together with a reserve for warranty claims, based on historical experience and management’s judgment. The extension and revision of credit is established by obtaining credit rating reports or financial information on the customer. An allowance is recorded based on a variety of factors, including our historical collection experience and our historical product warranty claims. At least monthly, we review past due balances to identify the reasons for non-payment. We will write off a receivable account once the account is deemed uncollectible for reasons such as a bankruptcy filing, deterioration in the customer’s financial position, contract dispute, product claim or other similar events. As of December 31, 2009, the accounts receivable balance of $38.7 million is reported net of allowances for doubtful accounts of $0.8 million. We believe the reported allowances at December 31, 2009 are adequate. If the customers’ financial conditions were to deteriorate resulting in their inability to make payments, or if contract disputes or warranty claims were to escalate, additional allowances may need to be recorded which would result in additional expenses being recorded for the period in which such determination was made.
Goodwill:
Goodwill related to our Tubular Products Group, one of our operating segments and reporting units, represents the excess of cost over the assigned value of the net assets in connection with the segment’s acquisitions. Goodwill is no longer amortized but is reviewed for impairment annually at December 31 or whenever events occur or circumstances change that would more likely than not reduce the fair value of the Tubular Products Group below its carrying amount. Fair value of the Tubular Products Group’s goodwill is determined with consideration of the income, market, and cost approaches as applicable.
Fair value of goodwill is estimated under the income approach and the market approach. Although considered, we do not utilize the cost approach as relevant data is not available. We utilize an average of the income and market approaches, with a heavier weighting on the income approach because of the relatively limited number of comparable entities for which relevant multiples are available.
29
Table of Contents
The income approach is based upon projected future after-tax cash flows (less capital expenditures) discounted to present value using factors that consider the timing and risk associated with the future after-tax cash flows. The key assumptions in the discounted cash flow analysis are the long-term growth rate, the discount rate, and the annual free cash flow. The discount rate used for 2009 was 13.5% which reflects the Company’s estimated weighted average cost of capital. The market approach is based upon historical and forward-looking measures using multiples of revenue and a price-to-book ratio. The forward-looking measures are more heavily weighted than the historical measures.
We also utilize a sensitivity analysis to determine the impact of changes in discount rates and cash flow forecasts on the valuation of the Tubular operating segment. The valuation of the Tubular Products Group significantly exceeded its carrying value at December 31, 2009. Accordingly, no further valuation of the segment was necessary. If our assumptions about goodwill change as a result of events or circumstances, and management believes the assets may have declined in value, then impairment charges will be recorded, resulting in lower profits. The operations of the Tubular Products Group are cyclical and its sales and profitability may fluctuate from year to year. In the evaluation of our operating segment, we look at the long-term prospects for the reporting unit and recognize that current performance may not be the best indicator of future prospects or value, which requires management judgment.
Long-Lived Assets:
Property and equipment are recorded at cost. We depreciate the net book value in excess of the salvage value using either the units of production method or a straight-line method depending on the classification of the asset. We assess impairment of property and equipment whenever changes in circumstances indicate that the carrying values of the assets may not be recoverable. The recoverable value of long-lived assets is determined by estimating future undiscounted cash flows using assumptions about our expected future operating performance. Our estimates of undiscounted cash flows may differ from actual cash flow due to, among other things, technological changes, economic conditions, or changes to our business operations. If we determine the carrying value of the property and equipment will not be recoverable, we calculate and record an impairment loss.
In February 2009, we temporarily shut down our facility in Utah, as we did not anticipate sufficient near-term work located nearby to justify its operation. The assets at our Utah facility are comprised primarily of machinery and equipment. We lease the buildings and land. Due to the nature of our manufacturing process and the equipment used in the process, our machinery and equipment assets are long-lived and the risk of obsolescence is low. Each of our Water Transmission facilities, of which Utah is one, has equipment that is interchangeable, as the same product can, for the most part, be produced at any one of our water transmission facilities. We recommenced operations at our Utah facility in June 2010. Because of these facts, we came to the conclusion that the carrying value of our Utah facility assets is recoverable, and in accordance with the authoritative guidance, we did not perform a test of impairment.
Inventories:
Inventories are stated at the lower of cost or market. Determining market value of inventories involves judgments and assumptions made by us, including projecting selling prices and cost of sales. To project market value, we review recent sales and gross profit history, existing customer orders, current contract prices, industry supply and demand, forecasted steel prices, replacement costs, seasonal factors, general economic trends and other information, as applicable. If future market conditions are less favorable than those projected by us, inventory write-downs may be required. At December 31, 2009, the inventory balance of $79.3 million is reported net of lower of cost or market adjustments totaling $5.8 million. Raw material inventories of steel are stated at cost either on a specific identification basis or on an average cost basis. All other raw materials, as well as supplies, are stated on an average cost basis. Finished goods are stated at cost using the first-in, first-out method of accounting.
30
Table of Contents
Income Taxes:
We account for income taxes using an asset and liability approach that requires the recognition of deferred tax assets and liabilities for the expected future tax consequences of events that have been recognized in our financial statements or tax returns. Valuation allowances are established when necessary to reduce deferred income tax assets to the amount expected to be realized. The determination of our provision for income taxes requires significant judgment, the use of estimates and the interpretation and application of complex tax laws. Our provision for income taxes primarily reflects a combination of income earned and taxed in the various U.S. federal and state and, to a lesser extent, foreign jurisdictions. Jurisdictional tax law changes, increases or decreases in permanent differences between book and tax items, accruals or adjustments of accruals for unrecognized tax benefits or valuation allowances, and our change in the mix of earnings from these taxing jurisdictions all affect the overall effective tax rate.
We record tax reserves for federal, state, local and international exposures relating to periods subject to audit. The development of reserves for these exposures requires judgments about tax issues, potential outcomes and timing, and is a subjective estimate. We assess our tax positions and record tax benefits for all years subject to examination based upon management’s evaluation of the facts, circumstances, and information available at the reporting dates. For those tax positions where it is more-likely-than-not that a tax benefit will be sustained, we have recorded the largest amount of tax benefit with a greater than 50% likelihood of being realized upon settlement with a tax authority that has full knowledge of all relevant information. For those tax positions where it is not more-likely-than-not that a tax benefit will be sustained, no tax benefit has been recognized in the financial statements.
Workers Compensation Insurance:
We are self-insured, or maintain high deductible policies, for losses and liabilities associated with workers compensation claims. Losses are accrued based upon our estimates of the aggregate liability for claims incurred using historical experience and certain actuarial assumptions followed in the insurance industry.
Derivative Instruments:
We conduct business in various foreign countries, and, from time to time, settle our transactions in foreign currencies. We have established a program that utilizes foreign currency forward contracts to offset the risk associated with the effects of certain foreign currency exposures, typically arising from sales contracts denominated in Canadian currency. These derivative contracts are consistent with our strategy for financial risk management; however, prior to June 30, 2009, they did not meet the conditions under the authoritative guidance to qualify for hedge accounting treatment. Beginning in the quarter ended September 30, 2009, we adopted hedge accounting treatment for qualifying foreign currency forward contracts entered into subsequent to June 30, 2009. Instruments that do not qualify for hedge accounting treatment are re-measured at fair value on each balance sheet date and resulting gains and losses are recognized in net income.
Foreign Currency Transactions:
Assets and liabilities subject to foreign currency fluctuations are translated into United States dollars at the period-end exchange rate, and revenue and expenses are translated at the exchange rate representing an average for the period. Translation adjustments from our designated hedges are included in accumulated other comprehensive income (loss) as a separate component of stockholders’ equity. Gains or losses on all other foreign currency transactions are recognized in the statement of operations.
31
Table of Contents
Results of Operations
The following table sets forth, for the periods indicated, certain financial information regarding costs and expenses expressed as a percentage of total net sales and net sales of our business segments.
| Year Ended December 31, |
||||||||||||
| 2009 | 2008 | 2007 | ||||||||||
| Net sales: |
||||||||||||
| Water transmission |
75.5 | % | 62.8 | % | 73.9 | % | ||||||
| Tubular products |
24.5 | 37.2 | 26.1 | |||||||||
| Total net sales |
100.0 | 100.0 | 100.0 | |||||||||
| Cost of sales |
95.8 | 81.3 | 86.7 | |||||||||
| Gross profit |
4.2 | 18.7 | 13.3 | |||||||||
| Selling, general and administrative expenses |
7.2 | 6.0 | 6.5 | |||||||||
| Operating (loss) income |
(3.0 | ) | 12.7 | 6.8 | ||||||||
| Other (income) expense |
(0.7 | ) | 0.1 | (0.0 | ) | |||||||
| Interest income |
(0.3 | ) | (0.0 | ) | (0.1 | ) | ||||||
| Interest expense |
1.9 | 1.5 | 1.9 | |||||||||
| (Loss) income before income taxes |
(3.9 | ) | 11.1 | 5.0 | ||||||||
| (Benefit) provision for income taxes net income |
(1.3 | ) | 4.2 | 1.7 | ||||||||
| Net (loss) income |
(2.6 | )% | 6.9 | % | 3.3 | % | ||||||
| Segment gross profit (loss) as a percentage of net sales: |
||||||||||||
| Water transmission |
7.7 | % | 16.7 | % | 15.1 | % | ||||||
| Tubular products |
(6.5 | ) | 22.2 | 8.3 | ||||||||
Year Ended December 31, 2009 Compared to Year Ended December 31, 2008
Net sales. Net sales decreased by $172.8 million to $278.7 million in 2009 from $451.4 million in 2008. No single customer accounted for 10% or more of total net sales in 2009 or 2008.
Water Transmission sales decreased 25.8% to $210.4 million in 2009 from $283.6 million in 2008. The decline in net sales was due to an 11% decrease in tons produced and a 17% decrease in the selling price per ton. The decrease in volume was due to reduced demand for production of industrial and municipal water transmission projects. Bidding activity, backlog and production levels may vary significantly from period to period affecting sales volumes. The decrease in selling prices per ton was due to more aggressive bidding activity, resulting from reduced demand in 2009, as well as a decline in steel prices. Lower steel costs generally lead to lower contract values. Steel prices are discussed further in the gross profit analysis.
Tubular Products sales decreased 59.3% to $68.3 million in 2009 from $167.8 million in 2008. The sales decrease was due to a 47% decrease in tons sold and a 23% decline in selling price per ton. All tubular product lines were negatively impacted in 2009. The most significant reductions in demand were the result of decreases in natural gas drilling operations and lower residential and commercial construction activity. Approximately 94.6% of the total decrease in net sales over the prior year was due to our three largest product lines, with energy pipe, standard pipe and structural pipe product lines comprising 57.2%, 24.4% and 13.0% of the decrease, respectively. The sharp decline in sales of our energy pipe, standard pipe and structural pipe product lines was related to decreases in both volume and price. We sold 73% fewer tons of energy pipe products in 2009 and our price per ton decreased 23% in 2009 as compared to 2008. Standard pipe sales volumes decreased 50% and our price per ton decreased 22% in 2009 as compared to 2008. Our structural pipe sales volume decreased 20% and the price per ton declined 26% in 2009 as compared to 2008.
32
Table of Contents
Gross profit. Gross profit decreased 86.2% to $11.7 million (4.2% of total net sales) in 2009 from $84.6 million (18.7% of total net sales) in 2008.
Water Transmission gross profit decreased 65.9% to $16.1 million (7.7% of segment net sales) in 2009 from $47.3 million (16.7% of segment net sales) in 2008. The drop in gross profit from the prior year was due to more aggressive bidding activity leading to lower selling prices per ton, as well as a reduction in tons produced in 2009 as compared to 2008. We incurred fixed production costs which we were unable to absorb due to the decreased total project volume of approximately 11% in 2009 as compared to the prior year.
Our Water Transmission materials cost per ton, including steel, decreased in 2009 by approximately 17% from 2008. We anticipate gross margin to remain at reduced levels through 2011, as the lower-margin projects awarded in 2009 flow through the income statement in subsequent periods. In addition, our inventory values for Water Transmission products reflect a lower of cost or market expense of $3.3 million for the year 2009.
Gross profit from Tubular Products decreased 111.9% to a loss of $4.4 million (-6.5% of segment net sales) in 2009 from $37.3 million (22.2% of segment net sales) in 2008. As noted above, demand for our tubular products decreased significantly, particularly for our energy products which sustained a 79% reduction in sales as compared to the prior year. The significant decrease in volume contributed to the loss in 2009, as the market conditions led to reduced production and our inability to fully cover our fixed costs. This was partially offset by decreased steel costs per ton of 32% in 2009 as compared to 2008. Unlike our Water Transmission segment, contracts for our tubular products are able to be fulfilled in a relatively short time frame, typically within one to three months. Therefore, price changes are more quickly reflected in sales prices and gross profit. In addition, our inventory values for Tubular products reflect a lower of cost or market expense of $1.4 million for the year 2009.
Additional information regarding our exposure to volatile steel prices is set forth in Item 7A “Quantitative and Qualitative Disclosures About Market Risk.”
Selling, general and administrative expenses. Selling, general and administrative expenses decreased 26.2%, to $20.1 million (7.2% of net sales) in 2009 from $27.2 million (6.0% of net sales) in 2008. The decrease of $7.1 million as compared to the prior year consisted of a decrease of $2.5 million in wages, bonus and benefit expense as a result of weaker financial performance, a decrease of $1.0 million in tubular products sales commission expense, a decrease of approximately $1.4 million in travel, entertainment and other administration expenses as a result of cost containment measures, and a decrease of approximately $1.0 million in outside services and professional fees. In addition, we incurred a loss of $0.8 million on retired assets in 2008. These decreases were partially offset by an increase in professional fees of $1.3 million associated with the Audit Committee investigation of certain accounting matters, which is discussed in Note 2, “Restatements of Consolidated Financial Statements” of the Notes to Consolidated Financial Statements in Part II—Item 8, “Financial Statements and Supplementary Data.”
Other (Income) Expense. Other income increased primarily due to the equity earnings in Northwest Pipe Asia.
Interest expense. Interest expense decreased to $5.1 million in 2009 from $6.6 million in 2008. The decrease in interest expense was a result of lower average borrowings at lower average interest rates.
Income taxes. Our effective tax benefit rate was 32.7% in 2009 and our effective tax expense was approximately 38.0% in 2008. The change in our effective tax rate was mainly due to an increase in the valuation allowance related to Section 382 net operating losses, and an increase in excess non-deductible officer’s compensation earned in 2008 but paid in 2009.
Year Ended December 31, 2008, Compared to Year Ended December 31, 2007
Net sales. Net sales increased to $451.4 million in 2008 from $364.3 million in 2007. No single customer accounted for 10% or more of total net sales in 2008 or 2007.
33
Table of Contents
Water Transmission sales increased 5.3% to $283.6 million in 2008 from $269.3 million in 2007. Our selling price per ton increased 47% in 2008 as compared to 2007, but this was partially offset by a decrease in volume of 28%. The increase in price per ton was due to higher prices in our product markets, which generally trend with the cost of steel, our biggest raw material input. The decline in volume was due to the following: a major project with expected revenues of approximately $6 million was postponed in October, and we had no opportunity to replace this volume; and weather issues slowed production in all but two of our facilities. Bidding activity, backlog and production levels may vary significantly from period to period affecting sales.
Tubular Products sales increased 76.6% to $167.8 million in 2008 from $95.0 million in 2007. Approximately 91% of our increase in sales was driven by our three largest product lines: energy pipe products (63% of total increase), standard pipe products (18%), and structural pipe products (10%). Demand for our tubular products was positively impacted through most of 2008 by increases in natural gas drilling operations and overall strength in agricultural and commercial construction markets. Increases in volume and price led to the sharp increase in sales of our energy pipe and standard pipe product lines. We sold 66% more tons of energy pipe products in 2008 and our price per ton increased 67% in 2008 as compared to 2007. Standard pipe sales volumes increased 10% and our price per ton increased 35% in 2008 as compared to 2007. Our structural pipe price per ton increased 32% but our sales volume decreased 3% in 2008 as compared to 2007.
Gross profit. Gross profit increased to $84.6 million (18.7% of total net sales) in 2008 from $48.5 million (13.3% of total net sales) in 2007.
Water Transmission gross profit increased 16.6% to $47.3 million (16.7% of segment net sales) in 2008 from $40.5 million (15.1% of segment net sales) in 2007. The increase in Water Transmission gross profit was largely due to higher selling prices per ton that were only partially offset by reduced volume and increased costs. Our revenue per ton increased 47% in 2008 as compared to 2007. These higher prices were partially offset by increased materials cost per ton, including steel, of 45%.
Gross profit from Tubular Products increased 371.8% to $37.3 million (22.2% of segment net sales) in 2008 from $7.9 million (8.3% of segment net sales) in 2007. The increased volumes and prices per ton discussed above contributed significantly to the increased gross margin. The sharp increases in demand in the tubular energy markets in 2008 led to increased spreads between selling prices and raw material costs. The demand was heightened by constrained steel supplies leading to spiraling prices in raw material inputs and sales prices. As our sales prices trend generally with the steel input costs, the sales price increases were partially offset by higher steel costs per ton of 50% in 2008 as compared to 2007. The increased sales volume led to increased production volumes and lower fixed costs per ton produced.
Selling, general and administrative expenses. Selling, general and administrative expenses increased 15.9% to $27.2 million in 2008 from $23.5 million in 2007. The increase of $3.7 million as compared to the prior year consisted of an increase in wage and bonus expense of $1.8 million as a result of our financial performance, an increase in professional fees of $0.9 million, an additional loss of $0.9 million related to the retirement of assets, and an increase of tubular products sales commission expense of $0.8 million related to increased sales. These increases were partially offset by a decrease of $0.6 million in other miscellaneous expenses.
Interest expense. Interest expense decreased slightly from $7.1 million in 2007 to $6.6 million in 2008. The decrease in interest expense was a result of lower average interest rates, partially offset by higher average borrowings.
Income taxes. Our effective tax rate was approximately 38.0% in 2008 and 34.8% in 2007. The increase in our effective tax rate was mainly due to the additional accrual of a contingent liability related to ongoing income tax audits.
34
Table of Contents
Liquidity and Capital Resources
Sources and Uses of Cash
Our principal sources of liquidity generally include operating cash flow and our bank credit agreement. From time to time our long term capital needs may be met through the issuance of long term debt or additional equity. Our principal uses of liquidity generally include capital expenditures, working capital and debt service. Information regarding our cash flows for the twelve months ended December 31, 2009 is presented in our consolidated statements of cash flows contained in this 2009 Form 10-K, and is further discussed below.
As of December 31, 2009, our working capital (current assets minus current liabilities) was $122.3 million as compared to $192.4 million as of December 31, 2008. Cash and cash equivalents decreased to $31,000 as of December 31, 2009 from $90,000 as of December 31, 2008. Net cash provided by operating activities in 2009 was $79.2 million. Reduced steel prices and lower production volumes resulted in a decrease in inventory levels of $29.1 million. The decrease of $36.9 million in trade and other receivables and the decrease of $19.7 million in costs and estimated earnings in excess of billings on uncompleted contracts were due to lower invoicing with the decline in sales and from timing differences between production, shipment and invoicing of products. We are typically obligated to pay for goods and services within 30 days of receipt, while cash collected from our construction contracts typically extends for several months. Our construction contract revenues in the water transmission segment are recognized on a percentage-of-completion method; therefore, there is little correlation between revenue and cash receipts and the elapsed time can be significant. As such, our payment cycle is a significantly shorter interval compared to our collection cycle.
Net cash used in investing activities in 2009 was $16.1 million, due to capital expenditures of $22.7 million, offset partially by proceeds of $6.8 million from the sale and leaseback of property and equipment. The most significant capital projects in 2009 were the new mill installation in our California facility and the preparation and installation of manufacturing equipment in our Bossier City, Louisiana facility.
Net cash used in financing activities in 2009 was $63.2 million, which resulted from net reductions in our line of credit and long-term debt balances outstanding of $68.4 million, partially offset by a net increase in capital lease obligations of $5.4 million.
We anticipate that our existing cash and cash equivalents, cash flows expected to be generated by operations, and amounts available under our credit agreements will be adequate to fund our working capital and capital requirements for at least the next twelve months. We also expect to continue to rely on cash generated from operations and other sources of available funds to make required principal payments under our long term debt during 2010. To the extent necessary, we may also satisfy capital requirements through additional bank borrowings, senior notes, term notes, subordinated debt, and capital and operating leases, if such resources are available on satisfactory terms. See the discussion below under “Line of Credit and Long-Term Debt” for a discussion of recent developments regarding compliance with the terms of our credit agreements. We have from time to time evaluated and continue to evaluate opportunities for acquisitions and expansion. Any such transactions, if consummated, may use a portion of our working capital or necessitate additional bank borrowings or other sources of funding.
Line of Credit and Long-Term Debt
We had the following significant components of debt at December 31, 2009: a $150.0 million Credit Agreement, under which $19.4 million was outstanding; $10.7 million of Series A Term Note, $7.5 million of Series B Term Notes, $7.1 million of Series C Term Notes and $3.9 million of Series D Term Notes.
The Credit Agreement expires on May 31, 2012, and bears interest at rates related to LIBOR plus 1.25% to 2.25%, or the lending institution’s prime rate, plus 0.00% to 0.75%. Borrowings under the Credit Agreement are collateralized by substantially all of our personal property.
35
Table of Contents
At December 31, 2009, we had $19.4 million outstanding under the Credit Agreement bearing interest at a weighted average rate of 2.78%. At December 31, 2009, we had an additional net borrowing capacity under the credit facility of $123.9 million.
The Series A Term Note in the principal amount of $10.7 million matures on February 25, 2014 and requires annual payments in the amount of $2.1 million plus interest of 8.75% paid quarterly on February 25, May 25, August 25 and November 25. The Series B Term Notes in the principal amount of $7.5 million mature on June 21, 2014 and require annual payments in the amount of $1.5 million plus interest of 8.47% paid quarterly on March 21, June 21, September 21 and December 21. The Series C Term Notes in the principal amount of $7.1 million mature on October 26, 2014 and require annual payments of $1.4 million plus interest of 7.36% paid quarterly on January 26, April 26, July 26 and October 26. The Series D Term Notes in the principal amount of $3.9 million mature on January 24, 2015 and require annual payments in the amount of $645,000 plus interest of 7.32% paid quarterly on January 24, April 24, July 24 and October 24. The Series A Term Note, the Series B Term Notes, the Series C Term Notes, and the Series D Term Notes (together, the “Term Notes”) are collateralized by accounts receivable, inventory and certain equipment.
We had $9.2 million of capital leases outstanding at December 31, 2009, under which certain equipment used in the manufacturing process is leased. The average interest rate on the capital leases is 5.8%.
Our capital lease outstanding as of December 31, 2009 consists of an agreement entered into as of September 2009 to finance our Bossier City, Louisiana facility (the “Financing Arrangement”). As part of the Financing Arrangement, a $10 million escrow account was provided for the Company by a local government entity through a financial institution and will be released upon qualifying purchase requisitions. As we purchase equipment for the facility, we enter into a sale-leaseback transaction with the governmental entity as part of the Financing Arrangement. As of December 31, 2009, $5.6 million was held in the escrow account, which is included in Other Assets, as a result of proceeds from the Financing Arrangement. The Financing Arrangement requires us to meet certain loan covenants, measured at the end of each fiscal quarter. These loan covenants follow the covenants required by our credit agreement.
The Credit Agreement, the Term Notes and certain of our capital leases place various restrictions on our ability to, among other things; incur certain additional indebtedness, create liens or other encumbrances on assets, and incur additional capital expenditures. The Credit Agreement, Term Notes, and certain of our capital leases require us to be in compliance with certain financial covenants. Our 2009 operating results led us to commence discussions in the fourth quarter of 2009 with our bank creditors to obtain waivers of our financial covenants as of December 31, 2009, March 31, 2010 and June 30, 2010. As a result of these discussions, covenant waivers were obtained and we entered into amendments to our Amended and Restated Credit Agreement and Amended and Restated Note Purchase and Private Shelf Agreement as described in Note 17, “Subsequent Events” in Part II—Item 8, “Financial Statements and Supplementary Data.”
The amendments changed the definition, method of application and amounts of the covenants related to the Consolidated Fixed Charge Coverage Ratio, Consolidated Senior Leverage Ratio, Consolidated Total Leverage Ratio, Consolidated Tangible Net Worth, Asset Coverage Ratio, Minimum Consolidated EBITDA, and Maximum Consolidated Rental and Operating Lease Expense. As we were granted waivers of our financial covenants as of December 31, 2009, March 31, 2010 and June 30, 2010, these amended financial covenants will be calculated as of September 30, 2010. Based on our business plan and forecasts of operations, we believe we will remain in compliance with our amended covenants in 2010.
In December 2009, we amended certain lease agreements that resulted in conversions of capital leases to operating leases. The lease amendments resulted in an early extinguishment of debt, on which we incurred additional fees of $142,000 which was recorded as a component of interest expense.
36
Table of Contents
The following table sets forth our scheduled contractual commitments that will affect our future liquidity as of December 31, 2009 (in thousands):
| Total | Payments due by period | |||||||||||||||||||
| Less than 1 year |
1 - 3 years | 3 - 5 years | More than 5 years |
|||||||||||||||||
| Credit agreement |
$ | 19,403 | $ | — | $ | 19,403 | $ | — | $ | — | ||||||||||
| The Term Notes |
29,215 | 5,714 | 11,428 | 11,428 | 645 | |||||||||||||||
| Capital leases (1) |
11,091 | 424 | 3,122 | 3,122 | 4,423 | |||||||||||||||
| Operating leases |
20,893 | 3,997 | 7,317 | 6,320 | 3,259 | |||||||||||||||
| Interest payments (2) |
7,893 | 2,157 | 3,768 | 1,620 | 348 | |||||||||||||||
| Total obligations |
$ | 88,495 | $ | 12,292 | $ | 45,038 | $ | 22,490 | $ | 8,675 | ||||||||||
| (1) | These amounts include a financing arrangement involving the Bossier City facility. |
| (2) | These amounts represent future interest payments related to our debt obligations, excluding the Credit Agreement. |
Due to the uncertainty with respect to the timing of future cash flows associated with our unrecognized tax benefits at December 31, 2009, we are unable to make reasonably reliable estimates of the period of cash settlement with the respective taxing authorities. Therefore, approximately $185,000 in uncertain tax positions has been excluded from the contractual table above. For further information, see Note 15 in Part II—Item 8, “Financial Statements and Supplementary Data” of the Consolidated Financial Statements.
We also have entered into stand-by letters of credit that total approximately $6.6 million as of December 31, 2009. The stand-by letters of credit relate to customer owned material and workers’ compensation insurance. Due to the nature of these arrangements and our historical experience, we do not expect to make any material payments under these arrangements.
Off Balance Sheet Arrangements
We do not have any off balance sheet arrangements that are reasonably likely to have a current or future material effect on our financial position, results of operations or cash flows.
Recent Accounting Pronouncements
See Note 1 in Part II—Item 8, “Financial Statements and Supplementary Data” of the Consolidated Financial Statements for a description of recent accounting pronouncements, including the expected dates of adoption and estimated effects on financial position, results of operations and cash flows.
| Item 7A. | Quantitative and Qualitative Disclosures About Market Risk |
The primary market risks affecting our business relate to our exposure to commodity risk, interest rate risk, and foreign currency exchange rate risk.
Commodity Risk
Certain materials we use in our business are classified as commodities traded in the worldwide markets, of which the most significant commodity is steel, used in the manufacturing of pipe. We do not hedge our commodity risk. The impact of volatility in steel prices to each of our operating segments varies significantly.
Steel comprises approximately 30% to 40% of Water Transmission project costs. As steel represents a substantial portion of our cost of sales, we place orders for steel as soon as possible after a project is awarded. Most projects are awarded within thirty to ninety days of the bid date, and thus we are subject to some market
37
Table of Contents
fluctuations involving steel. In order to minimize our risk exposure to steel volatility, we typically submit bids based on general assumptions of what the price of steel will be once we receive a purchase order or contract. In addition, we typically order steel at the beginning of the project in order to minimize our risk exposure to fluctuations in steel prices.
By contrast, steel comprises approximately 70% to 80% of total product costs for Tubular Products. Historically, we have been able to adjust our selling prices to reflect fluctuations in our cost of steel; however, we are exposed to volatile steel prices in those instances in which we carry steel inventory that is not already assigned to sales orders. To minimize this risk, we monitor steel inventory and purchasing actions. If steel costs were to decline after December 31, 2009, our Tubular Products division would have one to two months of steel inventory exposed to the risk of declining gross margins.
Interest Rate Risk
Our debt at December 31, 2009 bears interest at both fixed and variable rates. At December 31, 2009, approximately $19.4 million of our debt accrues interest at a variable rate as compared to $82.1 million at December 31, 2008. Assuming average interest rates and borrowings on variable rate debt, a hypothetical 10% change in interest rates would have an immaterial impact on our interest expense in either year. The carrying amount of our variable-rate long-term debt approximates fair value.
Foreign Currency Exchange Rate Risk
We transact business in various foreign countries, and, from time to time, settle our transactions in foreign currencies. We have established a program that utilizes foreign currency forward contracts to offset the risk associated with the effects of certain foreign currency exposures, typically arising from sales contracts denominated in Canadian currency. These contracts are not used for trading or for speculative purposes. Foreign currency forward contracts are consistent with our strategy for financial risk management; however, prior to June 30, 2009, they did not meet the conditions under the authoritative guidance to qualify for hedge accounting treatment. Beginning in the quarter ended September 30, 2009, we adopted hedge accounting treatment for qualifying foreign currency forward contracts entered into subsequent to June 30, 2009. A hypothetical 10% change in the Canadian Dollar foreign currency exchange rates would not have a material impact on our reported 2009 or 2008 revenue.
As of December 31, 2009, the total notional amount of these derivative contracts was CAD$22.7 million, of which we applied hedge accounting to CAD$17.0 million. At December 31, 2009, the contracts had remaining maturities of up to 33 months. As of December 31, 2008, the total notional amount of these derivative contracts was CAD$20.8 million.
| Item 8. | Financial Statements and Supplementary Data |
The Consolidated Financial Statements required by this item are included on pages F-1 to F-37 at the end of this 2009 Form 10-K. The financial statement schedule required by this item is included on page S-1. The quarterly information required by this item is included under the caption Quarterly Data (unaudited) in Note 18 of the Notes to Consolidated Financial Statements in Part II—Item 8, “Financial Statements and Supplementary Data” of this 2009 Form 10-K.
| Item 9. | Changes in and Disagreements with Accountants on Accounting and Financial Disclosure |
None.
38
Table of Contents
| Item 9A. | Controls and Procedures |
Audit Committee Investigation and Restatement
As previously disclosed in public filings, the Audit Committee, with the assistance of independent professionals retained by the Audit Committee, conducted an investigation of certain accounting matters, including certain revenue recognition practices. In addition, at the direction of the Audit Committee, an external consulting firm was retained to assist in performing certain related analyses of our accounting practices and previously issued consolidated financial statements.
Based upon consideration of the issues identified in the Audit Committee investigation and the related accounting analyses, and after discussions with management, the Audit Committee concluded that our previously issued consolidated financial statements contained material errors and should be restated. We also identified material weaknesses in internal control over financial reporting for such periods.
Evaluation of Disclosure Controls and Procedures
Disclosure controls and procedures (as defined in Rules 13a-15(e) and 15d-15(e) under the Exchange Act) are designed to provide reasonable assurance that information required to be disclosed in reports we file or submit under the Exchange Act is recorded, processed, summarized and reported within the time periods specified in the rules and forms of the SEC and that such information is accumulated and communicated to our management, including the CEO and CFO, as appropriate to allow timely decisions regarding required disclosures.
In connection with the preparation of this 2009 Form 10-K, our management, under the supervision and with the participation of our CEO and CFO, evaluated the effectiveness of the design and operation of our disclosure controls and procedures as of December 31, 2009. As described below, management has identified material weaknesses in our internal controls over financial reporting, which is an integral component of our disclosure controls and procedures. As a result of those material weaknesses, our CEO and CFO have concluded that, as of December 31, 2009, our disclosure controls and procedures were not effective.
Changes in Internal Control over Financial Reporting
There were no changes in our internal control over financial reporting during the quarter ended December 31, 2009 that materially affected or are reasonably likely to materially affect our internal control over financial reporting. However, as described below under “Plans for Remediation of Material Weaknesses,” we have subsequently dedicated significant resources to support our efforts to improve the control environment and to remedy the control weaknesses described herein.
Management’s Report on Internal Control over Financial Reporting
Our management is responsible for establishing and maintaining adequate internal control over financial reporting, as such term is defined in Exchange Act Rule 13a-15(f). Internal control over financial reporting is a process designed to provide reasonable assurance regarding the reliability of financial reporting and the preparation of financial statements for external purposes in accordance with generally accepted accounting principles (“GAAP”). Internal control over financial reporting includes those policies and procedures that (i) pertain to the maintenance of records that, in reasonable detail, accurately and fairly reflect the transactions and dispositions of our assets; (ii) provide reasonable assurance that our transactions are recorded as necessary to permit preparation of financial statements in accordance with GAAP, and that our receipts and expenditures are being made only in accordance with authorizations of management and our directors; and (iii) provide reasonable assurance regarding prevention or timely detection of unauthorized acquisition, use, or disposition of our assets that could have a material effect on the financial statements.
Because of its inherent limitations, internal control over financial reporting may not prevent or detect all misstatements. Also, projections of any evaluation of effectiveness to future periods are subject to the risk that controls may become inadequate because of changes in conditions, or that the degree of compliance with the policies or procedures may deteriorate.
39
Table of Contents
Under the supervision and with the participation of our management, including our CEO and CFO, we conducted an assessment of our internal control over financial reporting as of December 31, 2009. In making this assessment, we used the criteria set forth in Internal Control-Integrated Framework issued by the Committee of Sponsoring Organizations of the Treadway Commission (“COSO”). A “material weakness” is a deficiency, or a combination of deficiencies, in internal control over financial reporting, such that there is a reasonable possibility that a material misstatement of our annual or interim financial statements will not be prevented or detected on a timely basis. In connection with management’s assessment of our internal control over financial reporting described above, management has identified the following deficiencies that constituted individually, or in the aggregate, material weaknesses in our internal control over financial reporting as of December 31, 2009:
| • | We did not maintain an effective control environment, which is necessary for effective internal control over financial reporting, as evidenced by: (i) an insufficient number of personnel with an appropriate level of GAAP knowledge and experience or ongoing training in the application of GAAP commensurate with the Company’s financial reporting requirements, and (ii) insufficient number of personnel appropriately qualified to perform an appropriately detailed review of the accounting for nonroutine transactions, which resulted in erroneous or unsupported judgments regarding the proper application of GAAP. This control environment weakness also contributed to the additional material weaknesses described below. |
| • | We did not have effective controls to ensure regular validation of management assumptions used in certain of our accounting estimates. Specifically, the Company did not have sufficient controls in place to ensure that the assumptions included in our method of allocating manufacturing overhead variances and indirect support costs to projects in our Water Transmission segment were properly supported by underlying verifiable data. |
| • | We did not have effective controls to ensure that the Company maintained complete and accurate business documentation to support certain revenue, property and equipment, foreign exchange and vendor claim transactions, including related assumptions and estimates. |
| • | We did not have effective controls over certain accounting system calculations in response to changes in assumptions regarding property and equipment and other items. Specifically, the Company did not have sufficient controls in place to properly identify and validate the changes in assumptions underlying the calculations. |
| • | We did not have effective controls over certain spreadsheets. Specifically, the Company did not have sufficient review procedures in place to ensure an accurate preparation of spreadsheets used to support the calculation of steel inventory value and standard to actual cost adjustments within the Tubular Products segment. |
| • | We did not have effective controls over our cash flow statements. Specifically, we did not have proper preparation and review procedures in place to ensure an accurate preparation of our consolidated statements of cash flows as required by GAAP. |
| • | We did not have effective controls to ensure timely internal notification of business transactions and decisions requiring accounting entries. Specifically, our sales and human resources teams and plant personnel did not communicate to our accounting staff all of the information necessary to make accurate accounting determinations for certain accounts receivable and accrued liability balances. |
The material weaknesses described above resulted in misstatements of the aforementioned accounts and disclosures that resulted in material misstatements in our annual and interim consolidated financial statements. Because of these material weaknesses, management has concluded that we did not maintain effective internal control over financial reporting as of December 31, 2009.
Our independent registered public accounting firm, Deloitte & Touche LLP, has issued an audit report on the effectiveness of our internal control over financial reporting as of December 31, 2009, that is included herein.
40
Table of Contents
Plans for Remediation of Material Weaknesses
Our Board, the Audit Committee and management are adding resources and developing and implementing new processes and procedures to remediate, among other things, the material weaknesses that existed in our internal control over financial reporting, and our disclosure controls and procedures, as of December 31, 2009.
Subsequent to August 31, 2010, we are developing a remediation plan (the “Remediation Plan”) to address the material weaknesses for each of the affected areas presented above. The Remediation Plan will ensure that each area affected by a material control weakness is put through a comprehensive remediation process. The Remediation Plan entails a thorough analysis which includes the following phases:
| • | Define and assess each control deficiency: ensure a thorough understanding of the “as is” state, process owners, and procedural or technological gaps causing the deficiency. This work is underway for all identified areas; |
| • | Design and evaluate a remediation action for each control deficiency for each affected area: validate or improve the related policy and procedures; evaluate skills of the process owners with regards to the policy and adjust as required. The Remediation Plan will require an assessment of all control failures; we expect that many of the recent improvements will provide an appropriate starting point for the specific action plans; |
| • | Implement specific remediation actions: train process owners, allow time for process adoption and adequate transaction volume for next steps; |
| • | Test and measure the design and effectiveness of the remediation actions; test and provide feedback on the design and operating effectiveness of the controls; and, |
| • | Management review and acceptance of completion of the remediation effort. |
Additionally, we are evaluating and enhancing our entity level controls as part of our Remediation Plan. The following are steps we have taken in this process:
| • | In March 2010, our Board of Directors appointed a new Chief Executive Officer, and in August 2010, we hired a Director of Compliance and Controls to direct our remediation efforts. |
| • | In August 2010, our Board of Directors elected a new, independent member to join the Board of Directors. |
| • | We have implemented a new sub-certification process with our management group in order to demonstrate a clear commitment to corporate integrity and compliance and a duty to report financial irregularities. |
| • | We have undertaken an effort to enhance existing and adopt new, written policies and procedures; specifically, we have focused on our cost-to-cost percentage-of-completion revenue recognition method to describe more clearly our guiding principles related to the accounting for our Water Transmission contracts. |
The Remediation Plan will be administered by our Director of Compliance and Controls and will involve key leaders from across the organization, including the CEO and CFO. Each specific area of action within the Remediation Plan will be assigned an owner who will coordinate the resources required for timely completion of the remediation activities. The Director of Compliance and Controls will report quarterly and as needed to the Audit Committee of our Board of Directors on the progress made toward completion of the Remediation Plan.
We believe the steps taken to date have improved the effectiveness of our internal control over financial reporting, however we have not completed the corrective processes and procedures identified herein. Accordingly, as we continue to monitor the effectiveness of our internal control over financial reporting in the areas affected by the material weaknesses described above, we will perform additional procedures prescribed by management including the use of manual mitigating control procedures and employ any additional tools and resources deemed necessary to ensure that our financial statements continue to be fairly stated in all material respects.
41
Table of Contents
REPORT OF INDEPENDENT REGISTERED PUBLIC ACCOUNTING FIRM
To the Board of Directors and Stockholders of
Northwest Pipe Company
Vancouver, Washington
We have audited Northwest Pipe Company and subsidiaries’ (the “Company’s”) internal control over financial reporting as of December 31, 2009, based on criteria established in Internal Control—Integrated Framework issued by the Committee of Sponsoring Organizations of the Treadway Commission. The Company’s management is responsible for maintaining effective internal control over financial reporting and for its assessment of the effectiveness of internal control over financial reporting, included in the accompanying Management’s Report on Internal Control over Financial Reporting. Our responsibility is to express an opinion on the Company’s internal control over financial reporting based on our audit.
We conducted our audit in accordance with the standards of the Public Company Accounting Oversight Board (United States). Those standards require that we plan and perform the audit to obtain reasonable assurance about whether effective internal control over financial reporting was maintained in all material respects. Our audit included obtaining an understanding of internal control over financial reporting, assessing the risk that a material weakness exists, testing and evaluating the design and operating effectiveness of internal control based on the assessed risk, and performing such other procedures as we considered necessary in the circumstances. We believe that our audit provides a reasonable basis for our opinion.
A company’s internal control over financial reporting is a process designed by, or under the supervision of, the company’s principal executive and principal financial officers, or persons performing similar functions, and effected by the company’s board of directors, management, and other personnel to provide reasonable assurance regarding the reliability of financial reporting and the preparation of financial statements for external purposes in accordance with generally accepted accounting principles. A company’s internal control over financial reporting includes those policies and procedures that (1) pertain to the maintenance of records that, in reasonable detail, accurately and fairly reflect the transactions and dispositions of the assets of the company; (2) provide reasonable assurance that transactions are recorded as necessary to permit preparation of financial statements in accordance with generally accepted accounting principles, and that receipts and expenditures of the company are being made only in accordance with authorizations of management and directors of the company; and (3) provide reasonable assurance regarding prevention or timely detection of unauthorized acquisition, use, or disposition of the company’s assets that could have a material effect on the financial statements.
Because of the inherent limitations of internal control over financial reporting, including the possibility of collusion or improper management override of controls, material misstatements due to error or fraud may not be prevented or detected on a timely basis. Also, projections of any evaluation of the effectiveness of the internal control over financial reporting to future periods are subject to the risk that the controls may become inadequate because of changes in conditions, or that the degree of compliance with the policies or procedures may deteriorate.
A material weakness is a deficiency, or a combination of deficiencies, in internal control over financial reporting, such that there is a reasonable possibility that a material misstatement of the company’s annual or interim financial statements will not be prevented or detected on a timely basis. The following material weaknesses have been identified and included in management’s assessment: control environment; validation of management assumptions used in accounting estimates; maintenance of complete and accurate business documentation; accounting system calculation controls; spreadsheet controls; timely internal notification of business transactions and decisions requiring accounting entries; and preparation of the statements of cash flows. These material weaknesses were considered in determining the nature, timing, and extent of audit tests applied in our audit of the consolidated financial statements and financial schedule as of and for the year ended December 31, 2009, of the Company, and this report does not affect our report on such financial statements and financial statement schedule.
42
Table of Contents
In our opinion, because of the effect of the material weaknesses identified above on the achievement of the objectives of the control criteria, the Company has not maintained, in all material respects, effective internal control over financial reporting as of December 31, 2009, based on the criteria established in Internal Control—Integrated Framework issued by the Committee of Sponsoring Organizations of the Treadway Commission.
We have also audited, in accordance with the standards of the Public Company Accounting Oversight Board (United States), the consolidated financial statements and financial statement schedule as of and for the year ended December 31, 2009, of the Company and our report dated November 4, 2010 expressed an unqualified opinion on those financial statements and financial statement schedule.
/s/ Deloitte & Touche LLP
Portland, Oregon
November 4, 2010
| Item 9B. | Other Information |
None.
43
Table of Contents
| Item 10. | Directors, Executive Officers and Corporate Governance |
Executive Officers
Listed below is information regarding the individuals serving as our executive officers as of October 8, 2010:
| Richard A. Roman, 59 Chief Executive Officer, President Director |
Information for Mr. Roman is included in the subsequent section titled “Directors”. | |
| Gary A. Stokes, 58 Senior Vice President |
Mr. Stokes has served as our Senior Vice President, responsible for the Water Transmission Group since January 2008. He had served as Senior Vice President, Sales and Marketing since July 2001, and as Vice President, Sales and Marketing since 1993. Mr. Stokes has been with us since 1987. | |
| Robert L. Mahoney, 48 Senior Vice President |
Mr. Mahoney has served as our Senior Vice President, responsible for the Tubular Products Group, since June 2007. He had served as Vice President, Chief Strategic Officer since May 2005, as Vice President, Corporate Development since July 1998, and as Director of Business Planning and Development since 1996. Mr. Mahoney has been with us since 1992. | |
| Stephanie J. Welty, 54 Senior Vice President, Chief Financial Officer Corporate Secretary |
Ms. Welty has served as our Senior Vice President, CFO and Corporate Secretary, since November 2007. Previously, she was CFO at TriQuint Semiconductor, Inc., from 2005 to 2007. From 1994 to 2005, Ms. Welty served first as Accounting Manager, then Director of IT and Vice President of Finance at TriQuint. | |
| Winsor J.E. Jenkins, 62 Vice President |
Mr. Jenkins has served as our Vice President, Human Resources since June 2007. He had served as Corporate Director, Human Resources since March 1998 when he joined us. | |
| Greg Carrier, 56 Vice President |
Mr. Carrier has served as our Vice President, Purchasing since June 2007. He had served as Corporate Director of Materials since 2001. Prior to 2001, Mr. Carrier served in a succession of positions in purchasing and materials management since joining us in 1996. | |
| Gary R. Stone, 54 Vice President |
Mr. Stone has served as our Vice President, Quality Assurance since June 2007. He had served as Corporate Director, Quality Assurance since 2001. Mr. Stone has been with us since 1991. | |
44
Table of Contents
Directors
Listed below is information regarding the individuals serving as our directors as of October 8, 2010:
| William R. Tagmyer, 72 Chairman of the Board, Director, Since 1986 |
Mr. Tagmyer has served as our Chairman of the Board of Directors since 1986. From 1986 to January 1998, Mr. Tagmyer also served as our President and from 1986 to January 2001 as CEO. He is a member of our Executive Committee of the Board of Directors. He worked for L. B. Foster Company, another steel pipe manufacturer, from 1975 to 1986. Prior to 1975, Mr. Tagmyer was employed by U.S. Steel Corporation and FMC Corporation in the areas of sales, marketing, product management and contract administration. Mr. Tagmyer brings to the Board over fifty years of experience in steel and steel-related industries and twenty-five years of experience in leadership positions with the Company. | |
| Richard A. Roman, 59 CEO and President, Director, Since 2003 |
Mr. Roman has served as our CEO since March 29, 2010, and President since October 5, 2010. Mr. Roman has served as a member of our Board of Directors since 2003. In connection with his appointment as CEO, Mr. Roman resigned his positions as Lead Director and as a member of the Board’s Audit and Compensation Committees, and was elected to the Executive Committee of the Board of Directors. He was a member of our Audit and Compensation Committees since 2003 and 2005, respectively, and the Board’s Lead Director since November 2008. Previously, Mr. Roman was also the President of Columbia Ventures Corporation, a private investment company which historically has focused principally on the international metals and telecommunications industries. Prior to joining Columbia Ventures Corporation in 1992, Mr. Roman was a partner at Coopers & Lybrand, an independent public accounting firm. Mr. Roman brings to the Company his knowledge and experience as a partner at a large national independent public accounting firm as well as his more recent management experience as an executive officer of a private investment company. | |
45
Table of Contents
| James E. Declusin, 67 Director, Since 2010 |
Mr. Declusin served as President and CEO of Evraz Inc. NA until February 2010 and as President and CEO of Oregon Steel Mills, Inc. from August 2003 until Oregon Steel Mills was acquired by Evraz Group SA in January 2007. He has served as a director of Oregon Steel Mills and Evraz Inc. NA since 2000. Mr. Declusin spent sixteen years with California Steel Industries, most recently serving as Senior Executive Vice President and Chief Operating Officer, retiring on October 31, 2000. Prior to that time, he spent seventeen years in various management positions in the commercial area of Kaiser Steel Corporation. Currently, he is a member of the Compensation Committee. Mr. Declusin brings to the Board over 40 years of experience in the steel industry, including, most recently, as president and chief executive officer of a large publicly-held steel manufacturing company. | |
| Michael C. Franson, 55 Director, Since 2007 |
Mr. Franson is a founder and is President of St. Charles Capital LLC, an investment banking firm formed in 2005. St. Charles Capital provides expertise in mergers and acquisitions, raising private capital and financial advisory services for middle-market companies across the United States. Prior to founding St. Charles Capital, Mr. Franson was a Managing Director at The Wallach Company, which was subsequently sold to KeyCorp, the parent of KeyBanc Capital Markets. Prior to joining The Wallach Company, Mr. Franson was a partner at Boettcher and Company, a regional investment-banking firm located in Denver. Mr. Franson began his career as an equity analyst at Pacific Mutual Insurance Company, located in Newport Beach, California. Mr. Franson had previously served as a member of our Board of Directors from 2001 until 2005. Currently, he is the Chairman of the Nominating and Governance Committee and a member of our Compensation Committee and Audit Committee. Mr. Franson brings to the Board his background and expertise in investment banking, including substantial experience in financial analysis and financial advisory services, merger and acquisition transactions and a wide variety of capital raising and financing transactions. | |
46
Table of Contents
| Wayne B. Kingsley, 68 Director, Since 1987 |
Mr. Kingsley is Chairman of the Board of Directors of American Waterways, Inc., a passenger vessel operator. From 1985 to 2002, Mr. Kingsley served as Chairman of the Board of Directors of InterVen Partners, Inc., a venture capital management company, and served as General Partner of the venture capital funds managed by InterVen Partners, Inc. Mr. Kingsley also serves on the Board of Directors of one not-for-profit entity. Currently, he is the Chairman of the Audit Committee, a member of the Executive Committee of the Board of Directors and a member of our Nominating and Governance Committee. Mr. Kingsley brings to the Board 23 years of experience as a member of the Board of Directors and investor in the Company, as well as his background as a manager and investor of venture capital funds and more recent experience as chairman of a privately held passenger vessel excursion company. | |
| Keith R. Larson, 52 Director, Since 2007 |
Mr. Larson is a Vice President of Intel Corporation and Managing Director of Intel Capital, Intel Corporation’s venture investment group. Mr. Larson was appointed Vice President in 2006 and has served as a Managing Director of Intel Capital since 2004, managing a team of investment professionals focused on identifying, making, and managing strategic investments. For approximately three months in 2004, Mr. Larson managed the Western Europe and Israel investment team of Intel Capital. From 1999 to 2003, Mr. Larson was a Sector Director managing teams of investment professionals investing in communications, networking, and data storage sectors. Mr. Larson also serves on the Board of Directors of two not-for-profit entities and one state government council. Currently, he is the Chairman of our Compensation Committee and a member of the Audit Committee. Mr. Larson brings to the Board his experience as a senior executive in corporate development in a large multinational public company. | |
Audit Committee
The Audit Committee of the Board of Directors is responsible for the oversight and monitoring of: the integrity of our financial reporting process, financial internal control systems, accounting and legal compliance and the integrity of our financial reporting; the qualifications, independence and performance of our independent auditors; the compliance by us with applicable legal and regulatory requirements; and the maintenance of an open and private, if necessary, communication among the independent auditors, management, legal counsel and the Board. The Board of Directors has adopted a written charter for the Audit Committee, which is available at the Company’s website at www.nwpipe.com under the heading “Corporate Governance.” The members of the Audit Committee are Wayne B. Kingsley, Chair; Keith R. Larson and Michael C. Franson. Each member of the Audit Committee is “independent” as defined by applicable SEC and Nasdaq Stock Market rules. The Board of Directors has determined that Mr. Franson qualifies as an “audit committee financial expert” as defined by the rules of the SEC.
47
Table of Contents
Section 16(A) Beneficial Ownership Reporting Compliance
Section 16(a) of the Securities Exchange Act of 1934, as amended, requires our directors and executive officers and persons who own more than ten percent of a registered class of our equity securities, to file initial reports of ownership and reports of changes in ownership of shares with the SEC. Such persons also are required to furnish us with copies of all Section 16(a) reports they file.
Based solely on our review of the copies of such reports received by us with respect to 2009, or written representations from certain reporting persons, we believe that all filing requirements applicable to our directors, officers and persons who own more than ten percent of a registered class of our equity securities have been complied with for 2009 except that Mr. Larson failed to report one grant of stock on a timely basis on a Form 4 that was subsequently filed. For information concerning stock owned by management and principal shareholders, see Part III—Item 12, “Security Ownership of Certain Beneficial Owners and Management and Related Stockholder Matters.”
Code of Business Conduct and Ethics
We have adopted a Code of Business Conduct and Ethics for all employees and a Code of Ethics for Senior Financial Officers. Copies can be found on our website at www.nwpipe.com in the Corporate Governance area of the Investor Relations section or by writing to Northwest Pipe Company, attn. Corporate Secretary, 5721 SE Columbia Way, Suite 200, Vancouver, WA 98661. None of the material on our website is part of this 2009 Form 10-K. If there is any waiver from any provision of either the Code of Business Conduct and Ethics or the Code of Ethics for Senior Financial Officers, we will disclose the nature of such waiver on our website or in a Current Report on Form 8-K.
| Item 11. | Executive Compensation |
Compensation Discussion and Analysis
Compensation Philosophy and Objectives. The Board of Directors and executive management at Northwest Pipe Company believe that the performance and contribution of our executive officers are critical to our overall success. To attract, retain, and motivate the executives to accomplish our business strategy, the Compensation Committee establishes executive compensation policies and oversees executive compensation practices at Northwest Pipe Company.
The Compensation Committee believes that the most effective executive compensation program is one that is designed to reward the achievement of our specific annual and long-term goals, and which aligns executives’ interests with those of the shareholders by rewarding performance that exceeds established goals, with the ultimate objective of improving shareholder value.
The Compensation Committee also evaluates compensation programs to ensure that we maintain our ability to attract and retain superior employees in key positions and that compensation provided to key employees remains competitive relative to the compensation paid to similarly situated executives. The Compensation Committee believes our executive compensation packages should include both cash and share-based compensation that reward performance as measured against established goals.
In 2008, the Compensation Committee engaged an independent compensation consultant, Mercer, to conduct a review of our executive compensation program, and to advise the Compensation Committee on the design of a long-term equity incentive program. The Compensation Committee did not use a compensation consultant in 2009.
48
Table of Contents
Process for Setting Executive Compensation. The Compensation Committee annually reviews and approves compensation levels and pay mix for our executives.
| • | The Compensation Committee does not utilize specific benchmark levels. Rather, the Compensation Committee considers broad, market based survey data, such as salary.com and WorldatWork.org, when assessing the competitiveness of compensation levels and pay mix for the CEO, CFO and other executives. |
| • | The Compensation Committee evaluated and considered our annual performance within the context of our long-term strategic plan, identifying areas in which expectations were exceeded, achieved or fell below stated goals. The structure of all incentive compensation plans is reviewed periodically to assure their linkage to the current objectives, strategies and performance goals. |
| • | The Compensation Committee evaluated and considered a variety of growth, profitability, return and shareholder value measures relative to historical performance, and relative to internal budgets. |
| • | There is no pre-established policy or target for the allocation between either cash and non-cash or short-term and long-term incentive compensation. Rather, the Compensation Committee exercises business judgment in determining the appropriate level and mix of executive compensation in order to acknowledge the value of time spent on our business through cash and align director and shareholder interests through equity. |
| • | The Compensation Committee used subjective individual performance as a factor in making its decisions. The Compensation Committee and the CEO annually review the performance of each named executive officer (other than the CEO whose performance is reviewed by the Compensation Committee). Based on these reviews, the Compensation Committee makes compensation decisions, including salary adjustments and annual bonus awards, for the named executive officers. |
| • | The Compensation Committee reviewed the total compensation of each named executive officer. |
Elements of Compensation. For the year ended December 31, 2009, the principal components of compensation for executive officers were:
| • | base salary; |
| • | performance-based incentive compensation; |
| • | long-term equity incentive awards (restricted stock units and performance awards); |
| • | retirement benefits; and |
| • | perquisites and other personal benefits. |
Base Salary. We provide executive officers and other employees with a base salary to compensate them for services rendered during the fiscal year. Base salaries are determined for each executive based on his or her position and responsibility, using market data. In addition, we consider the individual performance of the executive, and conduct internal reviews of the executive’s compensation to ensure equity among executive officers. Salary levels are typically reviewed annually as part of our performance review process as well as upon a promotion or other change in job responsibility. Merit based increases to salaries are based on the Compensation Committee’s assessment of the individual executive’s performance. Due to existing economic conditions, no pay increases were given to the named executive officers in 2009. In 2009, we furloughed employees, including executive officers, as part of our cost reduction activities. This furlough had the effect of reducing base salaries in 2009 as compared to 2008.
Performance-Based Incentive Compensation. We provide executive officers and other employees with incentive compensation to incentivize and reward them for high performance and achievement of corporate goals. The bonus program gives the Compensation Committee the latitude to award cash incentive compensation to executive officers and others as a reward for our growth and profitability, and places a significant percentage
49
Table of Contents
of each executive officer’s compensation at risk. Awards are based on our achievement of certain financial performance measures for the year, including sales and net income measures. For 2009, there was no performance-based incentive compensation for the executive officers as a result of our failure to achieve applicable performance targets.
Awards are generally based on our achievement of the following performance measures and are given a certain weighting to determine a bonus amount.
| Performance Measures |
Weight | |||
| Current Year Earnings compared to Prior Year Earnings |
50 | % | ||
| Current Year Net Sales compared to Prior Year Net Sales |
30 | % | ||
| Current Year Earnings compared to the Business Plan |
20 | % | ||
The Compensation Committee has established target awards for the satisfaction of these performance measures. The final amount of these awards is subject to adjustment at the discretion of the Compensation Committee. Even if the performance measures are met, the Compensation Committee retains the right to adjust the actual bonus amounts of each individual. These adjustments are based on individual performance, as well as external factors affecting us or the occurrence of unusual or infrequent events. The following table expresses these awards as a percentage of base salary.
| Performance Measures and Levels |
Tier 1 (1) | Tier 2 (2) | Tier 3 (3) | |||||||||
| Earnings Growth over Prior Year |
||||||||||||
| Maximum (150% of Target) |
80 | % | 75 | % | 70 | % | ||||||
| Target |
25 | % | 20 | % | 15 | % | ||||||
| Threshold (80% of Target) |
0 | % | 0 | % | 0 | % | ||||||
| Sales Growth over Prior Year |
||||||||||||
| Maximum (150% of Target) |
39 | % | 36 | % | 33 | % | ||||||
| Target |
15 | % | 12 | % | 9 | % | ||||||
| Threshold (80% of Target) |
0 | % | 0 | % | 0 | % | ||||||
| Current Year Earnings over Business Plan |
||||||||||||
| Maximum (150% of Target) |
30 | % | 28 | % | 26 | % | ||||||
| Target |
10 | % | 8 | % | 6 | % | ||||||
| Threshold (70% of Target) |
0 | % | 0 | % | 0 | % | ||||||
| (1) | Includes our CEO and President (As of December 31, 2009) |
| (2) | Includes our Senior Vice Presidents |
| (3) | Includes our Vice Presidents |
Award levels established by consideration of the 2008 actual results ($ in millions):
| 2009 “Threshold” Performance Level ($) |
2009
“Target” Performance Level ($) |
2009 “Maximum” Performance Level ($) |
||||||||||
| Net income |
$ | 26 | $ | 32 | $ | 48 | ||||||
| Water transmission operating profit (1)(2) |
34 | 43 | 64 | |||||||||
| Tubular products operating profit (1)(2) |
29 | 36 | 55 | |||||||||
| Revenue |
352 | 440 | 660 | |||||||||
| Water transmission revenue (1)(2) |
218 | 272 | 408 | |||||||||
| Tubular products revenue (1)(2) |
134 | 168 | 252 | |||||||||
50
Table of Contents
Award levels established by consideration of the 2009 business plan ($ in millions):
| 2009 “Threshold” Performance Level ($) |
2009 “Target” Performance Level ($) |
2009 “Maximum” Performance Level ($) |
||||||||||
| Net income |
$ | 29 | $ | 42 | $ | 63 | ||||||
| Water transmission operating profit (1)(2) |
50 | 72 | 107 | |||||||||
| Tubular products operating profit (1)(2) |
17 | 24 | 36 | |||||||||
| (1) | Levels used to determine performance targets for our Group Executives. |
| (2) | Does not include corporate selling, general and administrative expenses. |
Long-Term Equity Incentive Awards. Beginning in 2008, we began providing long-term equity incentive awards to executive officers and certain designated key employees. The long-term equity incentive awards are designed to ensure that our executive officers and key employees have a continuing stake in our long-term success. In addition, the awards emphasize pay-for-performance. Terms and conditions of the awards are determined on an annual basis by the Compensation Committee. The amount of the initial equity award was determined based on a percentage of the recipient’s salary, and ranged from twelve and one-half percent to eighty percent, depending on the grade level of the employee. Under the grant, twenty percent of the award was in the form of restricted stock units (“RSUs”), and eighty percent of the award was in the form of performance share awards (“PSAs”). RSUs are service based and entitle the holder to one share of Common Stock at the end of the vesting period (generally the vesting occurs annually over a three-year period), subject to continued employment. RSUs are designed to attract and retain executive officers and others by providing them with the benefits associated with the increase in the value of the Common Stock during the vesting period, while incentivizing them to remain with us long-term. PSAs are performance- and service-based, and entitle the holder to receive one share of Common Stock, generally based on the achievement of a three-year earnings per share result compared to a pre-established target. The number of PSAs and, therefore, the number of shares awarded at the end of a performance period can range from zero to 225% of the target award. Vesting of the awarded PSAs generally occurs following the end of the performance period, subject to continued employment. PSAs serve several purposes. They have value to the holder only if threshold earnings per share goals are achieved during their performance measurement period (generally three-year) and they serve as a retention tool because awards made for the attainment of the targeted earnings per share goals vest equally over two years following the performance measurement period. Additionally, the holders benefit further if they are successful in increasing the value of our Common Stock.
Concurrent with the implementation of the long-term equity incentive awards, we adopted a requirement that over the next five years executive officers must accumulate, and hold thereafter, one times their then-current annual salary in Common Stock
Retirement Benefits. In order to provide competitive total compensation, we offer our executive officers and certain designated key employees a nonqualified retirement savings plan (the “Deferred Compensation Plan”), which provides executive officers and others with the opportunity to defer salary and bonus compensation for a period of years or until termination of employment. Executive officers who defer salary or bonus under the Deferred Compensation Plan are credited with market-based returns. We may make a discretionary matching contribution based on deferrals made by each participant. In addition, we will make a contribution based on a target benefit projected for each participant. The target benefit projected is 1% of base salary in the year before attaining normal retirement age per year of employment (up to 35 years) with us. For 2009, deferred compensation match accounted for approximately 5% and 7% of the total compensation for the President and the other executive officers, respectively.
We also offer a qualified 401(k) defined contribution plan. The ability of executive officers to participate fully in this plan is limited under IRS and ERISA requirements. The 401(k) plan encourages employees to save for retirement by investing on a regular basis through payroll deductions.
51
Table of Contents
Perquisites and Other Personal Benefits. We provide executive officers with perquisites and other personal benefits that we and the Compensation Committee believe are reasonable and consistent with our overall compensation program to better enable us to attract, retain and motivate employees for key positions. We are selective in our use of perquisites, utilizing perquisites that are commonly provided, the value of which is generally modest. The Compensation Committee periodically reviews the levels of perquisites and other personal benefits provided to executive officers. The primary perquisites are car allowances, club membership dues, life insurance premiums and infrequent payments of spousal travel.
52
Table of Contents
Summary of Cash and Certain Other Compensation
The following table reflects compensation earned by our CEO, our CFO, and each of the three of our other most highly compensated executive officers, for the years ended December 31, 2009, 2008 and 2007 (the “named executive officers”).
| Name and Principal Position |
Year | Salary (1) | Bonus (2) | Stock Awards (3) |
Option Awards (4) |
Non-Equity Incentive Plan Compensation |
All Other Compensation |
Total ($) | ||||||||||||||||||||||||
| Brian W. Dunham (5) |
2009 | $ | 559,000 | $ | — | $ | 96,805 | $ | — | $ | — | $ | 74,420 | (7) | $ | 730,225 | ||||||||||||||||
| Director, Chief Executive Officer and President |
2008 | 570,000 | 720,069 | 525,183 | — | 242,028 | 75,728 | (7) | 2,133,008 | |||||||||||||||||||||||
| 2007 | 545,000 | 560,000 | — | — | 53,948 | 71,606 | (7) | 1,230,554 | ||||||||||||||||||||||||
| Gary A. Stokes |
2009 | 282,500 | — | 36,669 | — | — | 61,806 | (8) | 380,975 | |||||||||||||||||||||||
| Senior Vice President |
2008 | 288,000 | 150,080 | 199,009 | — | 89,410 | 66,693 | (8) | 793,192 | |||||||||||||||||||||||
| 2007 | 262,500 | 232,000 | — | — | 19,653 | 58,854 | (8) | 573,007 | ||||||||||||||||||||||||
| Robert L. Mahoney |
2009 | 243,250 | — | 31,582 | — | — | 44,722 | (9) | 319,554 | |||||||||||||||||||||||
| Senior Vice President |
2008 | 248,000 | 324,261 | 171,377 | — | 75,536 | 47,324 | (9) | 866,498 | |||||||||||||||||||||||
| 2007 | 231,000 | 192,000 | — | — | 15,342 | 45,122 | (9) | 483,464 | ||||||||||||||||||||||||
| Stephanie J. Welty (6) |
2009 | 240,250 | — | 31,188 | — | — | 25,810 | (10) | 297,248 | |||||||||||||||||||||||
| Senior Vice President, Chief Financial Officer and Corporate Secretary |
2008 | 245,000 | 283,534 | 104,314 | — | 12,250 | 16,059 | (10) | 661,157 | |||||||||||||||||||||||
| 2007 | 40,000 | 50,000 | — | — | — | 2,815 | (10) | 92,815 | ||||||||||||||||||||||||
| Winsor J.E. Jenkins |
2009 | 164,000 | — | 12,415 | — | — | 53,283 | (11) | 229,698 | |||||||||||||||||||||||
| Vice President |
2008 | 167,200 | 185,723 | 67,435 | — | 27,964 | 51,571 | (11) | 499,893 | |||||||||||||||||||||||
| 2007 | 160,000 | 60,000 | — | — | 5,245 | 13,200 | (11) | 238,445 | ||||||||||||||||||||||||
| (1) | Includes amounts earned in each of the respective years, even if deferred. |
| (2) | Annual bonus represents amount earned for the year. Actual payments may be made over subsequent years. |
| (3) | The amounts included in this column represent the aggregate grant date fair value of restricted stock units and performance share awards granted during the years reported in accordance with FASB ASC Topic 718. The amounts previously reported for 2008 and 2007 have been restated to reflect the aggregate grant date fair value of the grants in accordance with current SEC rules. The amounts reported for the performance share awards assume that the awards are paid out at the probable outcome, which is consistent with the amounts we have recorded in our financial statements. Assuming that the 2009 performance stock awards are paid out at the maximum level, the grant date fair value of the awards for each named executive would be as follows: Mr. Dunham- $967,983; Mr. Stokes- $366,759; Mr. Mahoney- $315,820; Ms. Welty- $312,020; Mr. Jenkins- $124,216. The assumptions used to calculate the grant date fair value for the stock awards are in Note 12 to the Consolidated Financial Statements included in Part II—Item 8, “Financial Statements and Supplementary Data” of this 2009 Report on Form 10-K. These amounts do not correspond to the actual value that will be recognized by the named executives. |
| (4) | There were no stock option awards to named executive officers in 2009, 2008 or 2007. |
| (5) | Mr. Dunham resigned from his position as the CEO effective as of March 29, 2010, and resigned as our President and as a member of our Board of Directors effective as of October 5, 2010. |
| (6) | Ms. Welty joined us as CFO in November 2007. |
| (7) | Amount includes $42,701, $43,706 and $41,608 in 2009, 2008 and 2007, respectively, contributed by us to Mr. Dunham’s nonqualified retirement savings plan, and amounts paid by us for contributions to Mr. Dunham’s qualified 401(k) defined contribution benefit plan, life insurance premiums, annual automobile allowance, club membership dues and spousal travel expenses. |
53
Table of Contents
| (8) | Amount includes $32,811, $34,426 and $30,018 in 2009, 2008 and 2007, respectively, contributed by us to Mr. Stokes’ nonqualified retirement savings plan, and amounts paid by us for contributions to Mr. Stokes’ qualified 401(k) defined contribution plan, club membership dues, annual automobile allowance and spousal travel expenses. |
| (9) | Amount includes $19,545, $19,825 and $17,976 in 2009, 2008 and 2007, respectively, contributed by us to Mr. Mahoney’s nonqualified retirement savings plan, and amounts paid by us for contributions to Mr. Mahoney’s qualified 401(k) defined contribution plan, club membership dues, annual automobile allowance and spousal travel expenses. |
| (10) | Amount includes $2,945, $0 and $0 in 2009, 2008 and 2007, respectively, contributed by us to Ms. Welty’s nonqualified retirement savings plan, and amounts paid by us for contributions to Ms. Welty’s qualified 401(k) defined contribution plan and annual automobile allowance. |
| (11) | Amount includes $30,122, $30,331 and $0 in 2009, 2008 and 2007, respectively, contributed by us to Mr. Jenkins’s nonqualified retirement savings plan, and amounts paid by us for contributions to Mr. Jenkins’s qualified 401(k) defined contribution plan and annual automobile allowance. |
Grants of Plan-Based Awards
The following table reflects grants of long-term equity incentive awards granted to each of the eligible named executive officers for the year ended December 31, 2009. The conditions that must be met before these awards are issued are discussed under “Long-Term Equity Incentive Awards” above.
| Estimated Future Payouts Under Equity Incentive Plan Awards |
Grant Date Fair Value of Stock Awards (3) |
|||||||||||||||||||
| Name |
Grant Date | Threshold (#) |
Target (#) | Maximum (#) |
||||||||||||||||
| Brian W. Dunham |
4/15/2009 | (1) | — | 3,197 | 3,197 | $ | 96,805 | |||||||||||||
| 4/15/2009 | (2) | — | 12,787 | 28,771 | 387,190 | |||||||||||||||
| Gary A. Stokes |
4/15/2009 | (1) | — | 1,211 | 1,211 | 36,669 | ||||||||||||||
| 4/15/2009 | (2) | — | 4,845 | 10,901 | 146,707 | |||||||||||||||
| Robert L. Mahoney |
4/15/2009 | (1) | — | 1,043 | 1,043 | 31,582 | ||||||||||||||
| 4/15/2009 | (2) | — | 4,172 | 9,387 | 126,328 | |||||||||||||||
| Stephanie J. Welty (6) |
4/15/2009 | (1) | — | 1,030 | 1,030 | 31,188 | ||||||||||||||
| 4/15/2009 | (2) | — | 4,122 | 9,275 | 124,814 | |||||||||||||||
| Winsor J.E. Jenkins |
4/15/2009 | (1) | — | 410 | 410 | 12,415 | ||||||||||||||
| 4/15/2009 | (2) | — | 1,641 | 3,692 | 49,689 | |||||||||||||||
| (1) | Awards represent the RSUs granted under the long-term equity incentive plan. The methodology applied in determining these awards and how they are earned is discussed under “Long-Term Equity Incentive Awards” above. |
| (2) | Awards represent the PSAs granted under the long-term equity incentive plan. The methodology applied in determining these awards and how they are earned is discussed under “Long-Term Equity Incentive Awards” above. |
| (3) | The grant date fair value of the awards is based on the closing price of one share of Common Stock on April 15, 2009. |
54
Table of Contents
Outstanding Equity Awards at 2009 Fiscal Year End
The following table sets forth, for each of the named executive officers, the equity awards made to each such named executive officer that were outstanding at December 31, 2009.
| Option Awards | Stock Awards | |||||||||||||||||||||||
| Number of Securities Underlying Unexercised Options (#) |
Option Exercise Price ($) |
Option Expiration Date |
Equity Incentive Plan Awards: Number of Unearned Shares, Units or Other Rights That Have Not Vested (#) |
Equity Incentive Plan Awards Market or Payout Value of Unearned Shares, Units or Other Rights That Have Not Vested ($) |
||||||||||||||||||||
| Name |
Exercisable | Unexercisable | ||||||||||||||||||||||
| Brian W. Dunham |
35,945 | (1) | — | 13.563 | 05/02/2010 | — | — | |||||||||||||||||
| 38,571 | (2) | — | 14.000 | 05/15/2011 | — | — | ||||||||||||||||||
| 12,798 | (3) | — | 17.900 | 05/23/2012 | — | — | ||||||||||||||||||
| — | — | — | 1,267 | (4) | $ | 34,032 | ||||||||||||||||||
| — | — | — | 3,197 | (5) | 85,871 | |||||||||||||||||||
| — | — | — | 16,061 | (6) | 431,398 | |||||||||||||||||||
| — | — | — | 12,787 | (7) | 343,459 | |||||||||||||||||||
| Gary A. Stokes |
13,405 | (1) | — | 13.563 | 05/02/2010 | — | — | |||||||||||||||||
| 13,791 | (2) | — | 14.000 | 05/15/2011 | — | — | ||||||||||||||||||
| 4,373 | (3) | — | 17.900 | 05/23/2012 | — | — | ||||||||||||||||||
| — | — | — | 480 | (4) | 12,893 | |||||||||||||||||||
| — | — | — | 1,211 | (5) | 32,527 | |||||||||||||||||||
| — | — | — | 6,086 | (6) | 163,470 | |||||||||||||||||||
| — | — | — | 4,845 | (7) | 130,137 | |||||||||||||||||||
| Robert L. Mahoney |
8,582 | (1) | — | 13.563 | 05/02/2010 | — | — | |||||||||||||||||
| 9,286 | (2) | — | 14.000 | 05/15/2011 | — | — | ||||||||||||||||||
| 2,986 | (3) | — | 17.900 | 5/23/2012 | — | — | ||||||||||||||||||
| — | — | — | 413 | (4) | 11,093 | |||||||||||||||||||
| — | — | — | 1,043 | (5) | 28,015 | |||||||||||||||||||
| — | — | — | 5,240 | (6) | 140,746 | |||||||||||||||||||
| — | — | — | 4,172 | (7) | 112,060 | |||||||||||||||||||
| Stephanie J. Welty |
— | — | — | 408 | (4) | 10,959 | ||||||||||||||||||
| — | — | — | 1,030 | (5) | 27,666 | |||||||||||||||||||
| — | — | — | 4,907 | (6) | 131,802 | |||||||||||||||||||
| — | — | — | 4,122 | (7) | 110,717 | |||||||||||||||||||
| Winsor J.E. Jenkins |
— | — | — | 164 | (4) | 4,405 | ||||||||||||||||||
| — | — | — | 410 | (5) | 11,013 | |||||||||||||||||||
| — | — | — | 2,061 | (6) | 55,358 | |||||||||||||||||||
| — | — | — | 1,641 | (7) | 44,077 | |||||||||||||||||||
| (1) | These options were granted on May 2, 2000 and vested in sixty equal monthly installments beginning on June 2, 2000, and were fully vested on May 2, 2005. |
| (2) | These options were granted on May 15, 2001 and vested in sixty equal monthly installments beginning on June 15, 2001, and were fully vested on May 15, 2006. |
| (3) | These options were granted on May 23, 2002 and vested in sixty equal monthly installments beginning on June 23, 2002, and were fully vested on May 23, 2007. |
| (4) | These RSUs were granted on August 18, 2008 and vest as follows: 33% in February 2010; 45% in August 2010; and 22% in August 2011. |
55
Table of Contents
| (5) | These RSUs were granted on April 15, 2009 and vest as follows: 34% in March 2010; 33% in March 2011; and 33% in March 2012. |
| (6) | These performance stock awards were granted on August 18, 2008 and vest as follows, dependent upon achievement of the performance conditions: 37% in February 2010; 42% in February 2011; and 21% in February 2012. |
| (7) | These performance stock awards were granted on April 15, 2009 and vest as follows, dependent upon achievement of the performance conditions: 100% in March 2012. |
2009 Option Exercises and Stock Vesting
The following table sets forth, for each named executive officer, the number of shares acquired upon option exercises and vesting of stock awards during 2009 and the related value realized upon such exercises.
| Name |
Option Awards | Stock Awards | ||||||||||||||
| Number of Shares Acquired on Exercise (#) (1) |
Value Realized on Exercise ($) (2) |
Number of Shares Acquired on Vesting (#) (3) |
Value Realized on Vesting ($) (4) |
|||||||||||||
| Brian W. Dunham |
30,508 | $ | 553,720 | 6,067 | $ | 187,842 | ||||||||||
| Gary A. Stokes |
— | — | 2,299 | 71,179 | ||||||||||||
| Robert L. Mahoney |
7,281 | 132,150 | 1,980 | 61,305 | ||||||||||||
| Stephanie J. Welty |
— | — | 1,004 | 29,989 | ||||||||||||
| Winsor J.E. Jenkins |
— | — | 778 | 24,087 | ||||||||||||
| (1) | This column shows the number of shares underlying the options exercised in 2009 by the named executive officers. The actual number of shares received by these individuals from options exercised in 2009 (net of shares used to cover the exercise price, if so elected) was as follows: Mr. Dunham – 16,830; Ms. Welty – 0; Mr. Stokes – 0; Mr. Mahoney – 4,017; and Mr. Jenkins – 0. |
| (2) | The value realized is based on the difference between the market price at the time of exercise of the options and the applicable exercise price. |
| (3) | This column shows the number of shares acquired on vesting in 2009 by the named executive officers. The actual number of shares received by these individuals from shares vested in 2009 (net of shares used to cover the applicable income taxes, if so elected) was as follows: Mr. Dunham – 3,941; Mr. Stokes – 2,006; Mr. Mahoney – 1,320; Ms. Welty – 753; Mr. Jenkins – 584. |
| (4) | The value realized on vesting is based on the closing market price multiplied by the number of shares of stock vested on the applicable vesting date. |
2009 Nonqualified Deferred Compensation
The following table sets forth, for each named executive officer under our Deferred Compensation Plan, the amounts of the contributions made by each executive, the contributions made by us, the earnings generated by the investments within the Plan, and the balance of each named executive officer’s account under the Deferred Compensation Plan at December 31, 2009.
| Name |
Executive Contributions in Last Fiscal Year (1) |
Company Contributions in Last Fiscal Year (1) |
Aggregate Earnings in Last Fiscal Year |
Aggregate Balance at Last Fiscal Year-End |
||||||||||||
| Brian W. Dunham |
$ | 10,417 | $ | 42,701 | $ | 98,652 | $ | 530,002 | ||||||||
| Gary A. Stokes |
16,948 | 32,811 | 92,508 | 496,979 | ||||||||||||
| Robert L. Mahoney |
105,072 | 19,545 | 113,940 | 586,451 | ||||||||||||
| Stephanie J. Welty |
5,889 | 2,945 | 347 | 9,181 | ||||||||||||
| Winsor J.E. Jenkins |
— | 30,122 | 15,483 | 96,955 | ||||||||||||
| (1) | These contributions are also reported in the All Other Compensation Column of the Summary Compensation Table. |
56
Table of Contents
| (2) | A portion of the amounts in the Aggregate Balance at Last Fiscal Year-End column were reported in the Summary Compensation Table of previous years in the Salary column (in the case of executive contributions) or in the All Other Compensation column (in the case of registrant contributions). |
Change in Control Agreements
We have entered into change in control agreements (the “Agreements”) with our executive officers. Each of the Agreements is for a term ending July 19, 2011, provided that on that date and each anniversary thereafter, the term of the Agreements will be automatically extended by one year unless either party gives 90 days prior written notice that the term of an agreement shall not be so extended. If a “Change in Control” (as defined in the Agreements and described below) occurs during the term of Agreements, the Agreements will continue in effect until two years after the Change in Control.
If an executive officer’s employment is terminated within two years after a Change in Control either by us without “Cause” (as defined in the Agreements and described below) or by the executive officer for “Good Reason” (as defined in the Agreements and described below), the executive officer will be entitled to receive his or her full base salary through the date of termination and any benefits or awards (both cash and stock) that have been earned or are payable through the date of termination plus (i) a lump sum payment equal to two years’ base salary (one year in the case of Mr. Jenkins) and (ii) an amount equal to two times (one times in the case of Mr. Jenkins) the average cash bonuses paid to the executive officer during the previous three years. In addition, the executive officer would be entitled to the continuation of health and insurance benefits for certain periods and all outstanding unvested stock options would immediately become fully vested. In the event that the payments made to an executive officer would be deemed to be a “parachute payment” under the Internal Revenue Code of 1986, an executive officer may choose to accept payment of a reduced amount that would not be deemed to be a “parachute payment.”
If an executive officer’s employment is terminated within two years after a Change in Control either by us for Cause or as a result of the executive officer’s disability or death, the executive officer will be entitled to receive his or her full base salary through the date of termination plus any benefits or awards (both cash and stock) that have been earned or are payable through the date of termination.
For purposes of the Agreements, a “Change in Control” includes (i) any merger or consolidation transaction in which we are not the surviving corporation, unless our shareholders immediately before such transaction have the same proportionate ownership of common stock of the surviving corporation in the transaction, (ii) the acquisition by any person of 30 percent or more of our total combined voting power, (iii) the liquidation or the sale or other transfer of substantially all of our assets, and (iv) a change in the composition of the Board of Directors during any two-year period such that the directors in office at the beginning of the period and/or their successors who were elected by or on the recommendation of two-thirds of the directors in office at the beginning of the period do not constitute at least a majority of the Board of Directors. For purposes of the Agreements, “Good Reason” includes (i) an adverse change in the executive officer’s status, title, position(s) or responsibilities or the assignment to the executive of duties or responsibilities which are inconsistent with the executive officer’s status, title or position, (ii) a reduction in the executive officer’s base salary or the failure to pay compensation otherwise due to the executive officer, (iii) a requirement that the executive officer be based anywhere other than within 10 miles of his or her job location before the Change in Control, (iv) our failure to continue any compensation or employee benefit plan or program in effect before the Change in Control or any act or omission that would adversely affect the executive officer’s continued participation in any such plan or program or materially reduce the benefits under such plan or program, and (v) our failure to require any of our successor to assume our obligations under the Agreements within 30 days after a Change in Control. For purposes of the Agreements, “Cause” means the willful and continued failure to satisfactorily perform the duties assigned to the executive officer within a certain period after notice of such failure is given and commission of certain illegal conduct.
57
Table of Contents
The amount of compensation payable to each named executive officer in each situation under a change in control is listed in the tables below. The amounts shown assume that a change in control occurred and that the employment of each executive was terminated effective as of December 31, 2009.
| Executive Benefits and Payments Upon Termination |
Termination Without Cause or Voluntary Termination for Good Reason |
Termination For Cause, Disability or Death |
||||||
| Mr. Dunham (1) |
||||||||
| Base Salary |
$ | 1,677,000 | $ | — | ||||
| Bonus |
1,255,976 | — | ||||||
| Health and Insurance Benefits |
62,771 | — | ||||||
| Earned Vacation |
53,750 | 53,750 | ||||||
| Mr. Stokes |
||||||||
| Base Salary |
$ | 565,000 | $ | — | ||||
| Bonus |
317,375 | — | ||||||
| Health and Insurance Benefits |
25,185 | — | ||||||
| Earned Vacation |
26,077 | 26,077 | ||||||
| Mr. Mahoney |
||||||||
| Base Salary |
$ | 486,500 | $ | — | ||||
| Bonus |
246,252 | — | ||||||
| Health and Insurance Benefits |
32,372 | — | ||||||
| Earned Vacation |
23,389 | 23,389 | ||||||
| Ms. Welty |
||||||||
| Base Salary |
$ | 480,500 | $ | — | ||||
| Bonus |
62,250 | (2) | — | |||||
| Health and Insurance Benefits |
23,267 | — | ||||||
| Earned Vacation |
23,101 | 23,101 | ||||||
| Mr. Jenkins |
||||||||
| Base Salary |
$ | 246,000 | $ | — | ||||
| Bonus |
76,604 | — | ||||||
| Health and Insurance Benefits |
12,364 | — | ||||||
| Earned Vacation |
6,308 | 6,308 | ||||||
| (1) | Mr. Dunham resigned as President and a member of our Board of Directors effective October 5, 2010. |
| (2) | Because Ms. Welty joined us in November 2007, this amount is based on the average cash bonuses paid during the previous two years, instead of three years. |
Director Compensation
Members of the Board of Directors who are also our employees do not receive additional compensation for serving as directors. Each nonemployee director receives a $24,000 annual retainer, $1,250 for each Board meeting attended and $500 for each meeting of a committee of the Board attended. The Audit Committee Chairperson receives an additional annual retainer of $7,500, and the Compensation Committee Chairperson and Nominating and Governance Committee Chairperson receive an additional annual retainer of $5,000 and $5,000, respectively. In addition, in 2009 each nonemployee director received an award of $45,000 which was paid in cash, in an equivalent number of shares of Northwest Pipe Company Common Stock, or in a combination thereof, as specified by each director. Our members of the Board of Directors are also reimbursed for travel expenses incurred in attending board meetings.
58
Table of Contents
Director Compensation Table.
The following table reflects compensation earned by the directors for the year ended December 31, 2009, with the exception of Mr. Dunham, whose compensation is included in the Summary of Cash and Certain Other Compensation table above.
| Name (1) |
Fees Earned or Paid in Cash |
Stock Awards (2) |
All Other Compensation (3) |
Total | ||||||||||||
| William R. Tagmyer |
$ | — | $ | — | $ | 169,784 | $ | 169,784 | ||||||||
| Richard A. Roman (4) |
85,000 | — | — | 85,000 | ||||||||||||
| Michael C. Franson |
76,500 | — | — | 76,500 | ||||||||||||
| Wayne B. Kingsley |
86,500 | — | — | 86,500 | ||||||||||||
| Keith R Larson |
53,002 | 26,998 | — | 80,000 | ||||||||||||
| (1) | As of December 31, 2009, each director had the following number of options outstanding: Mr. Franson – 2,000; Mr. Kingsley – 12,000; Mr. Larson – 0; Mr. Roman – 15,000; Mr. Tagmyer – 0. |
| (2) | On September 21, 2009, shares of common stock were granted to Mr. Larson, pursuant to our 2007 Stock Incentive Plan. The amount included in this column represent the amount recognized by us in 2009 for financial statement reporting purposes for the fair value of common stock awarded to Mr. Larson. These amounts do not correspond to the actual value that will be recognized by Mr. Larson. For information on the valuation assumptions with respect to grants made in 2009, refer to the note on Share-Based Compensation Plans included in consolidated financial statements. |
| (3) | Amount includes $150,000 base salary, amounts contributed to Mr. Tagmyer’s qualified 401(k) defined contribution plan and amounts paid by us for his automobile allowance. |
| (4) | Mr. Roman is serving as our CEO, effective as of March 29, 2010, and President since October 5, 2010. Mr. Roman has been a member of our Board of Directors and Audit Committee since 2003, our Compensation Committee since 2005 and the Board’s Lead Director since November 2008. In connection with his appointment as CEO, Mr. Roman resigned his positions as Lead Director and as a member of the Board’s Audit and Compensation Committees. |
Employment Agreements
Employment Agreement with Richard A. Roman. We entered into an Employment Agreement (the “Roman Employment Agreement”) with Mr. Roman effective March 29, 2010. The Roman Employment Agreement provides for an annual base salary of $450,000 and eligibility to participate in our cash and stock incentive plans and all other employee benefit plans available to our employees. The Roman Employment Agreement has a two-year term. Mr. Roman has been granted an option to purchase 24,000 shares of common stock at an exercise price equal to $24.15, the fair market value of the common stock on the date of grant. The stock option was fully vested on the date of grant. If Mr. Roman’s employment is terminated for Cause (as defined in the Roman Employment Agreement), or if Mr. Roman terminates his employment without Good Reason (as defined in the Roman Employment Agreement), or in the event of Mr. Roman’s death or disability, we will pay Mr. Roman’s base salary through the date of termination. If Mr. Roman’s employment is terminated without Cause or if Mr. Roman terminates his employment with us for Good Reason, we will continue to pay Mr. Roman’s base salary for the remaining term of the Roman Employment Agreement. The Roman Employment Agreement contains certain noncompetition provisions that apply to Mr. Roman’s activities during the term of the Roman Employment Agreement and for a period of one year after the later of the date of termination of the Roman Employment Agreement or the date the last payment is made under the Roman Employment Agreement.
Employment Agreement with William R. Tagmyer. We entered into an Amended and Restated Employment Agreement (the “Tagmyer Employment Agreement”) with Mr. Tagmyer effective December 31, 2008. The Tagmyer Employment Agreement is for a term ending on December 31, 2010, unless terminated
59
Table of Contents
earlier by the parties. The Tagmyer Employment Agreement provides that through 2010, Mr. Tagmyer will receive a base salary of $150,000 per year. If the Tagmyer Employment Agreement is terminated by Mr. Tagmyer or by us for Cause (as defined in the Tagmyer Employment Agreement), Mr. Tagmyer would be paid all compensation and expenses to which he is entitled through the date of termination of the Tagmyer Employment Agreement. If the Tagmyer Employment Agreement is terminated by us for any reason other than for Cause or as a result of Mr. Tagmyer’s death, Mr. Tagmyer would be entitled to receive all of the remaining payments that he would have been entitled to receive under the Tagmyer Employment Agreement if it had not been terminated. If the Tagmyer Employment Agreement is terminated as a result of Mr. Tagmyer’s death, Mr. Tagmyer’s beneficiary or estate would be entitled to receive fifty percent of the remaining payments under the Tagmyer Employment Agreement to which Mr. Tagmyer would have been entitled had he survived. The Tagmyer Employment Agreement contains certain noncompetition provisions that apply to Mr. Tagmyer’s activities during the term of the Tagmyer Employment Agreement and for a period of one year after the later of the date of termination of the Tagmyer Employment Agreement or the date the last payment is made under the Tagmyer Employment Agreement.
Separation Agreement
We entered into a Separation Agreement and Release (the “Separation Agreement”) with Brian W. Dunham on October 5, 2010. Pursuant to the terms of the Separation Agreement, the Company will pay Mr. Dunham an amount equal to his base salary of $570,000 over the twelve months ending October 5, 2011, and Mr. Dunham will be available to consult with the Company during that period. The Company will also pay the premiums for continuation of Mr. Dunham’s health insurance coverage during that period. The Separation Agreement also includes provisions relating to, among other things, a release of claims against the Company, confidentiality and cooperation.
Compensation Committee Report
The Compensation Committee has reviewed and discussed the foregoing Compensation Discussion and Analysis with management. Based on this review and discussion, the Compensation Committee has recommended to the full Board of Directors that the Compensation Discussion and Analysis be included in this 2009 Form 10-K for filing with the SEC.
COMPENSATION COMMITTEE
Michael C. Franson
Keith R. Larson
Richard A. Roman (until March 29, 2010)
James E. Declusin (since August 26, 2010)
Compensation Committee Interlocks and Insider Participation
Messrs. Franson, Larson and Roman, all of whom were independent directors, served on the Compensation Committee during the year ended December 31, 2009. Mr. Roman resigned his positions as Lead Director and as a member of the Board’s Audit and Compensation Committees effective March 29, 2010, upon his appointment as the Company’s Chief Executive Officer.
60
Table of Contents
| Item 12. | Security Ownership of Certain Beneficial Owners and Management and Related Stockholder Matters |
The following table provides information as of December 31, 2009, with respect to the shares of our Common Stock that may be issued under our existing equity compensation plans.
| Plan Category |
Number of securities to be issued upon exercise of outstanding options, warrants and rights (a) |
Weighted-average exercise price of outstanding options, warrants and rights (b) (3) |
Number of securities remaining available for future issuance under equity compensation plans (excluding securities reflected in column (a)) (c) |
|||||||||
| Equity compensation plans approved by security holders (1) |
340,590 | $ | 15.26 | 439,049 | ||||||||
| Equity compensation plans not approved by security holders (2) |
— | — | — | |||||||||
| (1) | Consists of our 2007 Stock Incentive Plan, 1995 Stock Incentive Plan and the 1995 Stock Option Plan for Nonemployee directors. |
| (2) | We do not have any equity compensation plans or arrangements that have not been approved by shareholders. |
| (3) | The weighted-average exercise price set forth in this column is calculated excluding outstanding RSUs and performance stock awards, since recipients are not required to pay an exercise price to receive the shares subject to these awards. |
Stock Owned by Management and Principal Shareholders
The table below sets forth certain information, as of October 8, 2010, regarding the beneficial ownership of the Common Stock by: (i) each person known by us to be the beneficial owner of 5% or more of our outstanding Common Stock, (ii) each of the named executive officers, (iii) each of our directors, and (iv) all directors and executive officers as a group. The address of each of the named executive officers and directors is c/o Northwest Pipe Company, 5721 SE Columbia Way, Suite 200, Vancouver, Washington, 98661.
| Shares Beneficially Owned (1) | ||||||||
| Name of Beneficial Owner |
Shares | Percent | ||||||
| Invesco Ltd (2) |
1,060,877 | 11.4 | % | |||||
| 1555 Peachtree Street NE |
||||||||
| Atlanta, GA 30309 |
||||||||
| Eagle Asset Management, Inc. (3) |
1,038,419 | 11.2 | % | |||||
| 880 Carillon Parkway |
||||||||
| St. Petersburg, FL 33716 |
||||||||
| Dimensional Fund Advisors LP (4) |
691,024 | 7.4 | % | |||||
| Palisades West, Building One |
||||||||
| 6300 Bee Cave Road |
||||||||
| Austin, TX 78746 |
||||||||
| Wentworth, Hauser & Violich, Inc. (5) |
503,233 | 5.4 | % | |||||
| 301 Battery Street, Suite 400 |
||||||||
| San Francisco, CA 94111 |
||||||||
| Brian W. Dunham |
201,101 | 2.2 | % | |||||
| William R. Tagmyer |
29,250 | * | ||||||
| Richard A. Roman |
39,000 | * | ||||||
| James E. Declusin |
— | * | ||||||
| Gary A. Stokes |
35,993 | * | ||||||
| Robert L. Mahoney |
23,794 | * | ||||||
| Stephanie J. Welty |
1,663 | * | ||||||
| Michael C. Franson |
11,565 | * | ||||||
| Winsor J.E. Jenkins |
1,044 | * | ||||||
| Wayne B. Kingsley |
31,858 | * | ||||||
| Keith R. Larson |
1,275 | * | ||||||
| All directors and executive officers as a group (13 persons) |
378,443 | 4.0 | % | |||||
| (*) | Represents beneficial ownership of less than one percent of the outstanding Common Stock. |
61
Table of Contents
| (1) | Beneficial ownership is determined in accordance with the rules of the SEC, and includes voting power and investment power with respect to shares. Shares issuable upon the exercise of outstanding stock options that are currently exercisable or become exercisable within 60 days from October 8, 2010 are considered outstanding for the purpose of calculating each person’s percentage of Common Stock owned, but not for the purpose of calculating the percentage of Common Stock owned by any other person. The number of stock options that are exercisable within 60 days of October 8, 2010 is as follows: Mr. Declusin – 0; Mr. Dunham – 51,369; Mr. Franson – 2,000; Mr. Jenkins – 0; Mr. Kingsley – 12,000; Mr. Larson – 0; Mr. Mahoney – 12,272; Mr. Roman – 39,000; Mr. Stokes – 18,164; Mr. Tagmyer – 0; Ms. Welty – 0; and all directors and executive officers as a group – 134,821. |
| (2) | The information as to beneficial ownership is based on a Schedule 13G/A filed with the SEC by Invesco Ltd. on February 10, 2010, reflecting its beneficial ownership of Common Stock as of December 31, 2009. The Schedule 13G/A states that Invesco Ltd. has sole voting and dispositive power with respect to 1,020,312 and 1,060,877 shares of Common Stock, respectively. |
| (3) | The information as to beneficial ownership is based on a Schedule 13G filed with the SEC by Eagle Asset Management, Inc. on January 25, 2010, reflecting its beneficial ownership of Common Stock as of December 31, 2009. The Schedule 13G states that Eagle Asset Management, Inc. has sole voting and dispositive power with respect to 1,038,419 shares of Common Stock. |
| (4) | The information as to beneficial ownership is based on a Schedule 13G filed with the SEC by Dimensional Fund Advisors LP on February 10, 2010, reflecting its beneficial ownership of Common Stock as of December 31, 2009. The Schedule 13G states Dimensional Fund Advisors LP beneficially owns 691,024 shares of Common Stock, including 679,247 shares as to which it has sole voting power and 691,024 shares as to which it has sole dispositive power. |
| (5) | The information as to beneficial ownership is based on a Schedule 13G/A filed with the SEC by Wentworth, Hauser & Violich, Inc. on February 16, 2010, reflecting its beneficial ownership of Common Stock as of December 31, 2009. The Schedule 13G/A states that Wentworth, Hauser & Violich, Inc. has sole voting and dispositive power with respect to 181,538 and 503,233 shares of Common Stock, respectively. |
| Item 13. | Certain Relationships and Related Transactions, and Director Independence |
Director Independence
The Board of Directors has determined that Messrs. Declusin, Franson, Kingsley and Larson are independent. Mr. Roman was determined independent until his appointment as our CEO, effective March 29 2010. The Board has established director independence guidelines as part of the Corporate Governance Principles to assist in determining director independence in accordance with the standards of the Nasdaq Stock Market. The director independence guidelines provide that none of the following will be an “independent director”:
(A) a director who is, or at any time during the past three years was, employed by Northwest Pipe;
(B) a director who accepted or who has a family member who accepted any compensation from Northwest Pipe in excess of $120,000 during any period of twelve consecutive months within the three years preceding the determination of independence, other than the following:
(i) compensation for board or board committee service;
(ii) compensation paid to a family member who is an employee (other than an executive officer) of Northwest Pipe; or
(iii) benefits under a tax-qualified retirement plan, or non-discretionary compensation, provided, however, that in addition to the requirements contained in this paragraph (B), Audit Committee members are also subject to additional, more stringent requirements under Nasdaq Rule 4350(d).
(C) a director who is a family member of an individual who is, or at any time during the past three years was, employed by Northwest Pipe as an executive officer;
(D) a director who is, or has a family member who is, a partner in, or a controlling shareholder or an executive officer of, any organization to which Northwest Pipe made, or from which Northwest Pipe received, payments for property or services in the current or any of the past three fiscal years that exceed 5% of the recipient’s consolidated gross revenues for that year, or $200,000, whichever is more, other than the following:
(i) payments arising solely from investments in Northwest Pipe’s securities; or
(ii) payments under non-discretionary charitable contribution matching programs.
62
Table of Contents
(E) a director of Northwest Pipe who is, or has a family member who is, employed as an executive officer of another entity where at any time during the past three years any of the executive officers of Northwest Pipe serve on the Compensation Committee of such other entity; or
(F) a director who is, or has a family member who is, a current partner of Northwest Pipe’s outside auditor, or was a partner or employee of Northwest Pipe’s outside auditor who worked on Northwest Pipe’s audit at any time during any of the past three years.
Review of Certain Relationships and Related Transactions
Since January 1, 2009, there has not been any transaction or series of transactions to which we were or are to be a party in which the amount involved exceeds $120,000 and in which any director, executive officer or holder of more than 5% of our common stock, or members of any such person’s immediate family, had or will have a direct or indirect material interest, other than the Separation Agreement and Release entered into by the Company and Brian W. Dunham on October 5, 2010, and compensation arrangements with the Company’s executive officers and directors, all on terms described in Part III—Item 11, “Executive Compensation”. The Audit Committee is responsible for the review and approval of all related party transactions. Although the Audit Committee does not have written policies and procedures with respect to the review of related party transactions, we intend that any such transactions will be reviewed by the Audit Committee and will be on terms no less favorable to us than could be obtained from unaffiliated third parties.
| Item 14. | Principal Accountant Fees and Services |
Deloitte & Touche LLP served as our independent registered public accountants for the year ended December 31, 2009. Fees for services billed or expected to be billed by our principal accountant, Deloitte & Touche LLP, for the years ended December 31, 2009 and 2008 were as follows:
| 2009 | 2008 | |||||||
| Audit fees (1) |
$ | 2,069,296 | $ | 468,750 | ||||
| Audit-related fees (2) |
30,000 | 25,000 | ||||||
| Total fees |
$ | 2,099,296 | $ | 493,750 | ||||
| (1) | Audit fees include fees for audits of the annual financial statements, including required quarterly reviews, the audit of our internal control over financial reporting, and fees to date of approximately $1.6 million for investigation of certain accounting matters as discussed in Note 2 of the Consolidated Financial Statements included in Part II—Item 8, “Financial Statements and Supplementary Data.” |
| (2) | Audit-related fees include fees billed for audits of our employee benefit plans’ 2008 financial statements, and fees estimated for audits of our employee benefit plans’ 2009 financial statements. |
To help assure independence of the independent auditors, the Audit Committee has established a policy whereby all services of the principal accountant or other firms must be approved in advance by the Audit Committee; provided, however, that de minimis services may instead be approved by the CEO or the CFO. One hundred percent of the fees shown in the principal accountant fees schedule for 2009 and 2008 were approved by the Audit Committee.
63
Table of Contents
| Item 15. | Exhibits and Financial Statement Schedule |
(a) (1) Consolidated Financial Statements
The Consolidated Financial Statements, together with the reports thereon of Deloitte & Touche LLP are included on the pages indicated below.
| Page | ||||
| F-1 | ||||
| F-2 | ||||
| Consolidated Balance Sheets as of December 31, 2009 and 2008 (as Restated) |
F-3 | |||
| F-4 | ||||
| F-5 | ||||
| F-6 | ||||
(a) (2) Financial Statement Schedule
The following schedule is filed herewith:
| Page | ||||||
| Schedule II |
Valuation and Qualifying Accounts | S-1 | ||||
Schedules not listed above have been omitted because the information required to be set forth therein is not applicable or is included in the Consolidated Financial Statements or notes thereto.
64
Table of Contents
(a) (3) Exhibits included herein:
| Exhibit |
Description | |
| 3.1 | Second Restated Articles of Incorporation, incorporated by reference to Exhibits to the Company’s Registration Statement on Form S-1, as amended, effective November 30, 1995, Commission Registration No. 33-97308 (“the S-1”) | |
| 3.2 | First Amendment to Second Restated Articles of Incorporation, incorporated by reference to Exhibits to the Company’s Registration Statement of Form S-3, as amended, effective November 1, 2006, Commission Registration No. 333-137923 (“the S-3”) | |
| 3.3 | Second Amended and Restated Bylaws, incorporated by reference to Exhibits to the S-1 | |
| 3.4 | First Amendment to Second Amended and Restated Bylaws of Northwest Pipe Company, incorporated by reference to Exhibits to the Company’s Report on Form 8-K as filed with the Securities and Exchange Commission on November 19, 2007 | |
| 4.1 | Amended and Restated Rights Agreement, dated as of June 18, 2009, between the Company and Mellon Investor Services LLC as Rights Agent, incorporated by reference to the Company’s Current Report on Form 8-K, as filed with the Securities and Exchange Commission on June 19, 2009 | |
| 10.1 | 1995 Stock Option Plan for Nonemployee Directors, incorporated by reference to Exhibits to the S-1* | |
| 10.2 | Amended 1995 Stock Incentive Plan, incorporated by reference to Exhibit A to the Company’s Proxy Statement for its 2000 Annual meeting of Shareholders, as filed with the Securities and Exchange Commission on March 31, 2000* | |
| 10.3 | Northwest Pipe NQ Retirement Savings Plan, dated July 1, 1999, incorporated by reference to Exhibits to the Company’s Quarterly Report Form 10-Q for the quarter ended June 30, 2000, as filed with the Securities and Exchange Commission on August 11, 2000* | |
| 10.4 | General Electric Capital Corporation Master Lease Agreement, dated September 26, 2000, incorporated by reference to Exhibits to the Company’s Quarterly Report Form 10-Q for the quarter ended September 30, 2000 as filed with the Securities and Exchange Commission on November 13, 2000 | |
| 10.5 | General Electric Capital Corporation Master Lease Agreement, dated May 30, 2001, incorporated by reference to Exhibits to the Company’s Quarterly Report on Form 10-Q for the quarter ended June 30, 2001 as filed with the Securities and Exchange Commission on August 14, 2001 | |
| 10.6 | Long Term Incentive Agreement, incorporated by reference to Exhibits to the Company’s Quarterly Report on Form 10-Q for the quarter ended June 30, 2005 as filed with the Securities and Exchange Commission on August 8, 2005* | |
| 10.7 | Amended and Restated Credit Agreement dated May 31, 2007, by and among Northwest Pipe Company, Bank of America, N.A., Union Bank of California, N.A. and HSBC USA, National Association, incorporated by reference to the Company’s Current Report of Form 8-K, as filed with the Securities and Exchange Commission on June 6, 2007 | |
| 10.8 | Second Amended and Restated Intercreditor and Collateral Agency Agreement dated as of May 31, 2007 by and between Northwest Pipe Company, Bank of America, N.A., Union Bank of California, N.A., HSBC USA, National Association, and Prudential Investment Management, Inc. and certain of its affiliates, incorporated by reference to the Company’s Current Report on Form 8-K, as filed with the Securities and Exchange Commission on June 6, 2007 | |
65
Table of Contents
| Exhibit |
Description | |
| 10.9 | Amended and Restated Note Purchase and Private Shelf Agreement dated as of May 31, 2007 by and among Northwest Pipe Company, Prudential Investment Management, Prudential Retirement Insurance and Annuity Company and Prudential Insurance Company of America and certain affiliates, incorporated by reference to the Company’s Current Report on Form 8-K, as filed with the Securities and Exchange Commission on June 6, 2007 | |
| 10.10 | Northwest Pipe Company 2007 Stock Incentive Plan, incorporated by reference to Appendix A to the Company’s Definitive Proxy Statement dated April 20, 2007, as filed with the Securities and Exchange Commission on April 26, 2007* | |
| 10.11 | Separation agreement with John Murakami, Vice President and Chief Financial Officer dated January 14, 2008, incorporated by reference to Exhibits to the Company’s Annual Report on Form 10-K for the year ended December 31, 2007 as filed with the Securities and Exchange Commission on March 17, 2008* | |
| 10.12 | Second Amendment to Amended and Restated Credit Agreement dated October 14, 2008 by and among Northwest Pipe Company, Bank of America, N.A., as Administrative Agent, and Union Bank of California, N.A. (certain schedules to the Agreement have been omitted), incorporated by reference to the Company’s Current Report on Form 8-K, as filed with the Securities and Exchange Commission on October 20, 2008 | |
| 10.13 | First Amendment and Limited Waiver to the Amended and Restated Note Purchase and Private Shelf Agreement dated as of October 14, 2008 by and among Northwest Pipe Company and Prudential Investment Management, Inc. and certain affiliates (certain schedules to the Agreement have been omitted), incorporated by reference to the Company’s Current Report on Form 8-K, as filed with the Securities and Exchange Commission on October 20, 2008 | |
| 10.14 | Second Amendment to and Consent under the Second Amended and Restated Intercreditor and Collateral Agency Agreement dated as of October 14, 2008 by and between Northwest Pipe Company, Bank of America, N.A., Union Bank of California, N.A., U.S. National Bank, National Association and Prudential Investment Management, Inc. and certain of its affiliates (certain schedules to the Agreement have been omitted), incorporated by reference to the Company’s Current Report on Form 8-K, as filed with the Securities and Exchange Commission on October 20, 2008 | |
| 10.15 | Form of Restricted Stock Unit Agreement, incorporated by reference to Exhibits to the Company’s Quarterly Report on Form 10-Q for the quarter ended September 30, 2008 as filed with the Securities and Exchange Commission on November 11, 2008* | |
| 10.16 | Form of Performance Share Agreement, incorporated by reference to Exhibits to the Company’s Quarterly Report on Form 10-Q for the quarter ended September 30, 2008 as filed with the Securities and Exchange Commission on November 11, 2008* | |
| 10.17 | Amended and Restated Change in Control Agreement, dated December 31, 2008, between Northwest Pipe Company and William R. Tagmyer, incorporated by reference to Exhibits to the Company’s Annual Report on Form 10-K for the year ended December 31, 2008, as filed with the Securities and Exchange Commission on March 13, 2009 | |
| 10.18 | Form of Amended and Restated Change in Control Agreement, dated December 31, 2008, between Northwest Pipe Company and Robert L. Mahoney, Gary A. Stokes, and Stephanie J. Welty, incorporated by reference to Exhibits to the Company’s Annual Report on Form 10-K for the year ended December 31, 2008, as filed with the Securities and Exchange Commission on March 13, 2009 | |
| 10.19 | Executive Employment Agreement, dated March 29, 2010 between Northwest Pipe Company and Richard A. Roman, incorporated by reference to the Company’s Current Report on Form 8-K, as filed with the Securities and Exchange Commission on April 2, 2010 | |
66
Table of Contents
| Exhibit |
Description | |
| 10.20 | Third Amendment to Amended and Restated Credit Agreement dated February 12, 2010 by and among Northwest Pipe Company, Bank of America, N.A., as Administrative Agent, incorporated by reference to the Company’s Current Report on Form 8-K, as filed with the Securities and Exchange Commission on February 19, 2010 | |
| 10.21 | Third Amendment to the Amended and Restated Note Purchase and Private Shelf Agreement dated as of February 12, 2010 by and among Northwest Pipe Company and Prudential Investment Management, Inc. and certain affiliates, incorporated by reference to the Company’s Current Report on Form 8-K, as filed with the Securities and Exchange Commission on February 19, 2010 | |
| 10.22 | Fourth Amendment to Amended and Restated Credit Agreement dated April 15, 2010 by and among Northwest Pipe Company and Bank of America, N.A., as Administrative Agent, incorporated by reference to the Company’s Current Report on Form 8-K, as filed with the Securities and Exchange Commission on April 26, 2010 | |
| 10.23 | Fourth Amendment to the Amended and Restated Note Purchase and Private Shelf Agreement dated as of April 15, 2010 by and among Northwest Pipe Company and Prudential Investment Management, Inc. and certain affiliates, incorporated by reference to the Company’s Current Report on Form 8-K, as filed with the Securities and Exchange Commission on April 26, 2010 | |
| 10.24 | Fifth Amendment to Amended and Restated Credit Agreement dated June 18, 2010 by and among Northwest Pipe Company, Bank of America, N.A., as Administrative Agent, incorporated by reference to the Company’s Current Report on Form 8-K, as filed with the Securities and Exchange Commission on June 24, 2010 | |
| 10.25 | Fifth Amendment and Limited Consent to the Amended and Restated Note Purchase and Private Shelf Agreement dated as of July 23, 2010 by and among Northwest Pipe Company and Prudential Investment Management, Inc. and certain affiliates, incorporated by reference to the Company’s Current Report on Form 8-K, as filed with the Securities and Exchange Commission on July 29, 2010 | |
| 10.26 | Sixth Amendment to Amended and Restated Credit Agreement dated July 30, 2010 by and among Northwest Pipe Company and Bank of America, N.A., as Administrative Agent, incorporated by reference to the Company’s Current Report on Form 8-K, as filed with the Securities and Exchange Commission on August 5, 2010 | |
| 10.27 | Sixth Amendment and Temporary Waiver to the Amended and Restated Note Purchase and Private Shelf Agreement dated as of July 30, 2010 by and among Northwest Pipe Company and Prudential Investment Management, Inc. and certain affiliates, incorporated by reference to the Company’s Current Report on Form 8-K, as filed with the Securities and Exchange Commission on August 5, 2010 | |
| 10.28 | Seventh Amendment to Amended and Restated Credit Agreement dated September 16, 2010 by and among Northwest Pipe Company and Bank of America, N.A., as Administrative Agent, incorporated by reference to the Company’s Current Report on Form 8-K, as filed with the Securities and Exchange Commission on October 5, 2010 | |
| 10.29 | Seventh Amendment and Limited Waiver to the Amended and Restated Note Purchase and Private Shelf Agreement dated as of September 16, 2010 by and among Northwest Pipe Company and Prudential Investment Management, Inc. and certain affiliates, incorporated by reference to the Company’s Current Report on Form 8-K, as filed with the Securities and Exchange Commission on October 5, 2010 | |
| 10.30 | Separation Agreement and Release, dated October 5, 2009, between Northwest Pipe Company and Brian W. Dunham, incorporated by reference to the Company’s Current Report on Form 8-K, as filed with the Securities and Exchange Commission on October 8, 2010* | |
67
Table of Contents
| Exhibit |
Description | |
| 10.31 | Eighth Amendment to Amended and Restated Credit Agreement dated October 15, 2010 by and among Northwest Pipe Company and Bank of America, N.A., as Administrative Agent, incorporated by reference to the Company’s Current Report on Form 8-K, as filed with the Securities and Exchange Commission on October 27, 2010 | |
| 10.32 | Eighth Amendment and Limited Waiver to the Amended and Restated Note Purchase and Private Shelf Agreement dated as of October 15, 2010 by and among Northwest Pipe Company and Prudential Investment Management, Inc. and certain affiliates, incorporated by reference to the Company’s Current Report on Form 8-K, as filed with the Securities and Exchange Commission on October 27, 2010 | |
| 14.1 | Code of Ethics for Senior Financial Officers, filed herewith | |
| 21 | Subsidiaries of the Registrant, filed herewith | |
| 23.1 | Consent of Deloitte & Touche LLP, filed herewith | |
| 31.1 | Certification of Chief Executive Officer pursuant to Section 302 of the Sarbanes-Oxley Act of 2002, filed herewith | |
| 31.2 | Certification of Chief Financial Officer pursuant to Section 302 of the Sarbanes-Oxley Act of 2002, filed herewith | |
| 32.1 | Certification pursuant to 18 U.S.C. Section 1350, as adopted pursuant to Section 906 of the Sarbanes-Oxley Act of 2002, filed herewith | |
| 32.2 | Certification pursuant to 18 U.S.C. Section 1350, as adopted pursuant to Section 906 of the Sarbanes-Oxley Act of 2002, filed herewith | |
| * | This exhibit constitutes a management contract or compensatory plan or arrangement. |
68
Table of Contents
REPORT OF INDEPENDENT REGISTERED PUBLIC ACCOUNTING FIRM
To the Board of Directors and Stockholders of
Northwest Pipe Company
Vancouver, Washington
We have audited the accompanying consolidated balance sheets of Northwest Pipe Company and subsidiaries (the “Company”) as of December 31, 2009 and 2008, and the related consolidated statements of operations, stockholders’ equity and comprehensive income (loss), and cash flows for each of the three years in the period ended December 31, 2009. Our audits also included the financial statement schedule listed in the Index at Item 15. These financial statements and the financial statement schedule are the responsibility of the Company’s management. Our responsibility is to express an opinion on these financial statements and the financial statement schedule based on our audits.
We conducted our audits in accordance with the standards of the Public Company Accounting Oversight Board (United States). Those standards require that we plan and perform the audit to obtain reasonable assurance about whether the financial statements are free of material misstatement. An audit includes examining, on a test basis, evidence supporting the amounts and disclosures in the financial statements. An audit also includes assessing the accounting principles used and significant estimates made by management, as well as evaluating the overall financial statement presentation. We believe that our audits provide a reasonable basis for our opinion.
In our opinion, such consolidated financial statements present fairly, in all material respects, the financial position of Northwest Pipe Company and subsidiaries as of December 31, 2009 and 2008, and the results of their operations and their cash flows for each of the three years in the period ended December 31, 2009, in conformity with accounting principles generally accepted in the United States of America. Also, in our opinion, such financial statement schedule, when considered in relation to the basic consolidated financial statements taken as a whole, presents fairly, in all material respects, the information set forth therein.
As discussed in Note 2 to the consolidated financial statements, the accompanying 2008 and 2007 consolidated financial statements have been restated.
We have also audited, in accordance with the standards of the Public Company Accounting Oversight Board (United States), the Company’s internal control over financial reporting as of December 31, 2009, based on the criteria established in Internal Control—Integrated Framework issued by the Committee of Sponsoring Organizations of the Treadway Commission and our report dated November 4, 2010 expressed an adverse opinion on the Company’s internal control over financial reporting because of material weaknesses.
| /s/ Deloitte & Touche LLP |
| Portland, Oregon |
| November 4, 2010 |
F-1
Table of Contents
NORTHWEST PIPE COMPANY AND SUBSIDIARIES
CONSOLIDATED STATEMENTS OF OPERATIONS
(In thousands, except per share amounts)
| Year Ended December 31, | ||||||||||||
| 2009 | 2008 As Restated |
2007 As Restated |
||||||||||
| Net sales |
$ | 278,654 | $ | 451,419 | $ | 364,314 | ||||||
| Cost of sales |
266,968 | 366,832 | 315,861 | |||||||||
| Gross profit |
11,686 | 84,587 | 48,453 | |||||||||
| Selling, general and administrative expense |
20,095 | 27,235 | 23,507 | |||||||||
| Operating (loss) income |
(8,409 | ) | 57,352 | 24,946 | ||||||||
| Other (income) expense |
(1,905 | ) | 424 | (114 | ) | |||||||
| Interest income |
(754 | ) | (180 | ) | (303 | ) | ||||||
| Interest expense |
5,057 | 6,589 | 7,094 | |||||||||
| (Loss) income before income taxes |
(10,807 | ) | 50,519 | 18,269 | ||||||||
| (Benefit) provision for income taxes |
(3,530 | ) | 19,181 | 6,350 | ||||||||
| Net (loss) income |
$ | (7,277 | ) | $ | 31,338 | $ | 11,919 | |||||
| Basic earnings (loss) per share |
$ | (0.79 | ) | $ | 3.43 | $ | 1.33 | |||||
| Diluted earnings (loss) per share |
$ | (0.79 | ) | $ | 3.35 | $ | 1.29 | |||||
| Shares used in per share calculations: |
||||||||||||
| Basic |
9,235 | 9,148 | 8,962 | |||||||||
| Diluted |
9,235 | 9,344 | 9,235 | |||||||||
The accompanying notes are an integral part of these consolidated financial statements.
F-2
Table of Contents
NORTHWEST PIPE COMPANY AND SUBSIDIARIES
CONSOLIDATED BALANCE SHEETS
(Dollar amounts in thousands, except per share amounts)
| December 31, | ||||||||
| 2009 | 2008 As Restated |
|||||||
| Assets |
||||||||
| Current assets: |
||||||||
| Cash and cash equivalents |
$ | 31 | $ | 90 | ||||
| Trade and other receivables, less allowance for doubtful accounts |
||||||||
| of $793 and $701 |
38,733 | 75,767 | ||||||
| Costs and estimated earnings in excess of billings on uncompleted contracts |
37,509 | 65,646 | ||||||
| Inventories |
74,866 | 96,296 | ||||||
| Refundable income taxes |
7,029 | 3,443 | ||||||
| Deferred income taxes |
19,287 | 17,998 | ||||||
| Prepaid expenses and other |
2,350 | 3,024 | ||||||
| Total current assets |
179,805 | 262,264 | ||||||
| Property and equipment, net |
163,432 | 163,567 | ||||||
| Goodwill |
21,451 | 21,451 | ||||||
| Other assets |
26,549 | 22,998 | ||||||
| Total assets |
$ | 391,237 | $ | 470,280 | ||||
| Liabilities and Stockholders’ Equity |
||||||||
| Current liabilities: |
||||||||
| Current portion of long-term debt |
$ | 5,714 | $ | 5,714 | ||||
| Current portion of capital lease obligations |
408 | 829 | ||||||
| Accounts payable |
30,039 | 34,109 | ||||||
| Accrued liabilities |
11,630 | 11,108 | ||||||
| Billings in excess of costs and estimated earnings on uncompleted contracts |
9,670 | 18,119 | ||||||
| Total current liabilities |
57,461 | 69,879 | ||||||
| Note payable to financial institution |
19,403 | 82,065 | ||||||
| Long-term debt, less current portion |
23,501 | 29,215 | ||||||
| Capital lease obligations, less current portion |
8,818 | 3,164 | ||||||
| Deferred income taxes |
27,687 | 26,583 | ||||||
| Pension and other long-term liabilities |
8,068 | 6,870 | ||||||
| Total liabilities |
144,938 | 217,776 | ||||||
| Commitments and contingencies (Note 14) |
||||||||
| Stockholders’ equity: |
||||||||
| Preferred stock, $.01 par value, 10,000,000 shares authorized, none issued or outstanding |
— | — | ||||||
| Common stock, $.01 par value, 15,000,000 shares authorized, 9,244,977 and 9,195,400 shares issued and outstanding |
92 | 92 | ||||||
| Additional paid-in-capital |
106,869 | 106,129 | ||||||
| Retained earnings |
141,928 | 149,205 | ||||||
| Accumulated other comprehensive loss |
(2,590 | ) | (2,922 | ) | ||||
| Total stockholders’ equity |
246,299 | 252,504 | ||||||
| Total liabilities and stockholders’ equity |
$ | 391,237 | $ | 470,280 | ||||
The accompanying notes are an integral part of these consolidated financial statements.
F-3
Table of Contents
NORTHWEST PIPE COMPANY AND SUBSIDIARIES
CONSOLIDATED STATEMENTS OF STOCKHOLDERS’ EQUITY
AND COMPREHENSIVE INCOME (LOSS)
(Dollar amounts in thousands)
| Common Stock | Additional Paid-in Capital |
Retained Earnings |
Accumulated Other Comprehensive (Loss) Income |
Total Stockholders’ Equity |
||||||||||||||||||||
| Shares | Amount | |||||||||||||||||||||||
| Balances, December 31, 2006 as previously reported |
8,877,859 | $ | 89 | $ | 97,303 | $ | 135,130 | $ | (1,696 | ) | $ | 230,826 | ||||||||||||
| Restatement adjustments—see Note 2 |
— | — | — | (29,182 | ) | — | (29,182 | ) | ||||||||||||||||
| Balances, January 1, 2007 as restated |
8,877,859 | 89 | 97,303 | 105,948 | (1,696 | ) | 201,644 | |||||||||||||||||
| Net income as restated |
— | — | — | 11,919 | — | 11,919 | ||||||||||||||||||
| Other comprehensive income: |
||||||||||||||||||||||||
| Pension liability adjustment, net of tax of $103 |
— | — | — | — | 176 | 176 | ||||||||||||||||||
| Comprehensive income as restated |
12,095 | |||||||||||||||||||||||
| Issuance of common stock under stock option plans |
178,392 | 2 | 2,903 | — | — | 2,905 | ||||||||||||||||||
| Tax benefit from stock option plans |
— | — | 1,246 | — | — | 1,246 | ||||||||||||||||||
| Stock-based compensation expense |
— | — | 297 | — | — | 297 | ||||||||||||||||||
| Balances, December 31, 2007 as restated |
9,056,251 | 91 | 101,749 | 117,867 | (1,520 | ) | 218,187 | |||||||||||||||||
| Net income as restated |
— | — | — | 31,338 | — | 31,338 | ||||||||||||||||||
| Other comprehensive loss: |
||||||||||||||||||||||||
| Pension liability adjustment, net of tax benefit of $823 as restated |
— | — | — | — | (1,402 | ) | (1,402 | ) | ||||||||||||||||
| Comprehensive income as restated |
29,936 | |||||||||||||||||||||||
| Issuance of common stock under stock option plans |
139,149 | 1 | 2,285 | — | — | 2,286 | ||||||||||||||||||
| Tax benefit from stock option plans |
— | — | 1,070 | — | — | 1,070 | ||||||||||||||||||
| Stock-based compensation expense |
— | — | 1,025 | — | — | 1,025 | ||||||||||||||||||
| Balances, December 31, 2008 as restated |
9,195,400 | 92 | 106,129 | 149,205 | (2,922 | ) | 252,504 | |||||||||||||||||
| Net loss |
— | — | — | (7,277 | ) | — | (7,277 | ) | ||||||||||||||||
| Other comprehensive (loss) income: |
||||||||||||||||||||||||
| Foreign currency cash flow hedge, net of tax benefit of $59 |
— | — | — | — | (105 | ) | (105 | ) | ||||||||||||||||
| Pension liability adjustment, net of tax of $271 |
— | — | — | — | 437 | 437 | ||||||||||||||||||
| Comprehensive loss |
(6,945 | ) | ||||||||||||||||||||||
| Issuance of common stock under stock option plans |
49,577 | — | 28 | — | — | 28 | ||||||||||||||||||
| Tax benefit from stock option plans |
— | — | (53 | ) | — | — | (53 | ) | ||||||||||||||||
| Stock-based compensation expense |
— | — | 765 | — | — | 765 | ||||||||||||||||||
| Balances, December 31, 2009 |
9,244,977 | $ | 92 | $ | 106,869 | $ | 141,928 | $ | (2,590 | ) | $ | 246,299 | ||||||||||||
The accompanying notes are an integral part of these consolidated financial statements.
F-4
Table of Contents
NORTHWEST PIPE COMPANY AND SUBSIDIARIES
CONSOLIDATED STATEMENTS OF CASH FLOWS
(Dollar amounts in thousands)
| Year Ended December 31, | ||||||||||||
| 2009 | 2008 As Restated |
2007 As Restated |
||||||||||
| Cash flows from operating activities: |
||||||||||||
| Net (loss) income |
$ | (7,277 | ) | $ | 31,338 | $ | 11,919 | |||||
| Adjustments to reconcile net (loss) income to net cash provided by operating activities: |
||||||||||||
| Depreciation and amortization of property and equipment |
6,889 | 7,057 | 6,778 | |||||||||
| Amortization of intangible assets |
119 | 119 | — | |||||||||
| Provision for doubtful accounts |
92 | (428 | ) | 307 | ||||||||
| Amortization of debt issuance costs |
513 | 376 | 349 | |||||||||
| Deferred income taxes |
(185 | ) | 2,927 | (2,160 | ) | |||||||
| Loss on disposal of property and equipment |
41 | 4,090 | 394 | |||||||||
| Stock-based compensation expense |
765 | 1,025 | 297 | |||||||||
| Tax benefit from stock option plans |
(53 | ) | 1,070 | 1,246 | ||||||||
| Excess tax benefit from stock option plans |
— | (828 | ) | (801 | ) | |||||||
| Changes in operating assets and liabilities: |
||||||||||||
| Trade and other receivables, net |
36,942 | (27,639 | ) | 17,800 | ||||||||
| Costs and estimated earnings in excess of billings on uncompleted contracts, net |
19,688 | 13,174 | (29,149 | ) | ||||||||
| Inventories |
29,084 | (17,824 | ) | 13,122 | ||||||||
| Refundable income taxes |
(3,586 | ) | (527 | ) | 2,973 | |||||||
| Prepaid expenses and other |
(1,420 | ) | 275 | (3,596 | ) | |||||||
| Accounts payable |
(4,478 | ) | (8,976 | ) | (8,420 | ) | ||||||
| Accrued and other liabilities |
2,053 | (4,928 | ) | 7,856 | ||||||||
| Net cash provided by operating activities |
79,187 | 301 | 18,915 | |||||||||
| Cash flows from investing activities: |
||||||||||||
| Additions to property and equipment |
(22,692 | ) | (21,972 | ) | (22,925 | ) | ||||||
| Proceeds from sale of property and equipment |
98 | 10 | 48 | |||||||||
| Proceeds from sale and leaseback of property and equipment |
6,800 | — | — | |||||||||
| Insurance proceeds |
1,363 | — | — | |||||||||
| Other investing activities |
(1,635 | ) | (2,780 | ) | (500 | ) | ||||||
| Net cash used in investing activities |
(16,066 | ) | (24,742 | ) | (23,377 | ) | ||||||
| Cash flows from financing activities: |
||||||||||||
| Proceeds from sale of common stock |
28 | 2,286 | 2,905 | |||||||||
| Payments on long-term debt |
(5,714 | ) | (5,071 | ) | (13,571 | ) | ||||||
| Borrowings under note payable to financial institution |
89,538 | 223,222 | 142,010 | |||||||||
| Payments on note payable to financial institution |
(152,200 | ) | (195,572 | ) | (130,595 | ) | ||||||
| Payments of debt issuance costs |
(186 | ) | (617 | ) | (431 | ) | ||||||
| Borrowings from capital lease obligations |
19,175 | — | — | |||||||||
| Payments on capital lease obligations |
(13,821 | ) | (779 | ) | (682 | ) | ||||||
| Excess tax benefit from stock option plans |
— | 828 | 801 | |||||||||
| Net cash (used in) provided by financing activities |
(63,180 | ) | 24,297 | 437 | ||||||||
| Change in cash and cash equivalents |
(59 | ) | (144 | ) | (4,025 | ) | ||||||
| Cash and cash equivalents, beginning of period |
90 | 234 | 4,259 | |||||||||
| Cash and cash equivalents, end of period |
$ | 31 | $ | 90 | $ | 234 | ||||||
| Supplemental disclosure of cash flow information: |
||||||||||||
| Cash paid during the period for interest, net of amounts capitalized |
$ | 4,692 | $ | 6,323 | $ | 6,990 | ||||||
| Cash (refunded) paid during the period for income taxes |
||||||||||||
| (net of refunds of $798, $956 and $262) |
(162 | ) | 15,735 | 3,364 | ||||||||
| Non-cash investing and financing activities: |
||||||||||||
| Escrow account related to capital lease financing |
5,591 | — | — | |||||||||
| Capital lease converted to operating lease |
5,713 | — | — | |||||||||
| Operating lease converted to capital lease |
— | — | 1,447 | |||||||||
| Accrued property and equipment purchases |
3,704 | 3,296 | 2,049 | |||||||||
The accompanying notes are an integral part of these consolidated financial statements.
F-5
Table of Contents
NORTHWEST PIPE COMPANY AND SUBSIDIARIES
NOTES TO CONSOLIDATED FINANCIAL STATEMENTS
| 1. | SUMMARY OF SIGNIFICANT ACCOUNTING POLICIES: |
The consolidated financial statements include the accounts of Northwest Pipe Company and its wholly owned subsidiaries (the “Company”). All inter-company transactions have been eliminated in consolidation. The Company has water transmission manufacturing facilities in Portland, Oregon; Denver, Colorado; Adelanto, California; Pleasant Grove, Utah; Parkersburg, West Virginia; Saginaw, Texas and Monterrey, Mexico. Tubular products manufacturing facilities are located in Atchison, Kansas; Houston, Texas; and Bossier City, Louisiana.
Use of Estimates
The preparation of financial statements in conformity with accounting principles generally accepted in the United States requires management to make estimates and assumptions that affect the reported amounts of assets and liabilities and disclosure of contingent assets and liabilities at the date of the financial statements and the reported amounts of revenues and expenses during the reporting period. The Company bases its estimates on historical experience and on various assumptions that are believed to be reasonable under the circumstances at that time. On an on-going basis, the Company evaluates all of its estimates, including those related to revenue recognition, allowance for doubtful accounts and product warranties, depreciation and amortization, goodwill and intangible assets, accrued liabilities, income taxes, and contingencies and litigation. Actual results could differ from those estimates under different assumptions or conditions.
Basis of Consolidation and Presentation
The Consolidated Financial Statements include the accounts of Northwest Pipe Company and its subsidiaries in which the Company exercises control as of the financial statement date. Intercompany accounts and transactions have been eliminated.
Northwest Pipe Asia Pte. Ltd. (“NWPA”), in which the Company exercises significant influence but does not control, is accounted for under the equity method of accounting. During the year ended December 31, 2009, the Company recorded purchases of property and equipment of $1.7 million, net of eliminations, and rental income, included in net sales, of $200,000 from NWPA. At December 31, 2009, intercompany balances with NWPA included a receivable of $1.6 million, primarily related to rental income, cash advances, and the provision of management services, and a payable of $700,000 related to the purchases of the property and equipment.
Cash and Cash Equivalents
Cash and cash equivalents consist of cash and short term highly liquid investments with remaining maturities of three months or less when purchased.
Escrow Account
The escrow account, to be used for qualifying project costs under the financing arrangement for the Bossier City facility, is included in Other Assets.
Allowance for Doubtful Accounts and Product Warranties
The Company maintains allowances for estimated losses resulting from the inability of its customers to make required payments, contract disputes, and warranty claims, based on company history and management’s judgment. At least monthly, the Company reviews past due balances to identify the reasons for non-payment. The Company will write off a receivable account once the account is deemed uncollectible. The Company believes the reported allowances at December 31, 2009 and 2008 are adequate. If the customers’ financial conditions were
F-6
Table of Contents
to deteriorate resulting in their inability to make payments, or if contract disputes or warranty claims were to escalate, additional allowances may need to be recorded which would result in additional expenses being recorded for the period in which such determination was made.
Inventories
Inventories are stated at the lower of cost or market. Raw material inventories of steel are stated at cost, either on a specific identification basis or on an average cost basis. All other raw material inventories, as well as supplies, are stated on an average cost basis. Finished goods are stated at cost using the first-in, first-out method of accounting.
Property and Equipment
Property and equipment is stated at cost. Maintenance and repairs are expensed as incurred, and costs of improvements and renewals, including interest where applicable, are capitalized. Depreciation and amortization on the book value in excess of the salvage value are determined by the units of production method for most equipment, and by the straight-line method for the remaining assets based on the estimated useful lives of the related assets. Upon disposal, costs and related accumulated depreciation of the assets are removed from the accounts and resulting gains or losses are reflected in operations. The Company leases certain equipment under long-term capital leases, which are being amortized on a straight-line basis over the shorter of the lease terms or the estimated useful lives of the assets.
We assess impairment of property and equipment whenever changes in circumstances indicate that the carrying values of the assets may not be recoverable. The recoverable value of long-lived assets is determined by estimating future undiscounted cash flows using assumptions about our expected future operating performance. Our estimates of undiscounted cash flows may differ from actual cash flow due to, among other things, technological changes, economic conditions, or changes to our business operations. If we determine the carrying value of the property and equipment will not be recoverable, we calculate and record an impairment loss.
Estimated useful lives by major classes of property and equipment are as follows:
| Land Improvements |
20 – 30 years | |||||
| Buildings |
20 – 40 years | |||||
| Equipment |
3 – 18 years |
Goodwill
Goodwill related to the Company’s Tubular Products Group, one of the Company’s operating segments and reporting unit, of $21.5 million at December 31, 2009 and 2008 represents the excess of cost over the assigned value of the net assets in connection with the segment’s acquisitions. Goodwill is no longer amortized but is reviewed for impairment annually or whenever events occur or circumstances change that would more likely than not reduce the fair value of the Tubular Products Group below its carrying amount. The Company conducted impairment testing as of December 31, 2009, 2008 and 2007. The evaluation of goodwill impairment involves comparing the estimated fair value of the Tubular Products Group to its carrying value, including goodwill. Fair value of the Tubular Products Group’s goodwill is determined with consideration of the income, market, and cost approaches as applicable.
Fair value of goodwill is estimated under the income approach and the market approach for 2009. Although considered, the Company did not utilize the cost approach as relevant data was not available. The Company utilized an average of the income and market approaches, with a heavier weighting on the income approach because of the relatively limited number of comparable entities for which relevant multiples are available.
The income approach is based upon projected future after-tax cash flows (less capital expenditures) discounted to present value using factors that consider the timing and risk associated with the future after-tax
F-7
Table of Contents
cash flows. The key assumptions in the discounted cash flow analysis are the long-term growth rate, the discount rate, and the annual free cash flow. The market approach is based upon historical and forward-looking measures using multiples of revenue and a price-to-book ratio. The forward-looking measures are more heavily weighted than the historical measures.
The Company utilized a sensitivity analysis to determine the impact of changes in discount rates and cash flow forecasts on the valuation of the Tubular operating segment. The valuation of the Tubular Products Group substantially exceeded its carrying value at December 31, 2009 and 2008. Accordingly, no further valuation of the segment was necessary. If the Company’s assumptions about goodwill change as a result of events or circumstances, and management believes the assets may have declined in value, then impairment charges will be recorded, resulting in lower profits. The operations of the Tubular Products Group are cyclical and its sales and profitability may fluctuate from year to year. In the evaluation of the Company’s operating segment, the Company looks at the long-term prospects for the reporting unit and recognizes that current performance may not be the best indicator of future prospects or value, which requires management judgment.
Workers Compensation Insurance
The Company is self-insured, or maintains high deductible policies, for losses and liabilities associated with workers compensation claims. Losses are accrued based upon the Company’s estimates of the aggregate liability for claims incurred using historical experience and certain actuarial assumptions followed in the insurance industry.
Pension Benefits
The Company has two defined benefit pension plans that have been frozen since 2001. The Company funds these plans to cover current plan costs plus amortization of the unfunded plan liabilities. To record these obligations, management uses estimates relating to assumed inflation, investment returns, mortality, and discount rates. Management reviews all of these assumptions on an annual basis.
Derivative Instruments
The Company conducts business in various foreign countries, and, from time to time, settles transactions in foreign currencies. The Company has established a program that utilizes foreign currency forward contracts to offset the risk associated with the effects of certain foreign currency exposures, typically arising from sales contracts denominated in Canadian currency. Foreign currency forward contracts are consistent with the Company’s strategy for financial risk management; however, prior to June 30, 2009, the contracts did not meet the conditions under the authoritative guidance to qualify for hedge accounting treatment. Beginning in the quarter ended September 30, 2009, the Company adopted cash flow hedge accounting treatment for qualifying foreign currency forward contracts entered into subsequent to June 30, 2009. Instruments that do not qualify for cash flow hedge accounting treatment are remeasured at fair value at each balance sheet date and resulting gains and losses are recognized in net income.
Foreign Currency Transactions
Assets and liabilities subject to foreign currency fluctuations are translated into United States dollars at the period-end exchange rate, and revenue and expenses are translated at exchange rates representing an average for the period. Translation adjustments from designated hedges are included in accumulated other comprehensive income (loss) as a separate component of stockholders’ equity. Gains or losses on all other foreign currency transactions are recognized in the statement of operations. The functional currency of our Mexican operations is the US dollar.
F-8
Table of Contents
Revenue Recognition
Revenue from construction contracts in the Company’s Water Transmission Group is recognized on the percentage-of-completion method, measured by the costs incurred to date as a percentage of the estimated total costs of each contract (cost-to-cost method). Contract costs include all direct material and labor costs and those indirect costs related to contract performance, such as indirect labor, supplies, tools, repairs and depreciation. Selling, general and administrative costs are charged to expense as incurred. The cost of steel is recognized as a project cost when the steel is introduced into the manufacturing process. Estimated total costs of each contract are reviewed on a monthly basis by project management and operations personnel for substantially all projects that are 50% or more complete except that major projects, usually over $5.0 million, are reviewed earlier if sufficient production has been completed to provide enough information to revise the original estimated total cost of the project. All cost revisions that result in the gross profit as a percent of sales increasing or decreasing by more than two percent are reviewed by senior management personnel.
The Company begins recognizing revenue on a project when persuasive evidence of an arrangement exists, recoverability is probable, and project costs are incurred. Costs may be incurred before the Company has persuasive evidence of an arrangement. In those cases, the project costs are deferred if the Company believes it will obtain persuasive evidence of an arrangement and if recoverability from that arrangement is probable.
Provisions for losses on uncompleted contracts are made in the period such losses are known. Changes in job performance, job conditions and estimated profitability, including those arising from contract penalty provisions, foreign currency exchange rate movements, and final contract settlements may result in revisions to revenue, costs and income and are recognized in the period in which the revisions are determined.
Revenue from the Company’s Tubular Products Group is recognized when all four of the following criteria have been satisfied: persuasive evidence of an arrangement exists; the price is fixed or determinable; delivery has occurred; and collectability is reasonably assured.
Income Taxes
Income taxes are recorded using an asset and liability approach that requires the recognition of deferred tax assets and liabilities for the expected future tax consequences of events that have been recognized in the Company’s financial statements or tax returns. Valuation allowances are established when necessary to reduce deferred income tax assets to the amount expected to be realized. The determination of the provision for income taxes requires significant judgment, the use of estimates and the interpretation and application of complex tax laws. The provision for income taxes primarily reflects a combination of income earned and taxed in the various U.S. federal and state and, to a lesser extent, foreign jurisdictions. Jurisdictional tax law changes, increases or decreases in permanent differences between book and tax items, accruals or adjustments of accruals for unrecognized tax benefits or valuation allowances, and the change in the mix of earnings from these taxing jurisdictions all affect the overall effective tax rate.
The Company records tax reserves for federal, state, local and international exposures relating to periods subject to audit. The development of reserves for these exposures requires judgments about tax issues, potential outcomes and timing, and is a subjective estimate. The Company assesses tax positions and records tax benefits for all years subject to examination based upon management’s evaluation of the facts, circumstances, and information available at the reporting dates. For those tax positions where it is more-likely-than-not that a tax benefit will be sustained, the largest amount of tax benefit with a greater than 50% likelihood of being realized upon settlement with a tax authority that has full knowledge of all relevant information has been recorded. For those tax positions where it is not more-likely-than-not that a tax benefit will be sustained, no tax benefit has been recognized in the financial statements.
F-9
Table of Contents
Accumulated Other Comprehensive Income (Loss)
Accumulated other comprehensive income (loss) includes unrealized gains and losses on derivative instruments related to the effective portion of cash flow hedges and changes in the funded status of the defined benefit pension plans, both net of the related income tax effect. Accumulated other comprehensive income (loss) consists of the following:
| December 31, | ||||||||
| 2009 | 2008 | |||||||
| (in thousands) | ||||||||
| Unrealized pension liability |
$ | (2,485 | ) | $ | (2,922 | ) | ||
| Net deferred loss on cash flow derivatives |
(105 | ) | — | |||||
| Total |
$ | (2,590 | ) | $ | (2,922 | ) | ||
Earnings per Share
Basic earnings per share are computed using the weighted average number of shares of common stock outstanding during the period. Diluted earnings per share assumes the vesting of restricted stock units, performance awards and in the money options, provided in each case the effect is dilutive. Due to the net loss position for the year ended December 31, 2009, no securities were included in the computation of diluted net loss per share because the effect would be antidilutive. Incremental shares of 195,139 and 272,492 for the years ended December 31, 2008 and 2007, respectively, were used in the calculations of diluted earnings per share. For the year ended December 31, 2008, 1,965 of options and restricted stock units were excluded from the computation of diluted earnings per share because the effect of their inclusion would have been antidilutive. For the year ended December 31, 2007, the calculation of diluted earnings per share included all potentially dilutive shares.
Concentrations of Credit Risk
Financial instruments, which potentially subject the Company to concentrations of credit risk, consist principally of trade receivables, derivative contracts and the escrow account. Trade receivables generally represent a large number of customers, including municipalities, manufacturers, distributors and contractors, dispersed across a wide geographic base. No single customer balance accounted for 10% or more of total accounts receivable at December 31, 2009 or 2008. Derivative contracts are with a financial institution rated A/A1 by S&P. The escrow account, which is included in Other Assets, is held in a money market mutual fund.
Fair Value of Financial Instruments
The fair values of financial instruments are the amounts at which the instrument could be exchanged in a current transaction between willing parties, other than in a forced or liquidation sale. The carrying amounts reflected in the consolidated balance sheets for cash and cash equivalents, trade and other receivables, and the escrow account approximate fair value because of the short maturity for these instruments. The fair value approximates the carrying value of the Company’s borrowings under its long-term arrangements based upon interest rates available for the same or similar loans.
Long-Lived Assets
The Company assesses impairment of property and equipment whenever changes in circumstances indicate that the carrying values of the assets may not be recoverable. The recoverable value of long-lived assets is determined by estimating future undiscounted cash flows using assumptions about the expected future operating performance of the Company. The estimates of undiscounted cash flows may differ from actual cash flow due to, among other things, technological changes, economic conditions, or changes to business operations. If the carrying value of the property and equipment is not estimated to be recoverable, an impairment loss is calculated and recorded.
F-10
Table of Contents
Share-based Compensation
The Company recognizes the compensation cost of employee services received in exchange for awards of equity instruments based on the grant date estimated fair value of the awards. The Company recognizes compensation expense related to performance awards based on the probable outcome of the performance conditions. Performance award compensation cost is recognized over the period during which the employee is required to provide service in exchange for the award, and as forfeitures occur, the associated compensation cost recognized to date is reversed.
See Note 12, “Share-based Compensation Plans” for further discussion of the Company’s share-based compensation.
Recent Accounting and Reporting Developments
In January 2010, the FASB issued authoritative guidance which requires new disclosures and clarifies existing disclosure requirements for fair value measurements. Specifically, the changes require disclosure of transfers into and out of “Level 1” and “Level 2” (as defined in the accounting guidance) fair value measurements, and also require more detailed disclosure about the activity within “Level 3” (as defined) fair value measurements. This guidance is effective for interim and annual reporting periods beginning after December 15, 2009, with the exception of the disclosures about purchases, sales, issuances and settlements of Level 3 assets and liabilities, which is effective for fiscal years beginning after December 15, 2010. As this guidance only requires expanded disclosures, the adoption will not impact the Company’s consolidated financial position, results of operations or cash flows.
In October 2009, the FASB issued amendments to the accounting and disclosure for revenue recognition for multiple element arrangements. These amendments modify the criteria for recognizing revenue and require enhanced disclosures for multiple element-deliverable revenue arrangements. This guidance will be effective prospectively for revenue arrangements entered into or materially modified in fiscal years beginning on or after June 15, 2010. The adoption of this guidance is not expected to have a significant impact on the Company’s consolidated financial position, results of operations or cash flows.
In June 2009, the FASB issued authoritative guidance to eliminate the exception to consolidate a qualifying special-purpose entity, change the approach to determining the primary beneficiary of a variable interest entity and require companies to more frequently re-assess whether they must consolidate variable interest entities. Under the new guidance, the primary beneficiary of a variable interest entity is identified qualitatively as the enterprise that has both (a) the power to direct the activities of a variable interest entity that most significantly impact the entity’s economic performance, and (b) the obligation to absorb losses of the entity that could potentially be significant to the variable interest entity or the right to receive benefits from the entity that could potentially be significant to the variable interest entity. This guidance becomes effective for fiscal years beginning after November 15, 2009. The adoption of this guidance will not have a material impact on the Company’s consolidated financial statements presented herein.
In June 2009, the FASB issued authoritative guidance that will require more information about transfer of financial assets, including securitization transactions, and enhanced disclosures when companies have continuing exposure to the risks related to transferred financial assets. Additionally, the new guidance eliminates the concept of a qualifying special-purpose entity. This guidance is effective for fiscal years beginning after November 15, 2009. The adoption of this guidance will not have a material impact on the Company’s consolidated financial statements presented herein.
F-11
Table of Contents
| 2. | RESTATEMENTS OF CONSOLIDATED FINANCIAL STATEMENTS: |
The Company has restated its consolidated balance sheet at December 31, 2008, and the consolidated statements of operations, stockholders’ equity and comprehensive income (loss), and cash flows for the years ended December 31, 2008 and 2007, including the cumulative impact of corrected errors for periods prior to January 1, 2007.
The cumulative adjustments to correct the errors in the consolidated financial statements for all periods prior to January 1, 2007 are recorded as adjustments to retained earnings in the restated stockholders’ equity at December 31, 2006, as shown in the consolidated statements of stockholders’ equity and comprehensive income (loss). The cumulative effect of those adjustments reduced previously reported retained earnings and total stockholders’ equity by $29.2 million at December 31, 2006.
The following tables present the summary impacts of the restatement adjustments, net of tax, on the Company’s previously reported consolidated retained earnings at December 31, 2006 and consolidated net income for the years ended December 31, 2008 and 2007 (in thousands):
| Retained earnings at December 31, 2006—As previously reported |
$ | 135,130 | ||
| Revenue recognition |
(4,292 | ) | ||
| Allocation of certain overhead and support costs |
(7,610 | ) | ||
| Capitalization and depreciation |
(15,299 | ) | ||
| Foreign exchange |
(91 | ) | ||
| Other |
(1,890 | ) | ||
| Retained earnings at January 1, 2007—As restated |
$ | 105,948 | ||
| For the Years Ended December 31, |
||||||||
| 2008 | 2007 | |||||||
| Net income—As previously reported |
$ | 32,301 | $ | 20,832 | ||||
| Revenue recognition |
1,828 | (926 | ) | |||||
| Allocation of certain overhead and support costs |
(4,398 | ) | (3,441 | ) | ||||
| Capitalization and depreciation |
(1,377 | ) | (1,816 | ) | ||||
| Persuasive evidence of an arrangement |
(130 | ) | — | |||||
| Foreign exchange |
2,946 | (2,091 | ) | |||||
| Other |
168 | (639 | ) | |||||
| Net income—As restated |
$ | 31,338 | $ | 11,919 | ||||
Subsequent to the issuance of the 2008 financial statements, the Audit Committee, with the assistance of independent professionals retained by the Audit Committee, conducted an investigation of certain accounting matters. In addition, at the direction of the Audit Committee, an external consulting firm was retained to assist the Company in performing certain related analyses of its accounting practices and previously issued consolidated financial statements. Based upon its consideration of the issues identified in the Audit Committee investigation and the related accounting analyses, and after discussions with management, the Audit Committee concluded that the Company’s previously issued consolidated financial statements contained material errors and should be restated.
During the fourth quarter of 2009 and through October of 2010, with the assistance of external consultants, a restatement of certain of the Company’s accounting records was completed, particularly records related to revenue recognition, allocation of certain overhead and support costs and capitalization and depreciation of certain costs, so that consolidated financial statements as of and for the fiscal years ended December 31, 2009, 2008 and 2007, and for each of the quarterly periods within the years ended December 31, 2009 and 2008 could
F-12
Table of Contents
be prepared. As a result of this process, various accounting corrections to the historical accounting records were recorded.
Descriptions of the restatement adjustments recorded are as follows:
Timing of Revenue Recognition on Steel Costs Incurred
The Audit Committee investigation and related accounting analyses initially focused primarily on issues related to the Company’s application of the cost-to-cost percentage-of-completion revenue recognition methodology (the “Percentage-of-Completion Method”) in its Water Transmission segment. In the course of the Audit Committee investigation and the Company’s related accounting analyses, the Company, assisted by its external consultants, conducted a detailed analysis of the procedures and judgments applied by it in its historical method of applying the Percentage-of-Completion Method. The Audit Committee and the Company also engaged in extensive discussion of these matters with the Company’s external consultants, and consulted with the Office of the Chief Accountant of the Securities and Exchange Commission (the “SEC”). Under the Company’s historical method of applying the Percentage-of-Completion Method, the cost of steel was recognized as a project cost at the time the cost was incurred, resulting in the recognition of revenue at that time. The Company has now determined that the cost of steel should not be recognized as a project cost when the cost is incurred but should be recognized as a project cost when the steel is introduced into the manufacturing process.
The adjustments required to correct this error delay the recognition of certain previously reported contract costs, net sales and net income, but have no impact on the aggregate amount of net sales or gross profit from each water transmission project that will ultimately be realized by the Company. The adjustments also affect certain previously reported current asset and liability balances, including inventory, cost and estimated earnings in excess of billings on uncompleted contracts (“CEEEB”) and billings in excess of costs and estimated earnings on uncompleted contracts (“BECEE”).
Allocation of Certain Overhead and Support Costs
After a detailed review of the procedures used in its method of allocating manufacturing overhead variances and support costs to Water Transmission projects and Tubular Products manufacturing, and extensive discussion of these matters with the Company’s external consultants, the Company determined that errors occurred in its method of allocating manufacturing overhead variances and indirect support costs to projects in the Company’s Water Transmission segment and inventory in the Tubular Products segment, as well as in related assumptions and judgments, including those regarding total estimated Water Transmission project costs. Primarily, manufacturing overhead variances and indirect support costs were not allocated to specific water transmission projects and were not properly relieved when projects were completed. The adjustments required to correct these errors have resulted in the reduction of net sales, gross profit, and net income and have also affected certain previously reported current asset and liability balances, including inventory, CEEEB and BECEE.
Capitalization and Depreciation
Historically, the Company has capitalized and depreciated the costs related to certain major maintenance, improvement and renewal activities for property and equipment in its Water Transmission and Tubular Products manufacturing facilities. After conducting an analysis of the economic lives and depreciation methods used by the Company for these capitalized costs and engaging in extensive discussion of these matters with the Company’s external consultants, the Company determined that certain equipment carrying values were overstated and that there were errors in the determination of the economic lives and residual values of certain equipment. The adjustments required to correct these errors have resulted in the reduction of previously reported net income and of net property and equipment balances, and an increase in previously reported accumulated depreciation, depreciation expense and cost of sales.
F-13
Table of Contents
Documentation of Contract Inception Dates
Historically, the Company began recognizing revenue on water transmission projects when, in management’s judgment, a contract had been formed with the customer and contract costs had been incurred. After a detailed review of contract documentation, the Company identified certain instances in which its documentation did not provide persuasive evidence that all contract contingencies had been satisfied prior to revenue recognition. The adjustments required to correct these errors delay the recognition of net sales, cost of sales, gross profit and net income, but have no impact on the aggregate amount of net sales or gross profit that will ultimately be realized by the Company on the affected water transmission projects.
Foreign Exchange
Historically, the Company did not properly account for foreign currency translation or the mark-to-market impact of derivative instruments. In addition, the effects of other restatement adjustments also necessitated additional foreign currency translation adjustments. The adjustments required to correct this error impact the recognition of certain net sales and net income. The adjustments also affect certain previously reported current asset and liability balances, including CEEEB and BECEE.
Other Errors and Reclassifications
Other errors were identified in the course of the Audit Committee investigation and the related accounting analyses including an error recording costs of a business re-engineering project of approximately $750,000, which is included in the $1.3 million restatement of cost of sales in the year ended December 31, 2007, and other adjustments as follows; (i) an error estimating the value of a vendor claim receivable; (ii) an error in the timing of recognizing a gain on insurance proceeds; (iii) an error in the timing of recording a customer claim payable; and (iv) errors related to revenue recognition for customers that should have been accounted for using the units of delivery percentage of completion method instead of the cost-to-cost percentage of completion revenue recognition method. In addition, certain immaterial adjustments that were not made or reflected in the previously issued consolidated financial statements are corrected in the restated consolidated financial statements. Certain prior year classification errors were also corrected in conjunction with the restatement. Net income was not affected by these classification errors, included in presentation corrections below. The presentation corrections in the following Statements of Operations tables primarily relate to the transfer of certain selling, general and administrative costs to cost of sales and movement of foreign currency translation activity from cost of sales to net sales.
F-14
Table of Contents
The nature of the restatement adjustments, presentation corrections and the impact on the Company’s previously reported consolidated statement of operations for the year ended December 31, 2008 are shown in the following table (in thousands, except per share data):
| Year Ended December 31, |
As Previously Reported |
Restatement Adjustments | As Restated | |||||||||||||||||||||||||||||||||
| Presentation Corrections |
Steel Recognition |
Allocation of Certain Overhead & Support Costs |
Capitalization & Depreciation |
Contract Inception |
Foreign Exchange |
Other | ||||||||||||||||||||||||||||||
| Net sales |
$ | 439,735 | $ | 5,606 | $ | 8,608 | $ | (6,029 | ) | $ | — | $ | (1,416 | ) | $ | 4,787 | $ | 128 | 451,419 | |||||||||||||||||
| Cost of sales |
346,077 | 13,362 | 5,645 | 1,114 | 2,384 | (1,205 | ) | 3 | (548 | ) | 366,832 | |||||||||||||||||||||||||
| Gross profit |
93,658 | (7,756 | ) | 2,963 | (7,143 | ) | (2,384 | ) | (211 | ) | 4,784 | 676 | 84,587 | |||||||||||||||||||||||
| Selling, general and administrative |
35,166 | (7,870 | ) | (6 | ) | — | (55 | ) | — | — | — | 27,235 | ||||||||||||||||||||||||
| Operating income |
58,492 | 114 | 2,969 | (7,143 | ) | (2,329 | ) | (211 | ) | 4,784 | 676 | 57,352 | ||||||||||||||||||||||||
| Other expense |
— | 114 | — | — | (94 | ) | — | — | 404 | 424 | ||||||||||||||||||||||||||
| Interest income |
— | (180 | ) | — | — | — | — | — | — | (180 | ) | |||||||||||||||||||||||||
| Interest expense |
6,409 | 180 | — | — | — | — | — | — | 6,589 | |||||||||||||||||||||||||||
| Income before income taxes |
52,083 | — | 2,969 | (7,143 | ) | (2,235 | ) | (211 | ) | 4,784 | 272 | 50,519 | ||||||||||||||||||||||||
| Provision for income taxes |
19,782 | — | 1,141 | (2,745 | ) | (858 | ) | (81 | ) | 1,838 | 104 | 19,181 | ||||||||||||||||||||||||
| Net income |
$ | 32,301 | $ | — | $ | 1,828 | $ | (4,398 | ) | $ | (1,377 | ) | $ | (130 | ) | $ | 2,946 | $ | 168 | $ | 31,338 | |||||||||||||||
| Basic earnings per share |
$ | 3.53 | $ | 3.43 | ||||||||||||||||||||||||||||||||
| Diluted earnings per share |
$ | 3.46 | $ | 3.35 | ||||||||||||||||||||||||||||||||
The nature of the restatement adjustments, presentation corrections and the impact on the Company’s previously reported consolidated statement of operations for the year ended December 31, 2007 are shown in the following table (in thousands, except per share data):
| Year Ended December 31, |
As Previously Reported |
Restatement Adjustments | As Restated | |||||||||||||||||||||||||||||||||
| Presentation Corrections |
Steel Recognition |
Allocation of Certain Overhead & Support Costs |
Capitalization & Depreciation |
Contract Inception |
Foreign Exchange |
Other | ||||||||||||||||||||||||||||||
| Net sales |
$ | 382,824 | $ | (4,252 | ) | $ | (4,144 | ) | $ | (6,560 | ) | $ | — | $ | — | $ | (3,392 | ) | $ | (162 | ) | $ | 364,314 | |||||||||||||
| Cost of sales |
312,609 | 2,548 | (2,641 | ) | (983 | ) | 3,016 | — | (3 | ) | 1,315 | 315,861 | ||||||||||||||||||||||||
| Gross profit |
70,215 | (6,800 | ) | (1,503 | ) | (5,577 | ) | (3,016 | ) | — | (3,389 | ) | (1,477 | ) | 48,453 | |||||||||||||||||||||
| Selling, general and administrative |
30,703 | (6,687 | ) | — | — | (70 | ) | — | — | (439 | ) | 23,507 | ||||||||||||||||||||||||
| Operating income |
39,512 | (113 | ) | (1,503 | ) | (5,577 | ) | (2,946 | ) | — | (3,389 | ) | (1,038 | ) | 24,946 | |||||||||||||||||||||
| Other income |
— | (112 | ) | — | — | (2 | ) | — | — | — | (114 | ) | ||||||||||||||||||||||||
| Interest income |
— | (303 | ) | — | — | — | — | — | — | (303 | ) | |||||||||||||||||||||||||
| Interest expense |
6,792 | 302 | — | — | — | — | — | — | 7,094 | |||||||||||||||||||||||||||
| Income before income taxes |
32,720 | — | (1,503 | ) | (5,577 | ) | (2,944 | ) | — | (3,389 | ) | (1,038 | ) | 18,269 | ||||||||||||||||||||||
| Provision for income taxes |
11,888 | — | (577 | ) | (2,136 | ) | (1,128 | ) | — | (1,298 | ) | (399 | ) | 6,350 | ||||||||||||||||||||||
| Net income |
$ | 20,832 | $ | — | $ | (926 | ) | $ | (3,441 | ) | $ | (1,816 | ) | $ | — | $ | (2,091 | ) | $ | (639 | ) | $ | 11,919 | |||||||||||||
| Basic earnings per share |
$ | 2.32 | $ | 1.33 | ||||||||||||||||||||||||||||||||
| Diluted earnings per share |
$ | 2.26 | $ | 1.29 | ||||||||||||||||||||||||||||||||
F-15
Table of Contents
The following table presents the impact of the restatement adjustments on the Company’s previously reported consolidated balance sheet at December 31, 2008. In addition to the statement of operations adjustments described above, certain balance sheet adjustments were also identified. The presentation corrections to the following consolidated balance sheet include the transfer of certain inventory balances to long term and the result of the cumulative impact of revenue adjustments which affected the ending CEEEB and BECEE positions of the underlying sales contracts. These balance sheet corrections are included in the adjustments columns below (in thousands):
| As of December 31, 2008 |
As Previously Reported |
Restatement Adjustments | As Restated | |||||||||||||||||||||||||||||||||
| Presentation Correction |
Steel Recognition |
Allocation of Certain Overhead & Support Costs |
Capitalization & Depreciation |
Contract Inception |
Foreign Exchange |
Other | ||||||||||||||||||||||||||||||
| Assets |
||||||||||||||||||||||||||||||||||||
| Current assets: |
||||||||||||||||||||||||||||||||||||
| Cash and cash equivalents |
$ | 90 | $ | — | $ | — | $ | — | $ | — | $ | — | $ | — | $ | — | $ | 90 | ||||||||||||||||||
| Trade and other receivables, net |
75,923 | — | 513 | — | — | — | (468 | ) | (201 | ) | 75,767 | |||||||||||||||||||||||||
| Costs and estimated earnings in excess of billings on uncompleted contracts |
106,234 | 10,099 | (29,451 | ) | (21,175 | ) | — | (1,416 | ) | 1,713 | (358 | ) | 65,646 | |||||||||||||||||||||||
| Inventories |
87,348 | (12,043 | ) | 23,416 | (3,925 | ) | 313 | 1,205 | — | (18 | ) | 96,296 | ||||||||||||||||||||||||
| Refundable income taxes |
3,412 | — | — | — | — | — | — | 31 | 3,443 | |||||||||||||||||||||||||||
| Deferred income taxes |
4,535 | — | 2,219 | 9,748 | — | 81 | (481 | ) | 1,896 | 17,998 | ||||||||||||||||||||||||||
| Prepaid expenses and other |
4,489 | — | — | — | — | — | — | (1,465 | ) | 3,024 | ||||||||||||||||||||||||||
| Total current assets |
282,031 | (1,944 | ) | (3,303 | ) | (15,352 | ) | 313 | (130 | ) | 764 | (115 | ) | 262,264 | ||||||||||||||||||||||
| Property and equipment, net |
194,035 | — | — | — | (30,468 | ) | — | — | — | 163,567 | ||||||||||||||||||||||||||
| Goodwill |
21,451 | — | — | — | — | — | — | — | 21,451 | |||||||||||||||||||||||||||
| Other assets |
11,917 | 12,043 | — | — | — | — | — | (962 | ) | 22,998 | ||||||||||||||||||||||||||
| Total assets |
$ | 509,434 | $ | 10,099 | $ | (3,303 | ) | $ | (15,352 | ) | $ | (30,155 | ) | $ | (130 | ) | $ | 764 | $ | (1,077 | ) | $ | 470,280 | |||||||||||||
| Liabilities and Stockholders’ Equity |
||||||||||||||||||||||||||||||||||||
| Current liabilities: |
||||||||||||||||||||||||||||||||||||
| Current portion of long-term debt |
$ | 5,714 | $ | — | $ | — | $ | — | $ | — | $ | — | $ | — | $ | — | 5,714 | |||||||||||||||||||
| Current portion of capital lease obligations |
829 | — | — | — | — | — | — | — | 829 | |||||||||||||||||||||||||||
| Accounts payable |
34,109 | — | — | — | — | — | — | — | 34,109 | |||||||||||||||||||||||||||
| Accrued liabilities |
10,111 | — | 87 | 97 | — | — | — | 813 | 11,108 | |||||||||||||||||||||||||||
| Billings in excess of costs and estimated earnings on uncompleted contracts |
8,020 | 10,099 | — | — | — | — | — | — | 18,119 | |||||||||||||||||||||||||||
| Total current liabilities |
58,783 | 10,099 | 87 | 97 | — | — | — | 813 | 69,879 | |||||||||||||||||||||||||||
| Note payable to financial institution |
82,065 | — | — | — | — | — | — | — | 82,065 | |||||||||||||||||||||||||||
| Long-term debt, less current portion |
29,215 | — | — | — | — | — | — | — | 29,215 | |||||||||||||||||||||||||||
| Capital lease obligations, less current portion |
3,164 | — | — | — | — | — | — | — | 3,164 | |||||||||||||||||||||||||||
| Deferred income taxes |
37,776 | — | — | — | (11,663 | ) | — | — | 470 | 26,583 | ||||||||||||||||||||||||||
| Pension and other long-term liabilities |
6,870 | — | — | — | — | — | — | — | 6,870 | |||||||||||||||||||||||||||
| Total liabilities |
217,873 | 10,099 | 87 | 97 | (11,663 | ) | — | — | 1,283 | 217,776 | ||||||||||||||||||||||||||
| Commitments and contingencies |
||||||||||||||||||||||||||||||||||||
| Stockholders’ equity: |
||||||||||||||||||||||||||||||||||||
| Preferred stock |
— | — | — | — | — | — | — | — | — | |||||||||||||||||||||||||||
| Common stock |
92 | — | — | — | — | — | — | — | 92 | |||||||||||||||||||||||||||
| Additional paid-in-capital |
106,129 | — | — | — | — | — | — | — | 106,129 | |||||||||||||||||||||||||||
| Retained earnings |
188,263 | — | (3,390 | ) | (15,449 | ) | (18,492 | ) | (130 | ) | 764 | (2,361 | ) | 149,205 | ||||||||||||||||||||||
| Accumulated other comprehensive loss |
(2,923 | ) | — | — | — | — | — | — | 1 | (2,922 | ) | |||||||||||||||||||||||||
| Total stockholders’ equity |
291,561 | — | (3,390 | ) | (15,449 | ) | (18,492 | ) | (130 | ) | 764 | (2,360 | ) | 252,504 | ||||||||||||||||||||||
| Total liabilities and stockholders’ equity |
$ | 509,434 | $ | 10,099 | $ | (3,303 | ) | $ | (15,352 | ) | $ | (30,155 | ) | $ | (130 | ) | $ | 764 | $ | (1,077 | ) | $ | 470,280 | |||||||||||||
F-16
Table of Contents
The following table presents the impact of the restatement adjustments and presentation corrections on the Company’s previously reported consolidated statement of cash flows for the year ended December 31, 2008. In addition, amounts have been corrected in the accompanying Consolidated Statements of Cash Flows to present borrowings and payments under the note payable to financial institution on a gross rather than a net basis and amounts for accrued property and equipment purchases have been presented as noncash transactions (in thousands):
| Year ended December 31, 2008 | ||||||||||||
| As Previously Reported |
Restatement Adjustments |
As Restated | ||||||||||
| Cash flows from operating activities: |
||||||||||||
| Net income |
$ | 32,301 | $ | (963 | ) | $ | 31,338 | |||||
| Adjustments to reconcile net income to net cash (used in) provided by operating activities: |
||||||||||||
| Depreciation and amortization of property and equipment |
4,966 | 2,091 | 7,057 | |||||||||
| Amortization of intangible assets |
120 | (1 | ) | 119 | ||||||||
| Provision for doubtful accounts |
— | (428 | ) | (428 | ) | |||||||
| Amortization of debt issuance costs |
378 | (2 | ) | 376 | ||||||||
| Deferred income taxes |
3,529 | (602 | ) | 2,927 | ||||||||
| Loss on disposal of property and equipment |
4,185 | (95 | ) | 4,090 | ||||||||
| Stock-based compensation expense |
1,025 | — | 1,025 | |||||||||
| Tax benefit from stock option plans |
1,070 | — | 1,070 | |||||||||
| Excess tax benefit from stock option plans |
(828 | ) | — | (828 | ) | |||||||
| Changes in operating assets and liabilities: |
||||||||||||
| Trade and other receivables, net |
(26,623 | ) | (1,016 | ) | (27,639 | ) | ||||||
| Costs and estimated earnings in excess of billings on uncompleted contracts, net |
20,330 | (7,156 | ) | 13,174 | ||||||||
| Inventories |
(24,543 | ) | 6,719 | (17,824 | ) | |||||||
| Refundable income taxes |
(527 | ) | — | (527 | ) | |||||||
| Prepaid expenses and other |
(1,715 | ) | 1,990 | 275 | ||||||||
| Accounts payable |
(7,575 | ) | (1,401 | ) | (8,976 | ) | ||||||
| Accrued and other liabilities |
(6,152 | ) | 1,224 | (4,928 | ) | |||||||
| Net cash (used in) provided by operating activities |
(59 | ) | 360 | 301 | ||||||||
| Cash flows from investing activities: |
||||||||||||
| Additions to property and equipment |
(21,612 | ) | (360 | ) | (21,972 | ) | ||||||
| Proceeds from sale of property and equipment |
10 | — | 10 | |||||||||
| Other investing activities |
(2,780 | ) | — | (2,780 | ) | |||||||
| Net cash used in investing activities |
(24,382 | ) | (360 | ) | (24,742 | ) | ||||||
| Cash flows from financing activities: |
||||||||||||
| Proceeds from sale of common stock |
2,286 | — | 2,286 | |||||||||
| Payments on long-term debt |
(5,071 | ) | — | (5,071 | ) | |||||||
| Net borrowings under note payable to financial institutions |
27,650 | (27,650 | ) | — | ||||||||
| Borrowings under note payable to financial institutions |
— | 223,222 | 223,222 | |||||||||
| Payments on note payable to financial institutions |
— | (195,572 | ) | (195,572 | ) | |||||||
| Payments of debt issuance costs |
(617 | ) | — | (617 | ) | |||||||
| Payments on capital lease obligations |
(779 | ) | — | (779 | ) | |||||||
| Excess tax benefit from stock option plans |
828 | — | 828 | |||||||||
| Net cash provided by financing activities |
24,297 | — | 24,297 | |||||||||
| Change in cash and cash equivalents |
(144 | ) | — | (144 | ) | |||||||
| Cash and cash equivalents, beginning of period |
234 | — | 234 | |||||||||
| Cash and cash equivalents, end of period |
$ | 90 | $ | — | $ | 90 | ||||||
| Non-cash investing and financing activities: |
||||||||||||
| Accrued property and equipment purchases |
$ | 1,607 | $ | 1,689 | $ | 3,296 | ||||||
F-17
Table of Contents
The following table presents the impact of the restatement adjustments and presentation corrections on the Company’s previously reported consolidated statement of cash flows for the year ended December 31, 2007. In addition, amounts have been corrected in the accompanying Consolidated Statements of Cash Flows to present borrowings and payments under the note payable to financial institution on a gross rather than a net basis and amounts for accrued property and equipment purchases have been presented as noncash transactions (in thousands):
| Year ended December 31, 2007 | ||||||||||||
| As Previously Reported |
Restatement Adjustments |
As Restated | ||||||||||
| Cash flows from operating activities: |
||||||||||||
| Net income |
$ | 20,832 | $ | (8,913 | ) | $ | 11,919 | |||||
| Adjustments to reconcile net income to net cash provided by operating activities: |
||||||||||||
| Depreciation and amortization of property and equipment |
5,133 | 1,645 | 6,778 | |||||||||
| Provision for doubtful accounts |
— | 307 | 307 | |||||||||
| Amortization of debt issuance costs |
349 | — | 349 | |||||||||
| Deferred income taxes |
3,347 | (5,507 | ) | (2,160 | ) | |||||||
| Loss on disposal of property and equipment |
397 | (3 | ) | 394 | ||||||||
| Stock-based compensation expense |
297 | — | 297 | |||||||||
| Tax benefit from stock option plans |
1,246 | — | 1,246 | |||||||||
| Excess tax benefit from stock option plans |
(801 | ) | — | (801 | ) | |||||||
| Changes in operating assets and liabilities: |
||||||||||||
| Trade and other receivables, net |
19,125 | (1,325 | ) | 17,800 | ||||||||
| Costs and estimated earnings in excess of billings on uncompleted contracts, net |
(44,191 | ) | 15,042 | (29,149 | ) | |||||||
| Inventories |
16,495 | (3,373 | ) | 13,122 | ||||||||
| Refundable income taxes |
3,004 | (31 | ) | 2,973 | ||||||||
| Prepaid expenses and other |
(4,346 | ) | 750 | (3,596 | ) | |||||||
| Accounts payable |
(9,181 | ) | 761 | (8,420 | ) | |||||||
| Accrued and other liabilities |
7,616 | 240 | 7,856 | |||||||||
| Net cash provided by operating activities |
19,322 | (407 | ) | 18,915 | ||||||||
| Cash flows from investing activities: |
||||||||||||
| Additions to property and equipment |
(23,332 | ) | 407 | (22,925 | ) | |||||||
| Proceeds from sale of property and equipment |
48 | — | 48 | |||||||||
| Other investing activities |
(500 | ) | — | (500 | ) | |||||||
| Net cash used in investing activities |
(23,784 | ) | 407 | (23,377 | ) | |||||||
| Cash flows from financing activities: |
||||||||||||
| Proceeds from sale of common stock |
2,905 | — | 2,905 | |||||||||
| Payments on long-term debt |
(13,571 | ) | — | (13,571 | ) | |||||||
| Net borrowings under note payable to financial institutions |
11,415 | (11,415 | ) | — | ||||||||
| Borrowings under note payable to financial institutions |
— | 142,010 | 142,010 | |||||||||
| Payments on note payable to financial institutions |
— | (130,595 | ) | (130,595 | ) | |||||||
| Payments of debt issuance costs |
(431 | ) | — | (431 | ) | |||||||
| Payments on capital lease obligations |
(682 | ) | — | (682 | ) | |||||||
| Excess tax benefit from stock option plans |
801 | — | 801 | |||||||||
| Net cash provided by financing activities |
437 | — | 437 | |||||||||
| Change in cash and cash equivalents |
(4,025 | ) | 0 | (4,025 | ) | |||||||
| Cash and cash equivalents, beginning of period |
4,259 | — | 4,259 | |||||||||
| Cash and cash equivalents, end of period |
$ | 234 | $ | 0 | $ | 234 | ||||||
| Non-cash investing and financing activities: |
||||||||||||
| Accrued property and equipment purchases |
$ | — | $ | 2,049 | $ | 2,049 | ||||||
| Operating lease converted to capital lease |
1,447 | — | 1,447 | |||||||||
F-18
Table of Contents
| 3. | COSTS AND ESTIMATED EARNINGS IN EXCESS OF BILLINGS ON UNCOMPLETED CONTRACTS AND BILLINGS IN EXCESS OF COSTS AND ESTIMATED EARNINGS: |
The sum of costs and estimated earnings in excess of billings on uncompleted contracts represents revenue earned under the percentage-of-completion method but not billable based on the terms of the contracts. These amounts are billed based on the terms of the contracts, which include achievement of milestones, partial shipments or completion of the contracts. Billings in excess of costs and estimated earnings represents amounts billed based on the terms of the contracts in advance of costs incurred and revenue earned.
| December 31, | ||||||||
| 2009 | 2008 | |||||||
| (in thousands) | ||||||||
| Costs incurred on uncompleted contracts |
$ | 221,053 | $ | 252,504 | ||||
| Estimated earnings |
26,137 | 41,280 | ||||||
| 247,190 | 293,784 | |||||||
| Less billings to date |
(219,351 | ) | (246,257 | ) | ||||
| $ | 27,839 | $ | 47,527 | |||||
| Amounts are presented in the Consolidated Balance Sheets as follows: |
||||||||
| Costs and estimated earnings in excess of billings on uncompleted contracts |
$ | 37,509 | $ | 65,646 | ||||
| Billings in excess of costs and estimated earnings on uncompleted contracts |
(9,670 | ) | (18,119 | ) | ||||
| $ | 27,839 | $ | 47,527 | |||||
| 4. | INVENTORIES: |
| December 31, | ||||||||
| 2009 | 2008 | |||||||
| (in thousands) | ||||||||
| Short-term inventories: |
||||||||
| Finished goods |
$ | 14,799 | $ | 18,896 | ||||
| Raw materials |
53,335 | 71,258 | ||||||
| Work-in-process |
4,595 | 3,732 | ||||||
| Supplies |
2,137 | 2,410 | ||||||
| 74,866 | 96,296 | |||||||
| Long-term inventories: |
||||||||
| Finished goods |
4,388 | 12,043 | ||||||
| Total inventories |
$ | 79,254 | $ | 108,339 | ||||
Long-term inventories are recorded in other assets. The lower of cost or market adjustment was $5.8 million and $1.0 million at December 31, 2009 and 2008, respectively.
| 5. | PROPERTY AND EQUIPMENT: |
| December 31, | ||||||||
| 2009 | 2008 | |||||||
| (in thousands) | ||||||||
| Land and improvements |
$ | 19,061 | $ | 18,812 | ||||
| Buildings |
35,308 | 34,605 | ||||||
| Equipment |
143,378 | 142,447 | ||||||
| Equipment under capital lease |
7,514 | 5,448 | ||||||
| Construction in progress |
12,208 | 12,555 | ||||||
| 217,469 | 213,867 | |||||||
| Less accumulated depreciation and amortization |
(54,037 | ) | (50,300 | ) | ||||
| Property and equipment, net |
$ | 163,432 | $ | 163,567 | ||||
F-19
Table of Contents
Depreciation expense was $6.9 million, $7.1 million, and $6.8 million for the years ended December 31, 2009, 2008, and 2007, respectively. Accumulated amortization associated with property and equipment under capital leases was $29,000 and $280,000 at December 31, 2009 and 2008, respectively.
| 6. | NOTE PAYABLE TO FINANCIAL INSTITUTION: |
At December 31, 2009 and 2008, the Company had a $150.0 million line of credit agreement, under which $19.4 million and $82.1 million, respectively, was outstanding, bearing interest at weighted average rates of 2.78% and 3.55%, respectively. At December 31, 2009, the Company had additional net borrowing capacity under the line of credit of $123.9 million. The line of credit expires on May 31, 2012, and bears interest at rates related to LIBOR plus 1.25% to 2.25%, or the lending institution’s prime rate, plus 0.00% to 0.75%. The line of credit agreement contains the following covenants: minimum consolidated fixed charge coverage ratio, maximum consolidated senior leverage ratio, maximum consolidated total leverage ratio, minimum consolidated tangible net worth, and a minimum asset coverage ratio. The Company was not in compliance with its financial covenants as of December 31, 2009 and was granted waivers by its lenders. See Note 17, “Subsequent Events”, for more information on the waivers and amendments to the terms of the line of credit agreement, including the amount available and applicable interest rates.
| 7. | LONG-TERM DEBT: |
| December 31, | ||||||||
| 2009 | 2008 | |||||||
| (in thousands) | ||||||||
| Series A Term Note, maturing on February 25, 2014, due in annual payments of $2.1 million that began February 25, 2008, plus interest at 8.75% paid quarterly, on February 25, May 25, August 25 and November 25, collateralized by accounts receivable, inventory and certain equipment |
$ |
10,715 |
|
$ |
12,857 |
| ||
| Series B Term Note, maturing on June 21, 2014, due in annual payments of $1.5 millionthat began June 21, 2008, plus interest at 8.47% paid quarterly, on March 21, June 21, September 21 and December 21, collateralized by accounts receivable, inventory and certain equipment |
7,500 | 9,000 | ||||||
| Series C Term Note, maturing on October 26, 2014, due in annual payments of $1.4 millionthat began October 26, 2008, plus interest at 7.36% paid quarterly, on January 26, April 26, July 26 and October 26, collateralized by accounts receivable, inventory and certain equipment |
7,143 | 8,572 | ||||||
| Series D Term Note, maturing on January 24, 2015, due in annual payments of $645,000that began January 24, 2009, plus interest at 7.32% paid quarterly, on January 24, April 24, July 24 and October 24, collateralized by accounts receivable, inventory and certain equipment |
3,857 | 4,500 | ||||||
| Total long-term debt |
$ | 29,215 | $ | 34,929 | ||||
| Amounts are presented in the Consolidated Balance Sheets as follows: |
||||||||
| Current portion of long-term debt |
$ | 5,714 | $ | 5,714 | ||||
| Long-term debt, less current portion |
23,501 | 29,215 | ||||||
| $ | 29,215 | $ | 34,929 | |||||
The Company is required to maintain certain financial ratios under its long-term debt agreements, including the following covenants; maximum consolidated total debt to consolidated EBITDA, minimum consolidated tangible net worth, maximum consolidated senior debt to consolidated EBITDA, minimum consolidated fixed charge coverage, and a minimum asset coverage ratio. The Company was not in compliance with its financial
F-20
Table of Contents
covenants as of December 31, 2009 and was granted waivers by its long-term debt holders. See Note 17, “Subsequent Events”, for more information on the waivers and amendments to the long-term debt agreement, including the amount available and applicable interest rates.
Future principal payments of long-term debt are as follows (in thousands):
| 2010 |
$ | 5,714 | ||
| 2011 |
5,714 | |||
| 2012 |
5,714 | |||
| 2013 |
5,714 | |||
| 2014 |
5,714 | |||
| Thereafter |
645 | |||
| $ | 29,215 | |||
Interest expense was $5.1 million, net of amounts capitalized of $569,000 in 2009; $6.6 million, net of amounts capitalized of $395,000 in 2008; and $7.1 million, net of amounts capitalized of $279,000 in 2007.
| 8. | LEASES: |
Capital Leases
The Company leases certain equipment used in the manufacturing process. The future minimum principal payments under these capital leases are as follows (in thousands):
| 2010 |
$ | 424 | ||
| 2011 |
1,561 | |||
| 2012 |
1,561 | |||
| 2013 |
1,561 | |||
| 2014 |
1,561 | |||
| Thereafter |
4,423 | |||
| Total minimum lease payments |
11,091 | |||
| Amount representing interest |
(1,865 | ) | ||
| Present value of minumum lease payments with average interest rates of 5.76% |
9,226 | |||
| Current portion of capital lease obligation |
(408 | ) | ||
| Capital lease obligation, less current portion |
$ | 8,818 | ||
Capital leases outstanding as of December 31, 2009 consist of an agreement entered into as of September 2009 to finance certain equipment in the Company’s Bossier City facility (the “financing arrangement”). As part of the financing arrangement, a $10 million escrow account was provided for the Company by a local government entity through a financial institution and will be released upon qualifying purchase requisitions. At December 31, 2009, the escrow account had $5.6 million to be used for qualified project costs. As the Company purchases equipment for the facility, the Company enters into a sale-leaseback transaction with the governmental entity as part of the financing arrangement. The financing arrangement requires the Company to meet certain loan covenants, measured at the end of each fiscal quarter. These loan covenants follow the covenants required by the Company’s line of credit agreement. The Company was not in compliance with its financial covenants as of December 31, 2009 and was granted waivers by the lessors. See Note 17, “Subsequent Events”, for more information.
F-21
Table of Contents
Operating Leases
The Company has entered into various equipment leases with terms of ten years or less. Total rental expense for 2009, 2008, and 2007 was $2.3 million, $3.1 million, and $3.2 million, respectively. Certain of the Company’s operating lease agreements include renewals and/or purchase options set to expire at various dates. Future minimum payments as of December 31, 2009 for operating leases with initial or remaining terms in excess of one year are (in thousands):
| 2010 |
$ | 3,997 | ||
| 2011 |
3,845 | |||
| 2012 |
3,472 | |||
| 2013 |
3,191 | |||
| 2014 |
3,129 | |||
| Thereafter |
3,259 | |||
| $ | 20,893 | |||
In December 2009, the Company amended certain lease agreements that resulted in conversions of capital leases to operating leases. The lease amendments resulted in an early extinguishment of debt, on which the Company incurred interest expense of $142,000.
| 9. | FAIR VALUE MEASUREMENTS: |
The Company records its financial assets and liabilities at fair value, which is defined as the price that would be received to sell an asset or paid to transfer a liability, in the principal or most advantageous market for the asset or liability, in an orderly transaction between market participants at the measurement date. Effective January 1, 2009, the accounting for fair value measurements also applies to nonrecurring nonfinancial assets and nonfinancial liabilities. The adoption of this guidance did not have a material impact on the financial statements presented herein.
The authoritative guidance establishes a fair value hierarchy which prioritizes the inputs to valuation techniques used to measure fair value into three broad levels. These levels are: Level 1 (inputs are quoted prices in active markets for identical assets or liabilities); Level 2 (inputs are other than quoted prices that are observable, either directly or indirectly through corroboration with observable market data); and Level 3 (inputs are unobservable, with little or no market data that exists, such as internal financial forecasts). The Company is required to maximize the use of observable inputs and minimize the use of unobservable inputs when measuring fair value.
The following table summarizes information regarding the Company’s financial assets and financial liabilities that are measured at fair value (in thousands):
| Description |
Balance
at December 31, 2009 |
Level 1 | Level 2 | Level 3 | ||||||||||||
| Financial assets |
||||||||||||||||
| Escrow account |
$ | 5,591 | $ | 5,591 | $ | — | $ | — | ||||||||
| Financial liabilities |
||||||||||||||||
| Derivatives |
$ | (1,069 | ) | $ | — | $ | (1,069 | ) | $ | — | ||||||
| Balance
at December 31, 2008 |
Level 1 | Level 2 | Level 3 | |||||||||||||
| Financial assets |
||||||||||||||||
| Derivatives |
$ | 1,415 | $ | — | $ | 1,415 | $ | — | ||||||||
F-22
Table of Contents
The escrow account, consisting of a money market mutual fund, is valued using quoted market prices in active markets classified as Level 1 within the fair value hierarchy. The Company’s derivatives consist of foreign currency cash flow hedges and are valued using various pricing models or discounted cash flow analyses that incorporate observable market parameters, such as interest rate yield curves and currency rates, classified as Level 2 within the valuation hierarchy. Derivative valuations incorporate credit risk adjustments that are necessary to reflect the probability of default by the counterparty or the Company.
| 10. | DERIVATIVE FINANCIAL INSTRUMENTS AND HEDGING ACTIVITIES: |
The Company conducts business in various foreign countries and, from time to time, settles transactions in foreign currencies. The Company has established a program that utilizes foreign currency forward contracts to offset the risk associated with the effects of certain foreign currency exposures, typically arising from sales contracts denominated in Canadian currency. Prior to June 30, 2009, these derivative contracts were consistent with the Company’s strategy for financial risk management; however, they did not meet the conditions under the authoritative guidance to qualify for hedge accounting treatment. Beginning in the quarter ended September 30, 2009, the Company adopted cash flow hedge accounting treatment for qualifying derivative contracts entered into subsequent to June 30, 2009 under the authoritative guidance. Instruments that do not qualify for cash flow hedge accounting treatment are re-measured at fair value on each balance sheet date and resulting gains and losses are recognized in net income. As of December 31, 2009 and 2008, the total notional amount of the derivative contracts not designated as hedges was $5.4 million (CAD$5.7 million) and $17.0 million (CAD$20.8 million), respectively. As of December 31, 2009, the total notional amount of the derivative contracts designated as hedges was $16.2 million (CAD$17.0 million).
For each derivative contract entered into in which the Company seeks to obtain cash flow hedge accounting treatment, the Company formally documents all relationships between hedging instruments and hedged items, as well as its risk management objective and strategy for undertaking the hedge transaction, the nature of the risk being hedged, how the hedging instrument’s effectiveness in offsetting the hedged risk will be assessed prospectively and retrospectively, and a description of the method of measuring ineffectiveness. This process includes linking all derivatives to specific firm commitments or forecasted transactions and the derivatives are designated as cash flow hedges. The Company also formally assesses, both at the hedge’s inception and on an ongoing basis, whether the derivative contracts that are used in hedging transactions are highly effective in offsetting changes in cash flows of hedged items. The effective portion of these hedged items is reflected in other comprehensive income on the Consolidated Statement of Stockholders’ Equity and Comprehensive Income (Loss). If it is determined that a derivative contract is not highly effective, or that it has ceased to be a highly effective hedge, the Company will be required to discontinue hedge accounting with respect to that derivative contract prospectively.
Though most Canadian forward contracts have maturities not longer than 12 months at December 31, 2009, three of the Company’s contracts with a total notional value of $4.7 million (CAD$5.0 million) have maturities greater than 12 months, with the greatest maturity being 33 months.
The balance sheet location and the fair values of derivative instruments are:
| December 31, | ||||||||
| Foreign Currency Forward Contracts |
2009 | 2008 | ||||||
| (in thousands) | ||||||||
| Assets |
||||||||
| Derivatives not designated as hedging instruments Prepaid expenses and other |
$ | — | $ | 1,415 | ||||
| Liabilities |
||||||||
| Derivatives designated as hedging instruments Accrued liabilities |
$ | 217 | $ | — | ||||
| Derivatives not designated as hedging instruments Accrued liabilities |
852 | — | ||||||
| Total |
$ | 1,069 | $ | — | ||||
F-23
Table of Contents
The amounts of the gains and losses related to the Company’s derivative contracts designated as hedging instruments for the year ended December 31, 2009 are (in thousands):
| Derivative in Cash Flow Hedging Relationships |
Pretax Gain (Loss) Recognized in Other Comprehensive Income on Effective Portion of Derivative |
Pretax Gain (Loss) Recognized in Income on Effective Portion of Derivative as a Result of Reclassification from Accumulated Other Comprehensive Income |
Ineffective Portion of Gain (Loss) on Derivative and Amount Excluded from Effectiveness Testing |
|||||||||||||||||
| Amount | Location | Amount | Location | Amount | ||||||||||||||||
| Foreign currency forward contracts |
$ | (192 | ) | Net sales | $ | (28 | ) | Net sales | $ | (12 | ) | |||||||||
The following table reconciles the beginning and ending balances of the Company’s accumulated other comprehensive income (loss) related to gains or losses on derivative contracts, as well as amounts reclassified to earnings for the year ended December 31, 2009 (in thousands):
| Beginning balance |
$ | — | ||
| Effective portion of changes in hedging transactions |
(192 | ) | ||
| Gains/losses reclassified to earnings in net sales |
28 | |||
| Deferred taxes |
59 | |||
| Ending balance |
$ | (105 | ) | |
For the years ended December 31, 2009 and 2008, losses of $3.3 million and gains of $5.2 million, respectively, from derivative contracts not designated as hedging instruments were recognized in net sales.
| 11. | RETIREMENT PLANS: |
The Company has a defined contribution retirement plan that covers substantially all of its employees and provides for a Company match of up to 50% of the first 6% of employee contributions to the plan, subject to certain limitations. The defined contribution retirement plan offers fifteen investment options.
The Company has a non-qualified retirement savings plan that covers officers and selected highly compensated employees. The non-qualified plan generally matches up to 50% of the first $10,000 of employee contributions to the plan, subject to certain limitations. It also provides a Company funded component for the officers with a retirement target fund. The retirement target fund amount is an actuarially estimated amount necessary to provide 35% of final base pay after a 35-year career with the Company or 1% of final base pay per year of service. The actual benefit, however, assumes an investment growth at 8% per year. Should the investment growth be greater than 8%, the benefit will be more, but if it is less than 8%, the amount will be less and the Company does not make up any deficiency.
The Company also has two noncontributory defined benefit plans. Effective 2001, both plans were frozen, and participants were fully vested in their accrued benefits as of the date each plan was frozen. No additional participants can be added to the plans and no additional service can be earned by participants subsequent to the date the plans were frozen. The funding policy for each noncontributory defined benefit plan is based on current plan costs plus amortization of the unfunded plan liability. All current employees covered by these plans are now covered by the defined contribution retirement plan. As of December 31, 2009 the Company had recorded, in accordance with the actuarial valuation, an accrued pension liability of $1.5 million and an unrecognized actuarial loss, net of tax, of $2.5 million in accumulated other comprehensive loss. As of December 31, 2008, the Company had recorded an accrued pension liability of $1.8 million and an unrecognized actuarial loss, net of tax, of $2.9 million in accumulated other comprehensive loss. Additionally, as of December 31, 2009 and 2008, the accumulated benefit obligation was $5.3 million and $5.3 million, respectively, and the fair value of plan assets was $3.8 million and $3.6 million, respectively. The plan assets are invested in growth funds and are categorized as Level 2 under the fair value hierarchy.
F-24
Table of Contents
Total expense for all retirement plans in 2009, 2008 and 2007 was $1.5 million, $1.3 million and $1.0 million, respectively.
| 12. | SHARE-BASED COMPENSATION PLANS: |
The Company has one active stock incentive plan for employees and directors, the 2007 Stock Incentive Plan, which provides for awards of stock options to purchase shares of common stock, stock appreciation rights, restricted and unrestricted shares of common stock, restricted stock units and performance awards. In addition, the Company has two inactive stock option plans, the 1995 Stock Options Plan for Nonemployee Directors and the Amended 1995 Stock Incentive Plan, under which previously granted options remain outstanding. The plans provide that options become exercisable according to vesting schedules, which range from immediate to ratably over a 60-month period. Options terminate 10 years from the date of grant. The plans also provide for other equity instruments, such as restricted stock units (RSU’s) and performance stock awards (PSA’s), which grant the right to receive a specified number of shares over a specified period of time. RSU’s are service-based awards and generally vest equally over a three-year period. PSA’s are performance and service-based awards. PSA’s are awarded at the end of a three-year performance period, if certain performance objectives are met, and vest equally over a two-year period.
The following summarizes share-based compensation expense recorded for the years ended December 31:
| 2009 | 2008 | 2007 | ||||||||||
| (in thousands) | ||||||||||||
| Cost of sales |
$ | 124 | $ | 80 | $ | — | ||||||
| Selling, general and administrative expenses |
641 | 945 | 297 | |||||||||
| Total |
$ | 765 | $ | 1,025 | $ | 297 | ||||||
As of December 31, 2009, unrecognized compensation expense related to the unvested portion of the Company’s restricted stock units and performance awards was $500,000, which is expected to be recognized over a weighted average period of 1.8 years.
There were 779,639 shares of common stock reserved for issuance under the Company’s stock compensation plans at December 31, 2009, against which 213,103 options and 127,487 restricted stock units and performance awards have been granted and remain outstanding. There were 852,435 and 1,004,295 shares of common stock reserved for issuance under the Company’s stock compensation plans at December 31, 2008 and 2007, respectively.
F-25
Table of Contents
Stock Options Awards
A summary of status of the Company’s stock options as of December 31, 2009 and changes during the three years then ended is presented below:
| Options | Weighted Average Exercise Price |
Weighted Average Remaining Contractual Life |
Aggregate Intrinsic Value |
|||||||||||||
| (in years) | (in thousands) | |||||||||||||||
| Balance, January 1, 2007 |
573,702 | $ | 15.71 | |||||||||||||
| Options granted |
15,000 | 34.77 | ||||||||||||||
| Options exercised or exchanged |
(178,392 | ) | 16.28 | |||||||||||||
| Options cancelled |
(15 | ) | 17.90 | |||||||||||||
| Balance, December 31, 2007 |
410,295 | 16.16 | ||||||||||||||
| Options exercised or exchanged |
(147,824 | ) | 17.93 | |||||||||||||
| Balance, December 31, 2008 |
262,471 | 15.17 | ||||||||||||||
| Options exercised or exchanged |
(49,368 | ) | 14.75 | |||||||||||||
| Balance, December 31, 2009 |
213,103 | 15.26 | ||||||||||||||
| Exercisable, December 31, 2009 |
213,103 | 15.26 | 1.63 | $ | 2,525 | |||||||||||
The total intrinsic value, defined as the difference between the current market value and the grant price, of options exercised during the years ended December 31, 2009, 2008 and 2007 was $1.0 million, $3.5 million and $3.4 million, respectively.
The following table summarizes information about stock options outstanding at December 31, 2009:
| Options Outstanding |
Options Exercisable | |||||||||
| Range of Exercise Prices Per Share |
Number of Options |
Weighted Average Remaining Contractual Life (years) |
Weighted Average Exercise Price Per Share |
Number of Options |
Weighted Average Exercise Price Per Share | |||||
| $10.31 - $13.56 |
83,081 | 0.66 | $13.21 | 83,081 | $13.21 | |||||
| $13.57 - $14.00 |
85,127 | 1.51 | 14.00 | 85,127 | 14.00 | |||||
| $14.01 - $17.90 |
30,895 | 2.39 | 17.90 | 30,895 | 17.90 | |||||
| $17.91 - $34.77 |
14,000 | 6.52 | 29.30 | 14,000 | 29.30 | |||||
| 213,103 | 1.63 | 15.26 | 213,103 | 15.26 | ||||||
The following are the options exercisable at the corresponding weighted average exercise price at December 31, 2009, 2008, and 2007, respectively: 213,103 at $15.26, 262,471 at $15.17, and 410,295 at $16.16.
There were no options granted during 2009 or 2008. The weighted average grant date fair value of options granted during 2007 was $17.40. The fair value of options granted in 2007 is estimated as of the date of grant using the Black-Scholes option-pricing model with the assumptions noted in the following table. The risk-free interest rate is based on the U.S. Treasury yield curve corresponding to the expected life of the option in effect at the time of the grant. The expected life is based on the historical exercise pattern of similar groups of employees. Expected volatility is based on the historical volatility of the Company’s stock.
| Year Ended December 31, 2007 |
||||
| Risk-free interest rate |
4.87 | % | ||
| Expected dividend yield |
0 | % | ||
| Expected volatility |
42.62 | % | ||
| Expected lives (in years) |
6.41 | |||
F-26
Table of Contents
Restricted Stock Units and Performance Awards
A summary of status of the Company’s restricted stock units and performance awards as of December 31, 2009 and changes during the three years then ended is presented below:
| Number of Restricted Stock Units |
Weighted Average Grant Date Fair Value |
|||||||
| Unvested restricted stock units and performance awards at January 1, 2007 |
— | — | ||||||
| Restricted stock units and performance awards granted |
3,000 | $ | 38.45 | |||||
| Unvested restricted stock units and performance awards at December 31, 2007 |
3,000 | 38.45 | ||||||
| Restricted stock units and performance awards granted |
85,633 | 53.14 | ||||||
| Restricted stock units and performance awards cancelled |
(3,000 | ) | 38.45 | |||||
| Unvested restricted stock units and performance awards at December 31, 2008 |
85,633 | 53.14 | ||||||
| Restricted stock units and performance awards granted |
64,478 | 30.28 | ||||||
| Restricted stock units and performance awards cancelled |
(1,719 | ) | 46.78 | |||||
| Restricted stock units and performance awards vested |
(20,905 | ) | 53.14 | |||||
| Unvested restricted stock units and performance awards at December 31, 2009 |
127,487 | $ | 41.66 | |||||
Restricted stock units and performance awards are measured at the fair market value on the date of grant. The total fair value of restricted stock units and performance awards vested during the year ended December 31, 2009 was $1.1 million. No restricted stock units or performance awards vested during the years ended December 31, 2008 or 2007.
Stock Awards
For the years ended December 31, 2009 and 2008, 804 and 1,036 stock awards, respectively, were granted to non-employee directors, which vested immediately upon issuance. The Company recorded compensation expense based on the fair market value of the awards on the grant date of $33.58 in 2009 and $47.73 in 2008.
| 13. | SHAREHOLDER RIGHTS PLAN: |
In June 1999, the Board of Directors adopted a Shareholder Rights Plan (the “Plan”) designed to ensure fair and equal treatment for all shareholders in the event of a proposed acquisition of the Company by enhancing the ability of the Board of Directors to negotiate more effectively with a prospective acquirer, and reserved 150,000 shares of Series A Junior Participating Preferred Stock (“Preferred Stock”) for purposes of the Plan. In connection with the adoption of the Plan, the Board of Directors declared a dividend distribution of one non-detachable preferred stock purchase right (a “Right”) per share of common stock, payable to shareholders of record on July 9, 2000. Each Right represents the right to purchase one one-hundredth of a share of Preferred Stock at a price of $83.00, subject to adjustment. The Rights will be exercisable only if a person or group acquires, or commences a tender offer to acquire, 15% or more of the Company’s outstanding shares of common stock. Subject to the terms of the Plan and upon the occurrence of certain events, each Right would entitle the holder to purchase common stock of the Company, or of an acquiring company in certain circumstances, having a market value equal to two times the exercise price of the Right. The Company may redeem the Rights at a price of $0.01 per Right under certain circumstances.
F-27
Table of Contents
On June 18, 2009, the Company and Mellon Investor Services LLC (“Rights Agent”) entered into an Amended and Restated Rights Agreement (the “Amended and Restated Rights Agreement”). The Amended and Restated Rights Agreement amended and restated the Rights Agreement dated as of June 28, 1999 between the Company and ChaseMellon Shareholder Services, L.L.C. (predecessor to the Rights Agent). The Amended and Restated Rights Agreement extended the Final Expiration Date of the Rights from June 28, 2009 to June 28, 2019. The Amended and Restated Rights Agreement also reflected certain changes in the rights and obligations of the Rights Agent and certain changes in procedural requirements under the Amended and Restated Rights Agreement.
| 14. | COMMITMENTS AND CONTINGENCIES: |
Securities Litigation. On November 20, 2009, a complaint against us, captioned Richard v. Northwest Pipe Co. et al., No. C09-5724 RBL, was filed in the United States District Court for the Western District of Washington. The plaintiff is allegedly a purchaser of the Company’s stock. In addition to the Company, Brian W. Dunham, the Company’s former President and Chief Executive Officer, and Stephanie J. Welty, the Company’s Chief Financial Officer, are named as defendants. The complaint alleges that defendants violated Section 10(b) of the Securities Exchange Act of 1934 by making false or misleading statements between April 23, 2008 and November 11, 2009. Plaintiff seeks to represent a class of persons who purchased the Company’s stock during the same period, and seeks damages for losses caused by the alleged wrongdoing.
A similar complaint, captioned Plumbers and Pipefitters Local Union No. 630 Pension-Annuity Trust Fund v. Northwest Pipe Co. et al., No. C09-5791 RBL, was filed against the Company in the same court on December 22, 2009. In addition to the Company, Brian W. Dunham, Stephanie J. Welty and William R. Tagmyer, the Company’s current Chairman of the Board, are named as defendants in the Plumbers complaint. In the Plumbers complaint, as in the Richard complaint, the plaintiff is allegedly a purchaser of the Company’s stock and asserts that defendants violated Section 10(b) of the Securities Exchange Act of 1934 by making false or misleading statements between April 23, 2008 and November 11, 2009. Plaintiff seeks to represent a class of persons who purchased the Company’s stock during that period, and seeks damages for losses caused by the alleged wrongdoing.
The Richard action and the Plumbers action were consolidated on February 25, 2010. Plumbers and Pipefitters Local No. 630 Pension-Annuity Trust Fund was appointed lead plaintiff in the consolidated action. Defendants and lead plaintiff subsequently agreed that defendants do not need to respond to either of the two outstanding complaints, and that a consolidated amended complaint will be filed within 45 days of the Company having completed the filing of its Quarterly Report on Form 10-Q for the quarter ended September 30, 2009 (the “September 2009 Form 10-Q”) and its 2009 Form 10-K with the SEC. The parties also have stipulated to a briefing schedule for motions to dismiss to be filed after the filing of a consolidated amended complaint. The Company intends to vigorously defend itself against these claims. This securities litigation is at a very early stage and, at this time, it is not possible to predict its outcome. Therefore, the Company has not accrued any charges related to this litigation.
On March 3, 2010, the Company was served with a derivative complaint, captioned Ruggles v. Dunham et al., No. C10-5129 RBL, and filed in the United States District Court for the Western District of Washington. The plaintiff in this action is allegedly a current shareholder of the Company’s. The Company is a nominal defendant in this litigation. Plaintiff seeks to assert, on the Company’s behalf, claims against Brian W. Dunham, Stephanie J. Welty, William R. Tagmyer, Keith R. Larson, Wayne B. Kingsley, Richard A. Roman, Michael C. Franson and Neil R. Thornton. The asserted basis of the claims is that defendants breached fiduciary duties to the Company by causing the Company to make improper statements between April 23, 2008 and August 7, 2009. Plaintiff seeks to recover, on the Company’s behalf, damages for losses caused by the alleged wrongdoing.
The Company and the defendants have entered into an agreement with plaintiff in the Ruggles action. Pursuant to that agreement, neither the Company nor the defendants are required to respond to the current complaint. Plaintiffs may file an amended complaint within 60 days of the Company having completed the filing
F-28
Table of Contents
of its September 2009 Form 10-Q and its 2009 Form 10-K with the SEC. The parties have agreed on a briefing schedule for motions to dismiss to be filed after the filing of an amended complaint. It should also be noted that derivative claims by their nature do not seek to recover damages from us, but purport instead to seek to recover damages for the benefit of us. This litigation is at a very early stage and, at this time, it is not possible to predict its outcome. Therefore, the Company has not accrued any charges related to this litigation.
SEC Investigation. On March 8, 2010, the staff of the Enforcement Division of the SEC issued a formal order of investigation and a subpoena for the production of documents. The Company is cooperating with the SEC, but does not know when the inquiry and investigation will be resolved or what, if any, actions the SEC may require as part of that resolution. Any action by the SEC or other governmental agency could result in civil or criminal sanctions against the Company and/or certain of its current or former officers, directors and/or employees. The investigation is at a very early stage and, at this time, it is not possible to predict its outcome. Therefore, the Company has not accrued any charges related to this investigation.
Environmental Litigation. On December 1, 2000, a section of the lower Willamette River known as the Portland Harbor was included on the National Priorities List at the request of the U.S. Environmental Protection Agency (the “EPA”). While the Company’s Portland, Oregon manufacturing facility does not border the Willamette River, an outfall from the facility’s storm water system drains into a neighboring property’s privately owned slip. The Company and over 100 other parties have been notified by the EPA and the Oregon Department of Environmental Quality (the “ODEQ”) of potential liability under the Comprehensive Environmental Response, Compensation and Liability Act (“CERCLA”). As of September 2010, more than 280 potentially responsible parties on and nearby the river have been asked to file information disclosure reports with the EPA. By agreement with the EPA, the ODEQ is charged with ensuring that all upland sites have “source control” to prevent future contamination to the river. A remedial investigation and feasibility study of the Portland Harbor is currently being directed by a group of potentially responsible parties known as the Lower Willamette Group (the “LWG”). The Company made a payment of $175,000 to the LWG in June 2007 as part of an interim settlement, and is under no obligation to make any further payment. A draft remedial investigation report was submitted to the EPA by the LWG in the fall of 2009. The feasibility study is underway and is expected to be completed by the LWG in 2011.
In 2001, groundwater containing elevated organic compounds (“VOCs”) was identified in one localized area of the Company’s property furthest from the river. Assessment work in 2002 and 2003 to further characterize the groundwater is consistent with the initial conclusion that the source of the VOCs is located off of Company-owned property. On January 25, 2005, the Company entered into a Voluntary Agreement for Remedial Investigation and Source Control Measures (“Agreement”) with the ODEQ. The Company is one of 84 Upland Source Control Sites working with the ODEQ on Source Control and is ranked a “medium” priority. The Company performed Remedial Investigation work required under the Agreement and submitted a draft Remedial Investigation/Source Control Evaluation Report on December 30, 2005. The conclusions of the report indicate that the VOCs found in the groundwater do not present an unacceptable risk to human or ecological receptors in the Willamette River. The report also indicates there is no evidence at this time showing a connection between detected VOCs in groundwater and Willamette River sediments.
Also, based on the remedial investigation and reporting required under the Portland, Oregon manufacturing facility’s National Pollutant Discharge Elimination System permit for storm water, the Company and the ODEQ have identified a possible source of small amounts of polynuclear aromatic compounds and polychlorinated biphenyls and have periodically identified trace amounts of zinc in storm water. Storm water from the Portland, Oregon manufacturing facility site is discharged to a neighboring property’s privately owned slip, as is storm water from surrounding industrial properties. The slip was historically used for shipbuilding and subsequently for ship breaking and metal recycling. Studies of the river sediments have revealed concentration of polynuclear aromatic compounds, polychlorinated biphenyls and zinc, which are common constituents in urban storm water discharges. To minimize the zinc traces in its storm water, the Company painted a substantial part of the Portland facility’s roofs in 2009 at a cost of $364,000. In addition, paving improvements were made at the Portland
F-29
Table of Contents
facility at a cost of $215,000. Total spending on environmental capital projects at the Portland facility was $603,000 in 2009. Based on National Pollutant Discharge Elimination System storm water sampling, the painting seems to have reduced the zinc in the storm water runoff. In June 2009, under the ODEQ Agreement, the Company submitted a Final Supplemental Work Plan to evaluate and assess soil and storm water, and further assess groundwater risk. The Company is working with the City of Portland and the ODEQ to facilitate further soil and storm water source control measures.
Concurrent with the activities of the EPA and the ODEQ, the Portland Harbor Natural Resources Trustee Council (“Trustees”) sent some or all of the same parties, including the Company, a notice of intent to perform a Natural Resource Damage Assessment (“NRDA”) for the Portland Harbor Site to determine the nature and extent of natural resource damages under CERCLA section 107. The Trustees for the Portland Harbor Site consist of representatives from several Northwest Indian Tribes, three federal agencies and one state agency. The Trustees act independently of the EPA and the ODEQ but the Company expects their assessment will be coordinated with the remedial investigation and feasibility study work underway at the Portland Harbor Site. In 2009 the Trustees completed phase one of their three-phase NRDA. Phase one of the NRDA consisted of environmental studies to fill gaps in the information available from the EPA, and development of a framework for evaluating, quantifying and determining the extent of injuries to the natural resource and the resulting damages. Phase two of the NRDA began in 2010 and consists largely of implementing the framework developed in phase one.
The Trustees have encouraged potentially responsible parties to voluntarily participate in the funding of their injury assessments. In 2009, one of the Tribal Trustees (the Yakima Nation) resigned and has requested funding from the same parties to support its own assessment. The Company has not assumed any payment obligation or liability related to either request. The extent of the Company’s obligation with respect to Portland Harbor matters is not known, and no further adjustment to the consolidated financial statements has been recorded as of December 31, 2009.
The Company operates under numerous governmental permits and licenses relating to air emissions, storm-water run-off and other environmental matters. In September and October of 2009 the Company received several notices of violation and notices to comply from the Mohave Desert Air Quality Management District (“District”) for violations of permitted particulate matter emissions limits and other violations at its Adelanto, California facility. The Company is negotiating with the District to settle these matters, and believes that resolution of these matters will not result in material adverse effects on the business, financial condition, results of operations or cash flows.
From time to time, the Company is involved in litigation relating to claims arising out of its operations in the normal course of its business. The Company maintains insurance coverage against potential claims in amounts that are believed to be adequate. The Company believes that it is not presently a party to any other litigation, the outcome of which would have a material adverse effect on its business, financial condition, results of operations or cash flows.
Guarantees
The Company has entered into certain stand-by letters of credit that total $6.6 million. The stand-by letters of credit relate to customer-owned raw materials and workers’ compensation insurance. See Note 17, “Subsequent Events” for additional information regarding guarantees.
F-30
Table of Contents
| 15. | INCOME TAXES: |
The components of the provision for income taxes are as follows:
| Year Ended December 31, | ||||||||||||
| 2009 | 2008 | 2007 | ||||||||||
| (in thousands) | ||||||||||||
| Current: |
||||||||||||
| Federal |
$ | (3,343 | ) | $ | 13,510 | $ | 7,658 | |||||
| State |
209 | 1,905 | 1,238 | |||||||||
| Deferred: |
||||||||||||
| Federal |
421 | 3,254 | (2,464 | ) | ||||||||
| State |
(817 | ) | 512 | (82 | ) | |||||||
| $ | (3,530 | ) | $ | 19,181 | $ | 6,350 | ||||||
The difference between the effective income tax rate and the statutory U.S. federal income tax rate is explained as follows:
| Year Ended December 31, | ||||||||||||
| 2009 | 2008 | 2007 | ||||||||||
| (in thousands) | ||||||||||||
| Provision at statutory rate |
$ | (3,783 | ) | $ | 17,682 | $ | 6,394 | |||||
| State provision, net of federal benefit |
(325 | ) | 1,578 | 581 | ||||||||
| Research and development credits |
— | (100 | ) | (170 | ) | |||||||
| Domestic manufacturing deduction |
— | (735 | ) | (455 | ) | |||||||
| Other |
578 | 756 | — | |||||||||
| $ | (3,530 | ) | $ | 19,181 | $ | 6,350 | ||||||
F-31
Table of Contents
The tax effect of temporary differences that give rise to significant portions of deferred tax assets and liabilities is presented below:
| December 31, | ||||||||
| 2009 | 2008 | |||||||
| (in thousands) | ||||||||
| Current deferred tax assets: |
||||||||
| Costs and estimated earnings in excess of billings on uncompleted contracts, net |
$ | 21,643 | $ | 20,118 | ||||
| Accrued employee benefits |
2,566 | 2,438 | ||||||
| Trade receivable, net |
536 | 526 | ||||||
| Net operating loss carryforwards |
244 | 122 | ||||||
| Other |
370 | 1,189 | ||||||
| 25,359 | 24,393 | |||||||
| Valuation allowance |
(244 | ) | — | |||||
| 25,115 | 24,393 | |||||||
| Current deferred tax liabilities: |
||||||||
| Inventories |
(5,275 | ) | (5,856 | ) | ||||
| Prepaid expenses |
(553 | ) | (539 | ) | ||||
| Current deferred tax assets, net |
19,287 | 17,998 | ||||||
| Noncurrent deferred tax assets: |
||||||||
| Net operating loss carryforwards |
559 | 462 | ||||||
| Accrued employee benefits |
1,301 | 1,548 | ||||||
| Other |
1,022 | (263 | ) | |||||
| 2,882 | 1,747 | |||||||
| Valuation allowance |
(226 | ) | (290 | ) | ||||
| 2,656 | 1,457 | |||||||
| Noncurrent deferred tax liabilities |
||||||||
| Property and equipment |
(30,343 | ) | (28,040 | ) | ||||
| Noncurrent deferred tax liabilities, net |
(27,687 | ) | (26,583 | ) | ||||
| Net deferred tax liabilities |
$ | (8,400 | ) | $ | (8,585 | ) | ||
As of December 31, 2009, the Company had approximately $696,000 of federal net operating loss carryforwards and $6.3 million of state net operating loss carryforwards as a result of the acquisition of Thompson Pipe and Steel, which are limited in their use to approximately $348,000 per year during the 15 year carryforward period which expires in 2010. In addition, the Company had approximately $7.4 million of state net operating loss carryforwards which expire on various dates between 2018 and 2029.
During the year ended December 31, 2009, the Company recorded an increase in the valuation allowance of $244,000 related to federal net operating loss carryforwards, as it was considered more likely than not the federal net operating loss carryforwards will not be realized. The Company also recorded a decrease in the valuation allowance of $64,000 related to the state net operating loss carryforwards, as it was considered more likely than not the additional benefits would be realized. The valuation allowance was adjusted based upon current and anticipated future taxable income, state tax rates, and state apportionment.
U.S. income taxes have not been provided on the undistributed earnings of the Company’s Mexican subsidiary. It is not practicable to estimate the amount of tax that might be payable. The Company’s intention is to reinvest these earnings permanently or to repatriate the earnings only when it is tax effective to do so.
F-32
Table of Contents
A summary of the changes in the unrecognized tax benefits during the years ended December 31, 2009, 2008 and 2007 is presented below (in thousands):
| 2009 | 2008 | 2007 | ||||||||||
| Unrecognized tax benefits, beginning of year |
$ | 1,272 | $ | 861 | $ | 717 | ||||||
| Decreases for settlements |
(1,072 | ) | — | — | ||||||||
| Decreases for lapse of statue of limitations |
(25 | ) | — | — | ||||||||
| Decreases for positions taken in the current year |
— | — | (9 | ) | ||||||||
| Increases for positions taken in prior years |
— | 426 | 190 | |||||||||
| Decreases for positions taken in prior years |
— | (45 | ) | (112 | ) | |||||||
| Increases for positions taken in the current year |
10 | 30 | 75 | |||||||||
| Unrecognized tax benefits, end of year |
$ | 185 | $ | 1,272 | $ | 861 | ||||||
All of the balance of unrecognized tax benefits at December 31, 2008 and 2009 would affect the Company’s effective tax rate if recognized.
The Company files income tax returns in the United States Federal jurisdiction, in a limited number of foreign jurisdictions, and in many state jurisdictions. With few exceptions, the Company is no longer subject to U.S. Federal or state income tax examinations for years before 2004. The Company does not believe it is reasonably possible the total amounts of unrecognized tax benefits will change significantly prior to December 31, 2010; however, actual results could differ from those currently expected.
The Company recognizes interest and penalties related to uncertain tax positions in income tax expense. As of December 31, 2009 and 2008, the Company has approximately $60,000 and $145,000, respectively, of accrued interest related to uncertain tax positions. Total interest for uncertain tax positions decreased by approximately $85,000 in 2009 and increased by approximately $50,000 and $64,000 in 2008 and 2007, respectively.
| 16. | SEGMENT INFORMATION: |
The operating segments reported below are based on the nature of the products sold by the Company and are the segments of the Company for which separate financial information is available and for which operating results are regularly evaluated by executive management to make decisions about resources to be allocated to the segment and assess its performance. Management evaluates segment performance based on segment gross profit.
Historically, the Company disclosed three segments, but based on changes in organizational structure and strategic direction in 2008, the resulting reporting of segments changed. The Company has conformed 2007 segment information to be consistent with the current reporting and operating structure in place.
The Company’s Water Transmission segment manufactures and markets large diameter, high-pressure steel pipe used primarily for water transmission. The Company’s Water Transmission products are manufactured at one of seven manufacturing facilities located in Portland, Oregon; Denver, Colorado; Adelanto, California; Pleasant Grove, Utah; Parkersburg, West Virginia; Saginaw, Texas; and Monterrey, Mexico. Products are sold primarily to public water agencies either directly or through an installation contractor.
The Company’s Tubular Products segment manufactures and markets smaller diameter, ERW steel pipe for use in a wide range of applications, including construction, agricultural, industrial, energy and traffic signpost systems. Tubular Products manufacturing facilities are located in Atchison, Kansas; Houston, Texas; and Bossier City, Louisiana. Tubular Products are marketed through a network of direct sales force personnel and independent distributors throughout the United States, Canada and Mexico.
F-33
Table of Contents
Based on the location of the customer, the Company sold principally all products in the United States, Canada and Mexico. No one customer represented more than 10% of total sales in 2009, 2008 or 2007. As of December 31, 2009, all material long-lived assets are located in the United States.
| Year Ended December 31, | ||||||||||||
| 2009 | 2008 | 2007 | ||||||||||
| (in thousands) | ||||||||||||
| Net sales: |
||||||||||||
| Water transmission |
$ | 210,396 | $ | 283,614 | $ | 269,295 | ||||||
| Tubular products |
68,258 | 167,805 | 95,019 | |||||||||
| Total |
$ | 278,654 | $ | 451,419 | $ | 364,314 | ||||||
| Gross profit (loss): |
||||||||||||
| Water transmission |
$ | 16,109 | $ | 47,255 | $ | 40,541 | ||||||
| Tubular products |
(4,423 | ) | 37,332 | 7,912 | ||||||||
| Total |
$ | 11,686 | $ | 84,587 | $ | 48,453 | ||||||
| Depreciation and amortization of property and equipment: |
||||||||||||
| Water transmission |
$ | 4,272 | $ | 4,087 | $ | 3,959 | ||||||
| Tubular products |
1,824 | 2,041 | 1,729 | |||||||||
| Total |
6,096 | 6,128 | 5,688 | |||||||||
| Corporate |
912 | 1,048 | 1,090 | |||||||||
| Total |
$ | 7,008 | $ | 7,176 | $ | 6,778 | ||||||
| Capital expenditures: |
||||||||||||
| Water transmission |
$ | 6,661 | $ | 14,913 | $ | 18,655 | ||||||
| Tubular products |
15,956 | 6,167 | 3,371 | |||||||||
| Total |
22,617 | 21,080 | 22,026 | |||||||||
| Corporate |
75 | 892 | 899 | |||||||||
| Total |
$ | 22,692 | $ | 21,972 | $ | 22,925 | ||||||
| Net sales by geographic region: |
||||||||||||
| United States |
$ | 237,680 | $ | 410,065 | $ | 316,679 | ||||||
| Other |
40,974 | 41,354 | 47,635 | |||||||||
| Total |
$ | 278,654 | $ | 451,419 | $ | 364,314 | ||||||
| December 31, | ||||||||
| 2009 | 2008 | |||||||
| (in thousands) | ||||||||
| Goodwill: |
||||||||
| Water transmission |
$ | — | $ | — | ||||
| Tubular products |
21,451 | 21,451 | ||||||
| Total |
$ | 21,451 | $ | 21,451 | ||||
| Total Assets: |
||||||||
| Water transmission |
$ | 218,418 | $ | 283,122 | ||||
| Tubular products |
127,348 | 146,182 | ||||||
| Total |
345,766 | 429,304 | ||||||
| Corporate |
45,471 | 40,976 | ||||||
| Total |
$ | 391,237 | $ | 470,280 | ||||
F-34
Table of Contents
All property and equipment is located in the United States, except for $2.6 million and $2.7 million as of December 31, 2009 and 2008, respectively, which is located in other geographic regions.
| 17. | SUBSEQUENT EVENTS: |
Line of Credit Agreement, Long-Term Debt Agreement and Leases
Subsequent to December 31, 2009, the Company entered into amendments to the Company’s Amended and Restated Credit Agreement and Amended and Restated Note Purchase and Private Shelf Agreements. A summary of the amendments is as follows:
| • | Limited the availability under the Amended and Restated Credit Agreement to $110.0 million until the Company delivers to the lenders its financial statements and Compliance Certificate for the period ended September 30, 2010, after which the availability will be limited to $117.5 million. Upon delivery of the March 31, 2011 Compliance Certificate, availability will increase to $125 million; |
| • | Set the interest rates charged on outstanding balances under the line of credit at rates related to LIBOR plus 2.50% to 4.50%, or the lending institution’s prime rate, plus 1.50% to 3.50%; |
| • | Increased the interest rates charged on outstanding balances of the long-term debt agreements by 2.00% until the Company delivers its financial statements, related Officer’s Certificate for the most recent fiscal period and the Company’s Consolidated Total Leverage Ratio is less than 4.50:1.00. At such time the rate will decrease by 0.25%; |
| • | Waived compliance with certain covenants in the Agreements for the year ended December 31, 2009 and the quarters ended March 31 and June 30, 2010, and made certain changes in the definition, method of calculation and amounts of certain covenants; |
| • | Extended the dates by which the Company is required to deliver to the lenders audited financial statements prepared in accordance with generally accepted accounting principles for the year ended December 31, 2009, and unaudited condensed consolidated financial statements for the quarter ended March 31, 2010 and the quarter ended June 30, 2010; |
| • | Designated the delisting of the Company’s common stock from trading on the Nasdaq Stock Market as an event of default; and |
| • | Required the Company to deliver to the lenders certain cash flow forecasts and a revised financial projection model and business plan. |
Guarantees
As a result of the Company’s delayed SEC filings and its previous inability to provide to its suppliers audited financial statements as of December 31, 2009, certain suppliers requested the Company to post standby letters of credit totaling $10.0 million as of September 30, 2010 to cover its purchase amounts.
F-35
Table of Contents
| 18. | QUARTERLY DATA (UNAUDITED): |
Summarized quarterly financial data for 2009 and 2008 (as restated) is as follows (dollars in thousands, except per share):
| First Quarter |
Second Quarter |
Third Quarter |
Fourth Quarter |
Total | ||||||||||||||||
| For the year ended December 31, 2009 |
||||||||||||||||||||
| Net sales: |
||||||||||||||||||||
| Water transmission |
$ | 61,682 | $ | 52,587 | $ | 46,997 | $ | 49,130 | $ | 210,396 | ||||||||||
| Tubular products |
22,548 | 15,592 | 14,380 | 15,738 | 68,258 | |||||||||||||||
| Total |
$ | 84,230 | $ | 68,179 | $ | 61,377 | $ | 64,868 | $ | 278,654 | ||||||||||
| Gross profit (loss): |
||||||||||||||||||||
| Water transmission |
$ | 7,420 | $ | 5,359 | $ | 422 | $ | 2,908 | $ | 16,109 | ||||||||||
| Tubular products |
1,003 | (2,951 | ) | (2,690 | ) | 215 | (4,423 | ) | ||||||||||||
| Total |
$ | 8,423 | $ | 2,408 | $ | (2,268 | ) | $ | 3,123 | $ | 11,686 | |||||||||
| Net income (loss) |
$ | 1,387 | $ | (1,259 | ) | $ | (5,494 | ) | $ | (1,911 | ) | $ | (7,277 | ) | ||||||
| Earnings per share: |
||||||||||||||||||||
| Basic |
$ | 0.15 | $ | (0.14 | ) | $ | (0.59 | ) | $ | (0.21 | ) | $ | (0.79 | ) | ||||||
| Diluted |
$ | 0.15 | $ | (0.14 | ) | $ | (0.59 | ) | $ | (0.21 | ) | $ | (0.79 | ) | ||||||
| First Quarter |
Second Quarter |
Third Quarter |
Fourth Quarter |
Total | ||||||||||||||||
| For the year ended December 31, 2008 |
||||||||||||||||||||
| Net sales: |
||||||||||||||||||||
| Water transmission |
$ | 62,338 | $ | 72,226 | $ | 81,634 | $ | 67,416 | $ | 283,614 | ||||||||||
| Tubular products |
30,134 | 37,244 | 45,914 | 54,513 | 167,805 | |||||||||||||||
| Total |
$ | 92,472 | $ | 109,470 | $ | 127,548 | $ | 121,929 | $ | 451,419 | ||||||||||
| Gross profit: |
||||||||||||||||||||
| Water transmission |
$ | 8,834 | $ | 11,954 | $ | 14,610 | $ | 11,857 | $ | 47,255 | ||||||||||
| Tubular products |
3,158 | 8,968 | 11,180 | 14,026 | 37,332 | |||||||||||||||
| Total |
$ | 11,992 | $ | 20,922 | $ | 25,790 | $ | 25,883 | $ | 84,587 | ||||||||||
| Net income |
$ | 2,642 | $ | 7,481 | $ | 10,730 | $ | 10,485 | $ | 31,338 | ||||||||||
| Earnings per share: |
||||||||||||||||||||
| Basic |
$ | 0.29 | $ | 0.82 | $ | 1.17 | $ | 1.14 | $ | 3.43 | ||||||||||
| Diluted |
$ | 0.28 | $ | 0.80 | $ | 1.15 | $ | 1.12 | $ | 3.35 | ||||||||||
F-36
Table of Contents
The following table presents the impact of the restatement adjustments on the Company’s previously reported quarterly data for the first and second quarter of 2009 and the first, second, third and fourth quarter of 2008 (as restated) (in thousands, except per share data):
| Net Sales | Gross Profit | Net (Loss) Income |
Basic Earnings (Loss) Per Share |
Diluted Earnings (Loss) Per Share |
||||||||||||||||||||||||
| Water Transmission |
Tubular Products |
Water Transmission |
Tubular Products |
|||||||||||||||||||||||||
| Second Quarter 2009 |
||||||||||||||||||||||||||||
| As previously reported |
$ | 59,303 | $ | 15,592 | $ | 12,835 | $ | (2,557 | ) | $ | 2,423 | $ | 0.26 | $ | 0.26 | |||||||||||||
| Restatement adjustments |
(6,716 | ) | — | (7,476 | ) | (394 | ) | (3,682 | ) | (0.40 | ) | (0.40 | ) | |||||||||||||||
| As restated |
$ | 52,587 | $ | 15,592 | $ | 5,359 | $ | (2,951 | ) | $ | (1,259 | ) | $ | (0.14 | ) | $ | (0.14 | ) | ||||||||||
| First Quarter 2009 |
||||||||||||||||||||||||||||
| As previously reported |
$ | 58,855 | $ | 22,548 | $ | 11,292 | $ | 1,445 | $ | 2,630 | $ | 0.29 | $ | 0.28 | ||||||||||||||
| Restatement adjustments |
2,827 | — | (3,872 | ) | (442 | ) | (1,243 | ) | (0.14 | ) | (0.13 | ) | ||||||||||||||||
| As restated |
$ | 61,682 | $ | 22,548 | $ | 7,420 | $ | 1,003 | $ | 1,387 | $ | 0.15 | $ | 0.15 | ||||||||||||||
| Fourth Quarter 2008 |
||||||||||||||||||||||||||||
| As previously reported |
$ | 55,688 | $ | 54,513 | $ | 10,981 | $ | 13,463 | $ | 8,628 | $ | 0.94 | $ | 0.92 | ||||||||||||||
| Restatement adjustments |
11,728 | — | 876 | 563 | 1,857 | 0.20 | 0.20 | |||||||||||||||||||||
| As restated, unaudited |
$ | 67,416 | $ | 54,513 | $ | 11,857 | $ | 14,026 | $ | 10,485 | $ | 1.14 | $ | 1.12 | ||||||||||||||
| Third Quarter 2008 |
||||||||||||||||||||||||||||
| As previously reported |
$ | 77,512 | $ | 45,913 | $ | 14,261 | $ | 12,550 | $ | 10,227 | $ | 1.12 | $ | 1.09 | ||||||||||||||
| Restatement adjustments |
4,122 | 1 | 349 | (1,370 | ) | 503 | 0.05 | 0.06 | ||||||||||||||||||||
| As restated, unaudited |
$ | 81,634 | $ | 45,914 | $ | 14,610 | $ | 11,180 | $ | 10,730 | $ | 1.17 | $ | 1.15 | ||||||||||||||
| Second Quarter 2008 |
||||||||||||||||||||||||||||
| As previously reported |
$ | 74,861 | $ | 37,245 | $ | 14,778 | $ | 9,840 | $ | 8,399 | $ | 0.92 | $ | 0.90 | ||||||||||||||
| Restatement adjustments |
(2,635 | ) | (1 | ) | (2,824 | ) | (872 | ) | (918 | ) | (0.10 | ) | (0.10 | ) | ||||||||||||||
| As restated |
$ | 72,226 | $ | 37,244 | $ | 11,954 | $ | 8,968 | $ | 7,481 | $ | 0.82 | $ | 0.80 | ||||||||||||||
| First Quarter 2008 |
||||||||||||||||||||||||||||
| As previously reported |
$ | 63,869 | $ | 30,134 | $ | 14,453 | $ | 3,332 | $ | 5,047 | $ | 0.56 | $ | 0.54 | ||||||||||||||
| Restatement adjustments |
(1,531 | ) | — | (5,619 | ) | (174 | ) | (2,405 | ) | (0.27 | ) | (0.26 | ) | |||||||||||||||
| As restated |
$ | 62,338 | $ | 30,134 | $ | 8,834 | $ | 3,158 | $ | 2,642 | $ | 0.29 | $ | 0.28 | ||||||||||||||
F-37
Table of Contents
Schedule II
VALUATION AND QUALIFYING ACCOUNTS
(Dollars in thousands)
| Balance at Beginning of Period |
Charged to Profit and Loss |
Deduction from Reserves |
Restatement Adjustments |
Balance at End of Period |
||||||||||||||||
| Year ended December 31, 2009: |
||||||||||||||||||||
| Allowance for doubtful accounts |
$ | 701 | $ | 960 | $ | (868 | ) | $ | — | $ | 793 | |||||||||
| Valuation allowance for deferred tax assets |
290 | 244 | (64 | ) | — | 470 | ||||||||||||||
| Year ended December 31, 2008: |
||||||||||||||||||||
| Allowance for doubtful accounts |
$ | 1,129 | $ | 1,818 | $ | (1,733 | ) | $ | (513 | ) | $ | 701 | ||||||||
| Valuation allowance for deferred tax assets |
338 | — | (48 | ) | — | 290 | ||||||||||||||
| Year ended December 31, 2007: |
||||||||||||||||||||
| Allowance for doubtful accounts |
$ | 823 | $ | 2,633 | $ | (2,327 | ) | $ | — | $ | 1,129 | |||||||||
| Valuation allowance for deferred tax assets |
338 | — | — | — | 338 | |||||||||||||||
S-1
Table of Contents
SIGNATURES
Pursuant to the requirements of Section 13 or 15(d) of the Securities Exchange Act of 1934, the Registrant has duly caused this report to be signed on its behalf by the undersigned, thereunto duly authorized, on the 4th day of November 2010.
| NORTHWEST PIPE COMPANY | ||
| By | /s/ RICHARD A. ROMAN | |
| Richard A. Roman | ||
| President and Chief Executive Officer | ||
Pursuant to the requirements of the Securities Exchange Act of 1934, this report has been signed below by the following persons on behalf of the Registrant in the capacities indicated, on the 4th day of November 2010.
| Signature |
Title | |
| /s/ WILLIAM R. TAGMYER William R. Tagmyer |
Director and Chairman of the Board | |
| /s/ RICHARD A. ROMAN Richard A. Roman |
Director, President and Chief Executive Officer | |
| /s/ STEPHANIE J. WELTY Stephanie J. Welty |
Senior Vice President and Chief Financial Officer (Principal Financial Officer) | |
| /s/ JAMES E. DECLUSIN James E. Declusin |
Director | |
| /s/ MICHAEL C. FRANSON Michael C. Franson |
Director | |
| /s/ WAYNE B. KINGSLEY Wayne B. Kingsley |
Director | |
| /s/ KEITH R. LARSON Keith R. Larson |
Director | |